Nancy S. Eickelmann, PhD Motorola Labs 1303 E. Algonquin Rd. Annex-2 Schaumburg, IL 60196 Phone:...
34
Nancy S. Eickelmann, PhD Motorola Labs 1303 E. Algonquin Rd. Annex-2 Schaumburg, IL 60196 Phone: (847) 310-0785 Fax: (847) 576-3280 Nancy. Eickelmann @ motorola .com
-
Upload
sharleen-jackson -
Category
Documents
-
view
219 -
download
0
Transcript of Nancy S. Eickelmann, PhD Motorola Labs 1303 E. Algonquin Rd. Annex-2 Schaumburg, IL 60196 Phone:...

Nancy S. Eickelmann, PhDMotorola Labs1303 E. Algonquin Rd.Annex-2Schaumburg, IL 60196Phone: (847) 310-0785Fax: (847) [email protected]

2
FY2001 CENTER SOFTWARE INITIATIVE PROPOSAL (CSIP)for the
NASA Independent Verification and Validation Facility COTR: Ken McGill
PI: Nancy EickelmannS-54493-G
September 5, 2001
Developing Risk-Based Financial Analysis Tools and Techniques to Aid IV&V Decision-
Making

3
PROBLEM STATEMENTPROBLEM STATEMENT
• This research addresses NASA’s need to evaluate the ROI and
cost/benefit of applying IV&V technologies. • A prototype is to be developed that will provide financial
valuation of IV&V for a given program. • The prototype will be developed using an iterative process that
will incrementally implement the models and methodology researched and developed during prior years of this effort.
• The tool will be evaluated for usability, accuracy, and consistency through limited use scenarios with NASA program managers.

4
Return on Investment - StatusReturn on Investment - Status
• This project was funded July 20, 2001• Evaluation of data sets is in progress• Benchmarking for key factor target value ranges in
progress• Model integration and interface to existing
programs in progress, Ask Pete, ARRT

5
RESEARCH APPROACHRESEARCH APPROACH
Phase 1:• Reduce the models we developed earlier to actionable
guidelines for practice
Phase 2:• Introduce these models, processes and support tools to a small
group of carefully selected pilot projects• Evaluate the results of applying the tools and methods
Phase 3:• Use the feedback from step 3 to adapt the tools and methods
for widespread dissemination, if warranted within the software project decision-making community at NASA.

6
HYPOTHESES/OBJECTIVEHYPOTHESES/OBJECTIVE • The IV&V valuation methodology will be iteratively refined based on
feedback from NASA program managers and statistical evaluation of the methodology and results.
• Specific factors to be evaluated:
Hypothesis 1: The cost relative to the potential benefits of IV&V is inversely proportional to key organizational factors, such as the capability maturity of the development organization.
Hypothesis 2: The realization of potential IV&V benefits is directly related to the development organizations’ acceptance of IV&V.
Hypothesis 3: The cost/benefit ratio for IV&V is directly related to the criticality of the application (and its individual subsystems).

7
IV&V YIELDIV&V YIELD
• Ultimately, the yield of an IV&V program is based upon the difference between the net resource flow with IV&V and without IV&V.
• If the resources saved (e.g., reduced rework) or returns gained (e.g., improved customer satisfaction or increased safety) are greater than the resources consumed to save/gain these resources, we have a net benefit.
• Should the resources saved be less than the resources consumed, we have a net cost.

8
IV&V YieldIV&V Yield
• Cost of Quality– Key components…
• Cost of Poor Quality– Key components…

9
What we already know…3 issues of empirical studies...
June 5-6, 1986 the 1st Workshop on Empirical Studies of Programmers, Washington, D.C.
• Need scientific rigor…“A Plan for Empirical Studies” Victor Basili
• Need to look at real world variable values…“By the Way, Did Anyone Study Real Programmers” Bill Curtis
• Need to study PITL…“Meeting the Challenge of Programming in the Large (PITL)” Elliot Soloway

10
Why is it Difficult to Apply Quantitative Management
Principles for Software Engineering?
• SE domain has a large number of key variables that have different degrees of significance depending on the environment
• SE domain has key variables that have extreme variance within the same environment (i.e., programmer productivity 10:1)
• SE domain variables in combination may create a “critical mass” not present when variables are studied in isolation
1986 IEEE TSE, Basili, Selby and Hutchins, Surveyed software engineering empirical studies published to date. Cited 116 published studies.

11
Software Requirements Analysis
Software Interface Analysis
Software Code Analysis
Developer Test Analysis
Software Design Analysis
Iterative IV&V MethodologyIterative IV&V Methodology
IV&V Planning- Activities - Organization - CARA- Schedules - Tools - WBS
Inputs Activities Outputs
SoftwareIV&V Plan
Critical/High RiskFunctions List
IV&V Technical Reports
Software ProblemReports
IV&V Traceability
Matrix
Findings and Recommendations
IV&V Metrics
MonthlyProgress/Status
Reports
Iter
ativ
e P
er S
oftw
are
Rel
ease
Source Code
SoftwareDevelopment Folders
Software Test Plans & Procedures
Problem Reports
RequirementsRepositories
ProgramMilestonesand Schedules
Phase Dependent IV&V Tasks Phase Independent IV&V Tasks
DeveloperDocumentation
Software IV&V SOW
- Objectives- Requirements
TR
AC
EA
BIL
ITY
AN
AL
YSIS
CH
AN
GE
IMP
AC
T A
NA
LY
SIS
DE
LIV
ER
AB
LE
S VA
LID
AT
ION
TE
CH
NIC
AL
RE
VIE
WS A
ND
AU
DIT
SSP
EC
IAL
STU
DIE
S

12
IV&V Technologies - COQIV&V Technologies - COQ
Algorithm analysis Analytic modeling Back-to-back testingBoundary value
analysisCode reading Control flow analysis
Coverage analysis Critical time analysis Database analysisDataflow analysis Desk checking Error seeding
Event tree analysis Functional testing InspectionsInterface analysis Mutation testing Performance testing
Proof ofcorrectness
Prototyping Regression testing
Requirementsanalysis
Requirementstraceability
Reviews
Sensitivity analysis Simulation Size analysisSlicing Software failure mode
anal.Stress testing
Structural testing Symbolic execution Test certificationWalkthroughs

13
Empirical Research SummaryEmpirical Research Summary
• Experimental Simulation Qualitative and quantitative results based on non-deterministic or hybrid simulation model
• Math Modeling quantitative results based on a deterministic model
• Mirrors a segment of the real world, control of variables is high, supports testing of causal hypothesis, results can be replicated, high internal validity and generalizability
• Captures real world context in which to isolate and control variables
• Researcher bias can be introduced through selection of variables, parameters and assumptions concerning the model. Modeling requires high degree of analytical skill, and interdisciplinary knowledge
• Results are not typically generalizable to other populations or environmental contexts, researcher bias is common,

14
Process Modeling and SimulationProcess Modeling and Simulation
Process Characterization
Syste mR equi rements
Syste m
Archit ectureR equi rements
Syste mDetai led
Design
B oxR qmts
B ox
Design
Syste mFunc tional
R equireme nts
B ox(auto)Coding
B oxUnit Tes t
B oxSyste m
Te st
Syste mEa rly SDL
Integrat iont esting
Syste mEa rly
Int egrat ion
t esting
Syste m
Integrat ionTe st
Syste m
Syste mTe st
SubsystemIntegrat ion
Te st
SubsystemSyste m Te st
(host /t arge t)
B ox
Int egrat ionTe st
Syste mB eta
Te st
T extT ext
T extT ext
eMSCeMSC
SL + SDLSL + SDL
T extT ext
eMSCeMSC
SDL(pr oc ess), CSDL(pr oc ess), CBox Validation Activities
System Val idation Activi ti es
eMSCeMSCExtended Message Sequence ChartsSDLSDLSpeci fi cation and Design LanguageSLSL “SL”, data language
eMSC, SDL(bloc s)eMSC, SDL(bloc s)
SDL (blocs)SDL (blocs)
Technology Evaluation
ImplementationImplementation
Refine
Feedback
Plan for ChangesPlan for Changes
Feedback
Objective Decision Criteria
Project Cost Estimating, Planning ,& Tracking
tsNoManScripptsNoAutoScri
Durationxoductivity
DurationxtsNoManScripxptsNoAutoScri
×+==
=×´+´
3Pr
)3()(
SDL Models
Managed, measured, productivity gains through:
• process improvement• data driven decision-making• technological innovation• Quantitative valuation of COQ vs COPQ

15
COQ versus COQ versus COPQCOPQTest
Activities Total Number of Days Opportunities for
Savings Proposed Change
Test Execution 132 Days 34 Days Process Control
Defect Removal 164 Days 67 Days Process Control
296 Days 101 Days
Total Number Hours Opportunities for Savings
Test Automation 5426 Hours 2662 Hours SDL Modeling
Test Automation 296 Days 25 Days SDL Modeling

16
Process Simulation ModelsProcess Simulation Models
• Experimental Simulation Qualitative and quantitative results based on non-deterministic or hybrid simulation model
• mirrors a segment of the real world • control of variables is high • supports testing of causal hypothesis• results can be replicated• high internal validity • high external validity, generalizability

17
IV&V YieldIV&V Yield
• Organizational context factors for cost– Key components

18
Independent Verification and ValidationIndependent Verification and Validation
• An organization independent from the developers study the artifacts of software production.
• This requires:- Technical independence. Members of the IV&V team may
not be personnel involved in the development of the software.
- .Managerial independence. The responsibility for IV&V belongs to an organization outside the contractor and program organizations that develop the software.
- Financial independence. Control of the IV&V budget is retained in an organization outside the contractor and program organization that develop the software.
• IV&V is often perceived as testing the code after the development is completed NASA IV&V is full life cycle activities

19
State of the Practice: Process Maturity
Source: SEI Web Site SEMA Report for March 2000

20
Measuring IV&V EffectivenessMeasuring IV&V Effectiveness
InformationManagement
Other
InformationAnalysis
X33
NOAAISSEOS
Shuttle
CLCSAATT x x x
x x x x xx x x x xx x x x x x x x
xx x x x xx x x x x x x xx x x x x x x x
IV&VDevelopedTools
xx
x
Objectives Measures Targets Initiatives
Minimize testeffort
# test casestest pass/failrates
Minimum testset99% Interval
TestEffectivenessIV&V Toolset
Track issues todisposition
# Total IssuesOpen/Closed
2:1 rate ofclosure
Web-basedtracking systemPITS
InternalBusinessProcesses
Risk Mgmt # HazardsIdentified
No IFAs100%Traceable Req
ODC StudyRMS – ARM

21
US Data ?
AverageBest inClass
Current Level
% Improve-ment
Productivity(KAELOC per staff month) 3.23 7.14 4.03
Cost(dev. cost per KAELOC)
$4,334 $1,962 $1,008
Defect Content(defects per KAELOC)
15.6 8.1 18.8
Defect Removal Efficiency (by Technology) 95% 99.5% 92.7%
Cost of Delivered Defects(post-release defects per KAELOC, Domain)
$1.5M
IndustryIndustryBenchmarkingBenchmarking
Source for US Data: Capers Jones (2000) Software Assessments, Benchmarks, and Best Practice,
Addison-Wesley, p 339, System Software Baseline.

22
IV&V YieldIV&V Yield
• System factors for cost and gain
23
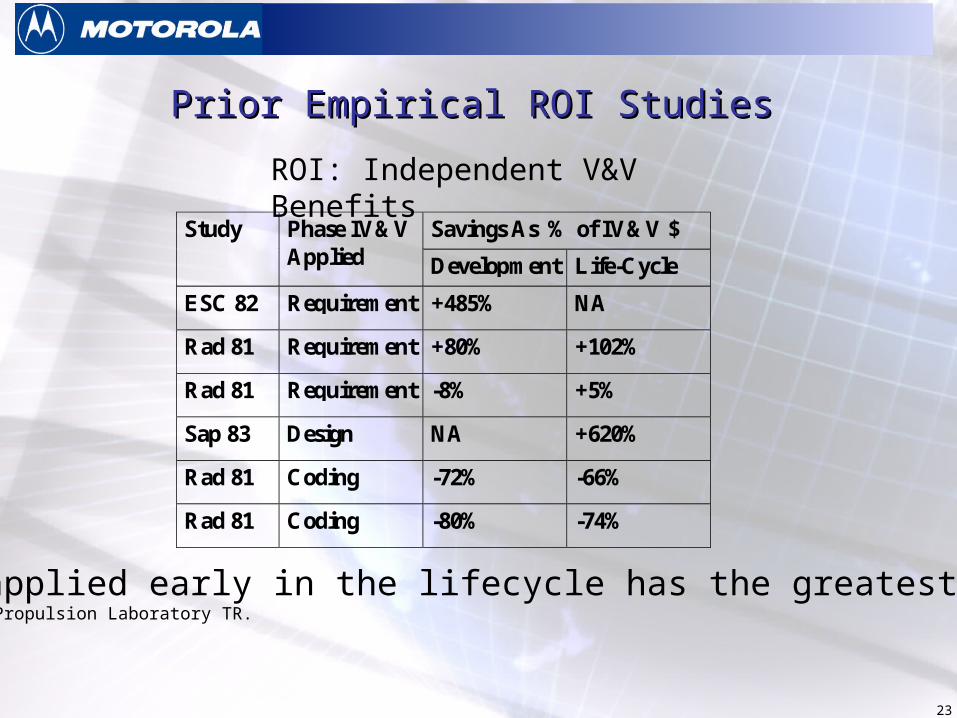
Prior Empirical ROI StudiesPrior Empirical ROI Studies
Savings As % of IV&V $Study Phase IV&VApplied Development Life-Cycle
ESC 82 Requirement +485% NA
Rad 81 Requirement +80% +102%
Rad 81 Requirement -8% +5%
Sap 83 Design NA +620%
Rad 81 Coding -72% -66%
Rad 81 Coding -80% -74%
ROI: Independent V&V Benefits
IV&V applied early in the lifecycle has the greatest ROI. Source Jet Propulsion Laboratory TR.

24 02/09/01
IMPACT of Major Air & Space Software ProblemsIMPACT of Major Air & Space Software Problems
Aggregate Cost:
Loss of Life:
‘93 ‘96 ‘97 ‘98 ‘99
Airbus A320
Ariane 5
3
Flight 965
160
$640 million
Loss of Data:
[Poseidon]
[Galileo]
USAF STEP
[Pathfinder]
[Lewis]
$116.8 million
Zenit 2
Delta 3
[NEAR]
$255 million
Titan 4B
[DS-1]
Orion 3
[Galileo]
$1.6 billion
[‘99] – NASA IV&V presentation

25
Tracing Impacts to Causes… Cause-Effect Graphing
Mission Success at Reduced Cost
Reliability Objective
Safety Objective Cost Objective
Process ImprovementAvoid Rework
Eliminate RedundancyEfficient Resource Allocation
Skilled Workforce
Domain ExpertsEngineers
V&V Experts
Skills training program
IT Infrastructure, Web-based reporting, DSS, ARM, PITS, RMS, Ask
Pete, ARRT
Communication Channels & Reporting
PL Reuse TechnologiesDomain Engineering
Knowledge MaintenanceV&V Models and Methods
Quality Objective
Defect Prevention
Defect Detection
Identify and Eliminate Hazards
Identify and Manage Risks
Information Analysis& Information Management,
Product Certification

26
Strategic and Financial Goals
Reliability Objective
Competitive Objective Cost Objective
Process ImprovementAvoid Rework
Eliminate RedundancyEfficient Resource Allocation
Skilled Workforce Black Belts
EngineersTelecom Experts
Skills training program - Motorola University
IT Infrastructure, Web-based reporting, COMPASS, TIGERS,
TeamPlay, Communication Channels & Reporting
SIX SIGMAPerformance ExcellenceKnowledge Maintenance
Communications Models and Methods
Quality Objective
Defect Prevention
Defect Detection
Optimize resource allocation & utilization
Identify and Manage Risks
Information Analysis& Information Management
Product Certification
BSC Cause and Effect GraphingBSC Cause and Effect Graphing

27
Filter AttributesFilter Attributes
28
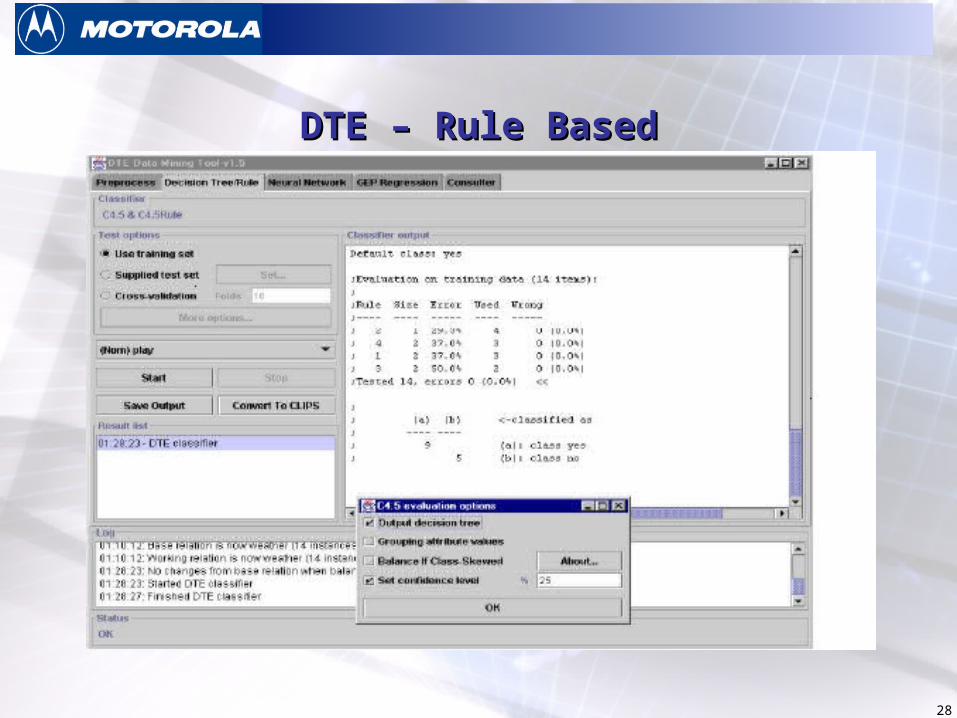
DTE – Rule BasedDTE – Rule Based

29
NEURAL NETWORKNEURAL NETWORK

30
Intelligent update of rule structureIntelligent update of rule structure

31
STATISTICAL ANALYSISSTATISTICAL ANALYSIS

32
BENEFITSBENEFITS
• The benefits of this proposed Center Initiative would be applicable to all NASA software development organizations for whom IV&V is an option. The formalization of an objective decision-making process, along with enabling support tools would provide key capabilities to make rational budgetary decisions that impact safety and mission critical aspects of all NASA software systems. This is significant in enabling NASA to engage in effective administrative and managerial control based on objective, quantified information.
• The techniques proposed under this initiative will also provide NASA participants increased visibility into their process improvement efforts. The ISO-9001 certification requires that managers be able to document the benefits contributed to the organization by specific processes and process improvement effort [8]. A formalized, well-defined decision-making process would therefore make a significant contribution to NASA’s overall quality strategy.

33
MILESTONESMILESTONES
Start=July 20, 2001 + 3 mo
IV&V Process Description – Product Characterization
Based on prior CSIP results
Start=July 20, 2001 + 6 mo
Information Analysis
Data gathering for methodology
Start=July 20, 2001 + 6 mo
Initial Prototype Demonstration(s) & Iteration(s) Delivered
GSFC IV&V interface required

Nancy S. Eickelmann, PhDMotorola Labs1303 E. Algonquin Rd.Annex-2Schaumburg, IL 60196Phone: (847) 310-0785Fax: (847) [email protected]