Nancy R. Cook, ScD Championing Public Health Nutrition November 25-26, 2014 Sodium and...
28
Nancy R. Cook, ScD Championing Public Health Nutrition November 25-26, 2014 Sodium and Cardiovascular Health
-
Upload
august-marshall -
Category
Documents
-
view
215 -
download
1
Transcript of Nancy R. Cook, ScD Championing Public Health Nutrition November 25-26, 2014 Sodium and...

Nancy R. Cook, ScD
Championing Public Health NutritionNovember 25-26, 2014
Sodium and Cardiovascular Health

Disclosures
• No commercial interests• TOHP was funded by NHLBI• Current funding from NHLBI for unrelated projects • Current funding from the AHA for continued mortality follow-up of the TOHP cohorts

Dietary Recommendations for Sodium in Adults
• Average US diet: 3,400 mg/d• US Dietary Guidelines (2010): <2,300 mg/d
• < 1,500 for aged 51+, blacks, HTN, or CKD
• AHA (2012): < 1,500 mg/d• WHO (2012): < 2,000 mg/d• Canada’s Food Guide: 1500-2300 mg/d• Based primarily on studies of BP

Cochrane Collaboration (He, 2002)
-5.0 (-5.8 to -4.2)

Cochrane Collaboration (He, 2002)
-2.0 (-2.6 to -1.5)
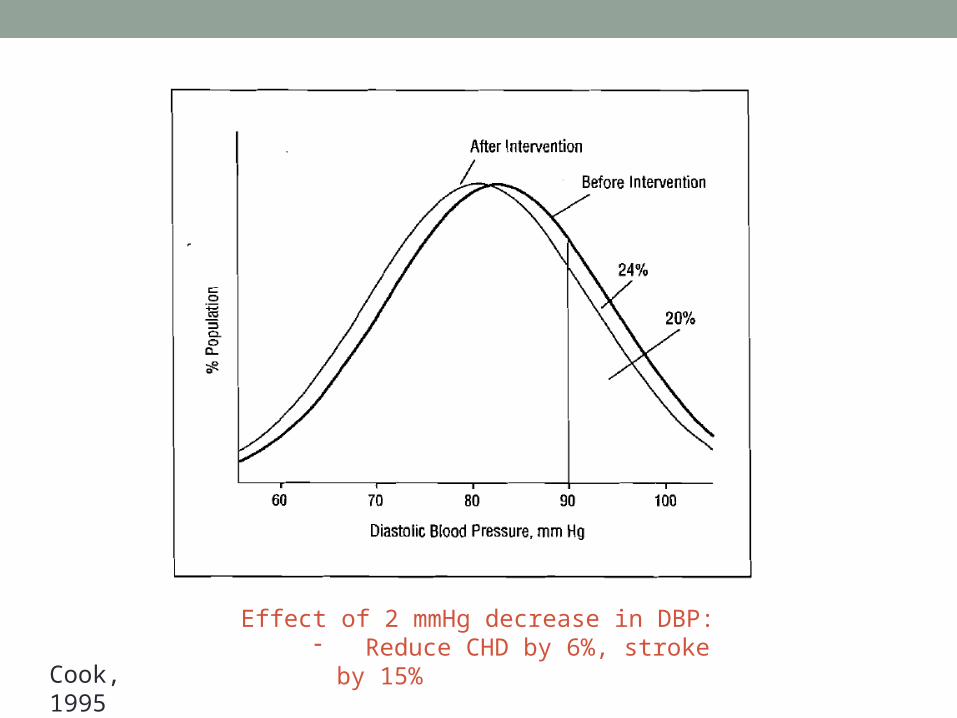
Effect of 2 mmHg decrease in DBP:- Reduce CHD by 6%, stroke by 15%
Cook, 1995
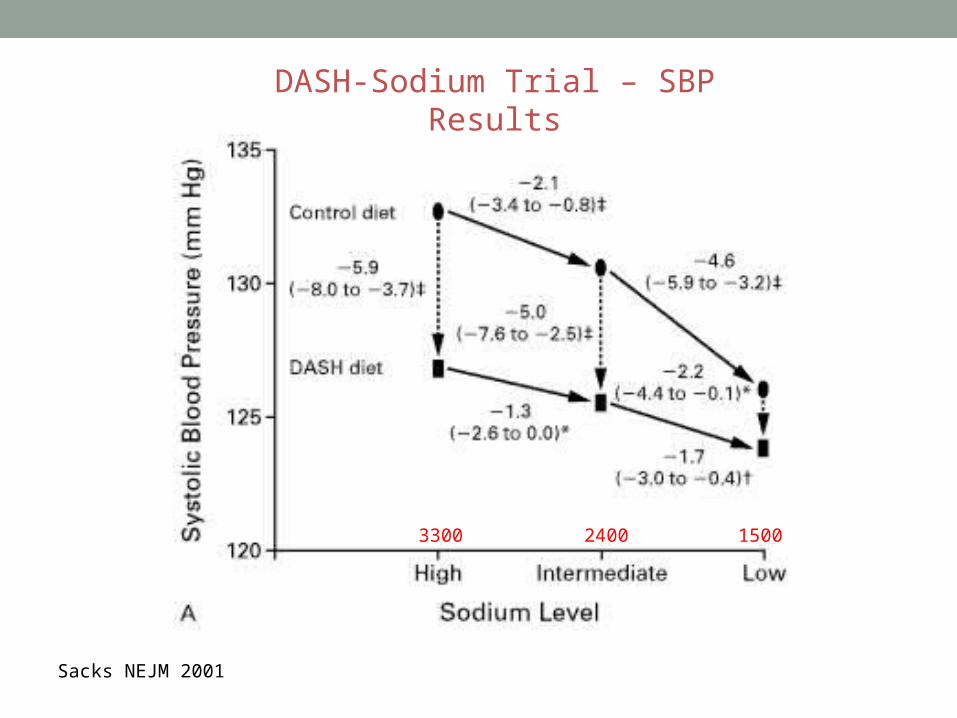
DASH-Sodium Trial – SBP Results
Sacks NEJM 2001
3300 2400 1500

Evidence
• Observational data support a strong positive association between sodium intake and BP
• Randomized trials in both hypertensive and non-hypertensive subjects show BP reduction with lower sodium intake
• Fewer data exist on the effect of sodium intake or excretion on subsequent morbidity and mortality
• Some recent studies suggest a possible adverse effect of low sodium on CVD

Trials of Hypertension Prevention
Randomized sodium reduction interventions in those with high normal BP
• Blood pressure trials• TOHP I (1987-1990)
• 744 in Na Reduction vs. in Usual Care over 1½ years
• TOHP II (1990-1995)• 2,382 in Na Reduction vs. in Usual Care over 3-4 years
• Small effects on BP
• Follow-up for CVD• TOHP Follow-up Study (to 2004)
• Post-trial follow-up for CVD for 10-15 years• Compared randomized groups

0 5 10 15
Follow-up Years
0.0
00.0
50.1
00.1
5
Cum
ula
tive In
ciden
ce o
f C
VD
or
De
ath
Na ControlActive Na
TOHP I
Cumulative Incidence of CVD Adjusted for Clinic, Age and Sex
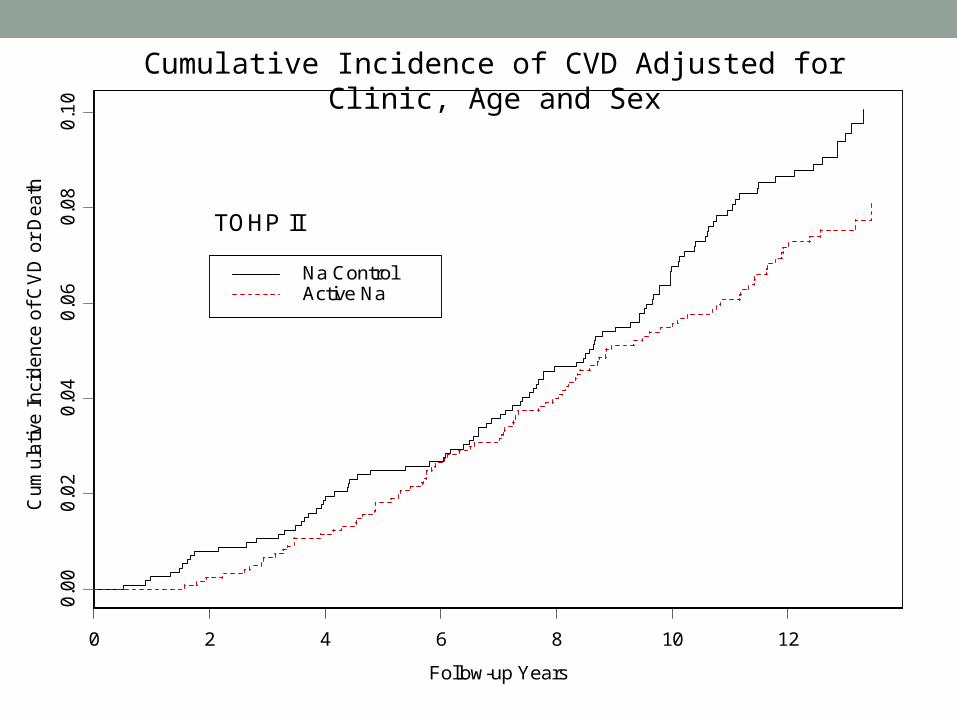
0 2 4 6 8 10 12
Follow-up Years
0.0
00.0
20.0
40.0
60.0
80.1
0
Cum
ula
tive In
ciden
ce o
f C
VD
or
De
ath
Na ControlActive Na
TOHP II
Cumulative Incidence of CVD Adjusted for Clinic, Age and Sex

CVD by Randomized Sodium Intervention
Active NA Reduction vs. Usual Care
RR 95%CI p
Combined 0.75 0.57 – 0.99 0.044
Adjusted for Baseline Sodium and Weight
Combined 0.70 0.53 – 0.94 0.018
TOHP I 0.48 0.25 – 0.92 0.027
TOHP II 0.79 0.57 – 1.09 0.16

0 5 10 15
Follow-up Years
0.0
00.0
10.0
20.0
3
Cum
ula
tive M
ort
alit
y
Na ControlActive Na
TOHP I
Cumulative Mortality Adjusted for Clinic, Age and Sex
0 2 4 6 8 10 12
Follow-up Years
0.0
00
0.0
05
0.0
10
0.0
15
0.0
20
0.0
25
Cum
ula
tive M
ort
alit
y
Na ControlActive Na
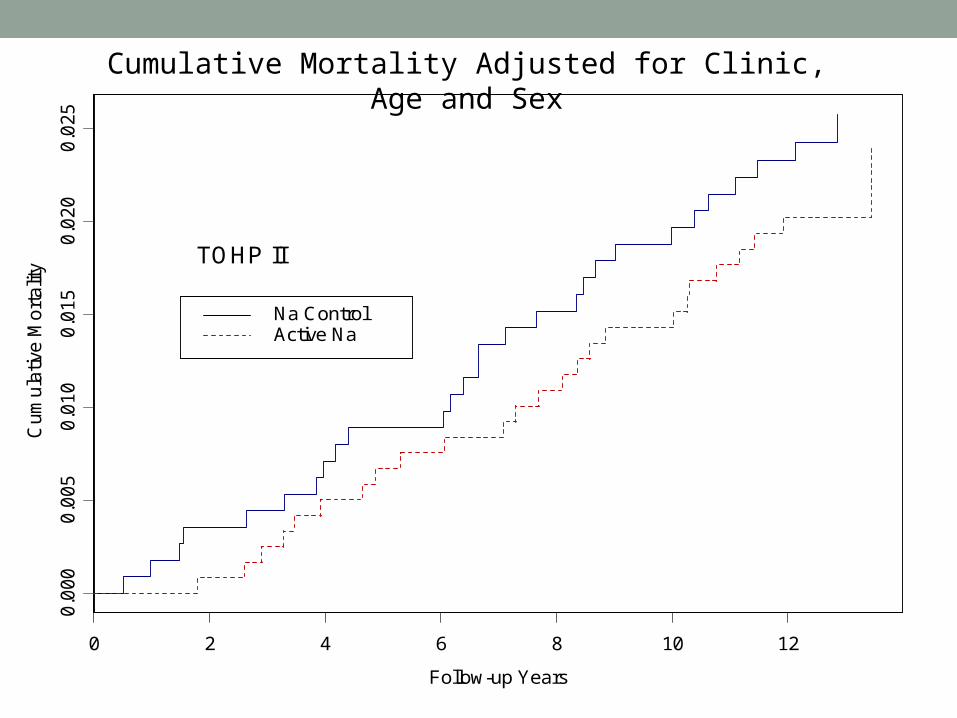
TOHP II
Cumulative Mortality Adjusted for Clinic, Age and Sex

Total Mortality by Randomized Sodium Intervention
Active NA Reduction vs. Usual Care
RR 95%CI p
Combined 0.81 0.52 – 1.27 0.35
Adjusted for Baseline Sodium and Weight
Combined 0.80 0.51 – 1.26 0.34
TOHP I 0.76 0.33 – 1.74 0.52
TOHP II 0.83 0.48 – 1.41 0.49
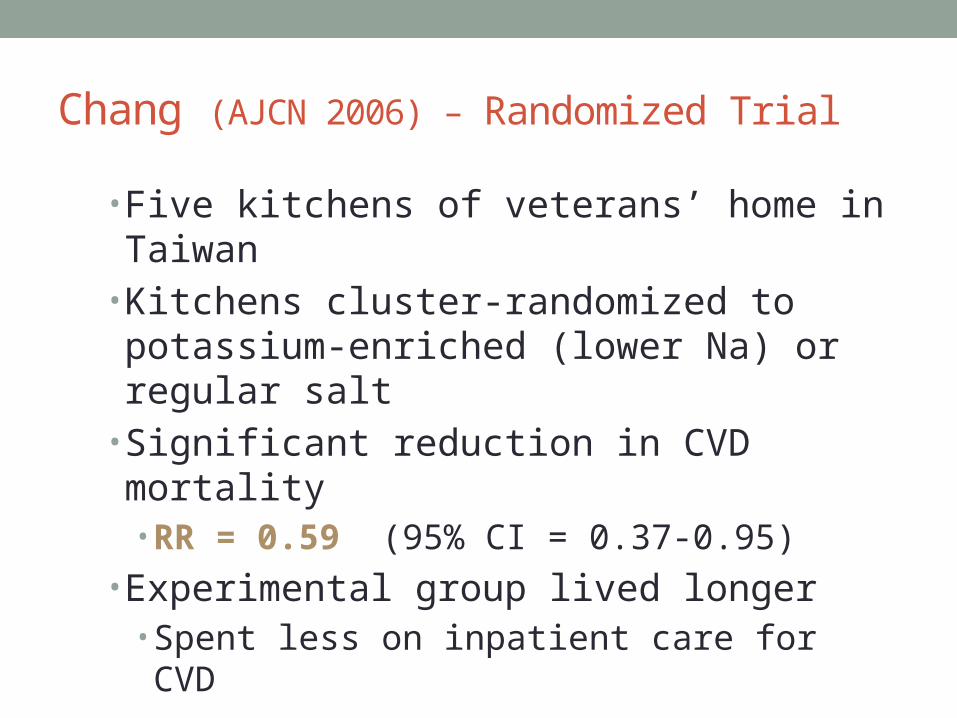
Chang (AJCN 2006) – Randomized Trial
• Five kitchens of veterans’ home in Taiwan• Kitchens cluster-randomized to potassium-enriched (lower Na) or regular salt
• Significant reduction in CVD mortality• RR = 0.59 (95% CI = 0.37-0.95)
• Experimental group lived longer• Spent less on inpatient care for CVD

IOM Report – May 2013
• Committee on Consequences of Sodium Reduction in Populations
• Charged with examining benefits and adverse effects of reducing sodium intake on health outcomes in the range of 1,500 to 2,300 mg/d
• The committee determined that evidence from studies on direct health outcomes is inconsistent and insufficient to conclude that lowering sodium intakes below 2,300 mg per day either increases or decreases risk of CVD• TOHP trials did not lower average Na to that level

Quality of Sodium Measures• 24-Hour diet recall (NHANES)
• Possible biased recall• Varies day-to-day
• Food frequency• Sodium from processed foods not captured• No salt added at table or cooking• Absolute levels are off
• Morning or spot urine• Diurnal variation • Day-to-day variation• Absolute levels are off
• 24-hour excretion• Gold standard, but difficult to obtain• Can still vary day-to-day

Observational Studies of Sodium
• Most based on single-day diet recall or single urinary excretion• Difficult to capture long-term intake
• Many had small numbers of events• Inconsistent results• Some included those with CVD or hypertension• Confounding by indication• Reverse causation• Some did not control for prior disease
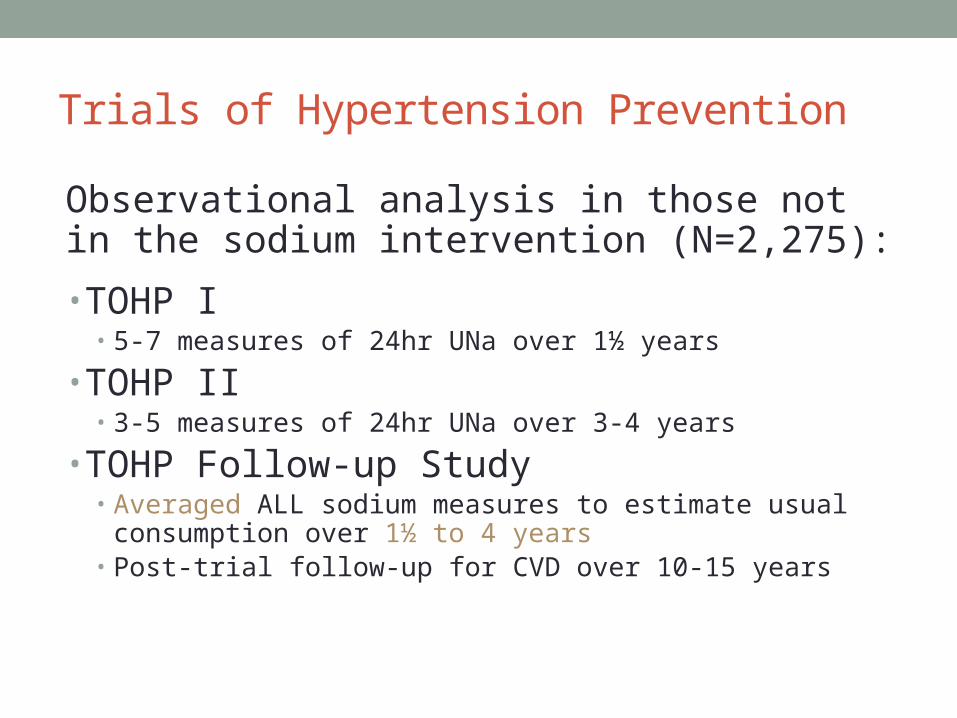
Trials of Hypertension Prevention
Observational analysis in those not in the sodium intervention (N=2,275):
• TOHP I• 5-7 measures of 24hr UNa over 1½ years
• TOHP II• 3-5 measures of 24hr UNa over 3-4 years
• TOHP Follow-up Study• Averaged ALL sodium measures to estimate usual consumption
over 1½ to 4 years• Post-trial follow-up for CVD over 10-15 years

Na Excretion (mg/day)
Ha
za
rd R
ati
o
1000 2000 3000 4000 5000 6000 7000 8000 9000
0.2
0.5
1
2
5
10
20
TOHP Follow-up Data
p linear = 0.05

CVD Events in TOHP
Sodium Excretion (mg/24hr)
<2300 2300-<3600 3600-<4800 ≥ 4800
TOHP I
Events/Total (%) 15/189 (7.9) 48/590 (8.1) 40/427 (9.4) 23/191 (12.0)
TOHP II
Events/Total (%) 2/47 (4.3) 13/303 (4.3) 34/341 (10.0) 18/224 (8.0)
HR 0.68 0.75 1.00 1.05
95%CI 0.34-1.37 0.50-1.11 (Reference) 0.68-1.62
Adjusted for age, sex, race/ethnicity, clinic, intervention, education status, baseline weight, alcohol use, smoking, exercise, potassium excretion, family history of cardiovascular disease, and changes in weight, smoking, and exercise during the trial periods

Findings
• The TOHP cohort is healthy, no prior CVD or diabetes, and pre-hypertensive
• High-quality repeated measurements of sodium using 24-hour urine specimens
• Data from TOHP support a direct and consistent linear effect of sodium intake down to <1500 mg/d on CVD• No evidence of J- or U-shape

TOHP Follow-up Conclusions
• Participants in randomized sodium reduction interventions had lower rates of CVD
• Very precise estimate of sodium exposure• Better than gold standard 24-hr excretion
• Direct linear association of lower CVD with lower average Na down to 1500 mg/d
• Consistent with trial results for BP and CVD

O’Donnell et al, PURE, NEJM 2014
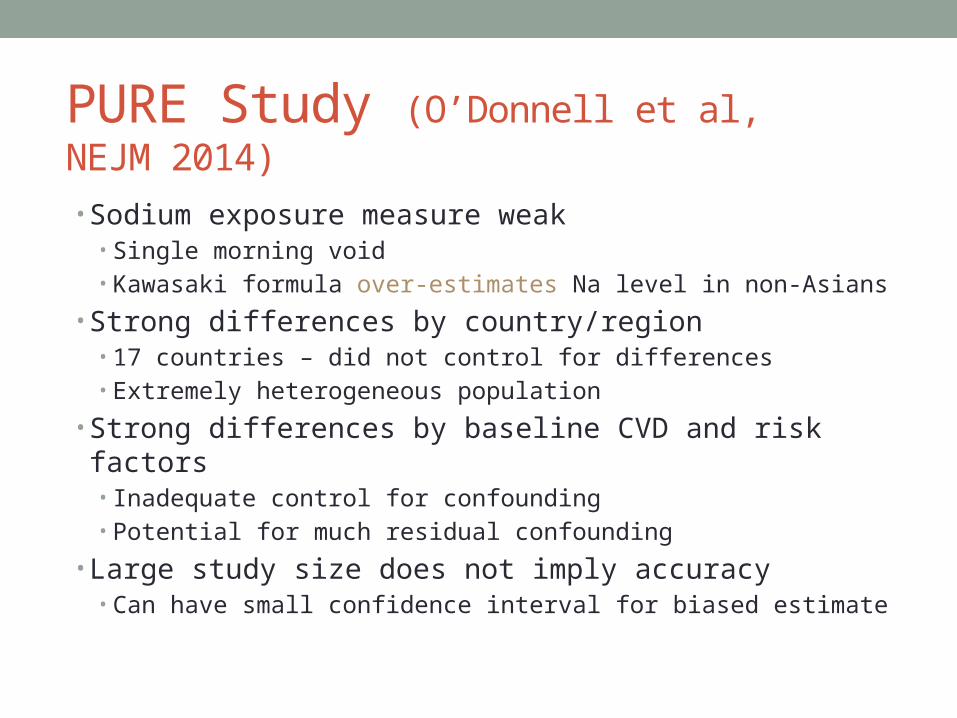
PURE Study (O’Donnell et al, NEJM 2014)
• Sodium exposure measure weak• Single morning void• Kawasaki formula over-estimates Na level in non-Asians
• Strong differences by country/region • 17 countries – did not control for differences• Extremely heterogeneous population
• Strong differences by baseline CVD and risk factors• Inadequate control for confounding• Potential for much residual confounding
• Large study size does not imply accuracy• Can have small confidence interval for biased estimate

<3g/d 3-<4g/d 4-<6g/d 6-<7g/d 7+g/d
Region (%)
Asia 42.2 45.4 53.6 65.0 76.3
Africa 4.2 2.7 2.4 2.0 1.6
Europe/N America 31.0 25.2 18.4 12.7 9.3
Baseline disease (%)
Hypertension 40.0 38.4 40.8 44.6 48.0
History of CVD 9.2 8.8 8.5 7.3 7.1
Diabetes 10.8 8.6 9.1 9.1 8.4
Medication use (%)
Beta blocker 6.1 4.8 4.0 2.6 2.0
Diuretic 7.5 5.0 4.5 4.5 4.5
ACE inhibitor/ARB 8.2 6.7 6.1 5.5 4.7
PURE Study (O’Donnell et al, NEJM 2014)

Conclusions
• Large effect of NA on BP in those with overt htn• Smaller but positive effect in normotensives
• Strongest evidence supports direct effect on CVD• Those with htn or pre-htn likely to benefit from Na reduction to 1500 mg/d• Majority of adults in US and Canada• Supports dietary guidelines
• Whether practical to reduce sodium to 1500 mg/d remains a question• 2,300 mg/d may be more achievable