Naled, Ambient Air Monitoring in Tulare County NALED APPLICATION FINAL REPORT Attached is the final...
15
STATE OF CALIFORNIA - CALIFWNIA ENVIRONMENTAL PRoTEcnw AGENCY AIR RESOURCES BOARD 2020 L STREET #. BOX 2815 3RAMENT0, CA 95814-2815 PETE WILSON. Gomor MEMORANDUM TO: FROM: DATE: Dr. John Sanders, Chief Environmental Monitoring and Pest Management Branch Department of Pes ions George Lew, Chi Engineering and ch November 20, 19 SUBJECT: NALED APPLICATION FINAL REPORT Attached is the final report, "Ambient Air Monitoring after an Application of Naled in Tulare County During June 1995.” If you or your staff have questions or need further information, please contact me at 263-1630 or Don Fitzell' at 263-2041. Attachment r- cc: James Stratton (w/Enclosure) Office of Environmental Health Hazard Assessment Lenord Craft (w/Enclosure) Tulare County Agricultural Commission Dave Crow San Joaquin Valley Unified APCO, Central Region Cliff Calderwood San Joaquin Valley Unified APCO, Southern Region Mark Pepple (w/Enclosure) Department of Pesticide Regulation Loreen Kleinschmidt (w/Enclosure) U.C. Davis Department of Environmental Toxicology Genevieve Shiroma, SSD (w/Enclosure) Mr. Lee Horton (w/Enclosure) Mr. A.K. Johnson (w/Enclosure)
Transcript of Naled, Ambient Air Monitoring in Tulare County NALED APPLICATION FINAL REPORT Attached is the final...

STATE OF CALIFORNIA - CALIFWNIA ENVIRONMENTAL PRoTEcnw AGENCY
AIR RESOURCES BOARD 2020 L STREET
#. BOX 2815 3RAMENT0, CA 95814-2815
PETE WILSON. Gomor
MEMORANDUM
TO:
FROM:
DATE:
Dr. John Sanders, Chief Environmental Monitoring and Pest Management Branch Department of Pes ions
George Lew, Chi Engineering and ch
November 20, 19
SUBJECT: NALED APPLICATION FINAL REPORT
Attached is the final report, "Ambient Air Monitoring after an Application of Naled in Tulare County During June 1995.”
If you or your staff have questions or need further information, please contact me at 263-1630 or Don Fitzell' at 263-2041.
Attachment
r- cc: James Stratton (w/Enclosure) Office of Environmental Health Hazard Assessment
Lenord Craft (w/Enclosure) Tulare County Agricultural Commission
Dave Crow San Joaquin Valley Unified APCO, Central Region
Cliff Calderwood San Joaquin Valley Unified APCO, Southern Region
Mark Pepple (w/Enclosure) Department of Pesticide Regulation
Loreen Kleinschmidt (w/Enclosure) U.C. Davis Department of Environmental Toxicology
Genevieve Shiroma, SSD (w/Enclosure) Mr. Lee Horton (w/Enclosure) Mr. A.K. Johnson (w/Enclosure)
State of California California Environmental Protection Agency
AIR RESOURCES BOARD
AMBIENT AIR MONITORING AFTER AN APPLICATION OF NALED IN TULARE COUNTY DURING JUNE 1995
Engineering and Laboratory Branch Monitoring and Laboratory Division
Test Report No. C91-031A
Report Date: November 20, 1995
APPROVED:
This report has been reviewed by the staff of the Air Resources Board and approved for publication. Approval does not signify that the contents necessarily reflect the views and policies of the Air Resources Board, nor does mention of trade names or commercial products constitute endorsement or recommendation for use.
Ambient Air Monitoring After an Application of Naled in Tulare County During June 1995
This report presents the results of ambient air monitoring after a ground application of naled at a selected orange grove in Tulare County. Samples were collected before, during and for 72 hours after the start of the application. Samples were analyzed for dichlorvos, the primary breakdown product, as well as naled.
n
Naled conSentrations ranged from 0.0157 ug/m' to a maximum concentration of 6.30 ug/m , which was measured during the application period. Dichloryos concentrations ranged from not detected (to.030 ug/sample3 to.006 ug/m for the 5-hour application period) to a maximum of 0.994 ug/m .
Acknowledgments
Ken Lewis was the Instrument Technician. David Todd and Angus MacPhearson of the ARB also assisted in the sampling. Assistance was provided by Lynn Baker, Cara Roderick, and Ruth Tomlin of the ARB's Air Quality Measures Branch as well as the Tulare County Agricultural Commissioner's Office in site selection. Chemical analyses were performed by the staff of the Trace Analytical Laboratory, Department of Environmental Toxicology, University of California, Davis.
TABLE OF CONTENTS
I.
II.
III.
IV.
V.
VI.
VII.
I.
I.
II.
III.
IV.
V.
I.
II.
III.
IV.
INTRODUCTION
DESCRIPTION
SAMPLING LOCATIONS
SAMPLING METHODOLOGY
ANALYTICAL METHODOLOGY
RESULTS
QUALITY ASSURANCE
LIST OF FIGURES
NALED MONITORING SITES
LIST OF TABLES
NALED APPLICATION MONITORING DATA
DICHLORVOS MONITORING DATA
NALED METEOROLOGICAL DATA
SUMMARY OF NALED APPLICATION DATA
SUMMARY OF DICHLORVOS DATA
APPENDICES
6
7
8
9
10
APPLICATION SITE AIR SAMPLE ANALYSIS OF NALED AND DICHLORVOS
SAMPLING PROTOCOL
Attachment I. PESTICIDE MONITORING APPARATUS
Attachment II. QA PLAN FOR PESTICIDE MONITORING
PORTERVILLE AIRPORT WEATHER DATA
QMOSB AUDIT REPORT
peter
Ambient Air Monitoring After an Application of Naled in Tulare County During June 1995
I. INTRODUCTION
The Air Resources Board (ARB) Engineering and Laboratory Branch (ELB) staff conducted three-day source impacted ambient monitoring to determine the concentration of naled (Dibrom) after its application on an orange grove in Tulare County in June 1995. The sampling occurred from June 5 through June 9, 1995. The monitoring was designed to determine levels of naled as well as its primary breakdown product, dichlorvos. This monitoring was requested by the Department of Pesticide Regulation (DPR) as required by the Food and Agricultural Code 14021, in order for DPR to evaluate the persistence and possible human exposure to this pesticide.
The Pesticide Use Report for 1993 indicates naled was most widely used on cotton (27,256 pounds), safflower (24,688 pounds) and oranges (21,.161 pounds) in California. Naled is used as an insecticide to control citrus thrips on oranges.
II. DESCRIPTION
Naled (molecular height 38Oo79 g/mole) is a white solid with a low3 melting point, 27 C. At 20 C its vapor pressure is about 2 x 10 mm Hg. Naled is practically insoluble in water, but completely hydrolyzed by water within 24 hours. Naled is freely soluble in aromatic and chlorinated hydrocarbons, ketones and alcohols. The LD in male rats is 250mg/kg orally and 800 mg/kg dermally (The Merck In%x, Eleventh Edition).
Dichlorvos is a colorless liquid, boiljjg point 14O'C at 20 mm Hg. The vapor pressure at 20 C is 1.2 x 10 mm Hg. It is soluble in dichloromethane, 2-propanol, and toluene, while practically insoluble in water.
The Ora1 *L%R in male rats is 80 mg/kg. Dichlorvos is
subject to the proviso s of the Safe Drinking Water and Toxic Enforcement Act (Proposition 65). Thg 24-hour, ten in one million Proposition $5 risk level is 0.1 ug/m (based on an average breathing rate of 20 m for 24 hours and a 70 year lifetime exposure) (California Code of Regulations, 1994).
-l-
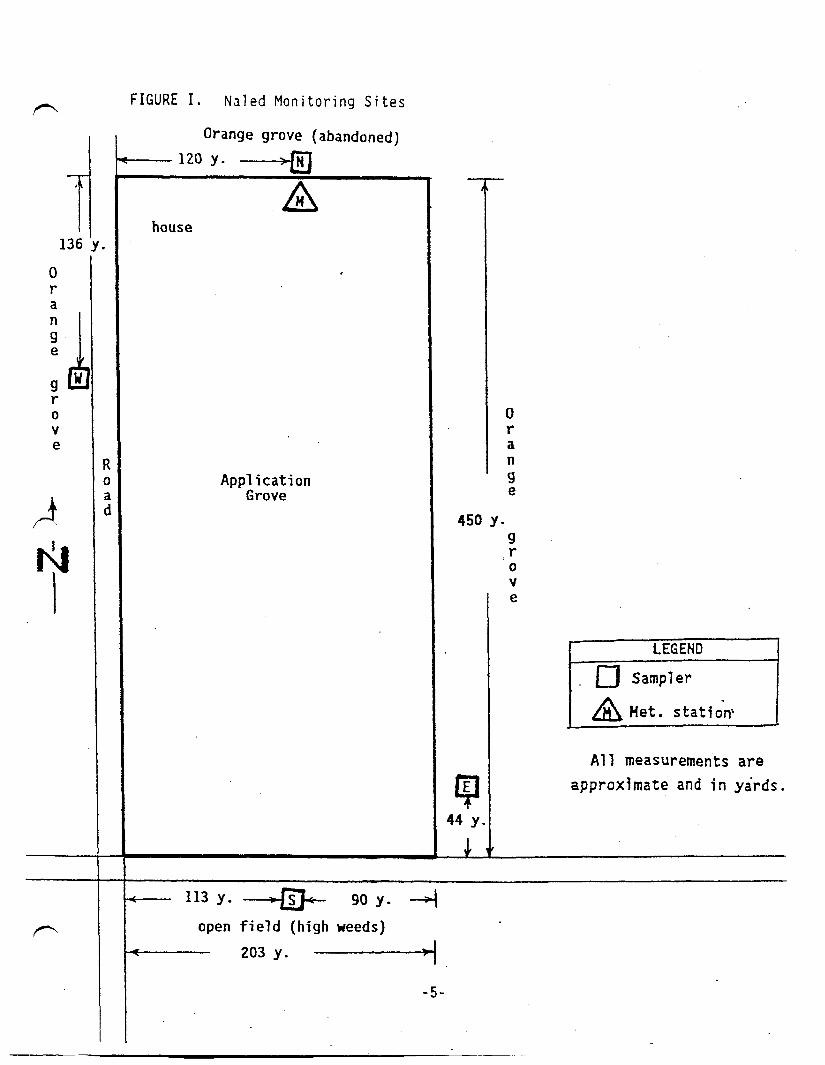
III. SAMPLING LOCATIONS
An orange grove of about 20 acres was selected and approved by ARB staff to use for application monitoring. Five samplers, each at about 1.5 meters above ground, were set up (see FIGURE I): two on the southeastern perimeter (site E) at a distance of about 5 yards from the grove, one about 14 yards from the southern perimeter (site S), one about 15 yards from the western side (site W) and one about 5 yards from the northern side (site N). A meteorological station, at a height of about 7 feet, was set up near site N to determine wind speed and direction.
Sites N and E did not meet the siting criteria outlined in the Quality Assurance Plan for Pesticide Monitoring (APPENDIX II, Attachment II). Sampler N was backed up against an abandoned orchard with trees and brush measuring 6 - 10 feet high. The duplicate samplers at Site E were in an orange grove adjacent to the one being monitored. The southeastern portion of the perimeter was chosen because younger, therefore smaller trees were present which minimized their influence on the wind patterns. ARB staff has found it difficult to meet the siting criteria when monitoring orchards because of the close proximity of other orchards. Attempts are made to minimize the effects of adjacent trees to the samplers.
The application was by air-blast sprayer and took about 4 hours. One sprayer was used. It started at the southwestern corner traveling rows which ran west to east. The sprayer completed the rows to finish at the northern end of the orchard. Dibrom 8 was applied at a rate of 1 pint per acre. Carzol SP (an insecticide) was applied with Dibrom 8 at‘a rate of 1.5 pounds per acre as well as'a fertiiizer, 10-12-o at a rate of 0.2 gallons per acre.
IV. SAMPLING METHODOLOGY
The sampling method used during this study required passing measured quantities of ambient air through a Teflon holder containing approximately 30 cc of XAD-4 resin (see APPENDIX I). The resin was held in place by installing stainless steel screens on each side of the resin and between the Teflon support rings. Any naled and dichlorvos present in the sampled ambient air was captured by the XAD-4 adsorbent. Subsequent to sampling, the resin was transferred into a glass jar with a Teflon-lined lid and stored in an ice chest containing dry ice. All samples were transported on dry ice to the Trace Analytical Laboratory (TAL) of the Department of Environmental Toxicology, U.C. Davis for analysis.
Each sample train consisted of an XAD-4 resin holder, Teflon fittings and tubing, control valve, rotometer, train support, and a 12VDC powered vacuum pump. A diagram of the sampling train is shown in
-2-
V.
APPENDIX II, Attachment I. Aluminum foil was wrapped around the holder to protect the adsorbent from exposure to sunlight.
The sample pump was started and the flow was adjusted with a metering valve to an indicated reading of 15.0 on the rotometer. A leak check was performed by blocking off the flow meter inlet. Upon completion of a successful leak check, the indicated flow rate was again set at 15.0 and was recorded (if different from the planned setting) along with date, time and site location. Calibration prior to use in the field indicated that an average flow rate of 14.8 lpm was actually achieved when the flow meter was set to 15.0. At the end of each sampling period the final indicated flow rate (if different than the set 15-O), stop date, and time were recorded. If the final flow rate changed from the original 15.0 lpm, the average of the initial and the final flow rates was used to calculate the total volume of sampled air.
ANALYTICAL METHODOLOGY
The XAD-4 resin recovered from each sampler was analyzed by the TAL staff. The XAD-4 resin was extracted with 50 ml ethyl acetate followed by gas chromatography/nitrogen-phosphorus detection. Separation was accomplished on a DB-5 Megabore capillary column. A description of the complete analytical methodology can be found in "Method Development for Naled and Dichlorovos in Air Samples Using XAD-4 Resin as a Trapping Medium." (APPENDIX I).
VI. RESULTS
The monitoring results for naled are shown in TABLE I. The monitoring results for dichlorvos are shown in TABLE II. A summary of the on-site meteorological data is presented in TABLE III. A summary of the monitoring and meteorological data for naled and dichlorvos is presented in TABLE IV and TABLE V, respectively. Additional detailed meteorological data from the Porterville Airport is presented in APPENDIX III. None of the results presented in this report have been corrected for percentage recovery.
Naled concentrations rangeg from 0.0157 ug/m3 to a maximum concentration of 6.30 ug/m , which was measured during the application period. Dichlorvos cogcentrations ranged from not detected (to.030 ug/sample, ~03006 ug/m for the 5-hour application period) to a maximum of 0.994 ug/m . These values are significantly higher than those found in an urban ambient monitoring program conducted earlier in Tulare County (Airborne Concentrations of Naled and Dichlorvos in Central Tulare County from Sampling Conducted in May and June 1991). The
-3-
maximum naled value for the ambient stucJy was 0.077 ug/m3 while the maximum dichlorvos value was 0.059 ug/m .
VII. QUALITY ASSURANCE
Reproducibility, linearity, collection and extraction efficiency, minimum detection limit and storage stability are described in the Method Development for Naled and Dichlorovos in Air Samples Using XAD-4 Resin as a Trapping Medium (APPENDIX I).
All of the procedures outlined in the Quality Assurance Plan (APPENDIX II, Attachment II) were followed except: the sampling schedule was modified to avoid collection of a sample in the middle of the night, no field spikes were prepared, and all of the sites did not meet the criteria in the QA Plan. In addition, a flow rate audit, a systems audit and an analytical performance audit were performed by the Quality Management and Operations Support Branch (QMOSB) (APPENDIX IV).
The TAL also ran validation (spiked) samples prepared in-house. Recoveries ranged from 95% to 116% for dichlorvos and 83% to 124% for naled.
-4-
-i 136 y.
r 0 V e
A 1 N I
r
FIGURE I. Naled Monitoring Sites
Orange grove (abandoned)
120 Y- -----+m
house
Application Grove
450 y-
c;I E
44 y.
i
0 r a n 9 e
9 cr
0 V e
Het. station' I
All measurements are
approximate and in ydrds.
< 113 Y* ---- 90 y. -;r(
open field (high weeds)
- 203 y. --I
-5-
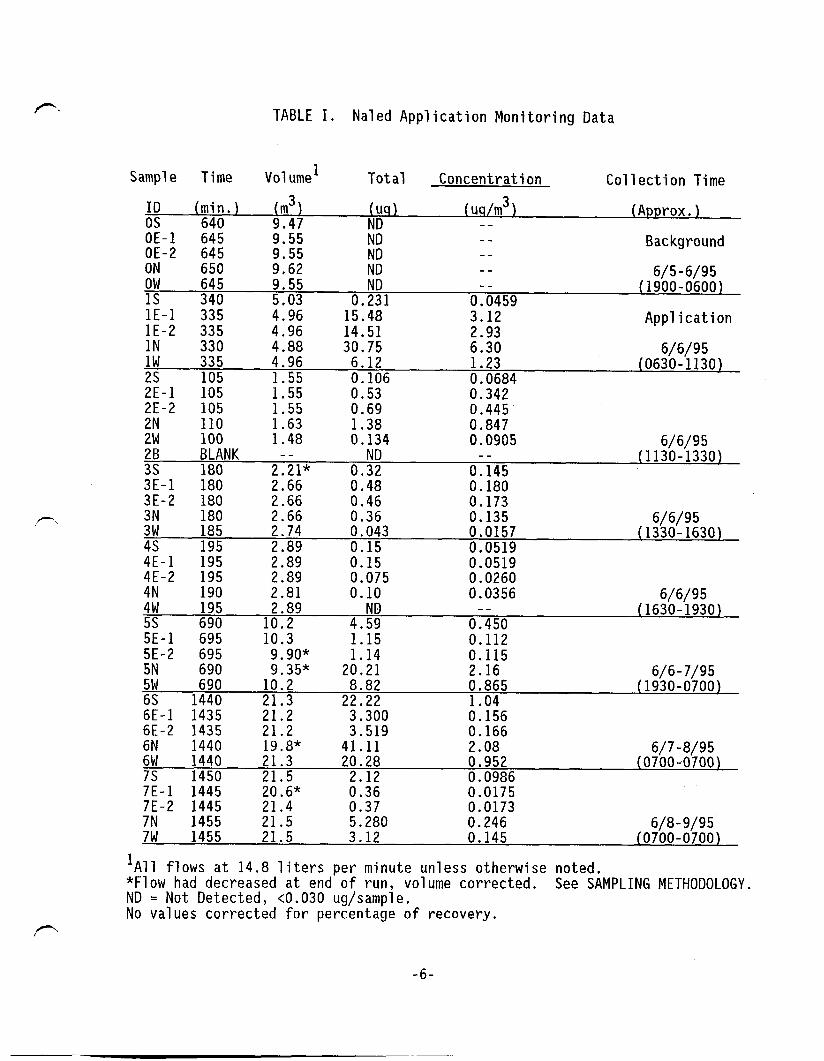
TABLE I. Naled App lication Monitoring Data
Sample Time Volume1 Total Concentration Collection Time
ID (min.) (m3) ( 4) Nti
(us/m31 OS 640
(Approx.) 9.47 --
OE-1 645 9.55 -- OE-2 645 9.55 Ii; Background --
ON 650 9.62 -- ow 645 9.55
Fi"D 6/5-6/95 --
1s 340 (1900-0600)
5.03 0.231 0.0459 lE-1 335 4.96 15.48 3.12 lE-2 335 4.96 14.51 2.93 Application
:Ej 330 335 4.96 4.88 30.75 6.12 6.30 1.23 6/6/95
Kl
(0630-1130) 105 1.55 0.106 0.0684 105 1.55 0.53 0.342
2E-2 105 1.55 0.69 0.445
ii 110 100 1.63 1.48 0.134 1.38 0.847 0.0905 GE BLANK
6/6/95
2121* 0.;; OX45 (1130-1330)
180 3E-1 180 2.66 0.48 0.180 3E-2 180 2.66 0.46 0.173
,rx i! 180 2.66 0.36 0.135 185 2.74 0.043 0.0157
6/6/95 (1330-1630)
4s 195 2.89 0.15 0.0519 4E-1 195 2.89 0.15 0.0519 4E-2 195 2.89 0.075 0.0260 2 190 195 2.81 2.89 0.10 0.0356 6/6/95
ND (1630-1930) 5s 690 10.2 4.59 01450 5E-1 695 10.3 1.15 0.112 5E-2 695 9.90* 1.14 0.115 2; 690 690 10.2 9.35* 20.21 8.82 0.865 2.16 6/6- 7/95
(1930-0700) 6s 1440 21.3 22.22 1.04 6E-1 1435 21.2 3.300 0.156 6E-2 1435 21.2 3.519 0.166 ii 1440 1440 21.3 19.8* 41.11 20.28 0.952 2.08 6/7-8/95
(0700-0700) 7s 1450 21.5 2.12 0.0986 7E-1 1445 20.6* 0.36 0.0175 7E-2 1445 21.4 0.37 0.0173 :cj 1455 1455 21.5 21.5 3.12 5.280 0.246 0.145 (0700-0700) 6/8- 9/95
'All flows at 14.8 liters per minute unless otherwise noted, *Flow had decreased at end of run, volume corrected. See SAMPLING METHODOLOGY. ND = Not Detected, co.030 ug/sample. No values corrected for percentage of recovery.
,-
-6-
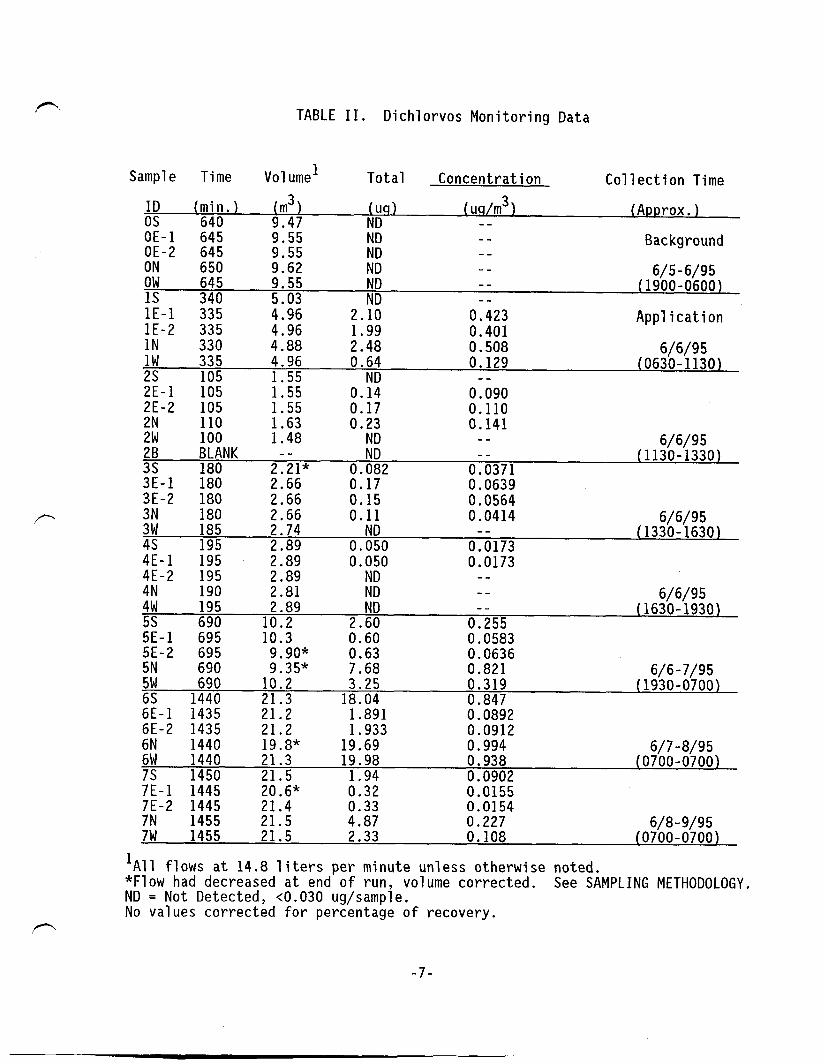
TABLE II. Dichlorvos Monitoring Data
Sample Time Volume' Total Concentration Collection Time
ID (min.) (m3) (uq) ( IN/m3 1
ii;-1 645 640 9.55 9.47
(Approx.)
1; -- -- OE-2 645 9.55 Background --
ON 650 9.62 I$ -- ow 645 9.55
1s 340 5.03
Fill 6/5-6/95 -- (1900-0600)
lE-1 335 4.96 2.10 01423 lE-2 335 4.96 1.99 Application 0.401
1N 330 4.88 2.48 0.508 :i 335 105 4.96 1.55 0.64 0.129 (0630-1130) 6/6/95
2E-1 105 1.55 0.;: OlOSO 2E-2 105 1.55 0.17 0.110
;/I 110 100 1.63 1.48 0.23 0.141 --
:ti BLANK
6/6/95
2121" F4oD
010371 (1130-1330)
180 0.082 3E-1 180 2.66 0.17 0.0639 3E-2 180 2.66 0.15 0.0564
,f--- :I! 180 2.66 0.11 0.0414 185 2.74
6/6/95 (1330-1630)
4s 195 2.89 0.~~0 010173 4E-1 195 2.89 0.050 0.0173 4E-2 195 2.89 ND -- :Yj 190 195 2.89 2.81 Ii: -- 6/6/95
5s (1630-1930)
690 10.2 2.60 0,255 5E-1 695 10.3 0.60 0.0583 5E-2 695 9.90* 0.63 0.0636 EJ 690 690 10.2 9.35* 3.25 7.68 0.821 0.319 6/6-7/95
(1930-0700~ ii;-1 ::i: 21.2 21.3 18.04 1.891 0.0892 0.847
6E-2 1435 21.2 1.933 0.0912 ii 1440 1440 21.3 19.8” 19.69 19.98 0.994 0.938 6/7-8/95
(0700-0700~ ::-1 ;:ci 21.5 20.6" 0.32 1.94 0.0155 0.0902
7E-2 1445 21.4 0.33 0.0154 ;i 1455 1455 21.5 21.5 4.87 2.33 0.227 0.108 6/8-g/95
(0700-0700)
'All flows at 14.8 liters per minute unless otherwise noted. *Flow had decreased at end of run, volume corrected. See SAMPLING METHODOLOGY. ND = Not Detected, to.030 ug/sample. No values corrected for percentage of recovery.
-7-

TABLE III. Naled Meteorological Data
Wind* Wind Speed Direction (mph)
Cloud Cover
0 SE/NW <l
: &!/‘&SE
32 ;: PC
3 kJNW/W/NE 4 NJNW/W/NE t ;:
: SE/S/N SW/W/NW/S/E : FE
7 N/NW/NE/SE/S 2 K
BOLD indicates predominant wind direction, if any.
*Indicates direction wind blows from.
K = clear, PC = partly cloudy, 0 = overcast
-8-

TABLE IV. Summary of Naled Application Data (ug/m3)
IN ND
(0) WI ND
x
[El ND
(1 'mph
PI ND
[N] 0.847
(2) [W] 0.0905 [E] 0.394
3'mph
[S] 0.0684
[N] 0.0556
(4) WI ND
*
[E] 0.0390
5 mph
[S] 0.0519
[N] 2.08
(6) [W] 0.952 [E] 0.161
1 mph
[S] 1.04
[N] 6.30
(1) WI 1.23
Y
[E] 3.02
2 mph
[S] 0.0459
[N] 0.135
(3) [W] 0.0157 [E] 0.176
[S] 0.145
[N] 2.16
(5) [W] 0.865 [E] 0.114
lCmph
[S] 0.450
[N] 0.246
(7) [W] 0.145 [E] 0.0174
[S] 0.0986
( ) Indicates sampling period. [ ] Indicates sampling site represented. Arrow indicates direction wind is blowing toward. Bold indicates predominant wind direction, if any. ND = not detected, less than .the limit of quantitation, 0.030 ug/sample. [E] values are the average of 2 collocated samplers.
-9-
+’
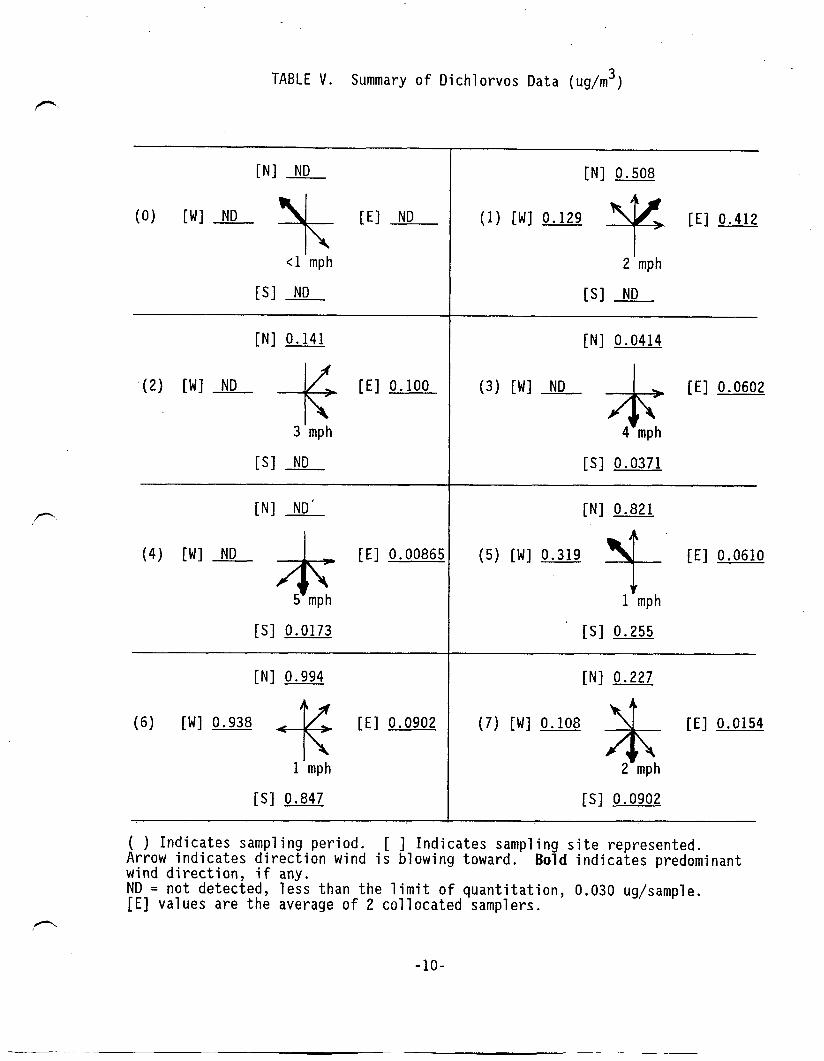
TABLE V. Summary of Dichlorvos Data (ug/m3)
WI JL
(0) WI ND
%
[El ND
<l mph
PI ND
[N] 0.141
(2) [WI ND
+
[E] 0.100
3 mph
PI ND
PI ND’
(4) [WI ND [E] 0.00865
[N] 0.994
(6) [W] 0.938
+ 1 mph
[S] 0.847
[E] 0.0902
[N] 0.508
[E] 0.412
2'mph
PI ND
[N] 0.0414
(3) WI ND [E] 0.0602
[S] 0.0371
[N] 0.821
(5) [W] 0.319 [E] 0.0610
t 1 mph
[S] 0.255
[N] 0.227
(7) [W] 0.108 [E] 0.0154
[S] 0.0902
( ) Indicates sampling period. [ ] Indicates sampling site represented. Arrow indicates direction wind is blowing toward. Bold indicates predominant wind direction, if any. ND = not detected, less than the limit of quantitation, 0.030 ug/sample. [E] values are the average of 2 collocated samplers.
-lO-