
Nairobi, 25 th /Oct. – 18 Dec 2010AMESD eStation users’ training. AMESD eStation users’...
39
Nairobi, 25 th /Oct. – 18 Dec 2010 AMESD eStation users’ training. AMESD eStation users’ training N 08. Precipitations products from RS Marco Clerici, JRC/IES/GEM
-
Upload
lindsey-stephens -
Category
Documents
-
view
215 -
download
0
Transcript of Nairobi, 25 th /Oct. – 18 Dec 2010AMESD eStation users’ training. AMESD eStation users’...
Nairobi, 25th/Oct. – 18 Dec 2010 AMESD eStation users’ training.
AMESD eStation users’ training
N 08. Precipitations products from RS
Marco Clerici, JRC/IES/GEM
Nairobi, 25th/Oct. – 18 Dec 2010 AMESD eStation users’ training.
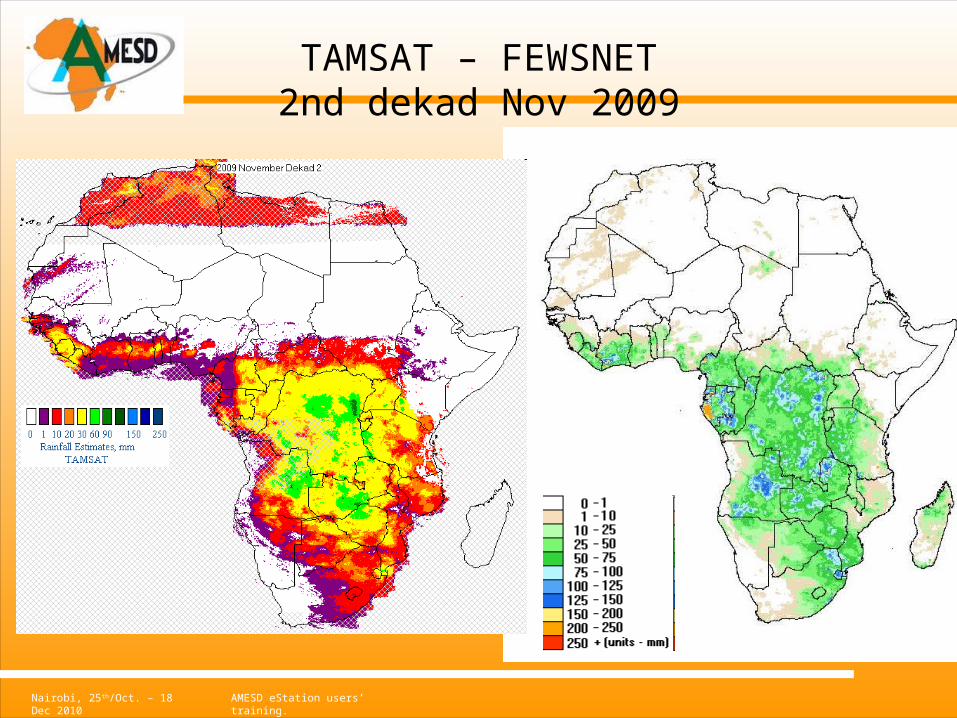
• TAMSAT product (UK)
• FEWSNET product (USA)
• MPE product (EUMETSAT)
Contents
Nairobi, 25th/Oct. – 18 Dec 2010 AMESD eStation users’ training.
TAMSAT Operational Rainfall Monitoring for Africa
David Grimes
TAMSAT*Dept of MeteorologyUniversity of Reading
U.K.
TAMSAT = Tropical Applications of Meteorology using SATellite data
Nairobi, 25th/Oct. – 18 Dec 2010 AMESD eStation users’ training.
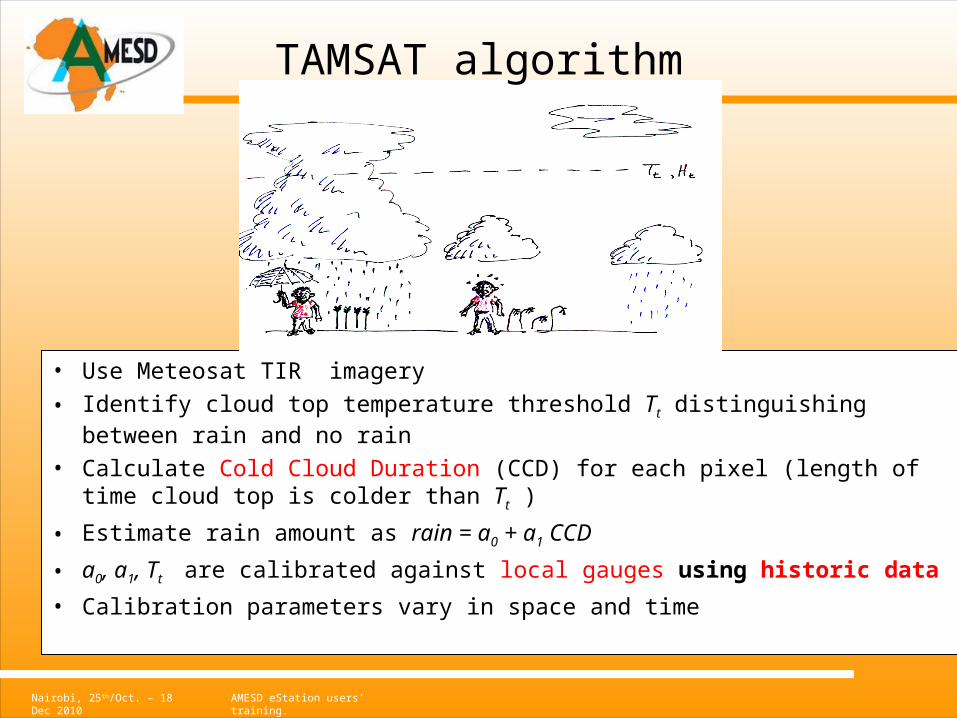
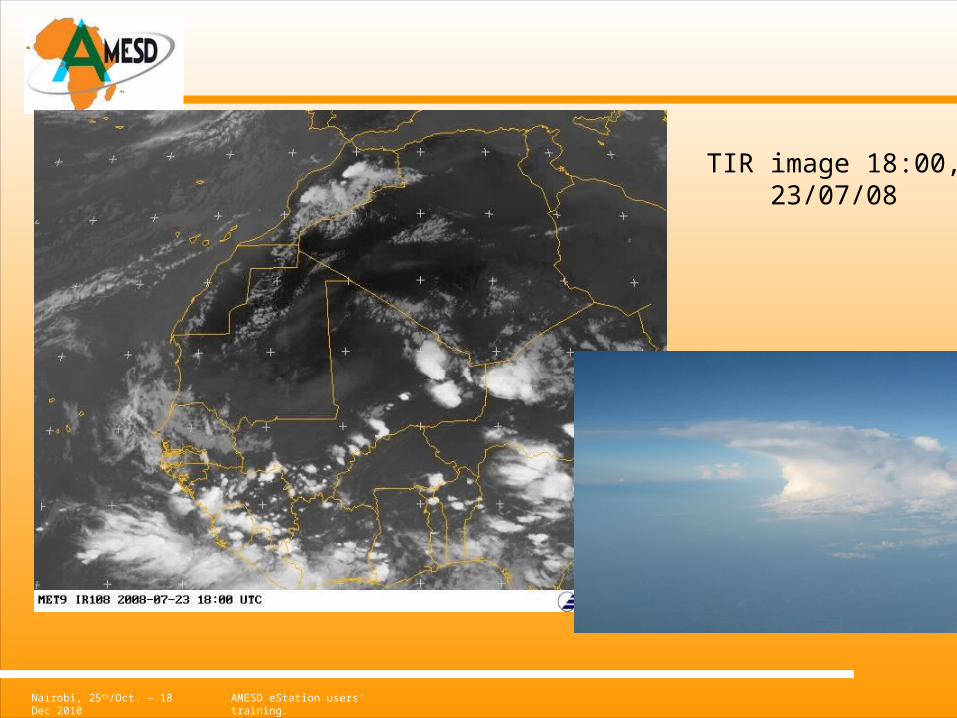
• Use Meteosat TIR imagery
• Identify cloud top temperature threshold Tt distinguishing between rain and no rain
• Calculate Cold Cloud Duration (CCD) for each pixel (length of time cloud top is colder than Tt )
• Estimate rain amount as rain = a0 + a1 CCD
• a0, a1, Tt are calibrated against local gauges using historic data
• Calibration parameters vary in space and time
TAMSAT algorithm
Nairobi, 25th/Oct. – 18 Dec 2010 AMESD eStation users’ training.
TIR image 18:00, 23/07/08
Nairobi, 25th/Oct. – 18 Dec 2010 AMESD eStation users’ training.
21/04/23
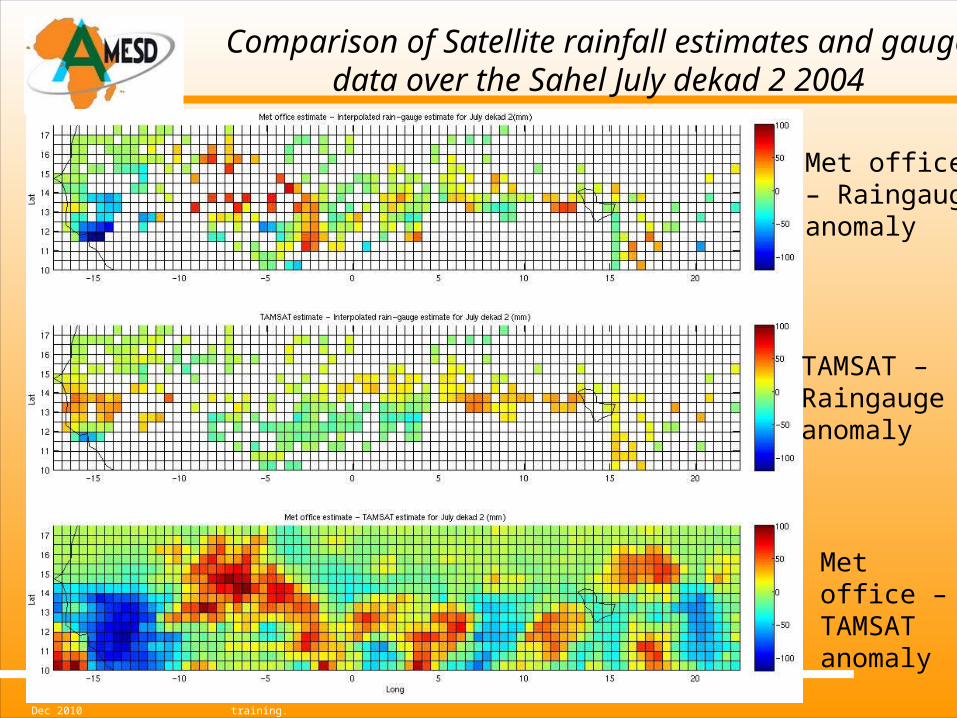
Comparison of Satellite rainfall estimates and gauge data over the Sahel July dekad 2 2004
Met office – Raingauge anomaly
TAMSAT – Raingauge anomaly
Met office – TAMSAT anomaly

Nairobi, 25th/Oct. – 18 Dec 2010 AMESD eStation users’ training.
TAMSAT Calibration zones
August
Calibration zones vary slightly from month to monthDifferently shaded areas show the different zones for August
Nairobi, 25th/Oct. – 18 Dec 2010 AMESD eStation users’ training.
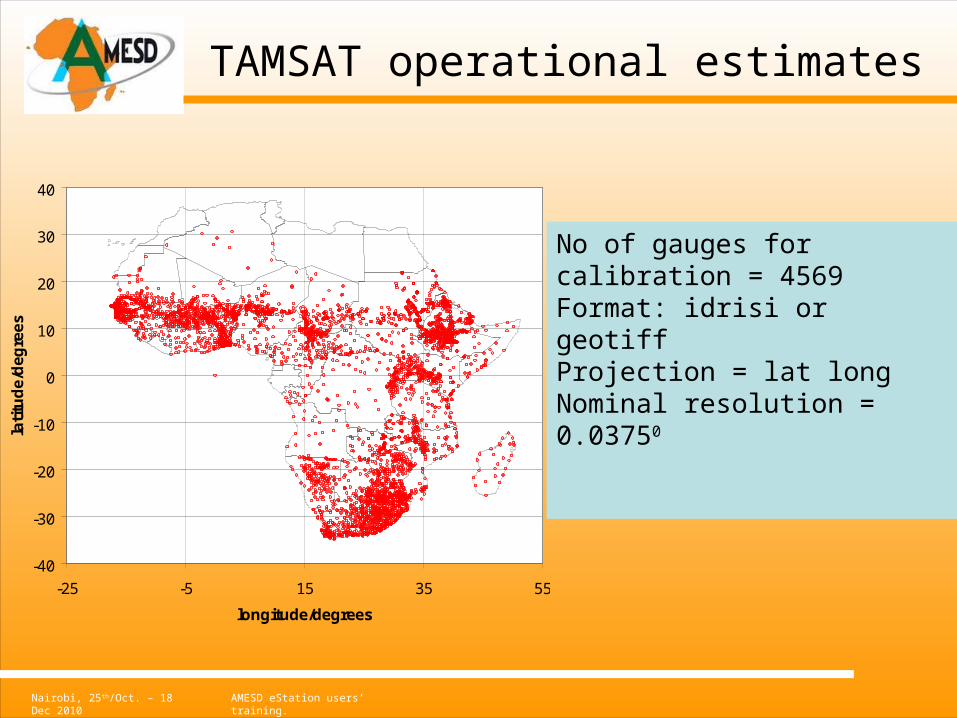
TAMSAT operational estimates
-40
-30
-20
-10
0
10
20
30
40
-25 -5 15 35 55
longitude/degrees
lati
tud
e/d
eg
ree
s
No of gauges for calibration = 4569Format: idrisi or geotiffProjection = lat longNominal resolution = 0.03750
Nairobi, 25th/Oct. – 18 Dec 2010 AMESD eStation users’ training.
9
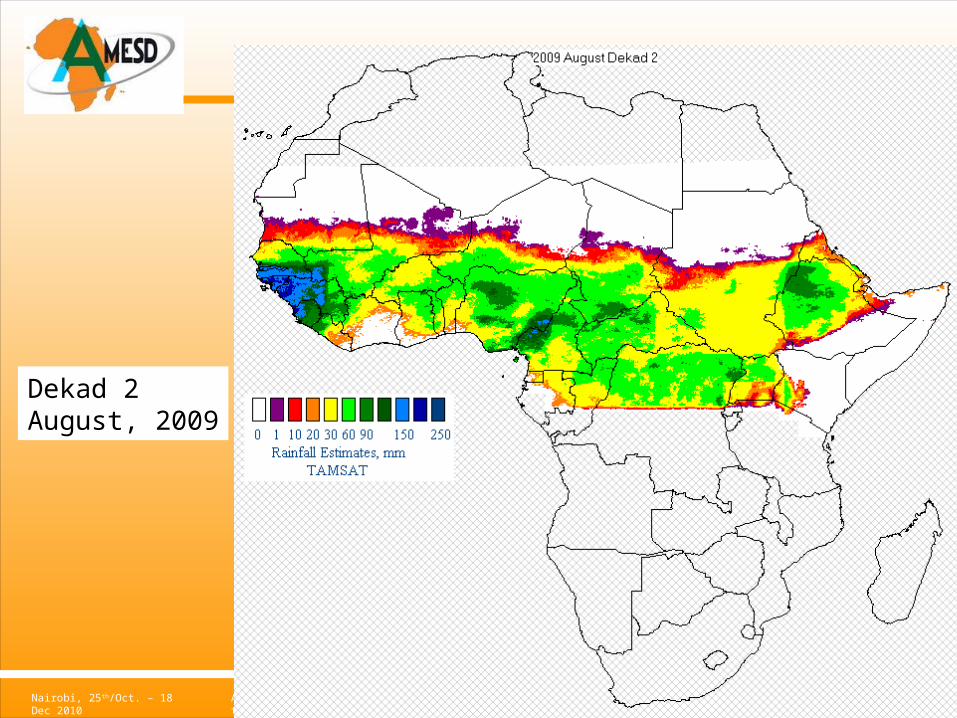
Dekad 2August, 2009
Nairobi, 25th/Oct. – 18 Dec 2010 AMESD eStation users’ training.
Validation of rainfall estimates
Question: How do we know if rainfall estimates are any good?
Answer: compare against independent data set.
For Africa, this usually means comparison against raingauge data
Nairobi, 25th/Oct. – 18 Dec 2010 AMESD eStation users’ training.
+
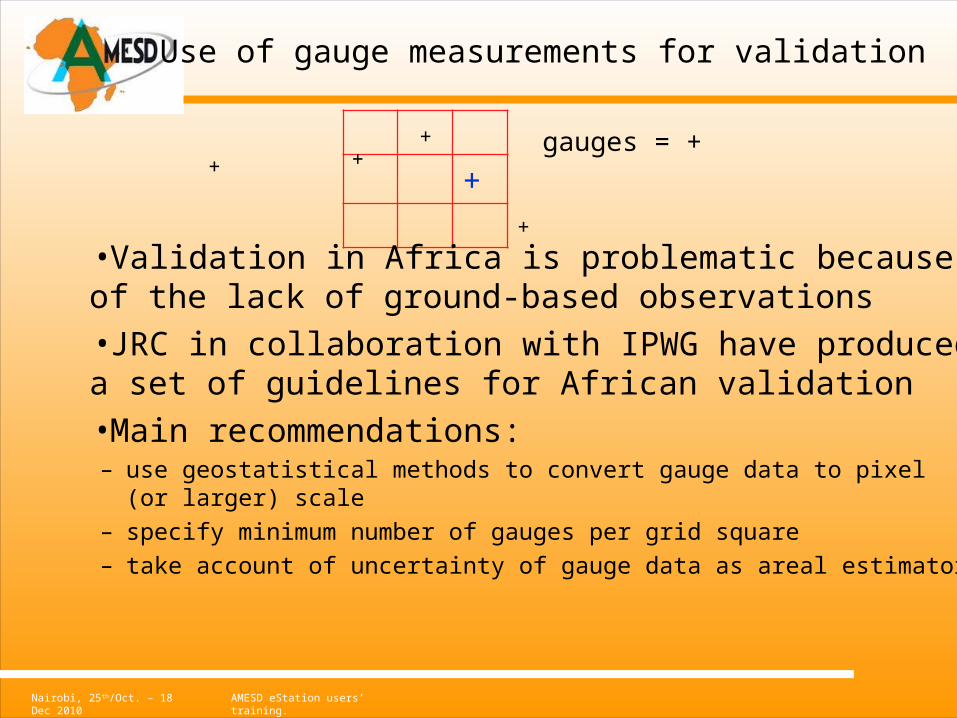
Use of gauge measurements for validation
•Validation in Africa is problematic because of the lack of ground-based observations•JRC in collaboration with IPWG have produced a set of guidelines for African validation•Main recommendations:– use geostatistical methods to convert gauge data to pixel (or larger)
scale– specify minimum number of gauges per grid square – take account of uncertainty of gauge data as areal estimator
gauges = +
+
++ +

Nairobi, 25th/Oct. – 18 Dec 2010 AMESD eStation users’ training.
Improved calibration
Calibration currently being updated and extended as part of the MARSOP3 project
Additional raingauge data provided by Meteoconsult
Old calibration New calibration
Nairobi, 25th/Oct. – 18 Dec 2010 AMESD eStation users’ training.
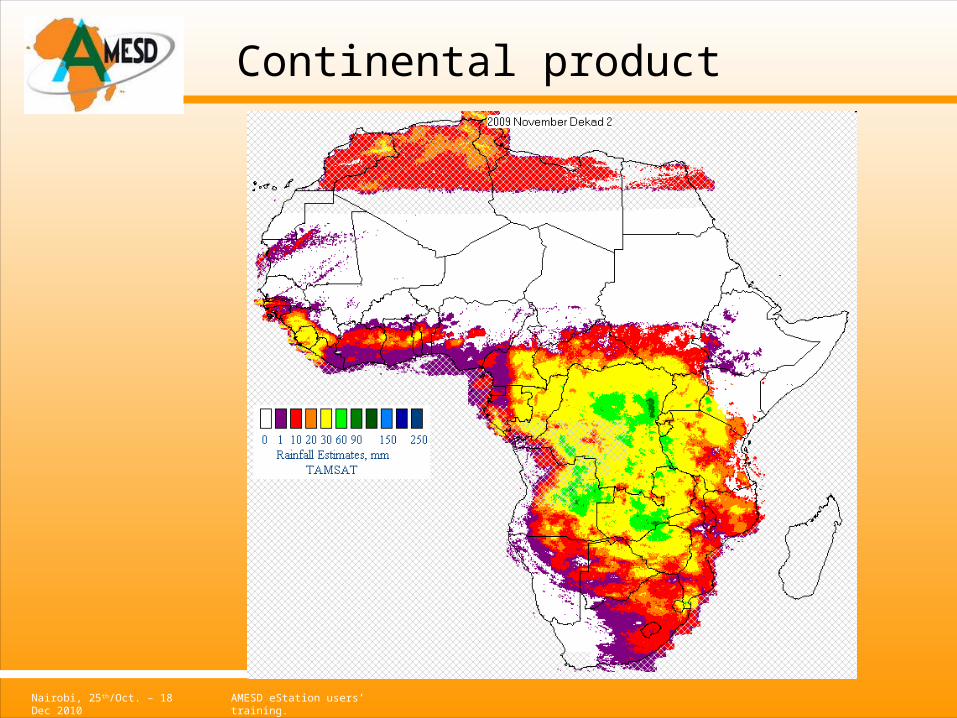
Continental product

Nairobi, 25th/Oct. – 18 Dec 2010 AMESD eStation users’ training.
TAMSAT: Conclusions
• TAMSAT algorithm provides good quality rainfall estimates for most of Africa
• The approach is successful because of careful calibration against local gauge data
• Current calibrations are being extended to cover all Africa + Arabian peninsula for all months
• Operational products being used by JRC, Agrhymet, Uganda, Sudan, Ethiopia
• Current research includes– 30 year time climatology and time series– improved algorithm using all MSG channels– ensemble estimation of uncertainty– applications to crop yield and hydrology
Nairobi, 25th/Oct. – 18 Dec 2010 AMESD eStation users’ training.
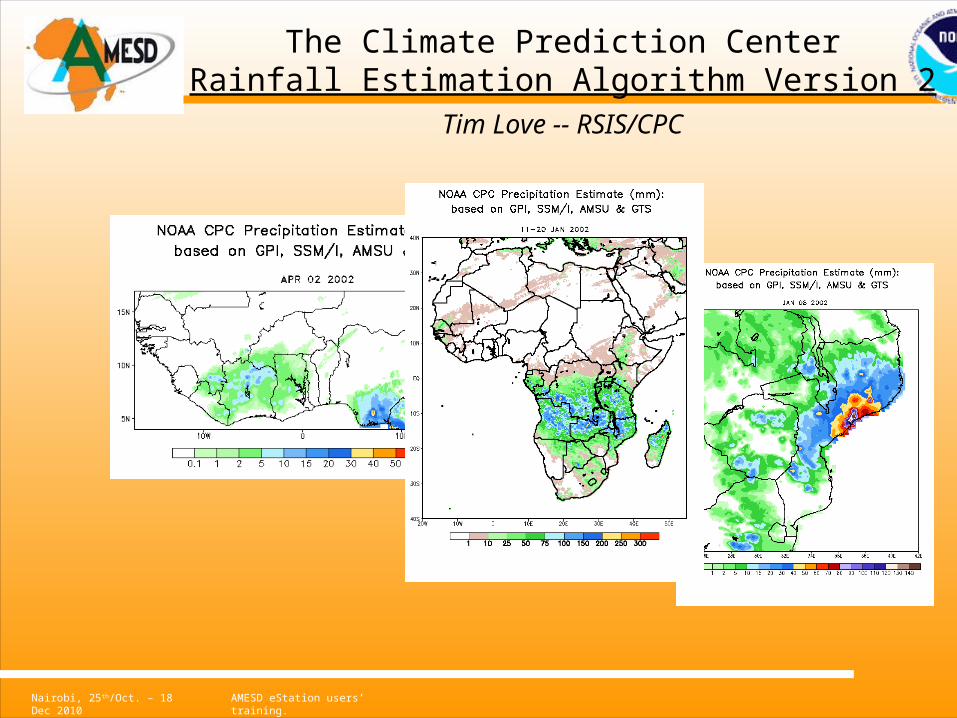
The Climate Prediction CenterRainfall Estimation Algorithm Version 2
Tim Love -- RSIS/CPC
Nairobi, 25th/Oct. – 18 Dec 2010 AMESD eStation users’ training.
RFE 2.0 Overview
• Run daily at NOAA CPC for Africa, southern Asia, Afghanistan area domains
• The Overall schema is:
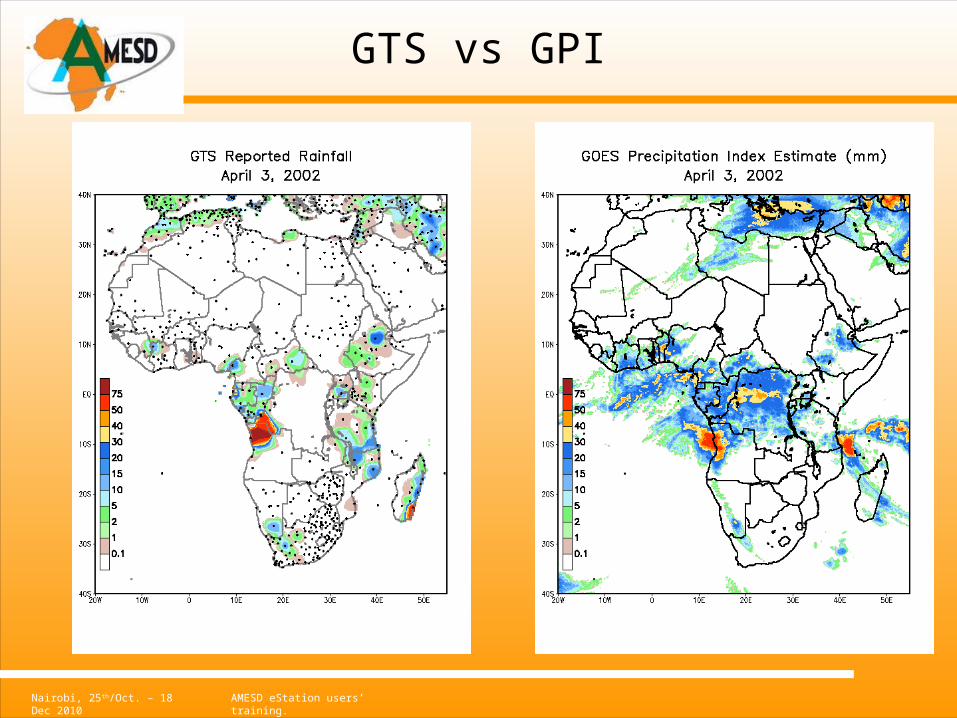
1. Use satellite IR temperature data (MSG) for the GOES Precipitation Estimate (GPI)
2. gauge fields (via GTS)3. Use microwave precip estimates (SSM/I & AMSU-B), 4. Combine the above products into RFE 2.0
Nairobi, 25th/Oct. – 18 Dec 2010 AMESD eStation users’ training.
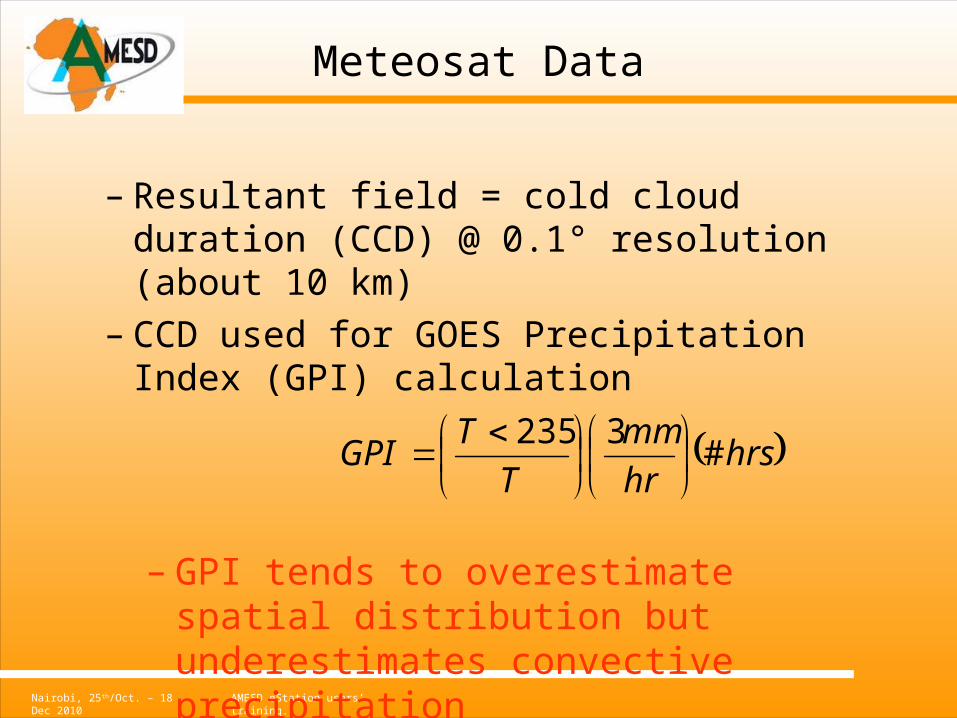
Meteosat Data
– Resultant field = cold cloud duration (CCD) @ 0.1° resolution (about 10 km)
– CCD used for GOES Precipitation Index (GPI) calculation
hrshr
mm
T
TGPI #
3235
– GPI tends to overestimate spatial distribution but underestimates convective precipitation
Nairobi, 25th/Oct. – 18 Dec 2010 AMESD eStation users’ training.
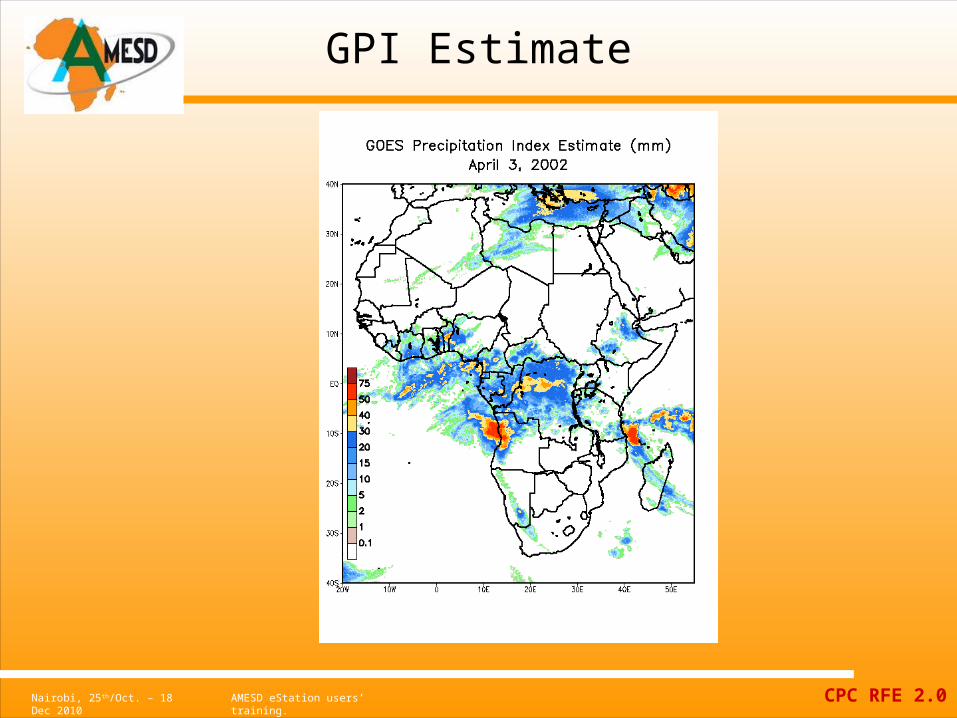
GPI Estimate
CPC RFE 2.0
Nairobi, 25th/Oct. – 18 Dec 2010 AMESD eStation users’ training.
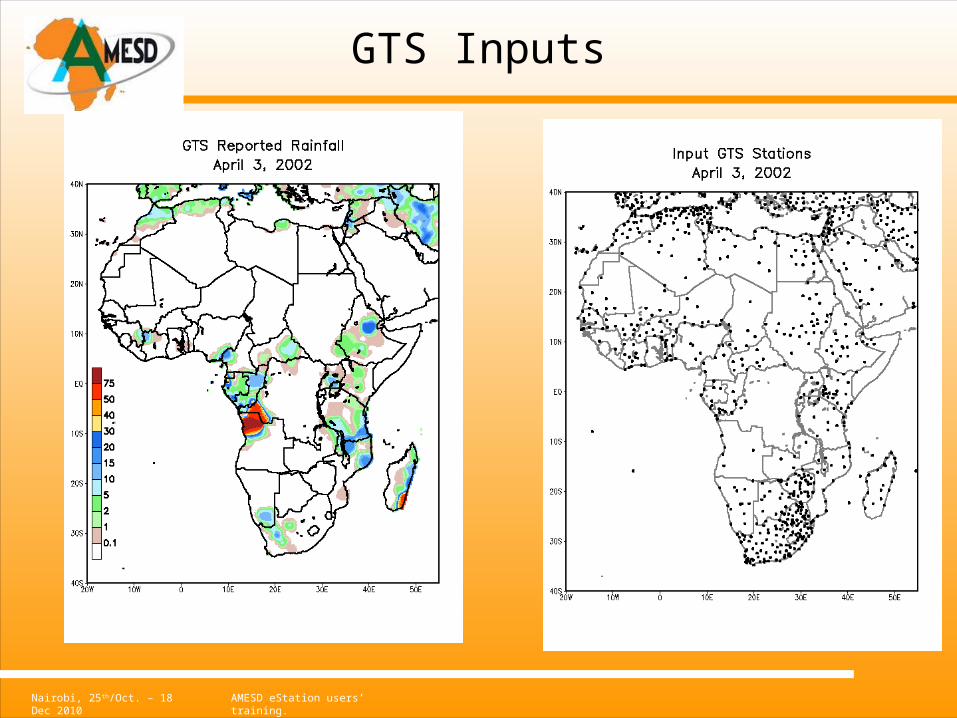
GTS Data
• 2534 stations available daily• Only 400-800 report daily• Few reports from Nigeria, none from Liberia,
Sierra Leone• Data ingested from GTS line, Quality Controlled,
fed to operational machine, then gridded to 0.1° resolution file
• Other station data may be readily used as input to algorithm via changing 2 tables in base code
• Requirements for RFE processing:– GPI and GTS inputs
GTS = Global Telecommunication System
Nairobi, 25th/Oct. – 18 Dec 2010 AMESD eStation users’ training.
GTS Inputs
Nairobi, 25th/Oct. – 18 Dec 2010 AMESD eStation users’ training.
GTS vs GPI
Nairobi, 25th/Oct. – 18 Dec 2010 AMESD eStation users’ training.
SSM/I: definition
Special Sensor Microwave/Imager
• a seven-channel, four-frequency, linearly polarized passive microwave radiometric system
• The instrument is flown onboard the US Air Force DMSP spacecraft
Nairobi, 25th/Oct. – 18 Dec 2010 AMESD eStation users’ training.
SSM/I Inputs
• 2 instruments estimate precip twice daily
~6 hourly data frequency• Fails to catch other rainfall in temporal
gaps• Data needs only small conversion in
preparation for input to algorithm
Nairobi, 25th/Oct. – 18 Dec 2010 AMESD eStation users’ training.
AMSU-B definition
• Advanced Microwave Sounding Unit
• 15-channel microwave radiometer installed on NOAA polar orbiting satellites.
Nairobi, 25th/Oct. – 18 Dec 2010 AMESD eStation users’ training.
• As with SSM/I, data is available 4 times daily, staggered temporally
• Tends to overestimate most precip, but does well with highly convective systems
• Data sent in HDF format, thus needs to be deciphered before input to RFE algorithm
• Preprocessing straightforward
AMSU-B Data
Nairobi, 25th/Oct. – 18 Dec 2010 AMESD eStation users’ training.
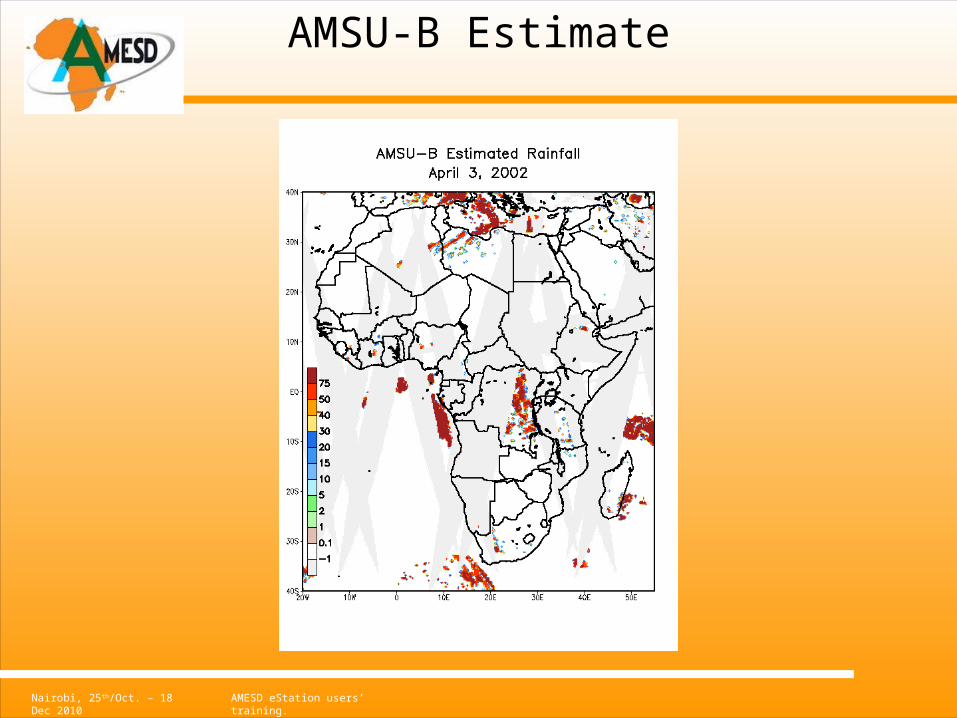
AMSU-B Estimate
Nairobi, 25th/Oct. – 18 Dec 2010 AMESD eStation users’ training.
Nairobi, 25th/Oct. – 18 Dec 2010 AMESD eStation users’ training.
TAMSAT – FEWSNET2nd dekad Nov 2009

Nairobi, 25th/Oct. – 18 Dec 2010 AMESD eStation users’ training.
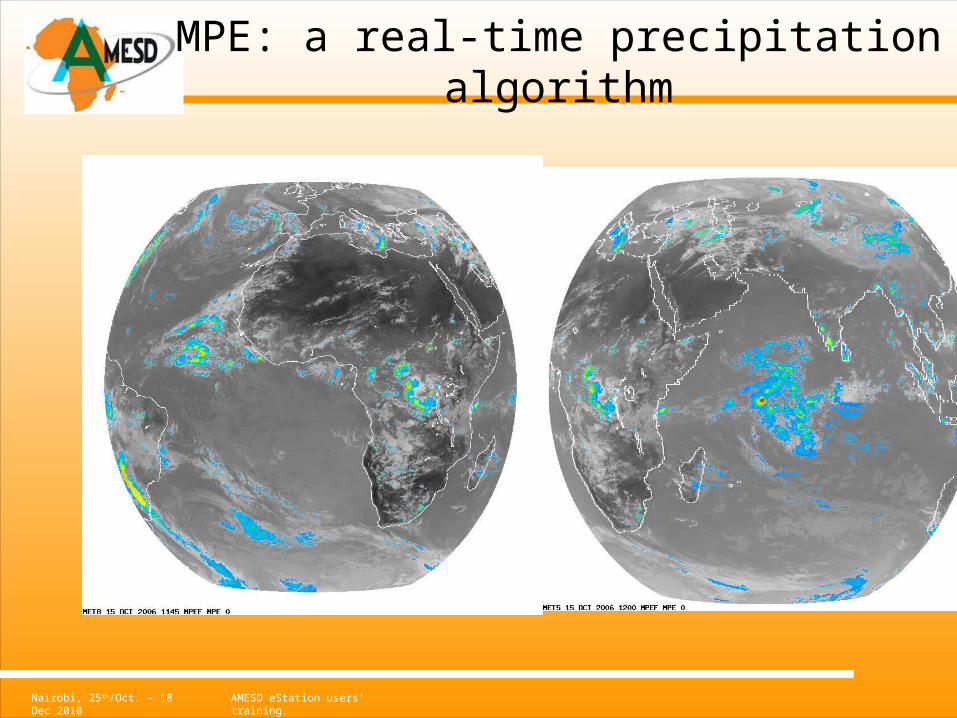
Multi-sensor Precipitation Estimate (MPE): An operational real-time rain-rate product
Thomas HeinemannMeteorological Operations DivisionEUMETSAT
Nairobi, 25th/Oct. – 18 Dec 2010 AMESD eStation users’ training.
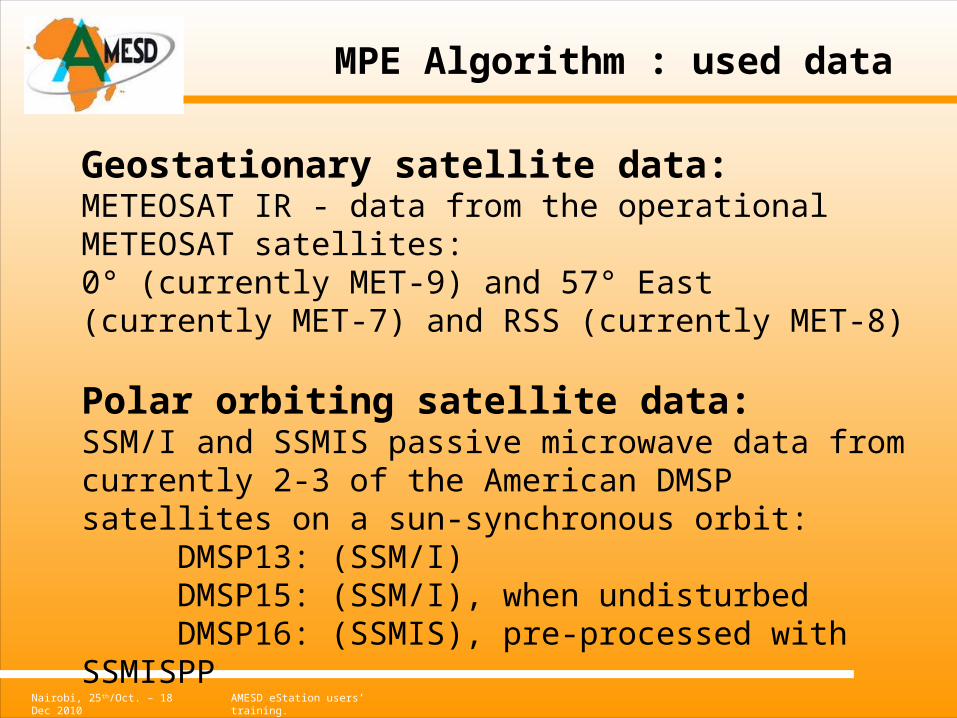
Geostationary satellite data:METEOSAT IR - data from the operational METEOSAT satellites:0° (currently MET-9) and 57° East (currently MET-7) and RSS (currently MET-8)
Polar orbiting satellite data:SSM/I and SSMIS passive microwave data from currently 2-3 of the American DMSP satellites on a sun-synchronous orbit:
DMSP13: (SSM/I) DMSP15: (SSM/I), when undisturbedDMSP16: (SSMIS), pre-processed with SSMISPP
MPE Algorithm : used data
Nairobi, 25th/Oct. – 18 Dec 2010 AMESD eStation users’ training.
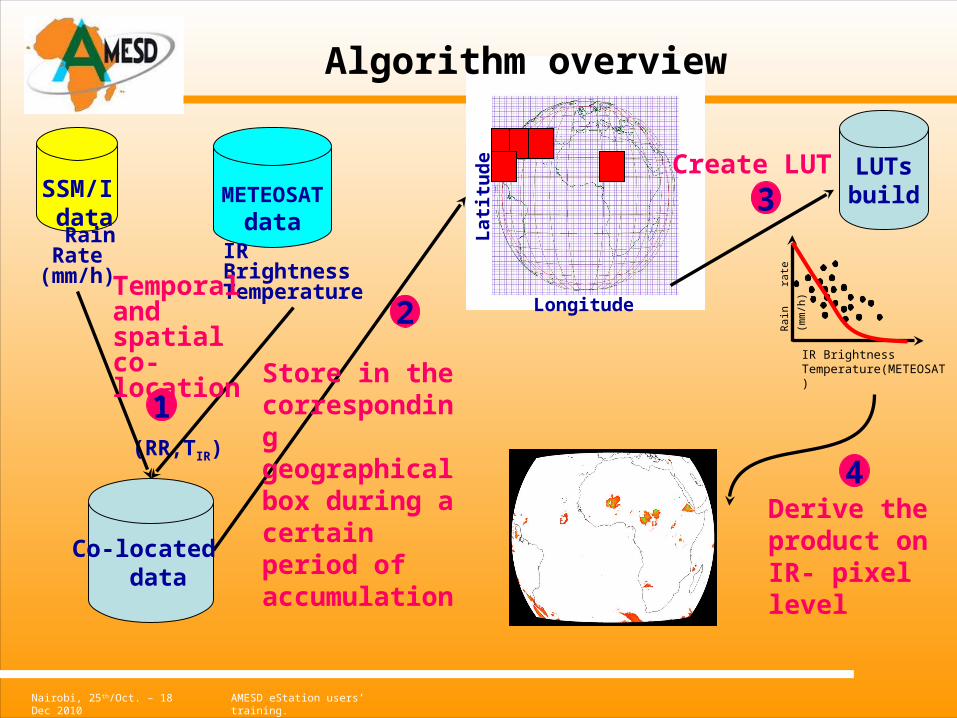
SSM/I data
Rain Rate (mm/h)
METEOSATdata
IR Brightness Temperature
Longitude
Lat
itu
de
Store in the corresponding geographical box during a certain period of accumulation
2IR Brightness Temperature(METEOSAT)
Rai
n rate
(m
m/h
)
LUTsbuild3
Create LUT
(RR,TIR)
Co-located data
1
Temporal and spatial co-location
Derive the product on IR- pixel level
4
Algorithm overview
Nairobi, 25th/Oct. – 18 Dec 2010 AMESD eStation users’ training.
MPE: a real-time precipitation algorithm

Nairobi, 25th/Oct. – 18 Dec 2010 AMESD eStation users’ training.
Validation against radar
Nairobi, 25th/Oct. – 18 Dec 2010 AMESD eStation users’ training.
Precipitation intensity & soil erosion / degradation

Nairobi, 25th/Oct. – 18 Dec 2010 AMESD eStation users’ training.
Impact of rain
• It is estimated that the erosion impact on the global scale is between 15 to 30 t/ha/yr, which equals 1 to 2 mm/yr soil loss.
• As a reference:
Introduction à la gestion conservatoire de l'eau, de la biomasse » (http://www.fao.org/docrep/T1765F/t1765f0d.htm)
Nairobi, 25th/Oct. – 18 Dec 2010 AMESD eStation users’ training.
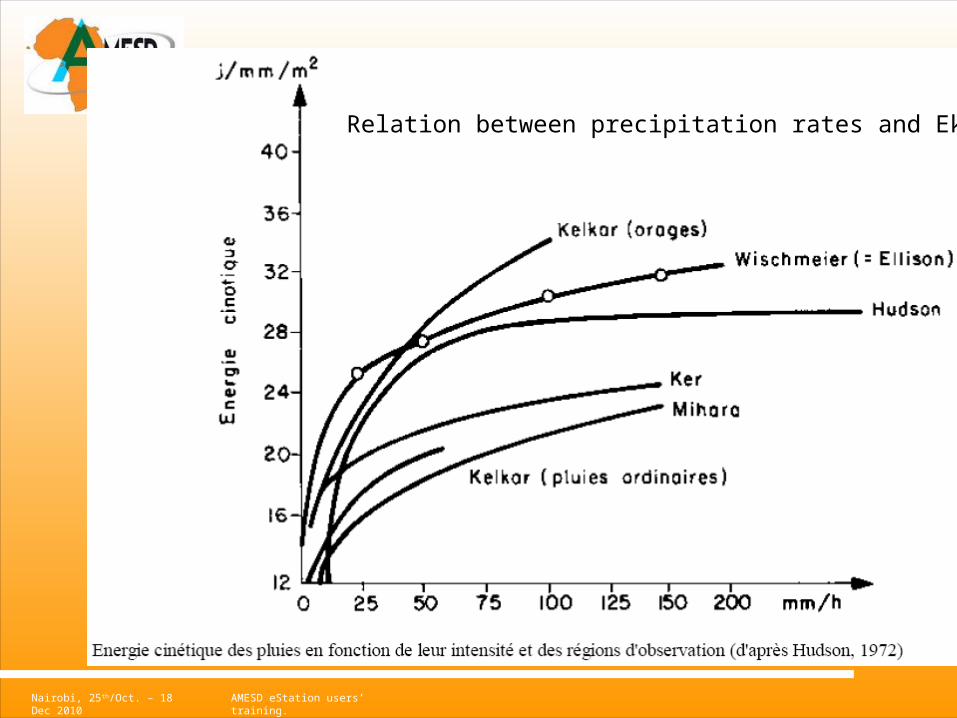
Relation between precipitation rates and Ek
Nairobi, 25th/Oct. – 18 Dec 2010 AMESD eStation users’ training.
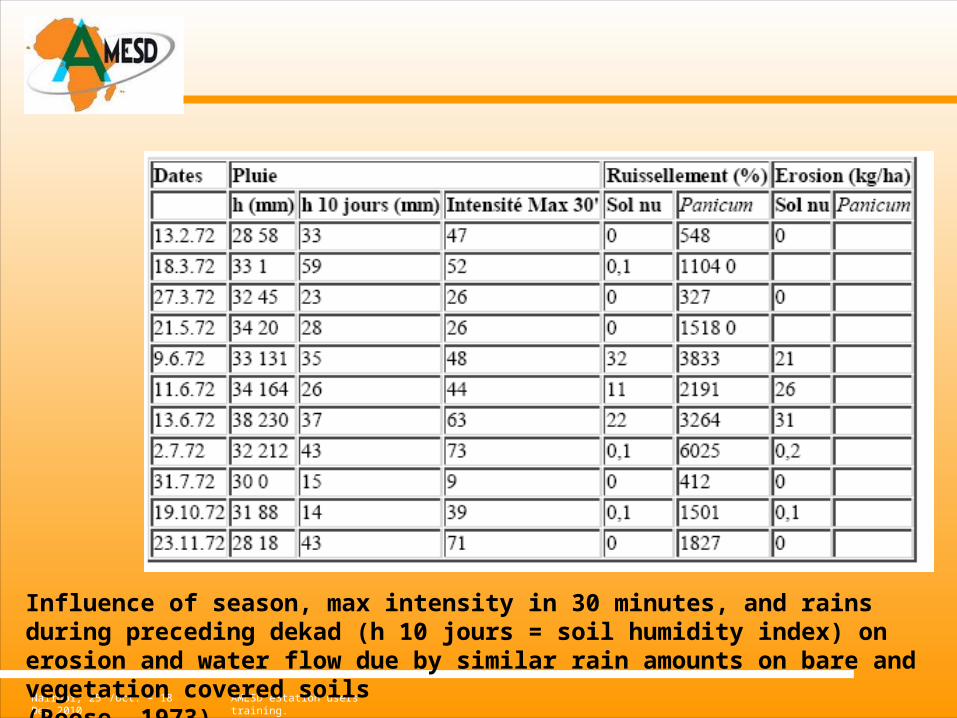
Influence of season, max intensity in 30 minutes, and rains during preceding dekad (h 10 jours = soil humidity index) on erosion and water flow due by similar rain amounts on bare and vegetation covered soils(Roose, 1973)
Nairobi, 25th/Oct. – 18 Dec 2010 AMESD eStation users’ training.
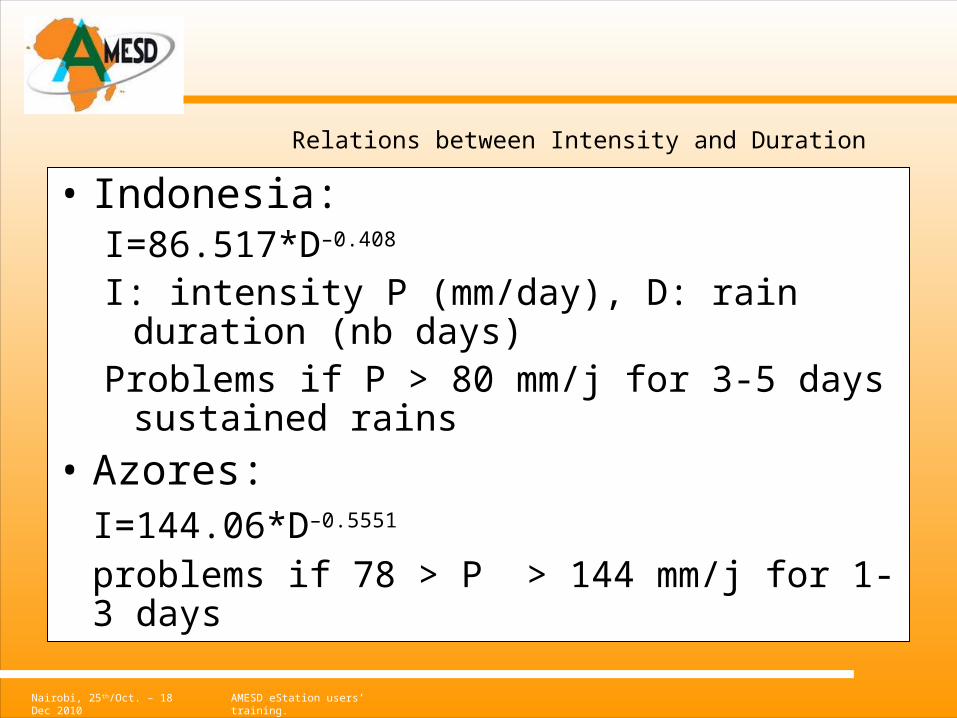
• Indonesia: I=86.517*D–0.408
I: intensity P (mm/day), D: rain duration (nb days)
Problems if P > 80 mm/j for 3-5 days sustained rains
• Azores: I=144.06*D–0.5551 problems if 78 > P > 144 mm/j for 1-3 days
Relations between Intensity and Duration
Nairobi, 25th/Oct. – 18 Dec 2010 AMESD eStation users’ training.
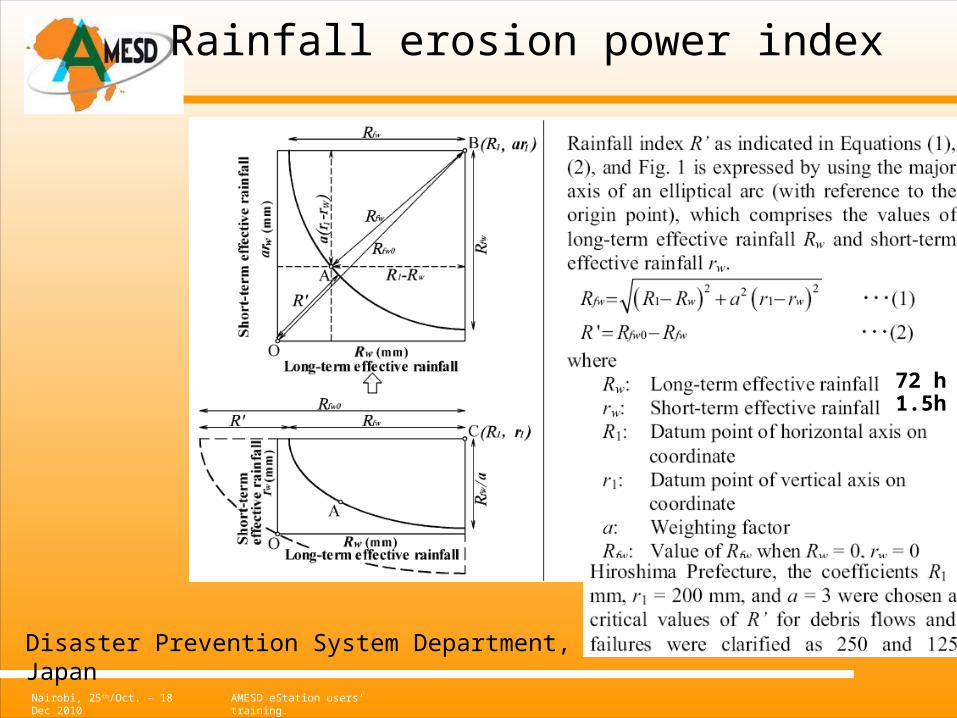
Rainfall erosion power index
Disaster Prevention System Department, Fukken Co, Japan
72 h1.5h