NAFTA UPDATE : A MEXICAN P - usapple.orgusapple.org/wp-content/uploads/2017/08/KarenAntebi.pdf ·...
21
NAFTA U PDATE : A M EXICAN P ERSPECTIVE K AREN A NTEBI T RADE AND NAFTA O FFICE S ECRETARÍA DE E CONOMÍA M ÉXICO
Transcript of NAFTA UPDATE : A MEXICAN P - usapple.orgusapple.org/wp-content/uploads/2017/08/KarenAntebi.pdf ·...

NAFTA UPDATE: A MEXICAN PERSPECTIVE
KAREN ANTEBIT R A D E A N D N A F TA O F F I C E
S E C R E TA R Í A D E E C O N O M Í AM É X I C O

Mexico is a growing economy
Source: INEGI, SE-DGIE (Dec. 2016), WTO, UNCTAD, Brookings Institution, SHCP.
Mexico has built a solid framework for macroeconomic stability in the past two decades.
Total Exports$374 billion
The 15th largest world economy 10th largest world exporter and 1st in Latin
America 9th largest world importer 5th leading recipient of FDI among
emerging economies
$1.2 trillion economy $776 billion in total trade $457 billion in FDI attracted
since 1999 125 million consumer market/
60% middle class
GDP
1.4%2013
2.3%
2014
2.6%
20152.3%
2016
Total Imports$387 billion

… and a magnet for investment
The U.S. is Mexico’s #1 source of foreign direct investment, accounting for 46% of total FDI.
More than 66,000 companies in Mexico have FDI.
Source: Mexico’s Ministry of the Economy.
Accumulated FDI in MexicoBillion dollars
1999
2000
2001
2002
2003
2004
2005
2006
2007
2008
2009
2010
2011
2012
2013
2014
2015
2016
1432
62 86105
130 156177
209238
256284 308
330377
405 438465
U.S. Others
Source: SE-Washington with data from DGIE. Other includes agriculture, utilities, construction, transport and storage, and services such as professional, educational, health, hospitality, entertainment and other. */ January-December.
1999-2016*
FDI in Mexico by industryas a % of total
Manufacturing49%
Financial Services
15%
Commerce7%
Mining5%
Telecom.5%
Other19%

17.9
Mexico1.1
United States
North America represents 18% of global exports
North America exports $2.3 trillion in goods worldwideCanada
1.5
North America: a dynamic economic powerhouse
Regional GDP (trillion $)
NAFTA created a thriving regional market of 480 million people and a combined GDP of over $20 trillion.
Source: SE with data from IMF and WTO.

Recognizing the importance of NAFTA
Trilateral trade has more than tripled, reaching nearly $1 trillion in 2016.
Source: SE with import data from Statistics Canada, Banxico, and USDOC, and World Bank.
0
200
400
600
800
1000
1200
1993 1994 1995 1996 1997 1998 1999 2000 2001 2002 2003 2004 2005 2006 2007 2008 2009 2010 2011 2012 2013 2014 2015 2016
1,122
1,033997
Mexico-Canada Trade U.S.-Canada Trade Mexico-U.S. Trade
289
699626602
661568
506476419
376338
893846
772
942
699
880
1,010
615
1,059
NAFTA 1,075
Trilateral Trade between the NAFTA Partners

Since NAFTA, U.S.-Mexico trade has multiplied by six
0
100
200
300
400
500
1993 1998 2003 2008 2013 2016
42 79 97 152226 231
4095
138
216
280 294
U.S. Exports to Mexico U.S. Imports from Mexico
$ Bi
llion
82
174
235
367
507 525
NAFTA
Source: USDOC.
We trade over $1 million per minute.

Source: USDOC . BRICS includes Brazil, Russia, India, China, and South Africa
Mexico is the U.S.’s second-largest export market and second-largest supplier of goods
U.S. exports to Mexico represents more than 16% of its sales worldwide.
Mexico market share of US total imports = 13%
116
130
163
180
231
U.S. Exports 2016
Billion dollars
Mexico
BRICS
UK, Germany, France & Italy
Hong Kong, Taiwan, Singapore, & South Korea
Buys more than:
260
259
294
U.S. Imports 2016
Billion dollars
Mexico
UK, Germany, France & Italy
Japan, South Korea, Taiwan &
Singapore
Supplies more than:
China

Nearly 5 million U.S. jobs depend on trade in goods and services with Mexico
Source: Jobs figures are from 2014, according to Growing Together: Economic Ties between the
United States and Mexico, Mexico Institute, Woodrow Wilson International Center for Scholars,
2016.
(Jobs in thousands)
#REF!#REF!
#REF! #REF!
#REF!#REF!
#REF!
#REF!
#REF!#REF!
More than 10050 - 99Less than 50
MD
MA
CTRI
NJ
WA106.8
HI
DE
NH
VTME
NC
SC
FL
GA
VA
NYWV
PAOH
KY
TN
MS
LA
AR
IN
MI
IL
WI
IA
MN
MO
OK
TX
KS
NE
SD
NDMT16.8
WY
CO
NM
AK
AZ
UTNV
CA
OR ID
565.5
89.3
382.065.4
151.599.7
200.2 178.2
138.0
199.9
322.2
152.5
70.4
61.397.4
96.3
53.1
47.7
92.9
133.8
AL
290.2
57.223.3
43.6 46.7
9.1
88.0
26.810.7
23.6
50.6
33.9
15.4
13.4
41.6
40.8 67.2
95.5
23.3
11.4 22.4
22.1118.516.961.1
140.815.2
96.5
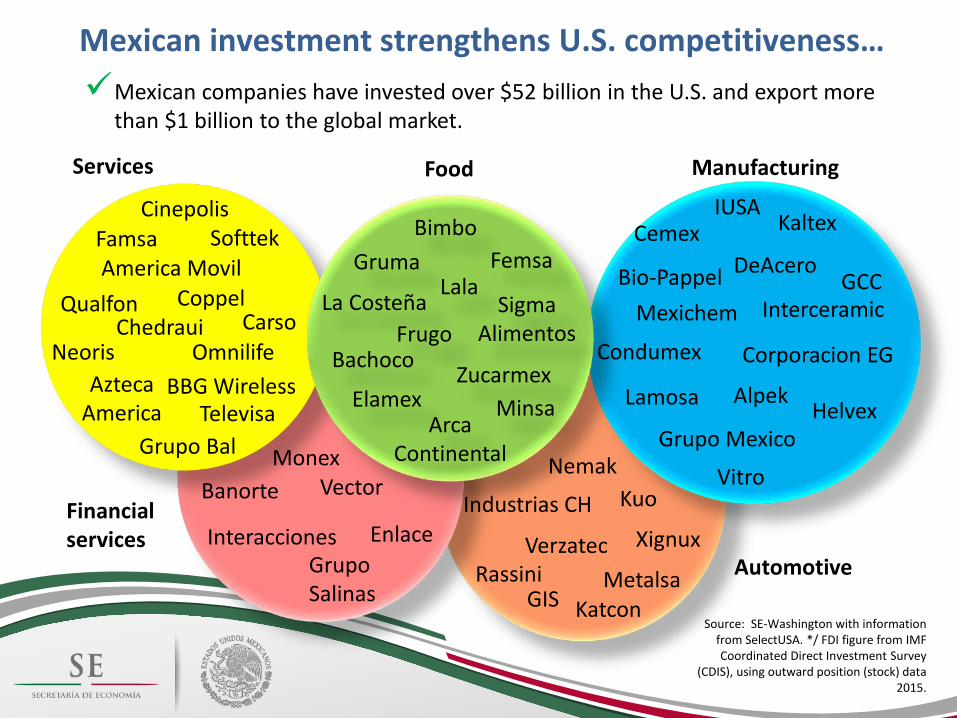
Mexican investment strengthens U.S. competitiveness…Mexican companies have invested over $52 billion in the U.S. and export more
than $1 billion to the global market.
Source: SE-Washington with information from SelectUSA. */ FDI figure from IMF Coordinated Direct Investment Survey
(CDIS), using outward position (stock) data 2015.
ManufacturingServices Food
Industrias CHBanorte
KatconRassini
Kuo
Metalsa
GCC
Cemex
Alpek
Grupo Mexico
Mexichem
Kaltex
Bio-Pappel
Lamosa
IUSA
Interceramic
DeAcero
Vitro
Condumex
Helvex
Corporacion EG
Nemak
GIS
Verzatec Xignux
MonexVector
EnlaceInteracciones
Cinepolis
Chedraui
Grupo Bal
SofttekAmerica Movil
TelevisaAzteca
America
Coppel
BBG Wireless
Famsa
Qualfon
OmnilifeNeorisCarso
Grupo Salinas
Financial services
Automotive
GrumaLala
Bachoco
Bimbo
La Costeña
Minsa
Sigma Alimentos
Femsa
Arca Continental
ElamexZucarmex
Frugo

#REF!
#REF!
#REF!
#REF!
#REF!
#REF!#REF!
MD
MA
CTRI
NJ
WA
DE
NH
VT ME
NC
SC
FL
GA
VA
NYWV
PAOH
KYTN
MS
LA
AR
IN
MI
IL
WI
IA
MN
MO
OK
TX
KS
NE
SD
NDMT2.7%
WY
CO
NMAZ
UTNV
CA
OR ID
15.4%
37.8%
39.8%11.6%
10.1%14.2%
15.9% 13.1%
22.1%
10.0%
4.0%
9.9%
6.8%
7.7%18.4%
14.5%
19.0%
18.5%
12.2%
6.7%
AL
5.4%
1.4%4.8%
5.1% 6.1%
3.4%
14.2%
42.9%
10.7%
22.9%
24.7%
6.1%
12.0%
9.9% 12.7%
14.1%
3.6%
4.3%1.6%
10.7%9.6%9.2%7.4%8.3%3.2%
4.5%
2.5%
1
2
2 22
2
2
2
2
2 22
2
22
2 3
1 1
1
3
2
22
2
2
2
1
13
3
Mexico is an important export destination for each U.S. state
Source: SE- NAFTA with data from Wisertrade.
Mexico’s Share in U.S. Exports by State 2016Mexico ranks among the top 3 export markets for 31 states
1 2 3 Mexico’s rank as an export market for the state
More than 15%Between 10% and 15%
Less than 10%
% in Total Exports

Mexico Canada Malaysia South Korea China Japan
40%
25%
8%5% 4.0%
2%
Mexico is a strategic production partner for U.S. goods and exports worldwide
When Mexico exports, the United States exports. • There is a 40% U.S. value-added in Mexico’s exports to the U.S.
Source: NBER, Global Value database in Koopman, Powers, Wang, Wei (September 2010, revised March 2011)
MEXICO
U.S. exports also benefit from Mexico’s network of free trade agreements with 46 countries, providing preferential market access to 70% of world GDP and two-thirds of global imports.
Mexico and the United States do not simply trade
goods; we work together
to manufacture them
U.S. value added in final exports of selected countries to the U.S.

U.S. – Mexico trade is not only large, but also diversified…
7.6
5.0
1.1
11.6
7.3
8.1
8.6
5.3
17.0
26.2
58.4
99.5
3.3
10.4
16.7
7.0
10.0
10.7
9.6
21.7
18.9
16.3
42.9
31.8
U.S. imports from Mexico U.S. exports to Mexico
Source: SE-Washington with data from USDOC.
Computer & electronic products
Electrical equipment
Transportation equipment
Machinery
Chemicals
Oil refined products
Fabricated metal products
Primary metal manufacturing
Processed foods
Plastics
Agricultural products
2016 US-Mexico Trade by Sector
Billions of US dollars
Oil & gas

Agricultural trade is bigger and more integrated in North America
Canada is the US´ #1 exportmarket and supplier
Source: USDOC and Canada Statistics. Agricultural products include chapters 1 – 24 HS
Mexico is the US´#3 export marketand #2 supplier Canada is Mexico´s #3 export
market and #2 supplier

Mexico buys 8% of total U.S. apple production25% of ALL U.S. apple exports go to Mexico
$230 millionMexico
Source: United States Census Bureau; HS: 080810 Apples, Fresh;2016 Value of Apple Exports USD
ROW

15

Challenges
Expand NAFTA benefits to all sectors and regions of the three countries.
Streamline regional integration.
Strengthen regional value chains.
Efficient border management.
Develop new elements of competitiveness.
Rising protectionism.

NAFTA 2.0
NAFTA modernization should rely on:
Liberalization Goods Services Investment
Economic integration Supply chains Energy Talent
Competitiveness Innovation Trade facilitation Regulatory cooperation Border efficiency

NAFTA 2.0
A NAFTA 2.0 should be based on four pillars:
Strengthening the competitiveness of North America;
A more inclusive and responsible regional trade;
Addressing the 21st century economy;
Certainty for investment.

It is time to speak up in favor of free trade
Globalization and technology are here to stay.
Trade is part of the solution.
A strong North America is key to our ability to compete in world markets.

Globalization and technology are here to stay.
A strong North America is key to our ability to compete in world markets.
Trade is part of the solution.
It is time to speak up

Karen AntebiTrade and NAFTA Office
SECRETARÍA DE ECONOMÍAMÉXICO
[email protected] Trade
www.naftamexico.net More information:
[email protected](202) 728-1705
Washington, DC