NAC/AEGL Committee meeting, April 2009 - US EPA · Chemical Staff Scientist CM Reviewer Reviewer...
145
, ATTACHMENT 1 National Advisory Committee for Acute Exposure Guideline Levels for Hazardous Substances NAC/AEGL-48 April 14-16, 2009 Hilton- Old Town Alexandria 1867 King Street Alexandria, VA AGENDA Tuesday, April 14, 2009 \0:00 a.m. 11 :00 11: 15 II :30 11:35 12:00 p.m. 1:00 1:30 2:15 3: 15 3:30 4:30 5:30 *Development team meetings: Phosgene oxime; Perfluoroisobutylene; Perchloryl fluoride Introductory remarks and approval ofNAC/AEGL-47 Highlights (George Rusch, Ernie Falke, and Paul Tobin) Chemical List Update (Paul Tobin) Status Update/ Insufficient Data Chemicals: Diacetylmorphine; Fluoroacetate salts; Methyl fluoroacetate; Methoxyethylmercuric acetate; Monofluoroacetic acid; Paraquat; Phencyclidine; Sodium fluoroacetate; Tetraethylpyrophosphate; Tetramethylenedisulfotetramine; Tungsten hexafluoride (Cheryl Bast/ Bob Young) Methyl Iodide- Status Update (Alan Becker/Sylvia Talmage) Arsenic pentoxide and Arsenic trichloride- Discussion of potential approach for AEGL Derivation (Bob Young) Lunch Discussion on Oral to Inhalation Extrapolation (George Rusch) Review of Calcium cyanide, potassium cyanide, and sodium cyanide (Ralph Gingell/Cheryl Bast) Review of Phosgene oxime (Jim Holler/BobYoung) Break Review ofPerfluoroisobutylene (George Rusch/Cheryl Bast) Revisit of Ricin- New data (Jim Holler /Bob Young) Adjourn for the day Wednesday, April IS, 2009 8:30 a.m. *Development team meetings: Carbamate Pesticides (Aldicarb, Carbofuran, Methomyl, 9:30 10:30 12:00 p.m. 1:00 2:00 3:00 3: 15 4:15 5:30 oxamyl); Tellurium hexafluoride Discussion of data for Gasoline AEGLs (Russ White, American Petroleum Institute) Phosgene- Discussion of recent data (Juergen Pauluhn, Bayer HealthCare AG) Lunch Review of Aldicarb (Paul Tobin/Sylvia Talmage) Review of Carbo fur an (Paul Tobin/Bob Young) Break Review of Ox amyl (Paul Tobin/Sylvia Talmage) Review of Methomyl (Paul Tobin/Sylvia Talmage) Adjourn for the day Thursday, April 16, 2009 Review of Tellurium hexafluoride (Roberta Grant/Jennifer Rayner/Cheryl Bast) Review of Perch lory I fluoride (Glenn Leach/Dana Glass) 8:30 a.m. 9:30 II :00 II :30 *See page 2. Administrative matters Adjourn meeting ANY INFORMATION DISCUSSED AT THE NACIAEGL MEETINGS IS CONSIDERED PUBLIC INFORMATION
Transcript of NAC/AEGL Committee meeting, April 2009 - US EPA · Chemical Staff Scientist CM Reviewer Reviewer...

, ATTACHMENT 1
National Advisory Committee for Acute Exposure Guideline Levels for Hazardous Substances
NAC/AEGL-48 April 14-16, 2009
Hilton- Old Town Alexandria 1867 King Street Alexandria, VA
AGENDA
Tuesday, April 14, 2009
\0:00 a.m.
11 :00
11: 15 II :30
11:35
12:00 p.m. 1:00 1:30
2:15 3: 15 3:30 4:30 5:30
*Development team meetings: Phosgene oxime; Perfluoroisobutylene; Perchloryl
fluoride Introductory remarks and approval ofNAC/AEGL-47 Highlights (George Rusch, Ernie Falke, and Paul Tobin) Chemical List Update (Paul Tobin) Status Update/ Insufficient Data Chemicals: Diacetylmorphine; Fluoroacetate salts; Methyl fluoroacetate; Methoxyethylmercuric acetate; Monofluoroacetic acid; Paraquat; Phencyclidine; Sodium fluoroacetate; Tetraethylpyrophosphate; Tetramethylenedisulfotetramine; Tungsten hexafluoride (Cheryl Bast/ Bob Young) Methyl Iodide- Status Update (Alan Becker/Sylvia Talmage) Arsenic pentoxide and Arsenic trichloride- Discussion of potential approach for AEGL Derivation (Bob Young) Lunch Discussion on Oral to Inhalation Extrapolation (George Rusch) Review of Calcium cyanide, potassium cyanide, and sodium cyanide (Ralph Gingell/Cheryl Bast) Review of Phosgene oxime (Jim Holler/BobYoung) Break Review ofPerfluoroisobutylene (George Rusch/Cheryl Bast) Revisit of Ricin- New data (Jim Holler /Bob Young) Adjourn for the day
Wednesday, April IS, 2009 8:30 a.m. *Development team meetings: Carbamate Pesticides (Aldicarb, Carbofuran, Methomyl,
9:30 10:30 12:00 p.m. 1:00 2:00 3:00 3: 15 4:15 5:30
oxamyl); Tellurium hexafluoride Discussion of data for Gasoline AEGLs (Russ White, American Petroleum Institute) Phosgene- Discussion of recent data (Juergen Pauluhn, Bayer HealthCare AG)
Lunch Review of Aldicarb (Paul Tobin/Sylvia Talmage) Review of Carbo fur an (Paul Tobin/Bob Young) Break Review of Ox amyl (Paul Tobin/Sylvia Talmage) Review of Methomyl (Paul Tobin/Sylvia Talmage) Adjourn for the day
Thursday, April 16, 2009 Review of Tellurium hexafluoride (Roberta Grant/Jennifer Rayner/Cheryl Bast) Review of Perch lory I fluoride (Glenn Leach/Dana Glass)
8:30 a.m. 9:30 II :00 II :30
*See page 2.
Administrative matters Adjourn meeting
ANY INFORMATION DISCUSSED AT THE NACIAEGL MEETINGS IS CONSIDERED PUBLIC INFORMATION

Tues. 4/14/09
Wed. 4/15/09
Pre-meeting Small Discussion Groups: NAC-48
Chemical Staff Scientist CM Reviewer Reviewer Other Attendees
Phosgene oxime Young Holler Becker Willhite Anderson, Benson, Cushmac, Niemeier, Sudakin
Perfluoroisobutylene Bast Rusch Ripple Freshwater Beasley, Bernas, Gingell, Heinz, Woolf
Perchloryl Fluoride Glass/Talmage Leach Hinz Chapman Baril, Camacho, Grant, van Raaij, Woodall
Carbamates: Tobin Anderson Sudakin Becker, Benson, Camacho, Aldicarb Talmage Freshwater, Gingell, Hinz, Holler, Carbofuran Young Neimeier,Ripple, Rusch, Methomyl Talmage Willhite, Woolf Oxamyl Talmage
Tellurium hexafluoride Rayner/Bast Grant Woodall Beasley Baril, Bernas, Chapman, Cushmac, Heinz, Leach, vanRaaij
At this time, the following chemicals do not have a formal pre-meeting discussion scheduled: Cyanide salts; Ricin
ANY INFORMATION DISCUSSED AT THE NACIAEGL MEETINGS IS CONSIDERED PUBLIC INFORMATION.

NA/~'/:\ ~'.CL, Meeting 48: April 14-16, 2009
Chetnicat: (£f)~A;:~~~_-'; f}~AS£(l..J' ~-rl ~.:,)~- 7~' 6 I, I
_._._- - CAS I~cg. No.: 1'- IE 7 II 'T I'v (r I '" l-- ,
SrY I~J I p, !;~) .1.";]" ChemIcal Manager: Staff SCH:;I1"~'. I (:'-'
~N-A~c-~-le-m-be-r----r~~IE~G~L-lr~~'E-G~L~2-'~-A~E-G~L"~3-I~L~O-A--'-N.-~C~~t~em--be-r-----'~~E~G~L~I--'~~:E~'G~L~2~"A~IE~G~L3~'L~O~A~~~' .JA-D
I--H-e-nr--YA-n-d:--e-rs-on--;"~rl-;'--+------+----+------1I-J-Ohn---H-in-z-------<:::f-=~-)~ pf----:;rt/!'--t-t------+----t----, ---120 { :fZf Y {Ju;~
Action: Proposed ___ _ ATTACHMENT 2 Other ------ -----
Marc Baril ?It!: Jim Holler f'.V Lynn Beasley
Alan Becker
Robert Benson
Edward Bernas
Iris Camacho
Gail Chapman
George Cushmac
David Freshwater ~
Ralph Gingell ~ •
Roberta Grant
Dieter Heinz
PPM, (mg/mJ)
AEGL 1 ..
AEGL2
AEGL3
LOA
* = 2:10% LEL
** = 2: 50% LEL
Il, .... ., Ii !C-£/
10 Min
, (
, (
, (
*** = 2: 100% LEL
30 Min
) , (
) , (
) , (
Glenn Leach GJL-----' Richard Niemeier £.fVt Susan Ripple £R George Rusch, Cvw!f-Chair -Daniel Sudakin
DL.S Marcel vanRaaij ~ Calvin Willhite ~ George Woodall Y(~ Alan Woolf ~ £i,-"'t)t-v' F~' ~ ~d-
TALLY
PASS/ FAIL
1 Hr 4 Hr
) , ( ) , (
) , ( ) , (
) , ( ) , (
, *Safety conSideratIOns agamst the hazard(s) of exploslOn(s) must be taken mto account.
8 Hr
) , (
) , (
) , (
** and ***Extreme safety considerations against the hazard(s) of explosion(s) must be taken into account.
NR= Not Recommended due to ----------------------------------------AEGL 1 AEGL2 AEGL3 LOA
Motion by: __________ _ Motion by: __________ _ Motion by: _________ _ Motion by: __________ _
Second by: _________ _ Second by: _________ _
Second by: ________ _ Second by: _________ _
Approved by Chair: _______ _ D FO: -..:{f:_, {;_W---,~--,-"': -,,-tVJ...:...1 __ Date:If/ILf Iv q
)
)
)

ATTACHMENT 3
ARSENIC COMPOUNDS
~ Attempt at arsenic trichloride AEGL 1997 (aka "building a chimney with no bricks" approach)
o AEGL-l: no data
o AEGL-2: elemental equivalence to arsenic trioxide
o AEGL-3: 1- hr LCso (Flury, 1921)
o data are no better today
~ Assumptions for elemental equivalence approach
o the arsenic moiety is the sole determinant of toxicity
o the mode of action is similar for all trivalent arsenicals
o the metabolism and disposition of arsenic trichloride and arsenic trioxide will both yield the arsenic moiety in a similar state of bioavailability and the internal dose rate for the arsenic will be similar

ARSENIC COMPOUNDS
~ trivalent ( arsenite) and pentavalent (arsenate) o metabolic conversion of pentavalent to trivalent o most toxicity attributable to arsenite o methylation
~ absorption of arsenic is via passive diffusion in humans and mice; possible carrier-mediated cellular transport in rats
o rats sequester arsenic in erythrocytes - bad model for humans
o metabolism in humans appears to vary from that in most rodents
~ mode of action of As+ 3 and As+5 o ultimately, most toxicity is due to As+3 o interaction with thiols, altered redox status, energy
production, cytotoxicity
~ surrogate arsenicals o AS20 3 - also limited data o pentavalent arsenicals - conversion issues
~ Why is arsenic trichloride of special interest ???? o volume of production o precursor to many arsenicals including lewisite

RICIN AEGL - REVISIT
ATTACHMENT 4
RICIN AEGL REVISIT - NEW DATA
NAC/AEGL-48 Hilton-Old Town Alexandria, VA
April, 2009
· .
APRIL 2009

RICIN AEGL - REVISIT
110 min --
INR
AEGl Program
-
130 min -[60 min [4 hr --INR····· '-jNR--- iN R
Is hr ""'-[N-R
APRIL 2009
IAEGL 1 IAEGL 2·····
-,-NR INR "-lN-Ii [N-R--- --~'--'-iNR ------
IAEGL 3* 10.033 mg/m3 IO.010 mgim3 --10.0048 mg/m3 lNR '····-R·------'
*estimated lethality threshold (LCOl ) in rats {Griffiths et al., 1995a)i values incorporate a 2.7-fold reduction for potency variabilitYi UF=10 {3x3)i n=0.95
NR = Not recommended due to insufficient data
3

RICIN AEGL - REVISIT APRIL 2009
Acute inhalation toxicity of ricin in rats and mice (Gomez et al. 2009) -------------
Exposure concentration Exposure duration (min) Response (lethality)a Rats
----------
10 1/6 20 6/6
0.12 JlglL (0.12 mg/m3) 30 6/6
40 6/6 50 6/6
Mice 10 0/6 20 0/6
O.OIJ1glL (0.01 mg/m3) 40 6/6
60 5/6 80 6/6
~~~~~~~
a mean survival < 2 days for rats (6.2 days for lowest dose); 2-7 days for mice; 7-day observation
••• • ••• •
0.15 JIg/kg rats (no c.i.) 0.56 JIg/kg mice (0.36-0.79 c.i.)
5

RICIN AEGL - REVISIT APRIL 2009
110 min 130 min 160 min ------
14 hr r
18 hr IAEGLi------ INR
--
INR INR rNR 1
IAEGL 2 INR INR INR I INR ---- iNR
IAEGL 3 0.033 mg/m3 0.010 mg/m3 10.0048 mg/m3 INR !NR
I 0.0040 mg/m3 0.0013 mg/m3 10.00067 mg/m3 I
I
I
7
., .... \

ACUTE EXPOSURE GUIDELINE LEVELS (AEGLs)
Selected Cyanide Salts
Sodium Cyanide (CAS No. 143-33-9) NaCN
Potassium Cyanide (CAS No. 151-50-8) KCN
Calcium Cyanide (CAS No. 592-01-8) Ca(CNh
NAC/AEGL-48 April 14-16,2009 Alexandria, VA
ORNL Staff Scientist: Cheryl Bast
Chemical Manager: Ralph Gingell
Chemical Reviewers: George Cushmac and Ed Bernas
•
•
•
One mole ofsotlium cyanide or potassium cyanide may react with water or moisture to produ!;e a maximum of one mole of hydrogen cyanide as follows:
KCN+ H10 - HCN + KOH
One mole of e:llcium cy.mide may react with water or moisture to produce a maximum of two moles of hydrogen cyanide as follows:
Ca(CNh + 2H10 - 2HCN + CII(OHh
Hydrolysis rates were nolloclIted
The rllte ul' cy,mide generation may be dependent on ambient temllerature and humidity and the chemical structure of the cyanide
Waler solubility/reactivity is described as "forms hydrogen cyanide" fur sodium and potassium, and "graduully liberates hydrugen cyanide" for calcium cyanide (HSOB, 21108)
• •
•
ATTACHMENT 5
The cyanide salts are solids,
Inhalation of dusts may result in ionization in the nasal or lung mucosal fluids to yield CN",
Thc salts may also react with water in humid air and be inhlllcd as HCN,
In both cases, there will be systemic absorption of cyanide ion
The cyanide moiety is responsible for acute toxicity from cyanide salts.
_Qualitative:
Cyanide-induced clinical effects are indistinguishable following inhalation or dermal exposure to HCN vapor, or oral exposure to the cyanide salts NaCN and KCN, for both humans and animals.
Headaches, dizziness, nausea, inability to concentrate, thoracic oppression, palpitation, numbness, weakness, rapid pulse, face flushing, unconsciollsness, and death.
.QulIntitlltive: Rat oral L030 values
The CN adjusted vnlues for hydrogen, sodium, and potassium cyanides are comparable
Adjusted value fur calcium cyanide is much greater (suggesting a less toxic cOml)Ollnd) than would be expected on a molar basis for CN.
May be due to a slower hydrolysis rate, allowing for more efficient delodlication, relative to the other cyanide salts.
Rat oral lethlllitv data i Coml}olmd LD5<l (mg/kg) Adjusted LOSt! Reference
m!!/kt' CN)
HCN 8.5 8.2 ~ohrssen, 200 I NaCN 15 7.9 Smyth et al .• 1969 KCN 16 6.4 mCLIO,2000 Ca(CN), 39 22 Smyth et al., 1969

"'(
")
o ..
3
n "0
c
;-~
;-z.
~~
"'" ..
"I
'"
~~
~. 3
'" " . " 1.1. "'" ~ "I
'" II (") .. .. "'" -4.
g; 3 3 ::c
".,
.. .. "'"
• Q
'Q ~ ~
~ .., ~
~ ~
:r
1:; -~
_t'
:ic
. n
:..
..,
"'"
t.:
0 ;
g.~
;:r"
.,
..
~ :
;.~
d lo
t ;
{JQ
n
_.
..
Q
"'"
::0
..
..
.
~:i;..
....
l""l
..
::;
0 c;~r
; g"
~ ~""c
C"l
:;,1:
r" ~
-<
: ~
:..:
.. ..
-[a:~
~ ~
c
~[
.. ..
.. "-
as"
2.~ S; .. C
II
• ~i;"
=v,,~
....
..
0 Y
' c:..
t"""
6
; .!..
~~;.
~~r:rJ
:=.Q
0
~ :
r.:l
t~~N
~~~
S'; ~
\IQ
c; ;
.. ....
l""l
3;"C
"l
Ql"
"lr
;r
C"l~
"I
r -<
~
• so;
. ~':-S-
-.;.
. ...
-< l""
l '"
~o~
.. r
"l
~ N
4
. '"
~ ~
:::I
-0
::0
_.
~ c:
..~
~~~
?"C
"l1Z
r~
.... =
If
AE
GL
VA
LU
ES
FO
R M
ET
AL
CY
AN
rDE
SA
L T
S*
Com
poun
d CJ~~sifi~410~~in
30-m
in
l-h
r
Sod
ium
C
yani
de
AE
GL
-I
~~~---,-+------,-+
Pot
assi
um
Cya
nide
AE
GL
-2
AE
GL
-3
AE
GL
-I
AE
GL
-2
'AEGi~'
calciulIl~.
I ~.,
.. ·g
'''·
lli
Cya
nide
*'"
AE
GL
-2
--g
" ~
H
AE
GL
-3
4-h
r
• ::c '" "'" "I
Q
\IQ ... :::I ~ .. .. c; .. -< ., c .. '" .. "
I '" -, =
::. .. :::I Co
-0
C == r.:;' ;:r Ii
:;'
< '" c g ~
8-h
r
• C
o;"
"'-
0
:!-"0
-<
"I
.,
Q
=."C
o
::L
= .,
'" ..
;::g.
l""l
<>
C
"l2.
~~
-< -
., ,
-'"
c-o
...
...
~
!2 .
~::i
"I
" ~ ;'
~~
5L ;
-C
o_
r;
o·
~
:::I
-Q
.
r.~ .. ., ... '" a ., -< :.
or
0
- n Q' .,
, *T
hese
air
born
e cO
llce
ntra
tlon
s w
ill
prod
uce
the
equi
vale
nt A
EG
L v
alue
s fo
r hy
drog
en
cyan
ide.
, **
Alt
houg
h th
e ad
just
ed r
at o
ral L
C v
alue
for
calc
ium
cya
llid
e is
mil
ch g
reat
er (
sugg
esti
ng
a le
ss t
oxic
cO
llIpo
ulld
) tll
all
wou
ld b
e ex
pect
ed o
n a
mol
ar b
asis
for
CN
, ti
le p
rodl
ictit
JII o
f tw
o m
oles
of H
CN
was
ass
umed
pel
' mol
e o
f cal
cilll
ll cy
alli
de.
Thi
s as
sllm
ptio
ll w
ill y
ield
pr
otec
tiJ'
e A
EG
L I
'alu
es.

ATTACHMENT 6
ACUTE EXPOSURE GUIDELINE LEVELS (AEGLs)
PHOSGENE OXIME (CAS Reg. No. 1794-86-1)

PHOSGENE OXIME
• Urticant/nettle agent causing instant intolerable pain, erythema, wheals and urticaria
• Corrosive; causes extensive damage to tissue
• Initially developed (1929) as a possible warfare agent (mask breaker)
• Precise mechanism of action is not fully understood o skin lesions similar to those made by a strong acid o necrotizing effects of the chlorine, direct effect of the
oxime or effect from the carbonyl group
• Nasty stuff with a relatively poor data base

PHOSGENE OXIME - Human Data
• Malatesta et ale (1983)
o six volunteers (including investigators) exposed to phosgene oxime
o methods for determination of exposure concentrations were not specified
o "threshold of physiologic sensitivity": 1 mg/m3 (0.21 ppm), minimal concentration over a 10-minute period
• awareness of the chemical by ocular sensitivity, taste, and odor
o "threshold of pathologic sensitivity": -3 mg/m3 (0.63 ppm) • minimal concentration of a product after one minute of exposure causing an
unpleasant or irritating sensation on the conjunctiva, nose (assumed to refer to nasal mucosal surfaces), or skin.
• U.S. Army (2005)
o estimated LCtso of 3200 mgemin/m3 (based upon a 10-minute exposure) for phosgene oxime vapor

PHOSGENE OXIME - Animal Data
• limited data
o exposure-response data? lethality threshold estimate? o experimental protocols?

I I Classification
I AEGL-l
PHOSGENE OXIME AEGL-l
AEGL-l values for ~hosgene oxime 10-min 30-min I-h 4-h I I I
0.1 ?Illgl!lll I 0.17 mg/m3 I 0.17 mg/~ll 0.17 mg/ml
I 8-h 1
0.17 mg/m3 I
Key Study: Malatesta, P., B. Bianchi and C. Malatesta. 1983. [Acute Thionyl Chloride Poisoning Contributo allo studio delle sostanze orticanti: Nota 1. Boll. Chim. Farm 122: 96-103.
Critical Effect: Awareness of chemical by ocular, nasal, and dermal sensation following 10-minute exposure of 6 informed human volunteers to 1 mg/m3
Uncertainty Factors: 3; direct contact irritant (ocular, nasal, dermal contact) requiring no metabolism/disposition processes; initial awareness is not expected to vary among individuals
Modifying Factor: 2; limited data
Time Scaling: No time scaling applied for direct-contact irritation that is primarily a function of concentration and not expected to have a significant temporal component.

AEGL
PHOSGENE OXIME AEGL-2
AEGL-2 values for ene oxime I-h 4-h
0.50 mt!/m:r I ().5() mt!/m3 8-h
Key Study: Malatesta, P., B. Bianchi and C. Malatesta. 1983. [Acute Thionyl Chloride Poisoning Contributo allo studio delle sostanze orticanti: Nota 1. Boll. Chim. Farm 122: 96-103.
Critical Effect: Unpleasant (likely intolerable) irritation of eyes, nasal tissue, and skin following I-minute exposure of 6 informed human volunteers to 3 mg/m3
Uncertainty Factors: 3; direct contact irritant (ocular, nasal, dermal contact) requiring no metabolism/disposition processes; initial awareness is not expected to vary among individuals
Modifying Factor: 2; limited data
Time Scaling: No time scaling applied for direct-contact irritation that is primarily a function of concentration and not expected to have a significant temporal component.

• Insufficient data
PHOSGENE OXIME AEGL-3
o Estimate of lethality threshold not possible
o Lethality response basically 100%
o Human LCt50 estimate ??????

•

10000.0000
1000.0000
100.0000
Chemical Toxicity - TSD All Data Phosgene Oxime
[ 10.0000 «::+"'«««««««««<!««.<-_.<-<-;--< ---..
0.
1.0000
0.1000
0.0100
o 60 120 180 240 Minutes
300 360 420
. ..
Human - No Effect
n Human - Discomfort
I:!iI
Human Disabling
Animal - No Effect
o Anim al - Discomfort
~
Animal - Disabling .. Animal - Some Lethality
• Animal - Lethal
480 --AEGL

ATTACHMENT 7
ACUTE EXI10SURE GUIDELINE LEVELS (AEGLs)
PERFLUOROISOBUTYLENE (PFIB)
'i:x:' f_~_f
f f
NAC/AEGL-48 April 14-16, 2009 Alexandria, VA
ORNL StllffScientist: Cheryl Bast
Chemical Manager: George Rusch
Chemical Reviewers: Susan Ripple and David Freshwater
Exact mechanism or action is not known.
Highly electrophilic chemical, likely undergoes electron trullsfer that feads 10 several highly reactive intermelliates
Reacts with almost nil known nucleophiles.
Pallern of pulmonary damllge is characteristic of highly hydrophobic gases thut penetrate into the dee!, lung.
Little evidence of direct pathological dumage to tissues outside the respiratory trlle!.
AIII'FIB-induced tissue damage appellrs to result from rapid interaction with cells th:lt are either in, or in close proximity to, the rcspinltory airways.
Produces pulmonary permeability-type edema (similar to phosgene)
Colo rless gas
Formed during the production or tetralluoroethylene and chlorodinlloromethane
Produced in relatively small amounts durini the heated decomposition or polytetranuoroethylene (PTFE or Tellon ) and some closely related plnstics.
"Heavy products/High-boilers" are by-products formed at high temperatures (700°C) during the synthesis of tetrafluoroethy lene from chlorodifluoromethane. Certain volatile and relatively inert by-products readily dissipate; however, other heavier more unstable by-products with high boiling points (above 40°C) accumulate at the base of the distillation column. The physical properties of these compounds lead to the name "heavy products/high boilers." Analyses of these "heavy products/high boilers" suggested that PFIB (found in concentrations ranging from 0.1 to 3%) is responsible for the high toxicity of "heavy products/high boilers".
No prolluction volume inrormation was located.
Human Duta-
Limited to oCCul)ational exposures with no delinitive concentration or duration parameters.
Clinical signs included cough, dirficliity hreathing, wheezing, nausea, chest IJain, weakness, lind bud tuste.
Pulmollllry edema and congestion were noted at autopsy.
Animal Data-
Lethality dnta are avuilllble ror rats, mice, guinea pigs, rllbbils, and Cllts, with the most robust datil sets heing ror rats and mice.
Clinical signs include dyspnea, cyanosis, face washing, hyperemia, sneezing, mild responsiveness, rapid respiration, and convllisions.
Steep concentration-response curve
Limited interspecies variability
Death is attributed to pulmonary edema, a consistcnt necropsy linding.

LIMITE!) INTERSPECIES VARIABILITY
TABLE I Comp~~ison ofPFIB LC:\O values for variOl;~animal species I ~
!
.. _ .. Durution Species LC51J (ppm) . Ratio of Referenee
I LC5U values (maximum)
I minute Mouse !
107 1.1 Fusheng et al., 1992 ._--
!
I
Rat 122 Smith et ul., 1982
10 minutes Mouse .-----
I
Bide et al., 11.8 1.4 20011 _.---
Rat 17 Smith et al., 1982
i 15 minutes Mouse 6.1 1.1 Karoov, 1977 Rat 6.7 Karoov, 1977
2 hours Mouse
I
11.98 3.1 Paulet and Rllt 1.05 Bernard, 1968
Guinea oil! I 1.05 L~Rabbit J.20 ! Mouse J.6 Karoov, 1977
Clit 3.1 Karoov, 1977
Rut* 11.6* 11.8* • Karpov, 1977 *LCsu value inconsistent with overall data base (Karpov (1977) IS-minute rat vulue and reports from other lIuthors).
10-min NR NR
NR: Not Recommended due to insuflicient dalli. Absence of an AEGL-I vahle does not imply that concentrations below the AEGL-2 are without elTect.
STEEP CONCENTRA TION-RESI'ONSE CliRVE
Duration I Concentration Mortality Reference Rat
! IJ.2S-min 1228 D(lm Oiy. (Olll)} i Smith el at, 1982 468 ppm 100% (10110)
•
S-min 120 nnm llUiu{O/J 0)
I
132 ppm 90% (9/10)
~ ... ~
110 (lorn 10-min .20 ppm 80% (8/10) I j
4-hr ! 0.25 Dom 0% 10/61 DuPont, 1966 0.5 ppm 100% (6/6)
i I
.... 1
I-min 98 nom 0% 10/61 F"hi ..... ,., ~ 116 ppm 100% (6/6)
.::: ct 01., 2000 10-min 10 ppm 10% (2/2(1) 65 ppm 100% (10/10) I .
Mouse
I------Rat, Mouse, Rabbit,Guinea Pig
[-0.70 ppm 0% 11'lIulet & Bernard, 1.5 ppm 100% (10110 rats) 1968
100% (JOIIO mice) ! 100% (3/3 rabbits) __ 110% {4/S GI'L
Endpoint: Threc-fold reduction of AEGL-3 valucs
Justified by steep concentration-response curve.

Ali:GL-3 Values rur PFIB
Ill-min I 311-lIIin I-h I 4-h I S-h
!l.5lJ ppm I 0.20 ppm I I). III Ililln i 1I.1l25 PIHt1 1l.Il131lllll1
Species: CUllcentration: Time: li:mlpoint:
Refercnce:
Time Scaling:
Rat 11.25 ppm 4-hours Highest concentration causing nl) mortality. Mortality (1110%; 6/6) observed at next hir,:hest cnncentrlltion tested: 0.5 ppm) DuPont, [966
c' x t'" k, where thc expunent, n, is 1.0, derived from rat lethality d:lta ranginr,: frum 0.25 to [20 minutes. .
Time scaling from 4-lns tu Ill-min is juslilicd: No mortality was nUled in nils exposed to 10 ppm PFIB (Smith CI :11., [982) or mice expused to 9.2 ppm I)~'IB (l1ide eta!', 21)011) for IO-minutes. Applyiog an uncertainty faclor of IU to these concentrations, yields' lO-min AEGL-3 .valucs or 1.0 llIId 0.92 ppm, suggesting thatlhe derived [II-min Ali:GL-3 value is reasunable.
Uncertainty FnctOl's: Intersl1ecies: 3- Lethality data frulII several animal species suggest little interspccics variability .
InlraSl1ccics: 3· Stcep concelltratilln-re~IHlnse curve implies limited intraspecics variability
Chemn:al Toxicity PFIB o
Cl
o o
"
SI.mlnrd, ami Guidetines ror I'I'IB Exposure Dur"linn
Guideline III-Ill in 30'min I-b -I-h i 8-b
AEGL-l NR NR I'll{ NR NR , AEGIA 1l.21l ppm O.U67 ppm I O.OJ) "I'''' I U.OIISJ ppm [J.01I43 PI'"'
AEGL·J U.S9ppm 0.20 ppm O.1Il ppm 0.1)251'1"" U.tH) nll"1
ERI'G-t IAIHAl' NA ERt'G-! (AUlA)' U.1 ppm
ERPG-3 (AtHAI' 0.31ll'm TLY-STEL !l.U t pplII (.ciling) (ACGHl)" MAC (Th. O.ot ppm Netherlauds)' i I

.. -.. '
ACUTE EXPOSURE GUIDELINE LEVELS FOR
OXAMYL
National Advisory Committee for AEGLs Meeting 48 Alexandria, VA
ORNL Staff Scientist: Sylvia S. Talmage
Chemical Manager: Paul Tobin
Chemical Reviewers: Henry Anderson Daniel Sudakin
Properties
N-methyl carbamate pesticide
April 14-16,2009
OXAMYL
Crystalline solid with a low vapor pressure
Data Base
Human oral dosing study Acute studies with rats
I and 4 hours dust and aerosol studies
dust more toxic I-hour LCso values of 120 and 170 mglm3
4-hour LCso values of 56 and 64 mg/m3
Oral developmentallreproductive toxicity studies with rats and rabbits Genotoxicity studies Oral carcinogenicity studies with tats, mice and dogs
Mode of Action Cholinesterase activity inhibition
OXAMYL ATTACHMENT 8
Erythrocyte acetylcholinesterase activity inhibition biomarker Sustained action of neurotransmitter acetylcholine
Plasma cholinesterase is butyl or pseudocholinesterase Inhibition is reversible
Signs and symptoms of acetylcholinesterase activity inhibition (Paul 1987) miosis, lacrimation, salivation, tremors, convulsions .... acetylcholinesterase depression is measured in relation to individual's baseline 0-15% = statistical error 25-35% slight poisoning
30% activity inhibition from baseline = ACGIH-BEI 35-50% = severe poisoning
OXAMYL
Uncertainty Factors Taken from human and rat oral dosing studies with oxamyl N-methyl carbamate pesticides do not have a port of entry effect, are expected to be
rapidly absorbed and do not require activation. Therefore species differences and juvenile-adult differences in sensitivity in oral studies can be used as interspecies and intraspecies uncertainty factors in inhalation studies
Interspecies uncertainty factor: 3 Differences in modeled erythrocyte acetylcholinesterase activity inhibition in humans and rats following oral dosing
Intraspecies uncertainty factor: 3.48 Comparative brain acetylcholinesterase activity inhibition in post-natal-day 11 rats and adult rats following oral dosing
Total uncertainty factor: 10
Time-scaling n 1.6 basedon one I-hour study and two 4-hour studies

Data for Derivation of AEGL-I U.S. EPA 2000
4-hour study
OXAMYL
male and female rats exposed to 0, 4.9 or 24 mg/ml
endpoint of plasma, erythrocyte, and brain cholinesterase activity inhibition
4.9 mg/ml: erythrocyte acetylcholinesterase activity inhibition of28.5%
clinical signs similar to those of control rats 24 mg/ml: 72-73% erythrocyte acetylcholinesterase activity inhibition
4-hour 4.9 mg/ml value divided by 10 and time-scaled using 1.6.
AEGL-I Values for Oxamyl to-min 30-min I t-h I 4-h 8-hour
3.6 rng/ml 1.8 mg/m3 1.2 mg/m3 I OA9 mg/m3 I 0.32 mg/ml
Data for Derivation of AEGL-2 No relevant data
OXAMYL
Based on steep-concentration-response curve, divide AEGL-3 values by 3
Data for Derivation of AEGL-3 Well-conducted study of Kelly 2001
4-hour study
OXAMYL
male and female rats exposed to 0,50,54,65, 120 mg/ml endpoint oflethality: 2/10, 6/10, 7110, 10110 rats
Calculated 4-hour BMCLol of22 mg/ml:
4-hour 22 mg/ml value divided by 10 and time-scaled using 1.6.
AEGL-3 Values for Oxarnyl to-min T 30-min T l-h I 4-h I 8-hour
16 rng/ml I 8.2mg/rll] 1 ~~ rng/ml ~.2 rng/m1 I 1.4 mg/rn1
OXAMYL
Proposed AEGL Values for Oxamyl
Exposure Duration
Classification IO-minute 30-minute I-hour 4-hour 8-hour
AEGL-l 3.6 mg/m] 1.8 mg/ml 1.2 mg/ml OA9 mg/m3 0.32 mg/m3
r~~~-~~-
AEGL-2 5.3 mg/ml 2.7 mg/m1 1.8 mg/m3 0.73 mg/m1 OA7 mg/m3
r-----~~~ I------~~~~-~
AEGL-3 16 mg/m1 8.2 mg/ml 5.3 mg/ml 2.2 mg/ml lA mg/ml
AEGL-I: based on 28.5% acetylcholinesterase activity inhibition in rats, 4.9 mg/m\ 4 hours. Interspecies and intraspecies uncertainty factors of 3 and 3.5, respectively, for a total of 10 were applied. AEGL-2: based on steep concentration-response curve, derived by dividing the AEGL-3 by3. AEGL-3: based on threshold for lethality (4-hour BMCLo5 of22 mg/ml). Inter- and intraspecies uncertainty factors of 3 and 3.5, respectively, for a total of 10 were applied.

Human Oral Data . .... 40 healthy male subjects Groups of 5; 10 controls
OXAMYL
Doses of 0.005, 0.015, om, 0.06, 0.09, or 0.15 mg a.i.lkg Clinical signs and symptoms and plasma and erythrocyte cholinesterase measured pre
dose and at set times post-dose Clinical signs not dose-related Erythrocyte acetylcholinesterase activity inhibition:
peak effect at 30-45 minutes; recovery by 2-3 hours post-dose 0.005,0.015,0.03, 0.06 mg/kg: similar to controls 0.09 mg/kg: 7% 0.15 mg/kg: 28%
Inhalation calculation: 0.15 mglkg x 70 kg adult = 10.5 mg Look at 4-hour value: 10.5 mg/(20 m3/24 hours)(4 hOurS)(l.bsorpt;oJ 3.15 mg/m3
Divide by intraspecies UF of 3.5: (3.15 mg/m3)/3.5 = 0.90 mg/m' (IO-minute value would be 22 mg/ml)
OXAMYL
Category graph of toxicity data and AEGL values
--+----+-----+I-:~I -----I 60 120 1&0 300 360 420 4BO
10

..
ACUTE EXPOSURE GUIDELINE LEVELS FOR
METHOMYL
National Advisory Committee for AEGLs Meeting 48 Alexandria, VA
ORNL Staff Scientist: Sylvia S. Talmage
Chemical Manager: Paul Tobin
Chemical Reviewers: Henry Anderson Daniel Sudakin
Properties
N-methyl carbamate pesticide
April 14-16, 2009
METHOMYL
Crystalline solid with a low vapor pressure
Data Base
Human oral dosing study Acute studies with rats
all studies were for 4 hours vapor, powder and aerosol studies
vapor and aerosol studies well conducted 4-hour LCso value of 258 mglm3 (aerosol)
Repeat-exposure study Oral developmental/reproductive toxicity studies with rats and rabbits Genotoxicity studies Oral carcinogenicity studies with rats, mice and dogs
Mode of Action Cholinesterase activity inhibition
METHOMYL ATTACHMENT 9
Erythrocyte acetylcholinesterase activity inhibition biomarker Sustained action of neurotransmitter acetylcholine
Plasma cholinesterase is butyl or pseudocholinesterase Inhibition is reversible
Signs and symptoms of acetylcholinesterase activity inhibition (Paul 1987) miosis, lacrimation, salivation, tremors, convulsions .... acetylcholinesterase depression is measured in relation to individual's baseline 0-15% = statistical error 25-35% slight poisoning
30% activity inhibition from baseline ACGIH-BEI 35-50% severe poisoning
METHOMYL
Uncertainty Factors Taken from human and rat oral dosing studies with methomyl N-methyl carbamate pesticides do not have a port of entry effect, are expected to be
rapidly absorbed and do not require activation. Therefore species differences and juvenile-adult differences in sensitivity in oral studies can be used as interspecies and intraspecies uncertainty factors in inhalation studies
Interspecies uncertainty factor: 5 Differences in modeled erythrocyte acetylcholinesterase activity inhibition in humans and rats following oral dosing
Intraspecies uncertainty factor: 3.05 Comparative brain acetylcholinesterase activity inhibition in post-natal-day II rats and adult rats following oral dosing
Total uncertainty factor: 15
Time-scaling No time-scaling infOimation

Data for Derivation of AEGL-I Not recommended?? Ta'naka 1987
4-hour study
METHOMYI~
male Wi star rats exposed to 9.9 mg/m3
endpoint of plasma and erythrocyte cholinesterase activity inhibition questionable measurements
4-hour 9.9 mg/ml value divided by 15 and time-scaled using default values ofn = 3 and 1 for shorter and longer exposure durations, respectively.
Oats for Derivation of AEGL-2 DuPont 1966a
4-hour study exposure to 36 or 44 mg/ml
METHO~
36 mg/m3• clinical in one of six rats
44 mg/ml: clinical signs in six. of six. rats
clinical signs included slight salivation, lacrimation, mild dyspnea
-' >.J ..... '4~" .
to-min 30-min 6.9 mg/m l 4.8 lTIg/m3 3.8 lTIg/ml 2.4 lTIg/m3
....... O'~'" •
AEGL-2 Values for Methomyl to-min I 30-min I l-h I 4-h
8.5 mg/ml I 5.9 mg/m3 I 4.7 mg/ml I 2.9 mg/m] I I
8-hour 0.33 mg/m3
8-hour 1.2 lTIglml
8-hour 1.5 mg/ml
METHO~
Data for Derivation of AEGL-3 Well-conducted study of DuPont 1991
4-hour study male and female rats ex.posed to 0,137, 181, 182,232, or 326 mg/m3
endpoint of lethality: 0/10,0/10,011 0, 1110,6/10, 7/10 rats
Calculated 4-hour BMCLo5 of 129.45 mg/m3:
4-hour 129.45 value divided by 15 and time-scaled using default values.
AEGL-3 Values for Methomyl to-min T 30-min l-h 4-h 8-hour
25 mg/m3 r 17 mg/ml 14 mg/ml 8.6 mg/ml 4.3 mg/ml
METHOMYIJ
Proposed AEGL Values for Methomyl
Exposure Duration .. - ------ .... ~
Classifies tion lO-minute 30-minute I-hour 4-hour 8-hour
AEGL-I NR NR NR NR NR 1.9 mg/ml 1.3 mg/ml 1.1 mg/ml 0.66 mg/m3 0.33 mg/m3
AEGL-2 (36) 6.9 mg/ml 4.8 mg/ml 3.8 mg/ml 2.4 mg/m3 1.2 mg/ml
AEGL-2 (44) 8.5 mg/m l 5.9 mg/ml 4.7 mglml 2.9 mglml 1.5 mg/ml .. :.- .. _----_ ... _--
AEGL-3 25 mg/ml 17 mg/ml 14 mg/m3 8.6 mg/ml 4.3 mg/ml
AEGL-l: slight acetylcholinesterase activity inhibition in rats, 9.9 mg/m3, 4 hOUTS.
lnterspecies and intraspecies uncertainty factors of 5 and 3.05, respectively, for a total of 15 were applied. AEGL-2: slight clinical indicating acetylcholinesterase activity inhibition in one of six. rats (or six of six rats). AEGL-3: based on threshold for lethality (4-hour BMCLo5 of 129.45 mg/m3). Inter- and intraspecies uncertainty factors of 5 and 3.05, respectively, for a total of 15 were applied.

.. METHOMYL
Human Oral Data ..... 19 healthy male subjects, ages 1840 Groups of 5; 4 controls Doses of 0, 0.1, 0.2, or 0.3, mg a.i.lkg Clinical signs and symptoms and plasma and erythrocyte cholinesterase measured pre
dose and at set times post-dose Clinical sign of increased saliva in 0.3 mg/kg dose group Erythrocyte acetylcholinesterase activity inhibition:
peak effect at 45-90 minutes; recovery by 6 hours post-dose 0.1 mg/kg: 2-19% 0.2 mg/kg: 19-28% 0.3 mg/kg: -35%
Inhalation calculation: 0.3 mg/kg x 70 kg adult = 21 mg Look at 4-hour value: 21 mg/(20 mJ/24 hours)(4 hours)(l,b''''l'ti.,.,) = 6.3 mg/mJ
Divide by intraspecies UF of 15: (6.3 mg/m3)/15 = 0.42 mg/mJ (IO-minute value would be 10 mg/m3
)
METHOMYL
Category graph of toxicity data and AEGL values
1000
100
t 10 E
~··T
:,----:'---.
Category Graph - Animal Data Methomyl
.-;~ .-
1 U::'oI._l
--.. "- AWe-'
--+-----+_.- j -----+ 60 120 180 240 300 360
Minutes
10
o .-~ ...... @
18 .. ~ .. •
I
-----r 420 460

ACUTE EXPOSURE GlnDELINE LEVELS FOR
ALDICARB
National Advisory Committee for AEGLs Meeting 48 Alexandria, VA
ORNL Staff Scientist: Sylvia S. Talmage
Chemical Manager: Paul Tobin
Chemical Reviewers: Henry Anderson Daniel Sudakin
Properties
N-methyl carbamate pesticide
April 14-16, 2009
ALDICARB
Crystalline solid with a low vapor pressure
Data Base
Human oral dosing study Acute studies with rats
saturated vapor, 8 hours no mortality (Risher et al. 1987) dust study: 6.7 mg/m3 mortality of 0/6 rats at 15 minutes, 6/6 at 30 minutes aerosol study (UCC 1985)
Repeat-exposure study with aldicarb sulfone (UCC 1977) - lacked details Oral developmentallreproductive toxicity studies with rats and rabbits Genotoxicity studies Oral carcinogenicity studies with rats and mice
Mode of Action Cholinesterase activity inhibition
ALDICARB ATTACHMENT 10
Erythrocyte acetylcholinesterase activity inhibition biomarker Sustained action of neurotransmitter acetylcholine
Plasma cholinesterase is butYl Of pseudocholinesterase Inhibition is reversible
Signs and symptoms of acetylcholinesterase activity inhibition (Paul 1987) miosis, lacrimation, salivation, tremors, convulsions .... acetylcholinesterase depression is measured in relation to individual's baseline 0-15% statistical error 25-35% slight poisoning
30% activity inhibition from baseline ACGrn-BEl 35-50% severe poisoning
ALDICARB
Uncertainty Factors Taken from human and rat oral dosing studies with aldicarb N-methyl carbamate pesticides do not have a port of entry effect, are expected to be
rapidly absorbed and do not require activation. Therefore species differences and juvenile-adult differences in sensitivity in oral studies can be used as interspccies and intraspecies uncertainty factors in inhalation studies
lnterspecies uncertainty factor: 2 Differences in modeled erythrocyte acetylcholinesterase activity inhibition in humans and rats following oral dosing
lntraspecies uncertainty factor: 2 Comparative brain acetylcholinesterase activity inhibition in post-natal-day 17 rats and adult rats following oral dosing
Total uncertainty factor: 4
Time-scaling No time-scaling information

.' '
Data for Derivation of AEGL-I No data available AEGL-l values not reconunended
ALDICARB
AEGL-I Values for Aldicarb IO-min 30-min
NR MR
Data for Derivation of AEGL-2 No data available
I-b
ALDICARB
4-b NR
Based on steep concentration-response curve, divide AEGL-3 values by 3
IO-min 0.21 mg/m) 0.12 IDgIJnJ
8-hour 0.04 1Dg/mJ
ALDICARB
Data for Derivation of AEGL-3 Aerosol in dichloromethane (dichloromethane LCsQ 52,000 mg/ml, rat, several hours) 4 hour study with rats (VCC 1985)
male and female rats exposed to 0, 0.82, 2.0, 6.0, 8.7,46.3 mg/m) endpoint of lethality: 0110, 0/10,1110,5110,10110,10/10 rats
Calculated 4-hour LCso of 3.9 mg/m) Calculated 4-hour BMCLo5 of 0.88 mg/ml:
4-hour 0.88 mg/ml value divided inter- and intraspecies uncertainty factors of 2 and 2, respectively, for a total of 4 and time-scaled using default values of n 3 and I for shorter and longer exposure durations, respectively.
AEGL-3 Values for Aldicarb IO-min I 30-min I I-h I 4-h J 8-bour
0.64 m.ll/ml I 0.44 mg/ml I 0.35 mg/mJ I 0.22 mg/m3 I O.ll mg/ml
ALDICARB
Proposed AEGL Values for Aldicarb
Exposure Duration r'" .......... . ... ~ ... ..-
Classification lO-minute 30-minute I-bour 4-bour 8-bour
AEGL-I NR NR NR NR NR .... -
AEGL-2 0.21 mg/mJ 0.15 mg/ml 0.12 mg/m3 0.07 mg/m) 0.04 mg/m)
AEGL-3 0.64 mg/m) 0.44 mg/m) 0.35 mg/m) 0.22 mg/ml 0.11 mg/m)
AEGL-l: In absence of suitable data, AEGL-I values are not reconunended. AEGL-2: Based on steep concentration-response curve, the AEGL-2 values were derived by dividing the AEGL-3 values by 3. AEGL-3: based on threshold for lethality (4-hour BMCLo5 of 0.88 mg/m3
). Inter- and intraspecies uncertainty factors of 2 and 2, respectively, for a total of 4 were applied. Time scaling used default values of n = 3 and I for shorter and longer exposure durations, respectively.

,..
ALDICARB
Human Oral Data ••••• (Wyld et ai. 1991) 47 healthy male and female subjects Groups of 4-8 Males: doses ofO, 0.01, 0.025, 0.05, 0.06 (one subject~) or 0.0.075, mg a.i.lkg Females: 0, 0.025, 0.05 Clinical signs and symptoms and plasma and erythrocyte cholinesterase measured pre
dose and at set times post-dose Clinical signs consistent with cholinesterase activity inhibition in males but not females Erythrocyte acetylcholinesterase activity inhibition:
peak effect at 60 minutes Males, AChE activity inhibition: 3.8, 12,29,38% Females, AChE activity inhibition: 20, 36%
Inhalation calculation: 0.075 mg/kg x 70 kg adult = 5.25 mg Look at 4-hour value: 5.25 mg/(20 m)/24 hours)(4 hours)(l.bsorptinn) = 1.58 mg/m) Divide bv intraspecies UF of 2: (1.58 mg/m3)/2 0.79 mg/ml
9
ALDICARB
Category graph of toxicity data and AEGL values
100.0 ,.'~-'
10.0 --Q>-
M
-.b-----
,""--E "t 1.0
-""---0.1
0.0 ... -a 60
Category Graph· Animal Data Aldlcarb
"",.,
.ro'~J_+J;~~ 120 180 240
Minutes 300
lO
360
o ®
8>
""".., -S:"",.L,""lIIIr
'.= r-------.
-t-
420 480

Perchloryl Fluoride
NAC/AEGL meeting
April 14th-16th, 2009
Washington DC
Perchloryl Fluoride
• CAS Reg. No. 7616-94-6
• Acyl fluoride of perchloric acid- stable compound
• Colorless gas • Vapor pressure: 8943.9 mm Hg @ 25°C
• Melting pt: -146°C; Boiling pt: -46.8 °C
• Flammability limits: substance will not bum but can support combustion
• Production values not found
Toxicity Effects
• Strong oxidizer- strong irritant of the eyes, mucous membranes and lungs.
• Systemic effects- induction of methemoglobinemia
• Odor- characteristic sweet odor • Greene et al. (1960)- 50% of human
volunteers detected odor at 41 ppm. Described as sweeUmusty. Little to no details on how this was obtained.
ATTACHMENT 11
1

Summary of Data Available
• Very limited data
• No human dataw only anecdotal information
• Animal data- dogs, rats, mice and guinea pigs exposed in acute lethality studies and up to 26 weeks but all from one laboratory and one reported study (Greene et al. 1960). Limited in study details.
Acute Data
• 2.5 hr and 4 hr study (Greene et al. 1960) - Oogs- 21concentration
• 622 ppm for 2.5 hrs: 112 dogs died; other treated with methylene blue and survived. Se_e cyanosis, convulsions, hyperpnea
• 451 ppm for 4 hrs: 112 dogs moribund upon removal from chamber; other treated with methylene blue and survived. Severe cyanosis, convulsions
• 425 ppm for 4 hrs: both dogs survive; severe cyanosis, hyperpnea, emesis
• 224 ppm for 4 hrs: both dogs survive; moderate cyanosis and hyperpnea
Acute Data (cont'd)
• LC50 for rat: 385 ppm
• Le50 for mouse: 630 ppm.
• No other values provided (10 rats and 20 mice) - Rodents dying had labored breathing,
cyanosis and convulsions
- Moderate discoloration of lungs, pulmonary congestion
2

Acute Data (cont'd)
• Dost et al. (1974) - Study actually for chlorine trifluoride, but did expose
to perchloryl fluoride also (breaks down to perchloryl fluoride) Used male Sprague-Dawley rats Not provided: # rats used, chamber conditions, effects observed; no values/data provided except for belOW
- All rats died: 5000 ppm x 15 min and 2000 ppm x 40 min (all had methemoglobinemia) All rats survive: 2000 ppm x 25 min and 1000 ppm x 60 min . Didn't use in derivations due to lack of details
Acutelethallty 11_ (G ....... et aI. 1%0)
Spe<:let Conftftiration Ex""' ..... _ Errect
(ppm)
dog 224 4 1m; Moderate cyanosis, byperpnea
dog 224 4 1m; Moderate cyanosis, hyperpnea
dog 425 4 1m; Severe cyanosis, hyperpnea, emfSis
dog 425 4 1m; Severe cyanosis, byperpnea. eml':Sls
Severe cyanosis. hyperpnea. motor dog 451 4 1m; instability, convulsions; dog _led with
methylene blue and survived
Severe cyanosis. hyperpnea. motor dog 451 4 1m; instability, convulsions, moribund in
cluunber and dog died
dog 622 251m; Severe cyanosis, convulsions, death
~ Severe ~isJ hyperpnea, salivation,
251m; moIor instabiUty; dog trea!ed ";th methylene blu. and dog survived
4 1m; LC" 4 1m; LC",
Repeat Exposure Data
• rats/mice/guinea pigs- 5 days/wk, 6 hrs/day x 7 weeks to 0 or 185 ppm (Greene et al. 1960)
10/10 guinea pigs died after 3 days exposure
18120 rats and 20/39 mice died after 35 days
- All had dypsnea, cyanosis and rats had 23% increase in methemoglobin after 1 week
Histopath: pulmonary irritation (alveolar edema at first then bronchopneumonia)
3

Repeat Exposure Data (cont'd)
• Also exposed rats and guinea pigs to a or 104 ppm x 5 days/wk, 6 hrs/day x 5 weeks - 1120 rats and 10110 guinea pigs died after 25
days
- Cyanosis observed
- Similar findings to that at 185 ppm but less severe
Repeat Exposure (cont'd)
• 10 rats/3 dogs/30 guinea pigs exposed to a or 24 ppm, 6 hrs/day, 5 days/wk x 26 wks (Greene et al. 1960) - Guinea pigs had underlying respiratory
infection; 14/30 died in treated group
- All dogs and rats survived with no clinical signs
- i fluoride in bones at end of study
Repeat uposure studies-CGrMr. ttl at 1980) -- ""-_Ion "- .--Ippml ....
10
11
I 00<2.
6hrsld,5 AJI SUI'\IIved; no clnIcaI sJgns; i fiucrIde In femur after 6 ... ..... "",. ........ .... 6h1"S1d, 5 104 pPm. 11ZJ died {" 25 expasure days):
..... "" 5 _,1_l __ .h_ ...... ... ...ui104 -_._,-)
ppm) or 7 wks 185 ppm: 18120 died (> 35eJ1PC1111UAldays), dypsnea, some (185) ppm efta:ts_104 ppmbu! I'I'U8fWM1f't!:
I 0",24
6hn11d,5 All survived no dinieaf aIgns; 1 ~ in fWru¥ lilt« 6 .. , ..... "",. .... .........
""""" 0(7186 6~,5 185"""" "'==:::::-..... ) d/wtfl;:r7.u
6hts1d,5 104 ppm: 10/10 died {> 25 ~ daye}
""" .. 5 gut- Q,104C1185 wk${104 -"" pPm)Cl7l111ks 185 ppm: 10110 dlld (> 3axposuredaya)
(185) ppm ---- ."' .. 6tn1d,~ 113l control atd 14130 truted died'"
"'" .. ...... Ifl_~_tuno_·
• ..... """'"'~......, ... _tr:>-..c:t.oe.....I..,h_ ....... ~_ 12 "'l!whiGII~_"""' __ ~ __ .... ~_~~,."-:!~~~_ ....
4

AEGL-1 Derivation
• POD= 24 ppm; Rats and dogs exposed 6 hrs/day, 5 days/wk for 26 weeks
- All survived; no clinical signs. Only effect was t deposition of fluoride in femur after 6 months.
• Would be no-effect level after just 8 hrs
• Death occurred in guinea pigs at this concentration but had upper respiratory infection (8. bronchoseptica).
AEGL-1 Derivation (cont'd)
• No time-scaling applied- no effects observed in animals
• Total UF= 30 - Interspecies UF- 3, there was less than a 2-fold
difference in the concentration at which dogs, rats and mice either were moribund or died. All species exhibit similar effects.
Intraspecies UF- 10, systemic absorption does occur with exposure; possible increased sensitivity of some of the human population for development of methemoglobinemia
AEGL-1 Derivation (cont'd)
• Modifying factor (MF)= 2, applied due to the sparse data set; data exist for several species, but studies all performed by one laboratory and raw data and details were limited
• Total factors applied = 60
,.
5

AEGL-1 using POD of 24 ppm with no timescaling; Total UF of 60
Hl-mlnule 30-mlnol. l.hour 4-hoor 8-hour
0.40 ppm 0.40 ppm 0.40 ppm 0.40 ppm 0.40 ppm (1.1 mgtm') (1.1mg1m') (1.1 mglm') (1.1 mgtm') (1.1 mgtm')
'6
AEGL-2 Derivation
• AEGL-2 = 1/3rd of AEGL-3 value
• According to the AEGL SOP (2001). when little data are available and steep dose curve. 1/3rd of the AEGL-3 value can be used for AEGL-2.
• 4-hour acute inhalation dog study: 425 ppm- 2 dogs had severe cyanosis and hyperpnea but survived
451 ppm- 1 of the 2 dogs was found moribund.
AEGL-2 values derived by taking 1/3rd of AEGL-3 values
100minute 30-_ute I ........ _or a..bour
2App ... lAppm J.9ppm 1.2 ppm 0.17 ppm (IOmglm') (IOmglm') (S.Omglm') (5.0mglm') (3.2mg1m')
,.
6

AEGL-3 Derivation
• POD = 185 ppm, cyanosis and dypsnea but no deaths at less than 3 days in rats, mice and guinea pigs; no deaths in dogs exposed 4 hrs to 224 ppm
• Dog values show threshold of lethality at higher concentration but these are above rat LCso '
• Time-scaling: Performed using cn x t = k where n values range from 0.8 to 3.5 (ten Berge et al. 1986). Due to limited data available, scaling was performed using n=3 for extrapolating to the 3D-minute, 1 and 4 nrs and n = 1 for extrapolating to 8 hours (NRC, 2001).
AEGL-3 Derivation (cont'd)
• Total UF= 30 - Interspecies UF- 3, there was less than a 2-
fold difference in the concentration at which dogs, rats and mice either were mOribund or died. All species exhibit similar effects.
"
-Intraspecies UF-10, systemic absorption does occur with exposure; possible increased sensitivity of some of the human population for development of methemoglobinemia
AEGL-3 Derivation (cont'd)
• Modifying factor (MF)= 2, applied due to the sparse data set; data exist for several species, but all performed by one laboratory and raw data and details were limited
• Total factors applied = 60
• 10-minute value will be same as 30-min.
21
7

AIi=GL-3 values derived by using 185 ppm as POD
tD-mln,", 3D-mlnut. 1-hour 4-hour S-boUT
7.1 ppm 7.1 ppm
"- I 3.5 ppm ZJppm
(30mglm') (30mglm') (24 mglm') (15 mglm') (9.7 mg!m')
22
AEGL Numbers for Perchloryl Fluoride
EIpotun Dunl1811
CI ... H1caUon
AEGlrl QAO ppm OAOppm 0.40 ppm (NOIldisab!insl (1.1 mgJml) (1.7mgtml) (L7mglm1 )
AEGlr2 1.9_ 1.2 ppm 0.77 ppm (Disab!insl (S.Omg/ml) (5.0 mt!'m') U.2mg!ml)
AEGlr3 7.1 ppm 7.1 ppm i 5.6 ppm 3.5 ppm 23 ppm (l.etl!al) (30 mt!'m') OOmg/mJ) (24mgtm1) (15mg'ln') (9.7 mg,'mJ)
23
Standard Regulations/Guidelines
• ACGIH TLV-TWA and OSHA PEL-TWA: 3 ppm; Derived from Greene et al. (1960) study; value was approximately 1I10th of the 24 ppm concentration administered in experimental animals over repeated exposures (26 weeks).
• NIOSH IDLH: 100 ppm; Based on Greene's LC50 for rats of 385 ppm in an 4-hour acute inhalation toxicity study.
. ,.
8

'OOO.O''-~-_-~
100.0·+·······,·············,.
1.0
fIG 120 1fIG 240 300 360 420 480 -
9

ATTACHMENT 12
ACUTE EXPOSURE GUIDELINE LEVELS (AEGLs) FOR
TELLURIUM HEXAFLUORIDE CAS Reg. No. 7783-80-4
F F \/
F-Te-F
/\ F F
NAC/AEGL April 14-16, 2009 Alexandria, VA
ORNL Staff Scientist: Jennifer Rayner
Chemical Manager: Roberta Grant
Chemical Reviewers: George Woodall and Lynn Beasley

Hydrolyzes slowly into hydrogen fluoride and tellurium ion or telluric acid
Effects are consistent with severe irritation/corrosivity
One mole of tellurium hexafluoride may decompose in the moist atmospheres to form up to 6 moles of hydrogen fluoride.
However, the limited data set suggests that tellurium is much more than 6-times as toxic as hydrogen fluoride.
HF I-hr mouse LCso values: 342-501 ppm (NRC 2004)
If the acute inhalation toxicity of tellurium hexafluoride was due only to the hydrogen fluoride hydrolysis products, then approximate I-hr LCso values for tellurium hexafluoride would range from 57-84 ppm for mice.
However, 4/4 mice died when exposed to only 5 ppm tellurium hexafluoride for I-hr (Kimmerle 1960).
The increased relative toxicity of tellurium hexafluoride may be due to the tellurium moiety and the slow hydrolysis rate of tellurium hexafluoride.
BOTTOM LINE: AEGL values for tellurium hexafluoride cannot be derived by analogy to hydrogen fluoride.

Kimmerle, 1960
Single Exposure 4-hr exposures followed by 3-wk observation period
Rabbit (l/group) Guinea pig (l/group) Rats (2/group) Mice (4/group)
1 ppm: Respiratory dysfunction, pulmonary edema
5, 10,25,50, 100 ppm: 100% mortality
Time to Death (min) for Animals Exposed to Tellurium Hexafluoride for 4-hr
1 ppm 5 ppm 10 ppm 25 ppm 50 ppm
Rabbit - 480 140 80 60 Guinea - 360 120 100 70 Pig Rat-1 - 1440 100 85 70 Rat-2 - 1440 115 60 55 Mouse-1 - 960 130 75 50 Mouse-2 - 240 130 90 70 Mouse-3 - 1440 120 110 45 Mouse - 1440 110 110 60
Little species variability
Time-to death generally concentration-dependent
100 ppm
15 30
25 20 10 15 30 25

Rabbit (l/group) Guinea pig (l/group) Rats (2/group) Mice (4/group)
Single Exposure
Kimmerle, 1960
I-hr exposure followed by 3-week observation period
1 ppm: Increased hyperpnea in all animals
5 ppm: Severe damage to respiratory organs in all animals, very slow recovery, 100% mortality in mice (death between 24 and 36 hours)
Repeat Exposure
I-hr/day exposure for 5 days, followed by 3-wk observation period
1 ppm: No visible effects in the test animals observed, no liver damage in rabbits

AEGL-l Values: Tellurium Hexafluoride 10-minute 30-minute l-bour 4-b II" I a-uuur
NR NR NR NR I NR
NR =AEGL-l values are not recommended due to insufficient data. Absence of an AEGL-l value does not imply that exposure below the AEGL-2 concentration is without adverse effects.

AEGL-2 Values: Tellurium Hexafluoride 10-minute 0.022 ppm
0.22 mglm3
30-minute 0.022 ppm
0.22 mglm3
I-hour 0.018 ppm
0.18 mglm3
Endpoint: 3-fold reduction of AEGL-3 values
===;-===
Reference:Kimmerle, 1960. [Comparative studies on the inhalation toxicity of sulfur-selenium-, and tellurium -hexafluoride]. Arch. Toxikol. 18: 140-144.
Justified based on the steep exposure response curve:
Rabbit, guinea pig, rat, and mouse 4-hr exposure
1 ppm: Respiratory dysfunction, pulmonary edema
5, 10,25, 50, 100 ppnl: 100% mortality
Rabbit, guinea pig, rat, and mouse I-hr exposure
1 ppm: Increased hyperpnea in all animals
5 ppm: Severe damage to respiratory organs in all animals, very slow recovery, 100% mortality in mice (death between 24 and 36 hours)

AEGL-3 Values: Tellurium Hexafluoride =======r==========91
-minute I-hour 0.053 ppm
0.52 mg/m3
8-hour 0.017 ppm
0.17 mg/m3
Species: Rabbit (llgroup); Guinea pig (llgroup); Rats (2/group); Mice (4/group)
Concentration: 1 ppm Time: 4-hr Endpoint: Highest concentration causing no mortality Reference: Kimmerle, 1960. [Comparative studies on the inhalation toxicity
of sulfur-selenium-, and tellurium -hexafluoride]. Arch. Toxikol. 18: 140-144.
Time Scaling:Cn x t = k, where n=3 for the 30 and 60 min time periods and n = 1 for the 8-hr time period. The 30-min AEGL-3 value was adopted as the 10-min AEGL-3 value.
Uncertainty Factors: Interspecies = 1 Highly irritating and corrosive. Much of the toxicity is likely caused by a direct chemical effect on the tissues: this type of port-of-entry effects is not expected to vary greatly between species. Limited data suggest that the rabbit, guinea pig, rat, and mouse are similarly sensitive to the acute effects of tellurium hexafluoride.
Intraspecies = 3 Highly irritating and corrosive, and much of the toxicity is likely caused by a direct chemical effect on the tissues; this type of portal-of-entry effect is not expected to vary greatly among individuals. The steep concentration-response curve implies limited intra-individual variability.
Modifying Factor = 10 Account for sparse database and potential effects of tellurium

Tellurium Hexafluoride
i Guideline ~Duration ~ute 30 minut 'U~ "t uour 8 hour
GL-l R R NR NR NR AEGL-2 0.022 ppm 0.022 ppm 0.018 ppm 0.011 ppm 0.0057 ppm AEGL-3 0.067 ppm 0.067 ppm 0.053 ppm 0.033 ppm 0.017 ppm Selenium hexafluoride AEGL-l ].067 ppm 0.067 ppm 0.053 ppm 0.033 ppm 0.017 ppm AEGL-2 0.11 ppm 0.11 ppm 0.087 ppm 0.057 pm 0.028 ppm AEGL-3 0.33 ppm 0.33 ppm 0.26 ppm 0.17 ppm 0.083 ppm PEL-TWA 0.02 ppm (OSHA) IDLH 1 ppm (NIOSH) REL-TWA 0.02 ppm (NIOSH) TLV-TWA 0.02 ppm (ACGIH) MAC-(The 0.02 pp Netherlands)

•
100.000
10.000
1.000
0.100
0.010
0.001 o 60
Chemical Toxicity - TSD Data Tellurium Hexafluoride •
AEGL·2
120 180
• • • •
240 Minutes
300
t>tOEffeet
• •
uthal
AEGL
360 420 480

ATTACHMENT 13
Gasoline: Composition and Toxicology
Russell White American Petroleum Institute
___ ARril15,2009 1

Outline of Talk
Gasoline Composition
• Past
1990 Industry Average Gasoline (per Clean Air Act)
Oxygenates and RBOB
• Present
100/0 Ethanol In Gasoline (E1 0)
• Future
2007 Energy Act
1220 L NW • Washington, DC 20005-4070 • www.apLorg 2

Outline of Talk
Gasoline Toxicology
• Past 1978 Toxic Substances Control Act (TSCA) API Testing Programs
• Present Clean Air Act Section 211 (b) Requirements High Production Volume (HPV) Challenge
• Future EPA Programs
• Exposure Data Summary
1220 L Street, NW • DC 20005-4070 • 3

Gasoline Composition
Automotive Gasoline = Unleaded Aviation Gasoline = Very Different Hydrocarbon Composition + Lead
. 1990 Industry Average Automotive Gasoline
40 CFR 79.55(b)
Reid Vapor Pressure Benzene Content, Vol% Distillation, F Hydrocarbon Type, Vol%
Detergent Additive Package
Specifications 8.7+0.3 psi 1.53±0.3 T10123-133F T90325-335F Aromatics 32±2.7 Olefins 9.2+2.5 Saturates 58.8+2.0 Several But Non-volatile
1220 L Street, NW • Washington, DC 20005-4070 • www.apLorg 4

Gasoline Composition
• Typical Retail Gasoline Contains 200 - 300 Compounds
• Blended To Meet Regional or State Specifications
• Refinery Blending Streams • Straight-run Naphtha (Likely Hydrotreated) • Catalytically Cracked Naphtha
• Alkylation Naphtha • Isomerization Naphtha • Catalytically Reformed Naphtha
1220 L Street, NW • Washington, DC 20005-4070 • www.api.org 5

Gasoline Composition 1990 Clean Air Act Required Increased Oxygen Content In Gasoline
Reformulated Blendstock for Oxygenate Blending (RBOB) Oxygenates
Ethanol (10% v/v) MTBE (15% v/v) ETBE (17% v/v)
Refinery Marketing Terminal
Service Stations
~~~----~.~~--,---,--"""-.,..,,_, .. MyNNN ____ ~ "'_'"',."'''' ___ _
1220 L Street, NW • Washington, DC 20005-4070 • www,api,org 6

enelY .. JiII
SAMPLE
Carbon Number (Volume %)
4 5 6 7 8 9 10 11 12+
Gasoline Vapor
API 94·02 API 94·02 (liquid) (vapor)
5.1 18.9 16.8 46.4 18.6 23.6 19.4 7.8 20.7 3.1 11.0 0.2
5.2 0.0 2.1 0.0
1.0 0.0
1220 L Street, NW • Washington, DC 20005-4070 • www.apLorg 7

E10 Vapor
COMPOUNDS Gasoline VC E10VC 0/0 GC Area Isobutane 2.8 2.2
n-butane 13.1 11.6
Isopentane 34.8 34
n-pentane 13.7 10.2
trans-2-pentene 2.6 2.1
2-methylpentane 6.8 5.1
n-hexane 3.1 2.4
Benzene 2.2 1.6
3-methylhexane 1.4 1.2
Isooctane 1.5 1.3
Toluene 3.3 2.4
Ethanol 0.0 13.3 .. --~~"-"
1220 l Street. NW • Washington, DC 20005-4070 • www.apLorg 8

----,------
Vapor Condensate Generation
Heat Whole Gasoline
1220 L Street, NW • Washington, DC 20005-4070 • www.api.org
Chill Condensate
9

Future Gasoline
More Ethanol! • Possibly E20 • Increased Use Of E85? • Cellulosic Ethanol
1220 l Street, NW • DC 20005-4070 • www.apLorg 10

energ~ Gasoline Toxicology
• 1978 Toxic Substances Control Act (TSCA) • Gasoline Is A Mixture, Not On TSCA Inventory • CAS 86290-81-5
• API Refinery Streams Program • Building Blocks Of Gasoline
• Acute Battery on Whole Gasoline Liquid • Chronic Study On Whole Gasoline Vapor • Developmental Study On Whole Gasoline Vapor • Dominant-Lethal Study On Whole Gasoline Vapor
1220 L Street, NW • Washington, DC 20005-4070 • www.api.org 11

Ongoing Gasoline Studies
• CM Section 211 (b) Fuel And Fuel Additive Registration • Inhalation Studies • Gasoline Vapor Condensate • Gasoline + 6 Oxygenates Vapor Condensate
• 90-Subchronic Study w/Neurotox
• Immunotoxicity • Genotoxicity (Micronucleus and SCE)
• Developmental Toxicity • Reproductive Toxicity • Chronic Toxicity (Gasoline and Gasoline w/MTBE)
1220 L Street, NW • Washington, DC 20005-4070 • www.apLorg 12

211 b Studies
Subchronic NOAEL> 10,000 mg/m3 NOAEL> 10,000 mg/m3
Neurotox Negative Equivocal
Immunotox Negative Positive
Micronucleus Negative Negative
Developmental NOAEL > 20,000 mg/m3 NOAEL> 20,000 mg/m3
Reproductive NOAEL> 20,000 mg/m3 NOAEL > 20,000 mg/m3
Chronic In progress Not Done
1220 L Street, NW • Washington, DC 20005-4070 • www.apLorg 13

energ .. ti'I High Production Volume (HPV) Challenge Program
• Gasoline Blending Streams Category http://www.petroleumhpv.org/index.html
• Screening Information Data Set (SIDS) +
• Physical Chemical Data • Environmental Fate Data • Environmental Toxicity Data • Mammalian Toxicity Data
• Acute • Repeat Dose • Developmental • Reproduction • In vitro and In vivo Gentox
""-"-~---------- ~,------- ,-------~,~-"------------
1220 L Street, NW • Washington, DC 20005-4070 • www.api.org 14

Future Toxicity Data
• CAA Section 221(b) Requirements • Tier 1 - Literature Search And Exhaust Testing • Tier 2 - Testing Of Vapor Condensates • Tier 3 - No Rulemaking Yet
• HPV Risk-based Prioritization By EPA • 2200 HPV Chemicals To Be Reviewed And
Prioritized By 2012
• Follow-up Testing Or Exposure Studies
-,,""',,"'"'''''~''''~'~~'''
1220 L Street, NW • Washington, DC 20005-4070 • www.api.org 15

Gasoline Exposure
PPM of Total
Type of Exposure Qr Study Hydrocarbon Vapor
Typical gas station perimeter
(4 hour average)
Self service fill-up (2 minutes)
Refueling attendants
(15 minutes) (6 hours)
Mechanics
(15 minutes)
(6 hours)
0.26
10- 100
0.5 - 48 0.1 - 31
0.4 - 138
0.1 - 17
1220 L Street, NW • Washington, DC 20005-4070 • www.apLorg
Health Effects
None Expected
None Expected
None Expected None Expected
None Expected
None Expected
16

Gasoline Exposure
PPM of Total
Type of Exposure or Study Hydrocarbon Vapor
Human volunteers exposed to gasoline
(30 minutes) 200
CDC Medical Management Guidelines
for gasoline
Medical Literature for gasoline exposure
500
1000
>200
(8 hours) 160 - 270
(1 hour) 500 - 900
(1 hour) 2000
1220 L Street, NW • Washington, DC 20005-4070 • www.api.org
Health Effects
Slight eye irritation
Eye irritation
Eye irritation
Eye irritation
Eye irritation
Eye and throat irritation, dizziness.
Mild anesthesia
17

energ .. 1rI Gasoline Exposure
Summary of gasoline exposure data from literature and in-house sources. CONCAWE Report 97/52
http://www.concawe.be
1220 L Street, NW • Washington, DC 20005-4070 • www.apLorg 18

r" 7::$ ~ ~
-"
~ N
N
a r ~
....,
(l) -~
Z ~ . ~
» II
I V
I :r
S·
ea
:::J
0 _:J 0
'<
--I
0 N a a a
:::T
(J1
I .J:>
.
0 a -..
.J
Q)
a . i C
:::
J II
I \J
0
CD
" ....,
ea
en
-< •
I --
0 0
:::J
C
en
·V

ATTACHMENT 14
AEGL -Phosgene JDrgen Pauluhn Washington D.C., April 15, 2009
IIlI Bayer HealthCare Bayer Schering Pharma
1

Outline
1. Phosgene toxicology: past, presence, and future
2. Animal models and wealth of data 3. Rodents vs. non-rodents and relevance to
humans 4. cn x t = const. 5. Consistency with subchronic data (Kodavanti
et aI., 1997) 6. Derivation of acute reference concentrations
based on new data
2

Past, Presence, Future
• Past 7 Presence • Impurities of phosgene due to impurities from chlorine
production (e.g. Hel) • Many processes changed from liquid-phase to gas-phase • On demand consumption, no storage, de-emphasis on
transportation • Specific analytical methods and reference standards
available
• Presence 7 Future • Residue-/by-product-free intermediate not dependent on
fossil fuels and solvents. The demand of phosgene will increase in the future.
3

Past Inhalation Toxicology Studies: How to put into Perspective?
Ct=Co(l-e :tJ , (.) _ 3 [Chamber VOlume] 3 xl - 0 3-3 .
t95 nun - x -. nun chamber airflow 10 to 1
71
1200~----------------------------------------,
1000
I =t-; -200
.. ~~_ ... ~ Initial (Co)
TWA
-- 1 alrexeh8n;.lmln 10 air ex changealmln
O+-------r-----~------~------_r------~ o 3 4
Time [minI
71: Generation • Dissolution and evaporation • Dispersion in solvents (@-40°C) • Evaporation of neat phosgene
72: Characterization • Time-Weighted-Average (no profile) • Trapping agent (aqueous/alcohol mixtures) • Analyte: Cl- not intact phosgene
7.J: Exposure (chambers/specialized) • Breathing zone concentrations? • Non-homogeneity of atmospheres (8=3.5) • when t95 is not attained then TW A#Co • Instable breathing patterns • Masks/nostril tubes/intubation (larger species)
4

Macaca Mulatta (~1944)
c "E
I ro E "2 ~ oS c:
1000
800 -I
600 -I
o 400 ~ ~ ~
200
Ventilation..,s" Exposure Duration • Ventilation • • Breaths (#) • • •• •
••• • .- ~ • • • .--~. . ~ .. • ~-----'~ .. ,:::L. • ~. • · ---•• • •• ---1----
---j-------'.... --.. . . -. - --"--'.
• •
• • • •
•• • • •
I 60
~ 50
~ 40
c: "E
I ro E "2 « .... ~
30 ~
20
ro ~ []J
o I I 10 0.0 0.5 1.0 1.5 2.0 2.5
Time [min]
:!E ~ ~ o :::!;
Mortality
6
Exposure Duration x Concentration [mg/L x min]
100,,---------------------------------------------,
60
;s ~ 60
Cl b ~ 40 i=
Time of Death
• • 20 -t .........• .:I ••• ........• :. ............................. ..
••
Exposure Duration x Concentration [mg/L x min]
6
5

iii E "c § c:: o ~ ~ 0)
>
Mongrel-Dog (~1944)
• Ventilation 16,'----------------------------------~ • Breaths (#)
14
12
10
8
6
4
2
Ventilation vs" Exposure Duration
• • •
• • ,}t
• • •
• • • . ...--. ....-..
\ : • I _------.-------------- . t..+--------;-: • -. • • • • •
_ ... -
•
• . .---.--------...
. .---. .-. .---.... .-.
• I
•
300
250
200
150
100
50
o I I 0 2 4 6 8
Time [min]
10 12 14
~
~ 1: 0 ::!:
"C 0
"C:: 0)
C-O) .... ::J en 10 15 20 25 0 C. Exposure Duration x Concentration [mg/L x min] X
L.U .... 0) C. 100 en I Onset of Mortality £; It! 0) 80 .... III ,
E: .<:: 60 15 ., 0 "0 .. 40 E • ;:: ••
• ~ ... • 20 + .. • •
10 12 14
Exposure Duration x Concentration [mg/L x min]
30
16 18
6

Critical Comparison of past LCtso - Data
,......., c: E x
I')
E -C)
E ......... 0 10 .....
() .....I
1e+5 1977)
1e+4
1e+3
(1920- • 1947) (1920-
II 1977)
(1943- r=l ~-'t~;!r-+"'---(1941- 2006)
····=.~····i····tj:j····LJ····~······ ·····t·················J.~W2.1 ....... ~ ..... ' ..·1 ..... 1 .... ·~········ .. ··········~7 .. :·· : .. ~ ........... (.1977) ................................. . _~ ____ ( ........ 4: _ ,, __ _
1741 mg/m3 x min
(2006)
1977)
1e+2~--~----.---~----.----.----r----.----'---~--~ Mice Rats GPs Rabbits Cats Dogs Sheep Pigs Humans
Past data
Recent data
Studies with exposures <10 min excluded 7

Past Human Evidence
• Phosgene of the past ( < 1980) differs from ,modern' phosgene .
• Current situation: • Clean chlorine (no HCI)
• Gas-phase reactions generally preferred (no hydrolysis), no liquid spills
• On-site production & use (no transport or storage)
• Double-wall technology with sensing technologies in the void space flushed with N2 ("the global phosgene handbook")
8

Focus of New Studies
• Nose-only exposure of rats and dogs • Principal mechanism of toxicity and role of
HCI (acylation vs. hydrolysis) • Purpose-driven design of studies to verify /
refute inhalation studies of the past • Focus on lethal and non-lethal endpoints • Focus on most sensitive endpoints which are
indicative of pulmonary fluid imbalance • Long-term sequelae of high-level, short
term exposures
9

Why Non-Rodents (Dogs)?
• Species of choice for inhalation pharmaceuticals (validated technology, enormous data base, high human relevance).
• Oronasal breathing pattern and physiology more similar to humans. .
• Lung morphology and innervation more similar to humans, e.g. respiratory bronchioli, relative abundance of mucus goblet cells, less pronounced reflex-mediated mucosal defense.
• Arterial blood easier to collect (compared to rats).
10

Vagal Stimulation by Phosgene: Kretschmar vs. Painta/ Reflex
control
irritant vapor
irritant aerosol
time
flow
volume
URT
LRT
11

140
~ ~ 120 "0 0 ·c Q) 100 a.. g c:
80 0 (J
.9 Q) 60 Cl c: ro .c (J Q)
40
.~ ro Q) 20 0::
0
0
Analysis of Respiratory Reflexes in Phosgene-exposed Rats
!iWbU'*8!N%h" !J &M ~Mwmm~
1800
air phosgene MV 1600 -- control
• 0.43 mg/m3
~ 1400 ~ "0 0
1200 ·c Q)
a..
(..
~, r'>.-~~" r~cv~ \L' ........ , :,..
-'"' "- r"
---.--- 1.2 mg/m3
--- - 13.3 mg/m3 - - - 24.8 mg/m3 ---- 47.6 mg/m3 - -- - 210 mg/m3
AT
\\\' \ \/~\ )"r"-~-./'v--"- %'" \! \ \ ,/ r~"'- ~-::?~"'"
! .-' /" -'"
\ \\. /' ~ ..?' • -' ~ ". \ 1"":;/ v - ~'=,-e 1000 pre-exposure period (100%)
15
, \..-/? " -', o mg/m3
y
30
Time [min]
45
0.43 mg/m3 1.15 mg/m3
13.3 mg/m3 24.8 mg/m3
47.6 mg/m3 200 mg/m3 control period
60
• Changes in respiratory patterns ind
-c: 0 (J 800
.9 Q)
600 > +=> ro Q)
400 0::
200
0
0 15
• Exposure shorter than lS-min may produce false neg
l\~ -II."'\, --,
30 45 60 75
Time Elapsed [min]
• Cxt extrapolations from t'ong to t;,hort are most conservative ~~l~;:t~,;:, ',~,~~ 2
90

Directed-flow Nose only Expoure of Rats (Phosgene)
Certified COCI2 in synthetic air
(100 - 1000 ppm)
, , c $ ~w-w:;!'w~#..t{y~/ij4-""''''' «- ~~~m ,,-- "; ,
Nominal Concentration = Actual Concentra 1A¥.~lllIiiiiid.W;&;~~>;:eI{"iF{,' L ".di> ,,'> ''''':C<;;;~7tL+dRj~wdj;;tj£iMiLi_i •• §,tli\ti;\,,~,';A 't?;;;J."j;\{) :'<, ' "", ',;,is '" ,;: ;; bL;;'~;:~i:!I 13

etermination of Phosgene in sure Atmospheres
Analytical standard
CIJlCI + (I "(bH 2-HMP
Analytical Methods: C Nominal concentrations C 2-HMP - GC c Binos real-time monitoring C Paper tape real-time
~
> .... ~
stable derivative as final anal yte
Despite different principles, a delivered the same outcome
14

.......
U'1
~
o r Ol _. ::J
I CD
X
:::J'"
O
l C
en .....
o (J1
3 w - 3 _. ::J
("') o ::J .....
Ol -.
::J 3 CD
::J
r-t;
~g
., .,
m m
n
o I
I ...
.... 1' m
0
9-
o 11
~ lC
0
~ (f
) ~
3. ~ '
"
i, -0
Z
~ ..
::r
0 6.
0 (f
) ~
(f)
m
~lC
a m
0
~ :::
J :::
J ~m'<
3 ,,~
_.
::J
m
x -c
o I

sure
Exposure characterization
Animal endpoints
vacuum
Mixing of pressurized air I dilution air I phosgene gas
Chamber in scaffold
1---- Room ventilation - floor
Cart for individual dogs in slings
16

Beagle Dogs (Lung Function) Prior to exposure: After exposure:
12000 j MV
100001 0
I 8000
1
• E 'Q;' 6000 E ~,"oo~ ... e ~ltB
Lung Function Measurements "":L':-~ ¢
. Iia lib ilia IIIb IVa IVb
17

Summary I
• Instant change in breathing reflexes in rats, although transient in nature.
• Ventilation becomes stable after approx. 15 min exposure duration.
• No evidence of bradypneic periods (trigeminal stimulation in the upper airways).
• Dogs did not show marked changes in reflexes.
18

Rat:
Dog:
Non-Lethal Toxic Potency Study Design
Dose-rime-Response Study
-
Chronic sequelae of acute effects (lung fibrosis) Acute effects or reversibility . . ------------------------------------------------------------------~
Day 0 I Day 1 Day 3 Day 7 Day 14 Day 28
Proof-of-Principle Study Acute effects ----+
Hypothesis: Day 0 I Day 1 • dogs breathe more human-like
Day 84
• dogs are less subject to sensory irritant effects Exposure • effects in rats driven by irritant + sensory phenomena
19

Acute Lethal Toxic Potency of Phosgene in Rats
~ o ......... z. (\]
1:: o ~
100 (
90
80
70
60
50
40
30
20
10
LCt50: 1741 (1547 -1929)mg/m3 x min
LCt01: 1075 mg/m3 x min
• Mortality-predicted y = -709.0 + 234.2x; ,.z = 0.79 Confidence interval (95%)
o Mortality-observed • Mortality-10-min exposure (excluded)
• I f I-I f
o • 100 1000
Concentration x Time [mg/m3 x min]
Onset of mortality <24 hr postexposure
10000
20
99.9 99.8
99 -98
95 90
80 ~ 70 e... >-
50 :!:: ro t::
30 0 ~ 20
10 5
2 1
0.5
100
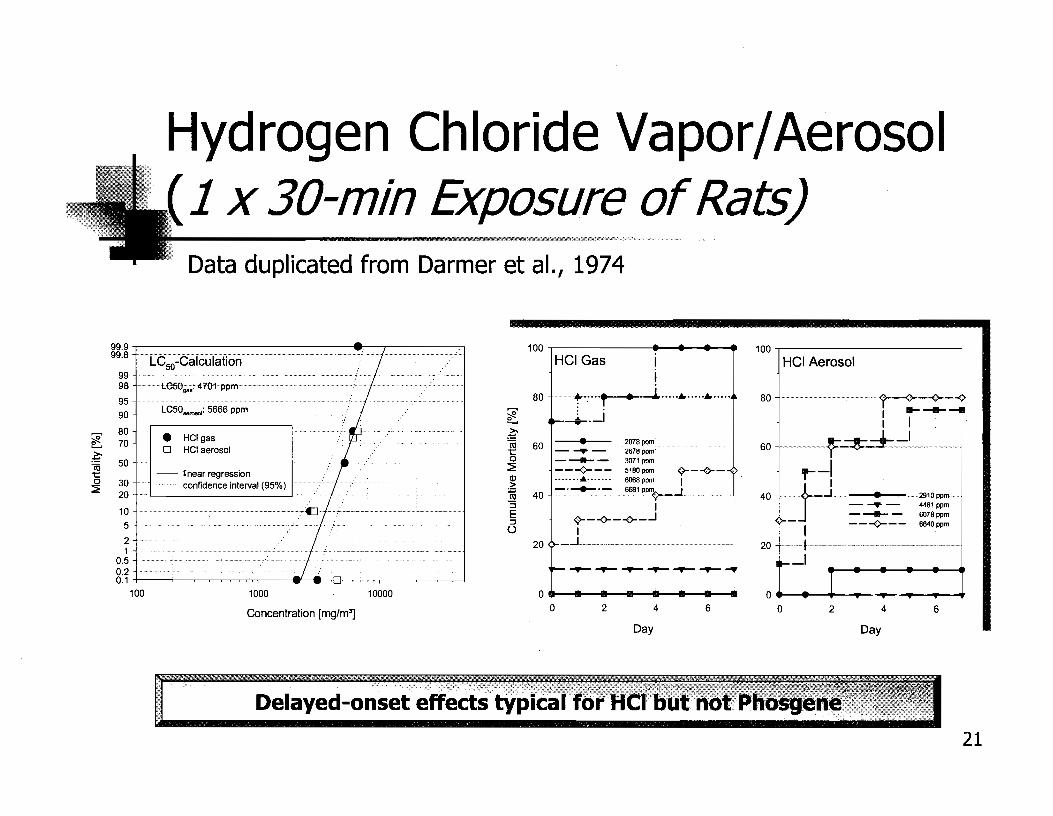
Hydrogen Chloride Vapor/Aerosol 1 x 30-min Exposure of Rats) Data duplicated from Darmer et al., 1974
LC50-Calculation
.. LC5{}g;;~:47{}1' ppm ...
LC50 .. """,: 5666 ppm
• HClgas o Hel aerosol
-- linear regression confidence interval (95%)
100 • • • • HCI Gas
80 m. t .... , • -L .................. .
.--+-.-i
f 6°1~ o --r--
~ ------¢I ---<>---~ ,.·····~A··~··a. ~ 40 -.__e_.-
3071 ppm
5180ppm \)---0--6068ppm I 6681P1lfll~_..l
::J E ::J U
I \)- - -<r - -<r _..J I
20 A.._..l
--- --- --- --- --- ---
100,--------------,
HCI Aerosol
80 +-t--<r-+I ----I I .
60 -+'f~-=-' ,--1
40 +m~j-1.m • -·2910""",,,· --r-- 44811l1lm - ____ - 60781l1lm
- 1 ---<>--- 6Ei4OIlIlm
20 _I
1000 10000 oe • • • • • • • o • • + y y y y + Concentration [mg/m3) o 2 4
Day
Delayed-onset effects typica
6 o 2 4
Day
6
21

Cxt Relationships of Phosgene and HCI are markedly different
Yprobit =bo +bllog(C)+b21og~); n =b1 / b2
2800,---------------------------------------------,
2600 ~ \ 2400 \
2200 c 'E 2000 x E 1800
--Cl .s 1600
x 14001. ()
1200
1000
800
\ \ \ \ \ v----.--\ I .. I.'
---_ ...
Phosgene
LCso • •
LCQ1
______ LC"Io,-calc
... • .. LC"tso-calc
- .... - LCtso-obs
C" x t = k; n = 1,12
600+1--~--,--~--.-~--._-~--._-~-~
o 100 200 300 400 500
Time of Exposure [min]
100T'----------------------------------------------,
90 • 5-min 0 10-min
eo" • 30-min '<l 60-min
70J-' ~---
~ 60
~ 50 1: o ::!: 40
o
30 ~ .......... .................,/ ............,'/, . ......, .. ,01, ····11
20
10
01 '<l" 0 ...
10 100
Concentration [mg/m"l
1000
3500-(1 ,.. I- Zwart(1990)
3000
~ 2500
.~ 2000 OJ
g 1500 CI It)
U 1000 ...J
500
o 10
D lln.'T~n.(
30 60 240
Time [min] 22

·Summary II !I-______________________ ............ __________ m"""',"W'~.tm~~..>,~n.<':';,
• HCI does not appear to play any modulatory role in acute toxicity.
• Short-term exposures should preferentially rely on exposure periods >30 min.
• Toxicity is determined by the retention of gas in the pulmonary region.
• Measurements in bronchoalveolar lavage are most sensitive to detect damage.
• Dose-response curves very steep, i.e., a highly controlled exposure technology with short tgs is required.
23

Time-Course of Edema Formation
280 .......e-- Lymph Flow
260 . .•. Lymph/Plasma-Protein Ratio -v- Pmv
~
~~ 240 e.....~
Sheep Q)~
5 ~ 220 I/) :J o rJ)
a. 8.. 200 >< x WW
I I 180 ~ ~ a..Q.. o .9 160
+-' Q)
~~ 140 :;::::;~ CC Q)
<DO::: 120 c::: ..•.... ::.: ::: : .. : ... :.:".,.'" .... ::.... . .. :.: .... 8011--~--~~--~--~--~--~--~--~
o 3 4 2
Time Elapsed [h]
Time Elapsed [h]
Exposure intensity: approx. 2443 mg/m3 x min (expos. 10 min) data from Brown et al. (2002), Keeler (1990).
24

Phosgene: Time-Course Studies do not show Evidence of Chronicity
3 7 14 28 84
Postexposure Day
Sireol Assay for Soluble Collagen 1e+5~--------------------------------------------~
1e+4
1e+3
1e+2
1e+1 .1
• Collagen ---.---~-
----rr--......•.. _._--.-_.--+----6------A-----+---
control 0.94 mglm3 x 30 min 2.0 mg/m3 x 30 min 3.9 mg/m3 x 30 min 7.4 mglm3 x 30 min 15.4 mglm3 x 30 min 0.2 mglm3 x 240 min 0.39 mglm3 x 240 min 0.79 mglm3 x 240 min 1.57 mglm3 x 240 min 4.2 mg/m3 x 240 min
-;::-:::: ~~ :..:::::-. =-.:::::""
3 7 14 28 84
Postexposure Day
Measurements in bronchoalveolar lavage fluid (rats) 25

Histopathology Postexposu re
- 3 Months
Histopathology findings of rats exposed nose-only to phosgene. Animals were sacrificed at end of the 4 or 12 week postexposure period. With the exception of the 4.2 mg/m 3 x 240 min group (postexposure period 4 weeks) all rats were sacrificed on postexposure day 84.
PararEt:er::" E>p::Eure: 1 X 30 minLt:.es ~: 1 X 240 mirut:es
Cl::nrert:J::atim ~ IhBJ3:E,An3] 0 1 2 4 8 16 0.2 0.4 0.8 1.6 4.2
------------------------------------------------------------------------------------------------------------------------------
Fb:El lilEJ..amratcry lilEilt:rat:.:iaE 2/6 1/6 1/6 1/6 2/6 2/6 1/6 1/6 1/6 1/6 0/6 Fb:El s:ptal thickallr:g 0/6 0/6 0/6 0/6 0/6 0/6 0/6 0/6 1/6 0/6 1/6 SEptal :Eil:n:sis 0/6 0/6 0/6 0/6 0/6 0/6 0/6 0/6 1/6 0/6 0/6 Pleural fft:m:Eis 0/6 0/6 0/6 0/6 0/6 0/6 0/6 1/6 1/6 0/6 0/6 ~ular:it:y/term. bJ:trr:hi 0/6 0/6 0/6 0/6 0/6 0/6 . 0/6 0/6 0/6 0/6 5/6
Gra:fu:g: all firrlirgs \'He Err:lrBi at tie :I.c:w:st:. gm::E 1, i.e. m:inirral 0. of 5 ratE of tiE 4.2 x ~o rrglm3 X min Eh:J....a:i a gm::E 2 ~ of tiE tErmimll:n:m:hi.ales), #/#: nni:E!:' of an:inals w.ith f:irrlirg3/ n.ntEr C£ an:irrals exarrin:rl.
26

Summary III
• ext-products of 1008 mg/m3 x min caused a BAL-protein elevation,..., 70-times the control.
• This LetO! dose was tolerated without mortality.
• No evidence of fibrosis or other long lasting, potentially irreversible effects at concentrations cytotoxic to alveolar cells.
27

Non-Lethal Toxic Potency -Acute Dog Inhalation. Study
2.5 I
Protein v • control
2.0 -I • 9 mg/m3 ... 16.5 mg/m3
V' 35 mg/m3
1.5
1.0 V'
\l
0.5 ... ...
O.O+I---------,--------~~--------~--------~------~
o 50 100 150 200 250
Exposure Intensity [C x MV]
Exposure: 1 x 30 minutes
28

Increased Collagen in BALfluid: What does this mean?
Rat
1e+5~------------------------------------------------------
~ ~ 1e+4 g c:: o ()
.9 & 1e+3 c:: co
.J:: ()
.~ 15 1e+2 Qi 0:::
Collagen
_ 1x30min _ 1 x240min
1000 1200 1e+1 ;I~--~--~--~----r---~---,----r---.---~----r---~---
o 200 400 600 800
Concentration x Time [mg/m3 x min]
Dog
160
Collagen 140 o
120 o :J C, oS 100 c:: 0
~ 80 c:: Q) t.l 60 c:: 0 ()
40
~ 20
0 0 9 17 35
Concentration [mg/m3]
Cxt: 270 "" 68
510 128
1050 mg/m 3 x min 263 ppm x min
The source of increased alveolar collagen is serum rather than a product from fibrocytes (myofibroblasts).
29

• No lobar differences in susceptibility (only one lobe lavaged) • BAL -protein more sensitive than histopathology
o ms/m' 9 m s/m' 16.5 ms/m' 35 m s/m Dog-no. 5 dogs 5748 5750 5756 5762 801 838 822 853 814 825 876 877 Sex (1 m + 4 f) m m m m m m f f m m f f BW (ksl 12.2±2.6 14.5 14.4 13.6 12.4 14.2 11.8 10.8 11.2 11 .9 11.8 10.7 10.6 Lung-BW 0.76±0.09 0.81 0.76 0.80 0.84 0.85 0.80 0.97 0.97 1.65 1 .95 1 .1 1 . 1 ra tio Edema + + +
Grades of Bronchoalveolar Necrosis I H~E!ercellularitt Cranial right 0 0 0 0 0 3 1 2 0 2 0 3 2 M ed ial rig ht 0 0 0 0 0 1 1 2 1 0 2 2 0 Caudal right 0 0 0 0 0 3 0 2 1 0 0 3 3 Access.right 0 0 0 0 0 2 1 2 1 0 0 2 2 Caudal left 0 0 0 0 0 2 1 3 1 0 0 3 3 Cranial left 0 0 0 0 0 3 1 3 1 0 0 2 0 Mean 0 0 0 0 0 2.3 0.8 2.3 0.8 0.3 0.3 2.5 1.7
Grades of Fibrinous Inflammation" Cranial right 0 0 0 0 0 0 0 0 0 0 2 0 0 Medial right 0 0 0 0 0 0 0 0 0 3 0 0 2 Caud al righ t 0 0 0 0 0 0 0 0 0 3 2 0 0 Access.right 0 0 0 0 0 0 0 0 0 2 1 0 0 Caudal left 0 0 0 0 0 0 0 0 0 2 2 0 0 Cranial left 0 0 0 0 0 0 0 0 0 2 3 0 4
Mea n 0 0 0 0 0 0 0 0 0 2.0 1.7 0 1.0 Reseiratorlr: Minute Volume
MV 1 (LIm in) 4.2±1.6 4.3 4.0 3.1 3.9 6.8 5.3 5.9 3.5 4.4 4.8 6.3 3.0 MV2(Llmin) (not 3.8 1.6 3.1 3.2 8.0 9.7 5.9 2.4 5.1 6.1 3.4 2.5 MV3~Llminl exeosedl 5.0 4.2 4.2 3.6 5.9 7.2 3.0 3.6 3.7 4.8 3.3 4.2
Bronchoalveolar Lavase and Arterial Blood Gases BA L- 0.16 ±O.O 26 0.14 0.18 0.12 0.14 0.51 0.26 0.39 0.21 2.18 1.87 0.78 0.87 Prot(g IL) BAL-PMN 0.27±0.28 1.3 1.3 1.3 2.3 3.0 3.0 3.7 1.0 6.3 8.3 5.7 6.0 (% ) ap02 96.0±5.3 88.3 94.8 96.4 99.3 100.2 94.6 97.1 104.0 73.4 66.7 87.3 91 .1 (mmHg)
30

Non-Lethal Toxic Potency Rats vs. Doas
lethal 1e+5r-----------------------------------------------~
......... ct.. ........ o
.t::; 1 e+4 c o t)
.9 Q) 0') c m .c t) 1e+3 Q) > :.;::. m Q)
0::
1e+2
BAL-Protein
• 1x6h - Rat (Hatch et aI., 2001) • 1x4h - Rat (Pauluhn, 2006b) v 1x30min - Rat (Pauluhn, 2006b) v 1x30min - Dog
Control (100%)
Dog
/
I Ix7 //t/ ___ _ -v{ .... .,.,..J /' '" . ". . ,. '
100 1000
Concentration x Time [mg/m3 x min]
I~ ARDS patients
31

Interspecies Extrapolation of Substances I nteracti ng with Su rfacta nt
350
300
250
200
150
100
50
o
Calculated Lining Fluid in ~I/kg-bw
Rat Human
• Alveoli 11.1 Trachea+pulm. Airway • Nasooharvnaeal
Total LF in lungs: human 20-40 ml-7 0.43 mg/kg; rat: 0.09 ml -7 0.36 mg/kg
Data from: R.A. Parent, Treatise on Pulmonary Toxicology (1991) 32

Phosgene: Mortality vs. BALProtein
Mortality 1e+5 3 -/- 100
BAL-Protein
- 1x6h - Rat (Hatch et aI., 2001) ....... - 1x4h - Rat (Pauluhn, 2006b) y I- 80 d( ......... .., 1x30min - Rat (Pauluhn, 2006b)
e 1e+4 - - - control data (100%) +-'
Upper specification c 0 - Exposures >10 min ()
.r [ 60 ~ 0 - Exposures -10 min +-'
~ Q) C) ro c 1:: m 0 .c 1e+3 40 ~ () Q)
1
.~ ~ +-' m I I
Q) :/- I- 20 a:::: I I
-.- _ .. - - ~ - .1 , 1e+2 ""'3!:_.- r~:::!::..--=--------- ----
~ ., 0
100 1000
Concentration x Time [mg/m3 x min]
Mortality occurs up to the first postexposure day (no delayed effects) 33

Summary IV
• Dogs breathe more human-like than rats.
• ACinary structure of dogs more humanlike than rats.
• Reflexively-induced effects are less pronounced in dogs. BAL -fluid not (or less) contaminated by proteins from airway secretions.
34

Comparison of Key Data
300
250
200
150
100
50
ext [ppm x min]
O~I ~
POD-Rat - 'NOAEL'-Acute Rat 13-wk
BAL- Histo Protein
NOAEL- POD-Dog LOAEL-Dog Dog
BAL -Protein
FEL
(Letal) Rats& Dogs
Let01-human
(Diller)
3S

Assessment Factors - Weight of Evidence Based?
• Endpoints can be integrating, target organspecific or mode-of-action specific. Each level produces its own POD.
• Hence, endpoints to probe critical effects differ markedly in sensitivity.
• Effect quality, human relevance, and usefulness as biomarker of exposure & effect need to be considered.
36

300
250
e c 0 () 200 g C1l Ol c: ca
150 ..c: () C1l >
:;:::l ca & 100
50 0
Lung Weights vs. BAL -Protein
Lung weights
-e- control -e- 3.9 mg/ffil ---"f'- 15.9 mg/ffil -'V- 54.3 mg/ffil ___ 118.1 mgfffil
2 3 4 5 6 7
Time Elapsed [days]
Protein in BALF aln,-------------------------------·············
~&XXJ e 'E4(XX) o o o -;;;3CXXl C) c: 1!LmJ o Q)
~ 1(0) ~ Q)
0:: o
o
.......e- oontroI
.......e- 3.9 rrgfrrP -T- 15.9 rrgfrrP -"r 54.3 rrgfrrP -II-- 118.1 rrgfrrP
234 5 6
lirre 8ap;ed [days]
7
Exposure: Polyisocyanate aerosol 1 x 6-h (rats) 37

Assessment Factors !"-______________________ .... __________ , :;~~..M..,·riiV'n
• Mode of action: High-surface tension lung edema due to surfactant depletion and Type I cell injury. Direct mode of action at the initia site of deposition.
• Interspecies dosimetric/morphometric adjustments: Alveolar ventilation, acinary anatomy, physiology: (Vt/Sf!'.p),A: (V~~SAp)ll = 0.25/0.39 : 25/89 >2 [L-min / m ]. vOI-LFA/vol-LrH <1. Acute rat data basea on SAL are implicitly conservative (NOAELacute < NOAEL13-wk).
• Intraspecies variables: Related to local dose (MV) and pre-existing pneumonitis (diminished reserve capacity of lung).
38

Derivation of AEGL-3
• Rat: species of choice, nose-only with phosgenespecific characterization of atmospheres. Exposure durations 10- to 240 min. GLP-compliant.
• LC01 (based on 30 to 240 min exposures): 1075 mg/m 3
(269 ppm); LCso :LCo1 = 1.6. • Toxicity depends solely on pulmonary dose. C1 x t =
const .. Rats inherently more susceptible than humans. • LCt01 of rats not different to those reported for humans
(and dogs). Hence, an AF-Interspecies factor does not appear to be justified. AF-Intraspecies factor of 3 seems to be defensible.
39

LCOl / 3 - Implicit interspecies AF: MV human : rat ~1 :3and~c~ Ve: SA ~2. Explicit intraspecies AF: 3. Toxicity target-site specific and direct. Confirmatory human evidence.
AEGL-1 (Nondisabling)
AEGL-2 (Disabling)
AEGt'1'3 (lethal)
ERPG -1 (Nondisabling)
ERPG -2 (Disabling)
ERPG - 3 (Lethal)
10-min
NA
0.6
3.6 ~ 9.0
All concentrations in ppm
30-min
NA
0.6
60-min 4-hours a-hours
NA NA NA
0.3 0.08 0.04
NR
0.270.5
1.0 71.5
40

Derivation of AEGL-2: Gross et al. Study (1965)
• Phosgene dissolved in kerosene and stripped-off for inhalation exposure studies .
• Exposure profile unknown, particle concentration unknown ("carrier effect',), methodological details lacking, indirect analytical method., nominal estimates lacking, virus infection of rats (hypothesized by the authors themselves).
41

Derivation of AEGL-2:Rat Data
• NOAELacut~ BAL -Protein < NOAEL13-wl<s histopathology (Le., not all prorein may be reflective or alveolar instability).
• NOAEL follows the Cl x t = const. concept. Effects observed at 4-hrs consistently more pronounced than at 0.5 hrs.
• Rats have a rodent-specific, reflex-triggered mucosal defense system (to prevent plugging of lower airways).
• NOAEL based on endpoints probing mechanism-based injury at the target organ level.
• Changes rapidly reversible and without long-term sequelae (even at the LC01 range). Increased BAL-protein occurs at ~LC01/10.
42

Derivation of AEGL-2: Dog Data
og 30-min Inhalation Study: • Identical exposure method of dogs and rats • BAL-endpoints (smallest lobe), arterial blood gases, lung
function, histopathology (time point: maximum response, i.e. approx. 24-hrs postexposure).
• Dose-response curve parallel to rat study. • N9AELo.s-h- BAL-protein: 75 ppm x min; POD: 94 ppm x
min. • LOAELo.s-h- BAL-protein: 125 ppm x min in dogs. • Susceptibility of dogs not different to that of humans.
Hence, an AF-interspecies factor does not appear to be justified. An AF-intraspecies factor of 3 is considered adequate.
43

PODBAL-protein / 3 - Explicit intraspecies AF: 3. Toxicity targef~Ht site specific and direct. Confirmatory human evidence.
AEGL-1 (Nondisabling)
ERPG -1 (Nondisabling)
ERPG -2 (Disabling)
ERPG - 3 (Lethal)
10-min 3D-min 60-min
NA NA NA
3.6 ~ 9.0 I 1.5 ~ 3.0 I 0.75 ~ 1.5
NR
0.2 ~ 0.5
1.0 ~1.5
All concentrations in ppm
4-hours
NA
0.20~ 0.35
8-hours
NA
0.09 ~ 0.2
44

Analysis of Plausibility • AEGL-3 (i-hour):
• 1.5 ppm (steep dose-response relationship; nose-only) • Leol-human x AFs ~ 300/(3 x 60) ~1.7 ppm (plausIbility test
passed)
• AEGL-2 (i-hour): • 0.5 ppm (MV and size of dog similar to those of children;
AFs adjusts for preexisting alveolar disease; no physiological changes at 2.1 ppm-60 min (time-adjusted); no evidence of potential long-term sequelae)
• TLV 0.1 ppm x 480 min ~ 0.8 ppm-h (plausibility test passed)
45

EU and OELs - Impact of New Data
• MAK 0.02 ppm -7 0.1 ppm (TWA) • Ceiling 0.04 ppm ~ 0.2 ppm (STEL)
• Multiple EU-countries followed • seOEl: to be discussed in June 2009.
Rationale: NOAELDOg BAL-protein = 300 mg/m 3 x min or 75 ppm x min ~ 75 ppm x min/480 min = 0.15 ppm ~ 0.1 ppm. No AFs necessary
based on species selection (dog) and direct mode of actions.
Results published 3 publications and 1 workshop summary.
46
ATTACHMENT 15 I
Development of Acute Exposure Guideline Limits Using Oral Data
George M. Rusch,
April, 2009
Honeywell

AEGL
Factors Influencing Dose
Oral
-Chemical reactivity
-Uptake from Gut
-Chemical Changes in the Gut (acidic vs. lung slightly basic)
• Inhalation
-Chemical reactivity
-Solubility
-Volatility
-Uptake from upper respiratory pathways
-Uptake from lung
-Deposition in lung
-Particle size
• Gavage
-Can not be compared to inhalation (Bolus vs Integrated)
Honeywell

Oral Dose (mg/kg)
Oral dose = p * dose /body wt. (kg)
p = percent taken into the body
dose = amount administered (mg)
Honeywell

Inhalation Dose
Inhalation dose = a * exposure level * min. vol. * length of exp.
body wt. (kg)
• a = amount retained in entire respiratory system
• Exposure level = mg/m3 (can be in other units e.g. mg/L)
• Min. vol. = amount of air inhaled per min. (m3)
• Length of exposure = total minutes (e.g. 6 hrs. = 360 min.)
Units must be consistent
If exposure level is mg/m3 ;min. vol. must be in m3
If exposure level is mg/L; min. vol. must be in L Honeywell

Comparison: Oral to Inhalation
Oral dose = p * dose /body wt. (kg)
Inhalation dose = a * exposure level * min. vol. * Igth of exp. body wt. (kg)
Assume p = 1
• Then: Dose(mg)/body wt.(kg) == a*exp. level*min. vol. * Igth of exp.
body wt. (kg)
E.g. Exp.level = mg/m3; min vol. = m3/min; 19th. of exp. = min
Honeywell

Example: Oral to Inhalation
Oxamyl: Oral LDso male rats = 2.5 mg/kg Estimate 4-hr LCso Assume: a = 0.9 (i.e. 90%
)
Rat body weight is 0.300 kg (i.e. 300 gm.) Rat min. vol. = 160 mL or 0.00016 m3
dose /body wt. (kg) == a * exp. level * min. vol. * Igth of exp. body wt. (kg)
2.5 mg/kg = 0.9 * exp. Level * 0.00016 m3/mino * 240 min. 0.3 kg
Exp. Level = 2.5 mg/kg * 0.3 kg 0.9 * 0.00016 m3/min * 240 min
Exp. Level = 21.7 mg/m3 Honeywell

Example: Inhalation to Oral
Oxamyl : 4-hr Inhalation LC50 male rats = 64 mg/m3 Estimate Oral LD50 for male rats Assume: a = 0.9 (i.e. 90%)
Rat body weight is 0.300 kg (i.e. 300 gm.) Rat min. vol. = 160 mL or 0.00016 m3
dose /body wt. (kg) = a * exp. level * min. vol. * 19th of exp. body wt. (kg)
Dose = 0.9 * 64 mg/m3 * 0.00016 m3/min * 240 min. 0.3 kg
Dose = 7.37 mg/kg
Honeywell

Comparison: Inhalation to Oral
For an oral dose of 2.5 mg/kg the estimated 4-hr Inhalation LC50 is 21.7 For a 4-hr inhalation LCso of 64 mg/kg the estimated
oral LDso is 7.37 mg/kg.
Ratios: 21.7/2.5 = 8.68 and 64/7.37 = 8.68
Honeywell

Limitations: Oral to Inhalation
-Often do not know a or p -Toxicity of chemical can alter minute volume during exposure (e.g. irritants and eNS depressants will lower minute volume, therefore the dose will be lower) -Uptake in upper respiratory system will lead to different distribution than in lung -For poorly soluble particles, poor clearance from lung can lead to higher dose -For poorly soluble particles poor uptake from digestive system can lead to lower dose. -Oral uptake initially entrohepatic circulation -Inhalation uptake is into systemic circulation -Oral dosing often underestimates the toxicity by inhalation
Honeywell
-

ATTACHMENT 16
Route-to Route Extrapolations
Jurgen Pauluhn
Bayer HealthCare Wuppertal, Germany

e Extrapolation Oral to Inhalation
o Absorption profile: AUC vs. Cmax
o Metabolism: Toxification vs. Detoxification
o Toxicophoresis: GI vs. Lung o (Neuro-)Physiological responses
specific to the respiratory tract, reflexinduced changes in thermoregulation, acid-base status

e Dosimetry and Test Design
o Equivalence of exposure regimens o Dose generated equal the dose delivered? o Variables affecting absorption # variables
affecting deposition & retention o Portal-of-entry effects, regional deposition
and systemic effects .

e Exposure Regimen
o Fixed-time - variable exposure concentrations protocol/continuous generation
o Fixed-time - variable exposure concentrations protocol/discontinuous generation
o Fixed concentration -variable exposure-time protocol
i so
,g ,: 60
~ 8 ..
120
100
'E ]: '0
g ~ 60
~ 8 40
20
, 5.
.... ~ S. 150
~ ~
) 10.
,.
A
B
c
\ \ \ \
10 15 2C 25 30
Tim III [m in)
c .. (mg 1m' air ~ Vd 50 L
60 min
10 Hi 20 25 30
Time[min)
\ \ \ \ \ \ \ \ \ \ \ \ \ \ \ \ \ \ \ r---r---r---
10 15 2D 25 30
rim e (m in}

e CI ·d . I throl S iN M H H (C'CI Type II Pyre ~ °llYI'o/ 'V'H VF~ H,c CH,
I I
~ -.. C)
E ....... o LO o ...J
1400
400
200
Cyfluthrin Oral LD50
Inhalation 1x4h (LC50 405 mgfm3)
• o~
Jf '~ .t<0 ~0 'o~
~~ ~-s
~«) (;,-0,
~ Ow' ~0
Solvent
(!)t,.r§l
q«)
5:) (!)t,.rs
4<;

e Route-to-Route Extrapolation -Compartmentalization
......
8 7 6
f 5 o
~ 4 .&::
0" 3 ....... 2 1
o
• Brain
O.25h 3h 19h
Time elapsed after cessation of esposure
Dosimetrically adjusted exposure: oral = inhalation
0.1
X 001 , . l5 E ::J
16 0.001 l I' t· ~ 1 Oral App lea Ion C)
E. 5 ~ c:
g 0.1 o U
0.01
0.001 +1----'--..,.---' o 3 19
Time Elapsed after Administration[h)

e Impact of Route of Exposure (Type II Pyrethroids)
39
38 (j) -c co 37 s... Ol
:.;::::; c: Q) 36 0 ....... ~ .a 35 co s... Q)
~ 34 Q) I-
~ 33 o o
3Z. •• P. 6 h nose-only
.~ ~. ..~. ."..,
¢ T.., ".,vr~I~--------------~ "..... ___ vehicle (1 x 6 h)
.' 10 mg/kg in Cr-EL -T- 10 mg/kg in PEG -T' 250 mg/kg in PEG -0- 80 mg/ml in PEG (1 x 6 h)
exposure 31 +I--~-'--~--r-~--'-~---.--~-'--~-.--~--'-~ o 2 4 6 8 10 12 14
Time Elapsed [hours]
PEG: Polyethylene glycol E 400

e
39
38 ....--. ()
0 37 .......... (]) L..
:::J 36 .... co L.. (])
35 0.. E (])
34 I-
33
32 0
Respiration & Body Temperature
2 4 6
----e- sensory irrita nt ..• sham -"T-- nose-only exposure (air)
8 10 12 14 16
Time [hours]
End of Start of new expiration braeth
ET
."-'"
ilP:"raCing AT Flow:5
200 msec
Response to • ~ Heat dissip~tion ~ ~ Respiration & dosimetry toxicants metabolism

• • I Type II Pyrethroids: Arterial BloodGases I Acid-Base-Status
7.48 I 39 -.-----------------,
7.46
7.44
7.42
7.40
7.38
7.36
I ~pHl
-20 30 En 120 180 2AO
Tirm [Minutes]
--+- Temp. [Deg.CeI.] 37 -t}- pC02 [mmHg]
35+--k~--~~~--~
33+1------------~~~
31 I \ \ 29+-~--~~--~~~
-20 30 60 120 180 240
Time [Minutes]
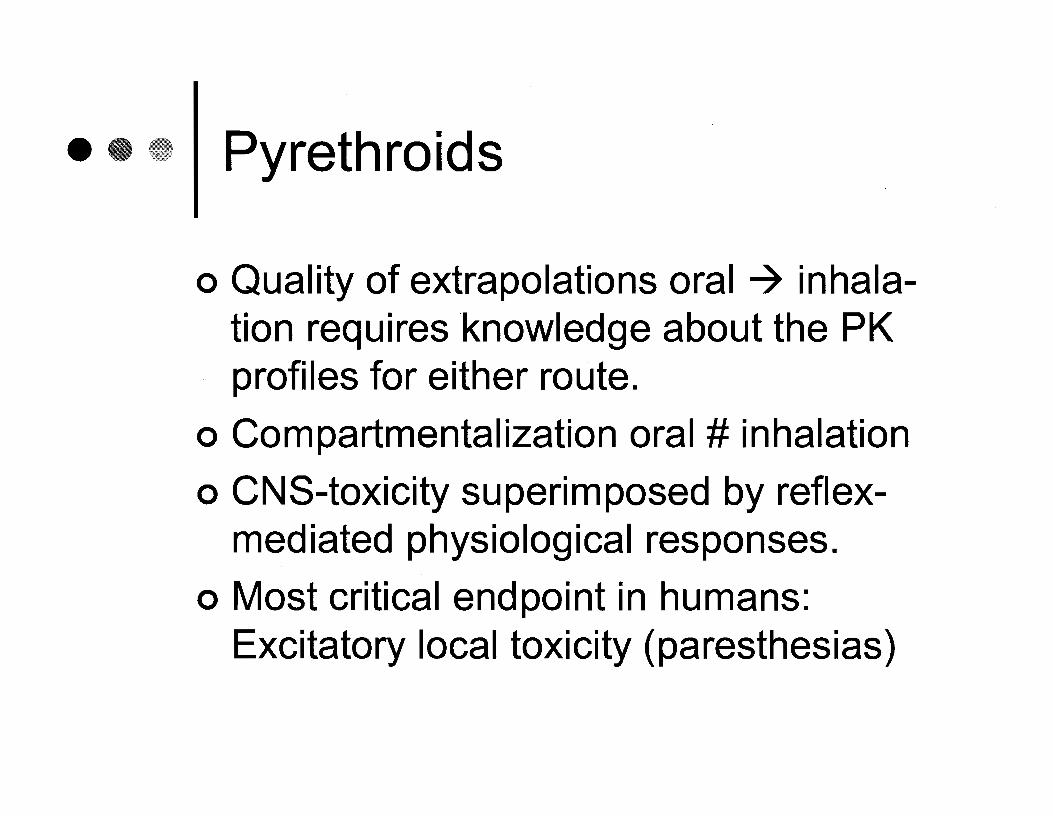
• I Pyrethroids
o Quality of extrapolations oral -7 inhalation requires knowledge about the PK profiles for either route.
o Compartmentalization oral # inhalation
o CNS-toxicity superimposed by reflexmediated physiological responses.
o Most critical endpoint in humans: Excitatory local toxicity (paresthesias)

e LDso-GavagejLCso-Inhalation: Dispositional· Factors
o It)
o ....J r:: o
:.;::::; co (ij .c:. r:: -g o ....J
~ o
Organophosphates 100 ...,-, -------------
• 1h - males o 1 h - females • 4h - males o 4h - females
10 I regression
••• 1
1:1 •
o DO •
1:1
• o
actual p(ltcncy than
• •
o·
.Q 0.1 o 10 • a: D
m;,tmtl pulen"y inhalation lower thall
o o
o
0.0 1 +-------.--,---,---,-,---:~;::::;::===---:-~-,---,--_.____._---,----r-,_,__-____,r___._~
10 100
Oral LD50 [mg/kg bw]
Data from: J.E. Storm, K.K. Rozman, and J. Doull, Toxicology 150, 1-29 (2000).
Range:±10too high I too low

e Pesticides - Route-Dependence of NOAELs
1000
• NOAEC based on systemic effects 0
c 100 t ~_:~~~o~~:d :n~~ca~~lS _ ~ ___ 0
:0::; rn en • .c c
..J W 10 0 z
1 · · -en • ~
0 • • ..J 1 "~~'~'-'""C'"-'--""C'~'~'-
W ------- .,.. • « 0 z 0 0.1 -L_~_~. ' L.~,.~ ___ ~.
:0::; rn 0::
I • • actual 0.01
0.001 0.01 0.1 1 10 100 1000 10000
NOAEL Subchronic Oral [mg/kg-d]
Basis: Inhalation studies 3-4 wks and 4-wk feeding or gavage: 71 %, ~13-wk dietary studies: 29% (n = 42)

•• I Summary I
o For simple, systemically acting pesticides (primary acute mode of action eNS) extrapolated values differ from the correct value by range of 1-100.
o For subchronic studies for systemically and locally acting substances the range was <1-1 a and 1 0-700, respectively.
o General tendency: Toxicity by inhalation is underestimated by oral data.

e GI-Tract Related Toxicophoresis
Detoxification
NH2
HS0cOOH cysteine
orGSH l CS2
l COOH
t<. SyN ...... H S
thiazolidine-2-thione-4-carboxylic acid (TTCA)
H I S Y N---.IV 5- propineb
~ l Zn2
' ---.... Pulmonary toxicity
71's----+.. Paralysis (monoplegias)
H I s
yN---.lVS-~ /H
N I H
~·------------i-·H" S // H --''''''''',,-, \ s \
~ H3CyNH'
cS2 l...NH,
propylene diamine
I Ny \ I \ ( CH3--1 - l propylene \ ~N, t}liourea (PTU)
---+.. Thyroid , H ! " / ~ //
" "_~~ .... __ ~_~ ~~' ~,",~c"~/;./'.

Disposition and Response • e I (1-wk Inhalation Exposure-Rats) I
1.0 -------- -----
I 35 Protein
~ :1 TCC ___ conlrol
k ___ control
0.8 ~ ___ 1 mglm3
___ 1 mglm3 ~
--'If'- 5r
:::i' ___ 7 mg ZnOlm' -<;;J- 25
:9 ___ 7 mg ZnOlm' < c 0.6 CD ,g .s 20
~ .sa c q; 8 0.4 0 15 c -0 0 0 ~
..0 10 E 0.2 -{ ~ • :::I
Z 5
0.0 0 0 2 4 6 8 10 12 14 16 0 2 4 6 B 10 12 14 16
Postexposure Day Postexposure Day 2.0 60
Phospholipids in BALF ___ control ___ conlrol ___ 1 mglm'
50
lu
___ 1
~ j 5mglm3 ~ --'If'- 5 11
.
5
.
25mglm' -<;;J- 25 mglm' ___ 7 mg ZnOIm' <I)
--- 7 mg ZnOlm' '8 40 u.. '0 ..J < :p CD 1.0 ..0 30 .S: E <I) :::I 'C C :§- g;! 20 "0 "" .c: ro <I) 0.5 & 0
0-10
0.0 0 0 2 4 6 8 10 12 14 16 0 2 4 6 8 10 12 14 16
Postexposure Day Postexposure Day

• •• I Inhalation vs. GI -Tract NOAEL's in Rats: Oral vs. Inhalation
Gavage Feeding Inhalation (gO-day) (2-yrs) 1-4 wks
Neuro- <5 5 1.4 muscular
Thyroid 5 0.5 >28
Lung ~1.4
(4 mg/m3)
Units: mg x kg-1 x day-l

• I Summary II
o Substances undergoing route-specific toxicophoresis may not be subjected to route-to-route extrapolation .
. 0 Toxic profile changes with route and • regimen.
o NOAELs change with route and regimen.

e
"dead-end metabolism'
Hematotoxicity of Arylamines H, ...... OH
6 ij
P+
PH
Aniline
6NH2
I~ ~
NH2 &OH NH2
o
"N~ 6 acetylation
I o
"N~
OH OH
Glucuronide and sulfate conjugation and renal excretion

e niline - Route & Time Depenence of MetHb-Formation I
~ ........
Aniline - Dog Inhalation Exposure 30~--------------------------------------------.
25
20 • 30 min
gavage
\
~ 0)
..lI::
/ /
.. /
/./
/.'
./
/'
/ --..c I 15
• 60 min " 90 min v 120 min
• 180 min
/ ~--/ /,/" --'0)
E -Q)
~ ./ //
/---/ .-' 10
• 240 min U") .,...
::.-- . ./ ----'I! // .-/''/ \/ ~ /' y
5 ",./ --- ---~.'I '. . ,./ --------------. _ .. --
o = .' , ~;-?!Cc'-'--l-- ...• i! , I , ! •
, i ·1
o 100 200 300 400 500
Concentration [mg/m3]
H, /OH
6
6NH2
I~ ~

e
...... ';/!. ........ .0 J: -CD ~
Aniline - MetHb-Formation following equal Doses after Inhalation & Gavage
30
25
20
15
10
5
0 0 2
___ inhalation exposure ___ gavage
: en:! d irflalation exposure
4 6 8
lime [hours]
Exposure profile more important than total dose
Exposure profiles need to be identical to compare dose 8~-------------------------------------------------.
__ dog no. 5
7 -I .• " dog no. 6 -T- dog no. 7 ~ --T "" dog no. 8 " "~ "
61 - y = 0.35 + 0.42x· 0.0064;; r2 = 0.87/ "/"" ~
...... 5 ~ ~ 4
~ "". 3
2
D. = C x tx MV. x r 1 1
O+-~~~~~~~~~~~~~~~~~~~~~
o 2 4 6 8 10 12 14 16 18 20
Calculated Exposure Dose [mglkg bw]

e e - I Conclusion
o GI-tract dosing due to particles deposited in the extra-thoracic region have to be considered.
o Non-inhalation routes do not necessarily predict what happens following inhalation.
o In the absence of PK-data and knowledge about the critical toxic mechanisms do not extrapolate from oral to inhalation or, alternatively, apply an AF of at least 25.