Naartjie Grand Opening Strategy
40
88 Grand Opening Media Strategy
-
Upload
wesleykerfox -
Category
Marketing
-
view
72 -
download
5
Transcript of Naartjie Grand Opening Strategy
88
Grand Opening Media Strategy

Po#sgrove, PA
Des-n, FL
Charlo#esville, VA
Winder, GA
Cleveland, TN
Jacksonville, FL
Savannah, GA
LOCATIONS

COMMUNICATION GOALS CREATE AWARENESS, DRIVE ATTENDANCE, CREATE LOYALTY
Reach Based Planning
Define Target Audience
Define Marketplace
Media Mix
Campaign Duration
AUDIENCE
MASS REACH
DEFINE DEMO
Monitor Analytics
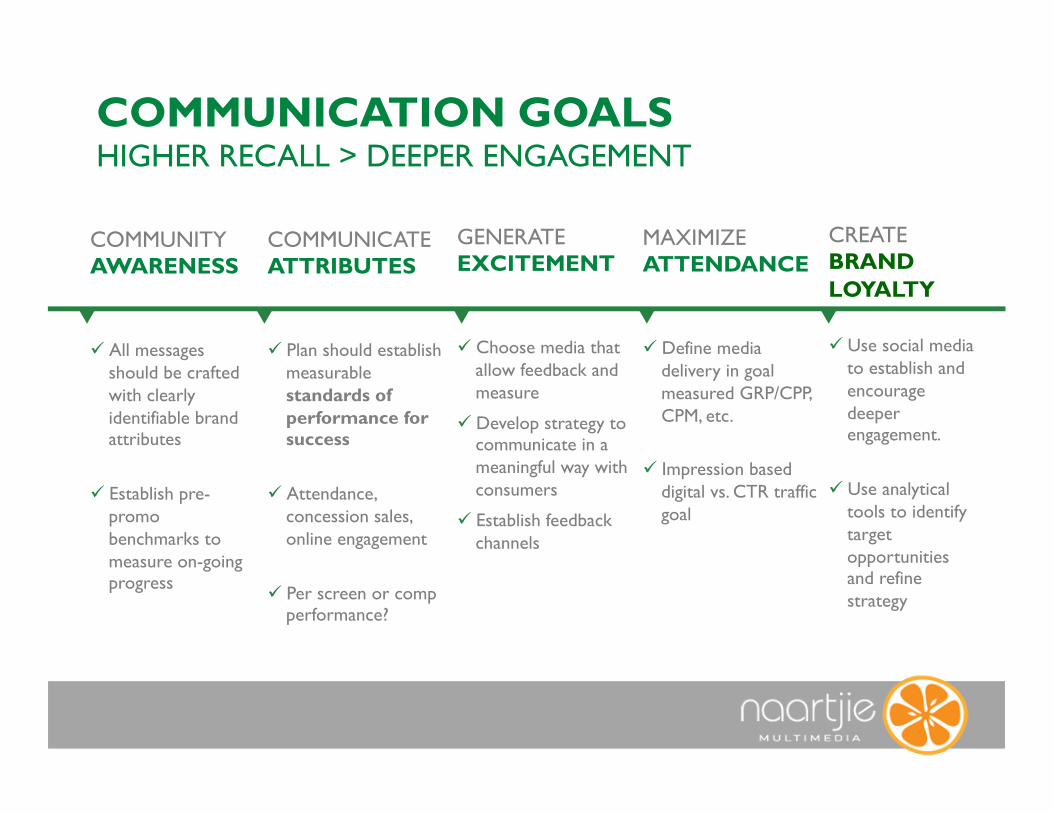
COMMUNITY AWARENESS
All messages should be crafted with clearly identifiable brand attributes
Establish pre- promo benchmarks to measure on-going progress
GENERATE EXCITEMENT
Choose media that allow feedback and measure
Develop strategy to communicate in a meaningful way with consumers
Establish feedback channels
COMMUNICATE ATTRIBUTES
Plan should establish measurable standards of performance for success
Attendance, concession sales, online engagement
Per screen or comp performance?
CREATE BRAND LOYALTY
Use social media to establish and encourage deeper engagement.
Use analytical tools to identify target opportunities and refine strategy
MAXIMIZE ATTENDANCE
Define media delivery in goal measured GRP/CPP, CPM, etc.
Impression based digital vs. CTR traffic goal
COMMUNICATION GOALS HIGHER RECALL > DEEPER ENGAGEMENT

SET DELIVERY OBJECTIVES
Reach & Frequency Dominate, promotion,
sustaining
MEDIA AVAILABILITY
OUTLETS Avails,CPP, CPM
SUBMIT PLAN & BUDGET
Reach based zero budget cost driven
EXECUTE PLAN Make buy, traffic
produc1on Monitor and admin
IDENTIFY MEDIA PARTNERS
Local engagement Remotes, value added, etc.
POST BUY ANALYSIS
Verify and analyze alter base template
DEFINE MARKET
Geography Footprint
PRE-‐LAUNCH POST EVENT/SUSTAINING
MEDIA PLANNING CHECKLIST
4 -‐6 month
LAUNCH
IDENTIFY CHARITY Coordinate with staff And engage supporters.

• Establish min. reach and frequency goals (80/5) • Achieve optimal mix/levels for different campaigns Media Weight Levels
• Define campaign length and awareness goal • Apply flighted strategies/message management
techniques Measured Flighting
• Develop strategies grounded in customer trends • Multiple channels yield delivery efficiencies (3 rec.) Media Selection
• Define digital opportunities • Determine appropriate investment levels Digital Strategy
• Measure campaign success, business growth with changing marketing priorities
• Redefine objectives and strategy Optimal Investment
DRIVING MEDIA EFFECTIVENESS VARIETY OF VARIABLES AFFECT BUDGET/RESULTS

REACH BASED PLANNING DEFINES THE TARGET AND DELIVERY CHANNELS SETS REASONABLE GRP LEVELS FOCUSES ON ACHIEVING REACH & FREQUENCY GOALS
AUDIENCE
SET GOAL
REACH
DEFINE DEMO
FREQUENCY

IS IT COST EFFECTIVE EVALUATE USING CPM VS. CPP >
REACH
CPP
– Allows comparison between media & targets • Can index a CPM because universe base is equal
– Example: • Men 18-49 Universe = 300,000 • Women 18-49 Universe = 400,000 • Vehicle Unit Cost = $50,000
– Delivers 10 GRPs to Men and to Women
CPP: Unit cost / GRPs Men = $5,000 Women = $5,000
CPM: Unit Cost / Impressions Men = $16.67 Women = $12.50
CPM

RECOMMENDED GRP LEVELS PLAN TOTAL DELIVERY BASED ON WEEKLY DELIVERY GOALS
Objective Weekly GRPs Weekly Reach 4-Week GRPs 4-Week Reach
Dominate 425 90% 1,700 95%
- Television (cable) 275 75% 1,100 90%
- Local Radio 150 53% 600 71%
Base (promo) 130-160 65% 520-640 90%

0--
TV, 29%
Cable TV, Online, 29%
News, 1% Magazine, 1%
Other, 3% Radio, 4%
Mobile, 18%
MEDIA USAGE DRIVES CHOICES MEDIA SELECTIONS BASED ON DEMOGRAPHICS
Time spent per day
• Robust database Offers insights into programming and
marketing to listeners
Provides engagement metric with stations and advertised brands
• 22% of people who visit a Broadcast Radio station website clip advertiser coupons

Note: costs vary significantly by market and geographic area, as well as number of available media outlets. Costs are an average estimated cost.
Media Mix ENSURE MEDIA WEIGHT ACHIEVES REACH AND FREQUENCY GOALS
TV/Video
mass reach awareness emotion
Digital
flexiblility interactivity
personalization extend video reach beyond
TV
message detail dwell time
engagement trustworthiness
Radio
call to action reach and frequency trusted
presence dayparting
Outdoor
creative cut-through
awareness visual
innovation proximity

0--
TELEVISION STILL THE DOMINATE VIEWER CHOICE
• TELEVISION STILL KING Highest number of gross viewers
Highest level of usage
• 40% of people engaged with media are using TV
• Across all demographics average TV usage tops 3.5 hours per day
Household Penetration
90% 85%
70% 65%
90%
60%
40%
0% 10% 20% 30% 40% 50% 60% 70% 80% 90%
100%

0--
TELEVISION WHY USE CABLE?
• TELEVISION STILL KING Local cable TV allows you to focus your
message and precisely target your most valuable potential customers in a desired demographic area
DMA Interconnect
Ad tag – Ad copy

0--
TELEVISION STILL THE DOMINATE VIEWER CHOICE • During 2011/12 season, Adults 18-49 watched roughly 32 hours of TV per week
– Equates to nearly 4.5 hours per day

0--
• During 2010/11 season, Adults 18-49 watched roughly 32 hours of TV per week – Equates to nearly 4.5 hours per day
THE CHANGING LANDSCAPE TRADITIONAL MEDIA CHOICES LOSING GROUND
+32% growth in
Mobile
+8% growth in Internet
TV still majority of time spent
Share of Time Spent per Day with Media

0--
DISADVANTAGES
Radio market can be fragmented
Must purchase multiple stations to reach all target market segments.
Attention can be low (background clutter)
Commercial Clutter lack of visual impact
UNIT SELECTION
BACK TO BACK SPOTS are cost effective way to support multiple messages.
:30 Grand Opening (Features)
:30 Charity Night
:30/:30 doubles GRP delivery
ADVANTAGES
A cost effective mass medium capable of easily delivering your message to many people
Targetable (by demo, lifestyle and geography)
Appropriate for call-to-action
Trusted environment gives positive halo to ad messages
RADIO TRUSTED MEDIA DELIVERS LOYAL AUDIENCE
0--
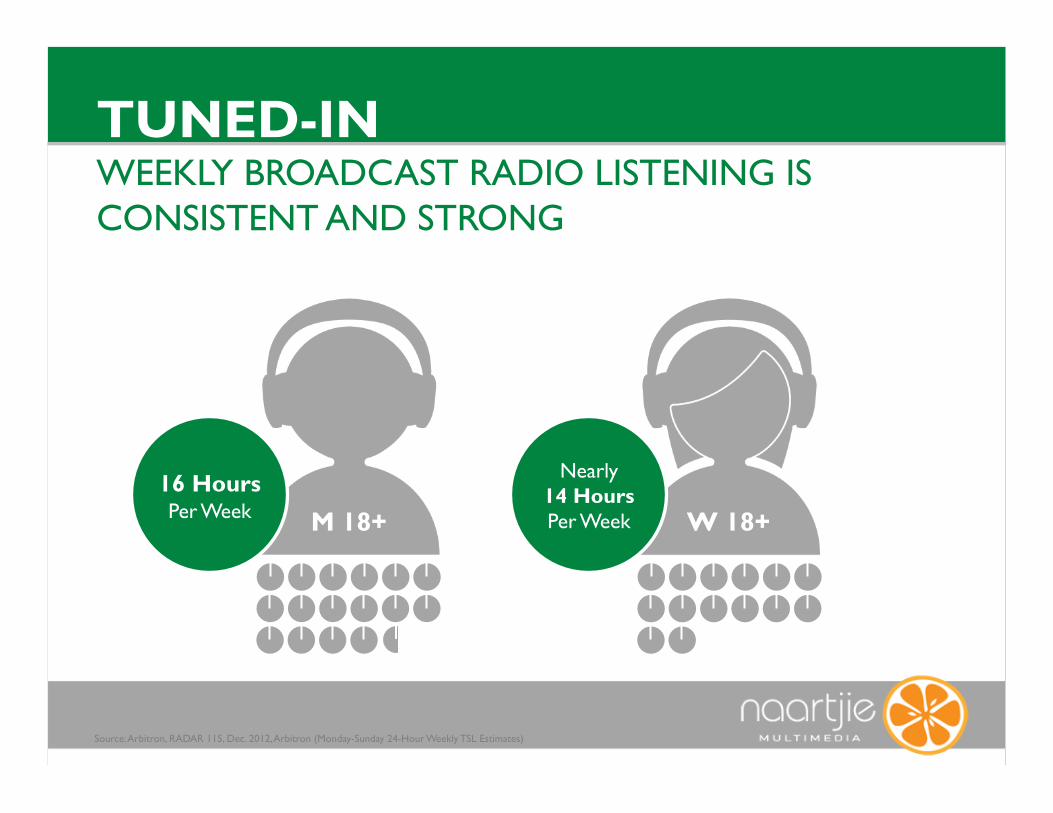
TUNED-IN WEEKLY BROADCAST RADIO LISTENING IS CONSISTENT AND STRONG
Source: Arbitron, RADAR 115, Dec. 2012, Arbitron (Monday-Sunday 24-Hour Weekly TSL Estimates)
M 18+ W 18+ 16 Hours Per Week
Nearly 14 Hours Per Week

INFLUENCING BEHAVIOR RADIO DRIVES TRAFFIC WHICH INCREASES BRAND AWARENESS AND PURCHASE INTENT
Source: Katz Marketing Solutions, custom research study.
Film Awareness +29%
Increase Once Exposed to Radio Campaign
Purchase Intent
Likelihood of Opening an Account
+20%
+12%
Theatrical (Thriller)
Electronics (Digital Cameras)
Finance (Consumer Banking)
105

0--
RADIO DOMINATES DAYTIME AUDIENCE DELIVERY
Local Streaming Station Audience, Arbitron PPM, October 2012, Persons 18+ (33 stations from 24 metros)
Drive-time peaks are expected when streaming in cars becomes standard.
LISTENING PEAKS between 8AM – 5PM 8-9 AM
4-5 PM

WORKING 9 TO 5 RADIO DOMINATES THE RETAIL DAY
51% % of Media Time Spent per Day, A25-54
BROADCAST RADIO
Internet 43%
Television 39%
Newspaper 22%
Magazine 18%
Source: GfK MRI – MediaDay Doublebase 2012 (Fieldwork 2011-2012/Doublebase Respondents) weighted to population. Base: Adults 25-54; Daypart: 9AM-5PM

0--
DISADVANTAGES
Short term availability
Message brevity
Creative production cost
Long term inventory holding
DIGITALS BB
Higher unit cost, lower production cost
Multiple facings per mkt.
Primary travel arteries
Target competitor locations
Multi/daypart specific messaging
Brighter graphics
Motion available
ADVANTAGES
Quickly build reach & frequency.
Creative cut through
Ability to provide localized messages to many people
Targetable (by demo, lifestyle and geography) the right people are exposed with little waste
24/7 delivery
OUTDOOR 24/7 DELIVERY. HIGH REACH AND FREQUENCY

0--
OUTDOOR 24/7 DELIVERY. HIGH REACH AND FREQUENCY
• ELECTRONIC BOARDS Multiple messages/daypart
Teasers
Eliminate production/unlimited message
• Feature X • Promote Charity Night/Events/Titles • Available on month to month

0--
DIRECT MAIL DATA MINING AND GROUP COUPONING
• Mailed to household within a defined radius 1 – 3 mile defined household reach
Can customize geography
• Feature new attributes • Direct to online to signup for Rewards
Program
• Coupons: discount BOGO admission, online rewards

0--
CHARITY EVENT ESTABLISH STRONG COMMUNITY TIES
• EXAMPLE: Ronald McDonald House Charities exist in most markets
National Charity with strong local base
• Involves multiple outlets in every market • Distribution to every customer in-store and
drive-thru (3,000 per store per day avg.)
• Engages staff, supporters, media and public
• CHARITY NIGHT: admission proceeds to benefit
Customer Bagstuffer

0--
SOCIAL NETWORKING CONTINUES TO GENERATE MASSIVE NUMBERS
• Social media reaches 80% of the active online population.
• Applications like Facebook and Twitter allow users to access audio, video and coupons
• Facebook reaches 60% or A18-49 each day
• 50% of Twitter users sign in once a month, 25% sign in every day
• More than half of Facebooks users log in every day
• Percentage of access for social networks via mobile is increasing by 24% each year.
Source: USC, Annenberg School of Communications & Journalism, PSI Study Released June 2012, Woodley, P. and Movius, L
162MM online users
57MM mobile users (50% YoY Growth)
90MM online users
13MM mobile users (75% YoY Growth)

0--
MOBILE MOBILE DEVICES STEADILY GROWING
• The number of mobile phone subscribers surpassed the number of people living in the US.
• 51% of consumers own a mobile device. Up 34% in 2012.
• 14% own tablets. UP 400%.
• 10% own internet connected TV’s. UP 25%.
• Smartphone owners index at 103 for weekly AM/FM listening audio content on a cell phone/smartphone
• 55% of listeners said they listen to their favorite personalities on computers or mobile devices when away from a Radio
Sources: 2011 Mobile Consumer Report, Experian/Simmons; The Infinite Dial 2012 – Arbitron Inc. Edison Media Research; USC, Annenberg School for Communication & Journalism, PSI Study Released June 2012, Woodley, P. and Movius, L. People With a Favorite Radio Personality in LA

0--
MOBILE PHONE MORE MOBILE SUBSCRIBERS THAN PEOPLE IN THE US
Sources: 2011 Mobile Consumer Report, Experian/Simmons; The Infinite Dial 2012 – Arbitron Inc. Edison Media Research; USC, Annenberg School for Communication & Journalism, PSI Study Released June 2012, Woodley, P. and Movius, L. People With a Favorite Radio Personality in LA
US Mobile Phone Subscribers (millions & % of population)

DIGITAL GROWTH DIGITAL OFFERINGS ARE STEADILY INCREASING > GROWING UTILITY IN DRIVING HIGHER R & F
Higher cost begins to decrease yield
Ideal CPM range
$5 CPM
$35 CPM
Info-seeking
High consumer
involvement
Drives efficiency
Visual impact
Two-way dialogue
Brand Connections
Build advocates
On-the-go
Location targeted
Call-to-action
High consumer
involvement
Location & daypart targeting
Message flexibility
Extend TV reach
Sight, sound & motion
Break through
Ad Network
Display Social Mobile Video Gaming DOOH

CLICKS/CTR Number of times
a banner was clicked
INTERACTIONS Number of times
banner was interacted
VIDEO COMPLETION Percentage of video did
the viewer watch
USER ACTION RATE % of users
That took desired ac-on – Download, Friend, etc.
VIDEO VIEWS How many people saw
:15 or :30 Spot
PURCHASE OR LIFT Conversion or shift
in brand awareness
IMPRESSIONS Number of times banner was served
Awareness campaign engagement: Passive user response
Deeper user engagement: Ac-ve user response
DIGITAL MEDIA MEASUREMENT
0--
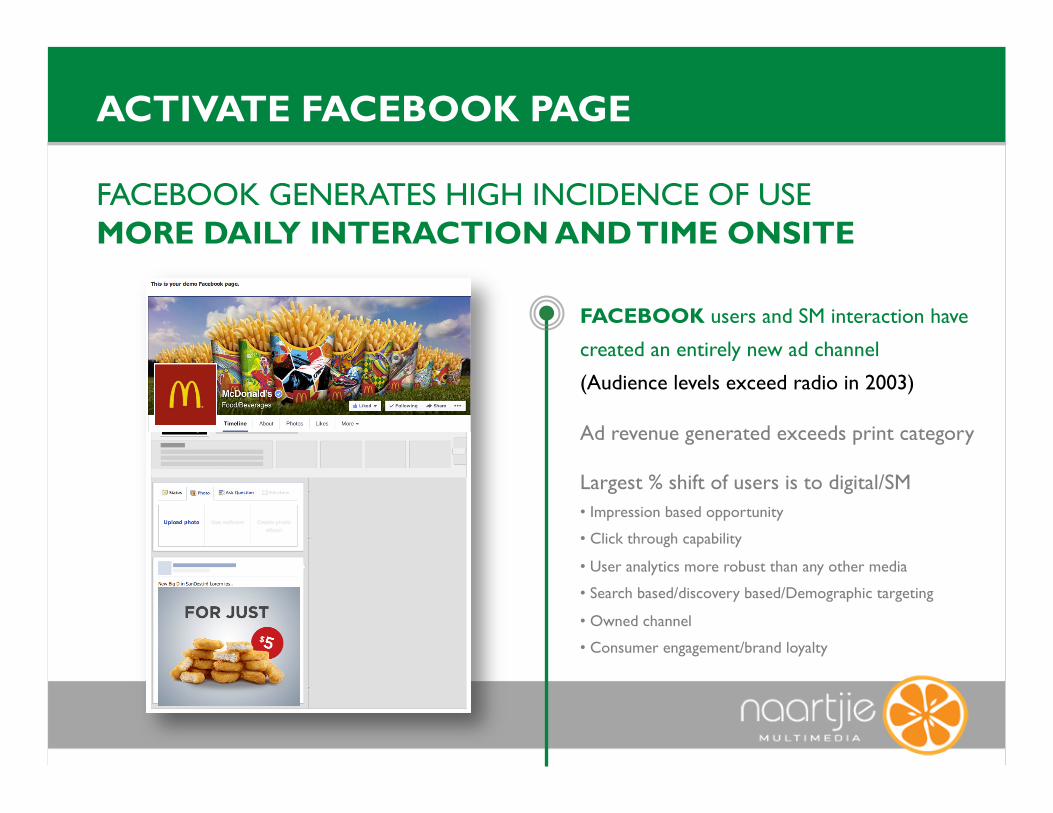
ACTIVATE FACEBOOK PAGE
FACEBOOK GENERATES HIGH INCIDENCE OF USE MORE DAILY INTERACTION AND TIME ONSITE
FACEBOOK users and SM interaction have
created an entirely new ad channel
(Audience levels exceed radio in 2003)
Ad revenue generated exceeds print category
Largest % shift of users is to digital/SM • Impression based opportunity
• Click through capability
• User analytics more robust than any other media
• Search based/discovery based/Demographic targeting
• Owned channel
• Consumer engagement/brand loyalty

0--
ACTIVATE FACEBOOK PAGE
USE TRADITIONAL ADVERTISING TO IMPROVE TARGETING
PAID ADVERTISING further capitalizes on quality content and increases likelihood for virality
• Target radius around specific location
• Target demographics (age, gender)
•Target interests
•Use keywords

0--
ACTIVATE FACEBOOK PAGE
FACEBOOK USERS CAN BE IDENTIFIED BY THEIR DATA GEOGRAPHY, INTERESTS, DEMOGRAPHICS

0--
ACTIVATE FACEBOOK PAGE
USAGE AVAILABLE ON MULTIPLE PLATFORMS
D
0--
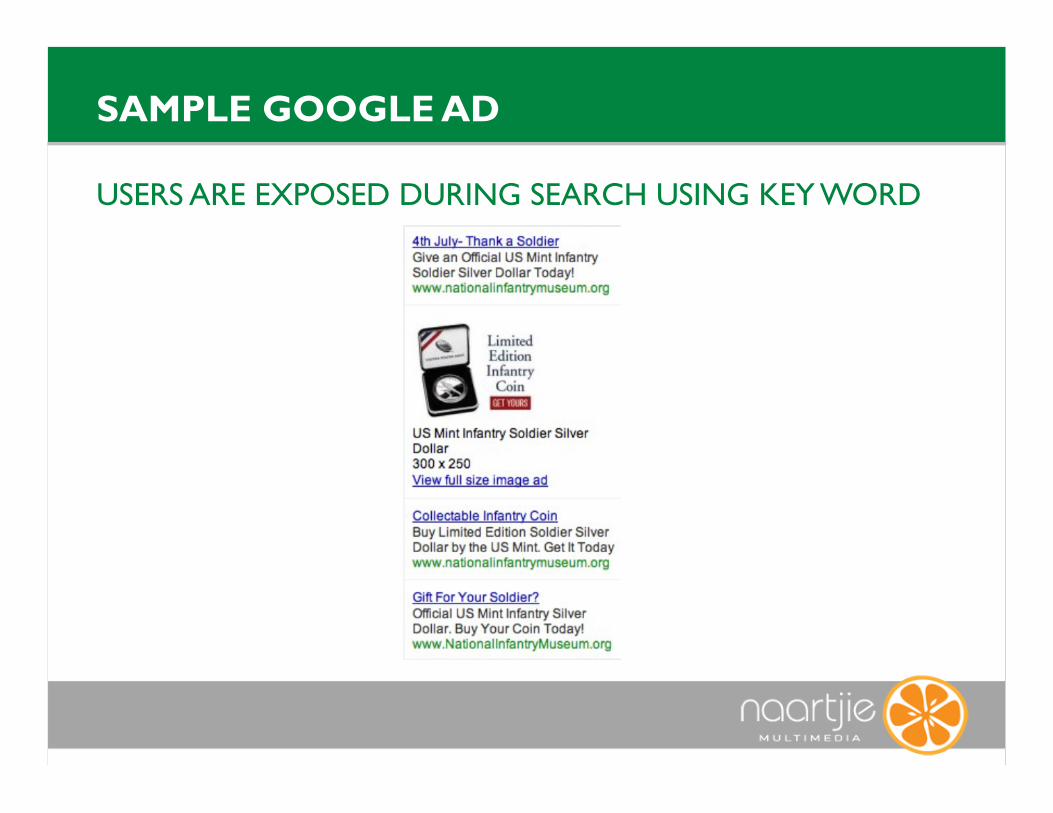
SAMPLE GOOGLE AD
USERS ARE EXPOSED DURING SEARCH USING KEY WORD

0--
SAMPLE YOUTUBE AD
0--
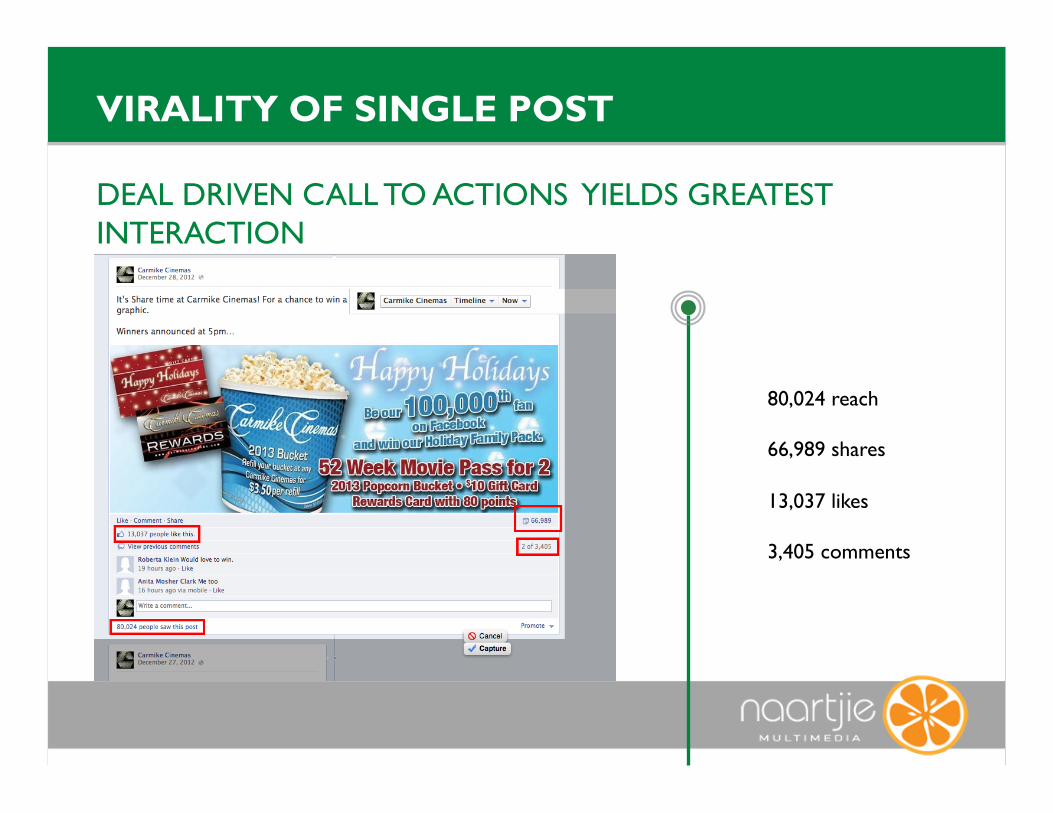
VIRALITY OF SINGLE POST
DEAL DRIVEN CALL TO ACTIONS YIELDS GREATEST INTERACTION
80,024 reach
66,989 shares
13,037 likes
3,405 comments
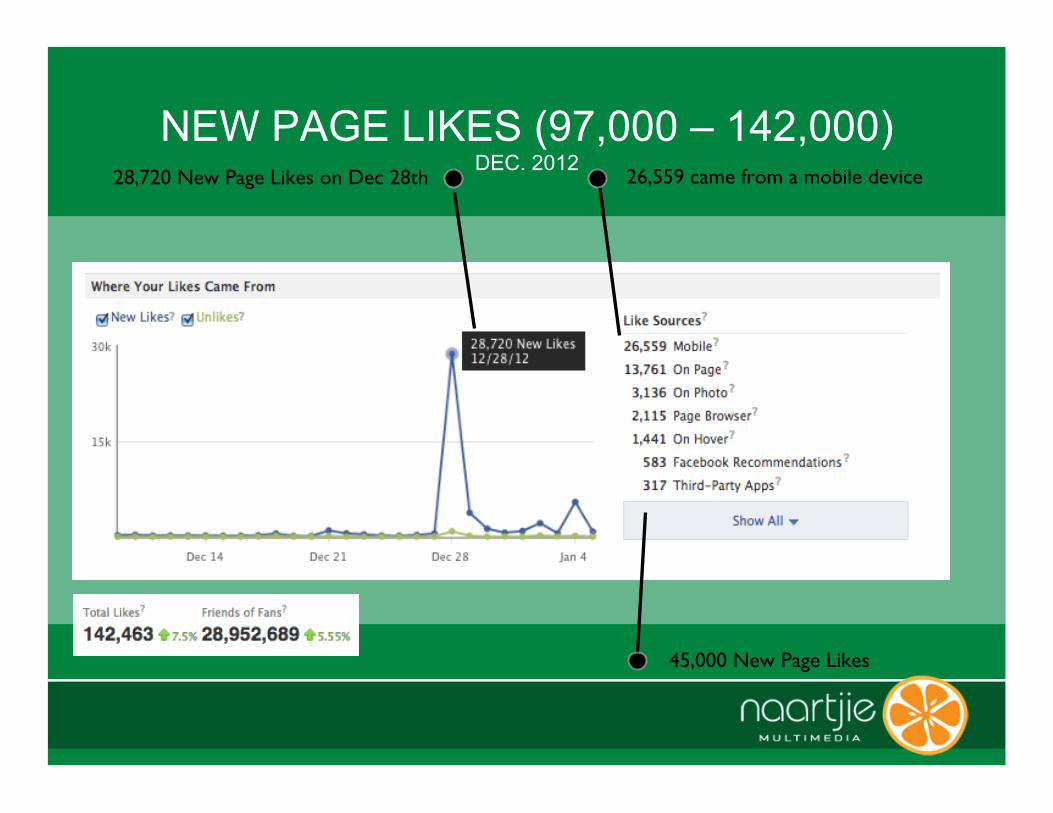
NEW PAGE LIKES (97,000 – 142,000) DEC. 2012
• 45,000 New Page Likes
28,720 New Page Likes on Dec 28th • 26,559 came from a mobile device

DEMOGRAPHICS
FEMALE 25-44 84% 55%

PHASE – 1
3-months pre-opening Identify/Secure outdoor
Media contacts & rates
Local opportunities
Station promotions/Trade
Identify Charity - Leverage audience
Chamber of Commerce - Ribbon cutting - Newsletter insertion - Email distribution
PHASE – 2
6-weeks - Finalize direct mail offers
and radius
1 Month - Post teaser outdoor - Countdown Clock – digital
boards - PR/media alerts
2 weeks - Direct mail drop - Begin teaser radio - Grand opening - Charity/VIP Night - Newspaper insertions
CAMPAIGN
4-week duration
2-week Pre-Opening - Generate excitement - Charity Event
2-week Post-Opening
Media Platforms - TV, Radio, Local Newspaper, Direct Mail
PROMOTIONAL TIMELINE TACTICAL PLAN
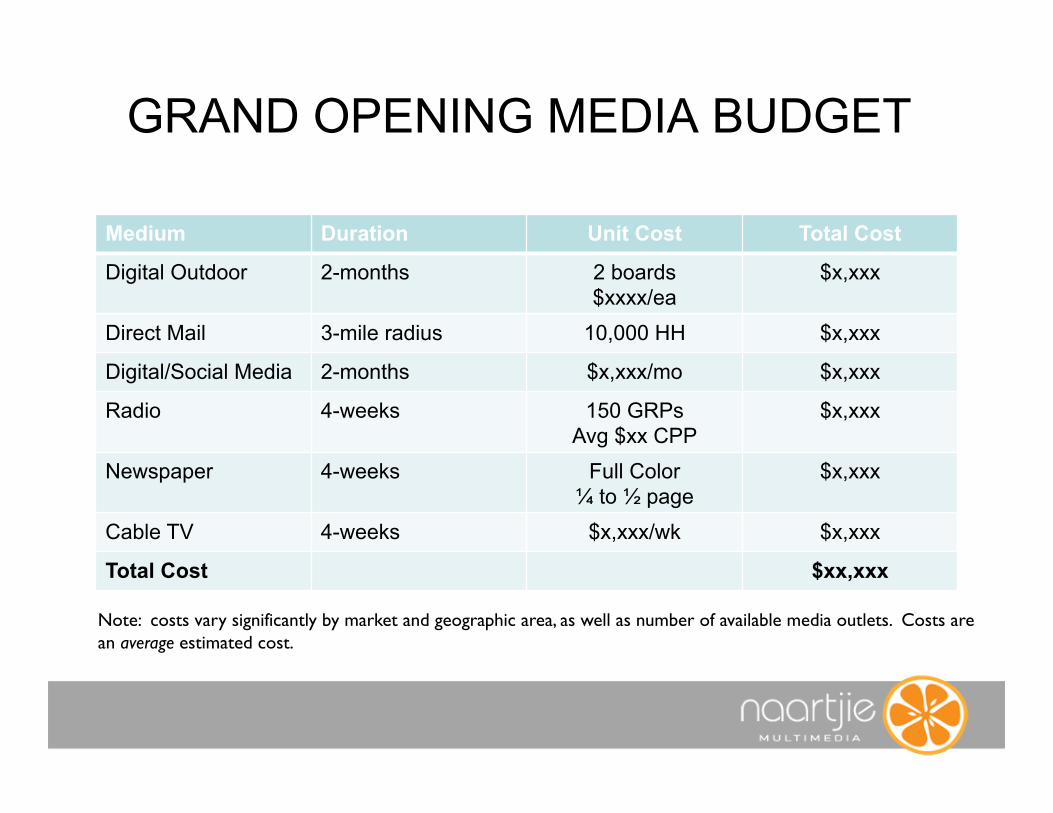
GRAND OPENING MEDIA BUDGET
Medium Duration Unit Cost Total Cost
Digital Outdoor 2-months 2 boards $xxxx/ea
$x,xxx
Direct Mail 3-mile radius 10,000 HH $x,xxx
Digital/Social Media 2-months $x,xxx/mo $x,xxx
Radio 4-weeks 150 GRPs Avg $xx CPP
$x,xxx
Newspaper 4-weeks Full Color ¼ to ½ page
$x,xxx
Cable TV 4-weeks $x,xxx/wk $x,xxx
Total Cost $xx,xxx
Note: costs vary significantly by market and geographic area, as well as number of available media outlets. Costs are an average estimated cost.


![Grand Opening Flyer2[1]](https://static.fdocuments.in/doc/165x107/55cafa2cbb61eb9f2b8b4861/grand-opening-flyer21.jpg)