NA: Q4-2020 Investor Presentation - NBC
37
INVESTOR PRESENTATION Fourth Quarter 2020 December 2, 2020
Transcript of NA: Q4-2020 Investor Presentation - NBC

INVESTOR PRESENTATION
Fourth Quarter 2020
December 2, 2020
CAUTION REGARDING FORWARD-LOOKING STATEMENTS
2
From time to time, the Bank makes written and oral forward-looking statements such as those contained in this document, in other filings with Canadian securities
regulators, and in other communications. From time to time, representatives of the Bank may also make oral forward-looking statements to analysts, investors, the media
and other stakeholders. All such statements are made in accordance with applicable securities legislation in Canada and the United States. Forward-looking statements in
this document may include, but are not limited to, statements with respect to the economy—particularly the Canadian and U.S. economies—market changes, the Bank’s
objectives, outlook and priorities for fiscal year 2021 and beyond, its strategies or future actions for achieving them, expectations for the Bank’s financial condition, the
regulatory environment in which it operates, the impacts of — and the Bank’s response to — the COVID-19 pandemic, and certain risks it faces. These forward-looking
statements are typically identified by future or conditional verbs or words such as “outlook”, “believe”, “foresee”, “forecast”, “anticipate”, “estimate”, “project”, “expect”,
“intend”, “plan”, and similar expressions characterized by the use of the future or conditional form of verbs such as "to be," "must" and "may.“
Such forward-looking statements are made for the purpose of assisting the holders of the Bank’s securities in understanding the Bank’s financial position and results of
operations as at and for the periods ended on the dates presented, as well as the Bank’s vision, strategic goals and financial performance objectives, and may not be
appropriate for other purposes.
By their very nature, these forward-looking statements require assumptions to be made and involve inherent risks and uncertainties, both general and specific. Assumptions
about the performance of the Canadian and U.S. economies in 2021, including in the context of the COVID-19 pandemic, and how that will affect the Bank’s business are
among the main factors considered in setting the Bank’s strategic priorities and objectives, including provisions for credit losses. In determining its expectations for
economic conditions, both broadly and in the financial services sector in particular, the Bank primarily considers historical economic data provided by the governments of
Canada, the United States and certain other countries in which the Bank conducts business, as well as their agencies.
There is a strong possibility that the Bank’s express or implied predictions, forecasts, projections, expectations or conclusions will not prove to be accurate, that its
assumptions may not be confirmed and that its vision, strategic goals and financial performance objectives will not be achieved. The Bank recommends that readers not
place undue reliance on forward-looking statements, as a number of factors, many of which are beyond the Bank’s control, including the impacts of the COVID-19
pandemic, could cause actual results to differ significantly from the expectations, estimates or intentions expressed in these statements. These factors include credit risk,
market risk, liquidity and funding risk, operational risk, regulatory compliance risk, reputation risk, strategic risk and environmental and social risk, all of which are described
in more detail in the Risk Management section beginning on page 68 of the 2020 Annual Report, and more specifically: general economic environment and financial market
conditions in Canada, the United States and certain other countries in which the Bank conducts its business; regulatory changes affecting the Bank’s business; geopolitical
and sociopolitical uncertainty; important changes in consumer behaviour; the housing and household indebtedness situation and real estate market in Canada; changes in
the Bank’s customers’ and counterparties’ performance and creditworthiness; changes in the accounting policies the Bank uses to report its financial condition, including
uncertainties associated with assumptions and critical accounting estimates; tax laws in the countries in which the Bank operates, primarily Canada and the United States
(including the U.S. Foreign Account Tax Compliance Act (FATCA)); changes to capital and liquidity guidelines and to the manner in which they are to be presented and
interpreted; changes to the credit ratings assigned to the Bank; potential disruption to key suppliers of goods and services to the Bank; potential disruptions to the Bank’s
information technology systems, including evolving cyberattack risk as well as identity theft and theft of personal information; and possible impacts of catastrophic events
affecting local and global economies, including natural disasters and public health emergencies such as the COVID-19 pandemic.
Statements about the expected impacts of the COVID-19 pandemic on the Bank’s business, results of operations, corporate reputation, financial position and liquidity, and
on the global economy may be inaccurate and differ, possibly materially, from what is expected as they depend on future developments that are highly uncertain and
cannot be predicted.
The foregoing list of risk factors is not exhaustive. Additional information about these factors can be found in the Risk Management section and in the COVID-19 Pandemic
section of the 2020 Annual Report. Investors and others who rely on the Bank’s forward-looking statements should carefully consider the above factors as well as the
uncertainties they represent and the risks they entail.
Except as required by law, the Bank does not undertake to update any forward-looking statements, whether written or oral, that may be made from time to time, by it or on
its behalf.
Note: National Bank fiscal year ends October 31.

Louis Vachon
President & Chief Executive Officer
OVERVIEW
FY 2020 – STRONG PERFORMANCE IN CHALLENGING TIMES
4
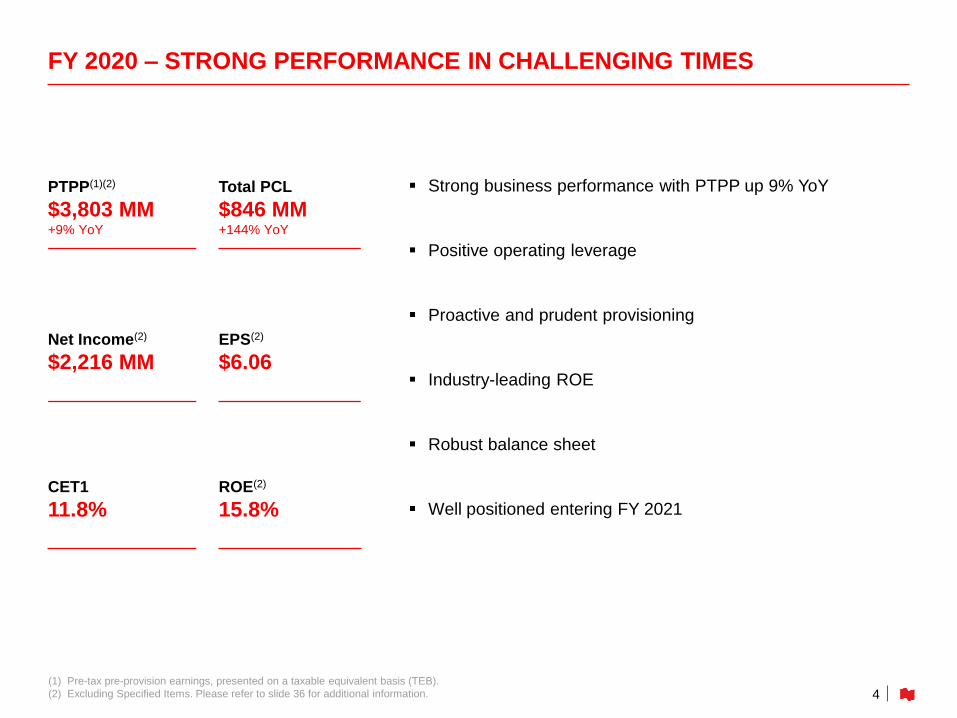
▪ Strong business performance with PTPP up 9% YoY
▪ Positive operating leverage
▪ Proactive and prudent provisioning
▪ Industry-leading ROE
▪ Robust balance sheet
▪ Well positioned entering FY 2021
PTPP(1)(2)
$3,803 MM+9% YoY
Total PCL
$846 MM+144% YoY
Net Income(2)
$2,216 MMEPS(2)
$6.06
CET1
11.8%ROE(2)
15.8%
(1) Pre-tax pre-provision earnings, presented on a taxable equivalent basis (TEB).
(2) Excluding Specified Items. Please refer to slide 36 for additional information.

FY 2020 – SEGMENT HIGHLIGHTS
5
P&C Banking
PTPP(1): $1,614 MMflat YoY
▪ Strong growth in mortgages and deposits, offset by lower interest rates and client activity
▪ Market share gains in Quebec retail market and pick-up in commercial activity in Q4
▪ Strong commitment to our clients throughout the crisis, with significant uptick in NPS score
Wealth Management
PTPP(1): $740 MM+10% YoY
▪ Strong net sales and favorable markets in Q4, more than offsetting lower NII YoY
▪ Successful advice-first strategy with higher NPS scores
▪ Continued growth from active recruiting, market growth and cross-selling initiatives
Financial Markets
PTPP(1): $1,245 MM+25% YoY
▪ Record revenues ~$2B in FY 2020 and PTPP growth of 25%
▪ Solid performance in Q4 from both Global Markets (against strong Q4/19) and C&IB
▪ Financial Markets remains well-positioned entering FY2021
USSF&I
PTPP(1): $501 MM+17% YoY
▪ Strong Q4 at both ABA (net income up 24% YoY) and Credigy (net income up 84%)
▪ National Bank acquiring remaining ~20% interest in Credigy in Q1/21
▪ Well positioned to continue delivering strong growth
(1) Pre-tax pre-provision earnings, presented on a taxable equivalent basis (TEB).

MAINTAINING OUR MEDIUM-TERM OBJECTIVES
6
Strong Performance in a Challenging Year
(Excluding Specified Items)
FY 2020 Results Medium-Term Objectives
Growth in Diluted EPS (4.7) % 5 - 10 %
Return on Equity 15.8 % √ 15 - 20 %
Dividend Payout Ratio 46.6 % √ 40 - 50 %
CET1 Capital Ratio 11.8 % √ > 10.75 %
Leverage Ratio 4.4 % √ > 3.75 %

William Bonnell
Executive Vice-President
Risk Management
RISKMANAGEMENT

(1) Impaired PCL includes $8M from Purchased or Originated Credit Impaired (POCI) 8
PROVISIONS FOR CREDIT LOSSES
PCL Q4 2020
($MM)
Personal (8) 30 22
Commercial 7 38 45
FM 22 5 27
WM (1) 2 1
Other (2) - (2)
Total PCL x-USSF&I 18 75 93
USSF&I(1) 2 15 17
Total PCL ($MM) 20 90 110
Total PCL (bps) 5 22 27
Retail ($9)
USSF&I
$2
Non-Retail
$27
$20
POCI $8
Impaired $82
$90
USSF&I
$17
Retail
$23
Non-Retail
$70
$110
Performing Impaired & POCI Total PCL
Q4 PCL on Impaired Loans
▪ $82M of Impaired PCLs reflecting stable Retail
and lower Non-Retail provisions QoQ
Q4 PCL on Performing Loans
▪ $20M. Key drivers: Increases in the weight in
the pessimistic scenario and management
overlay, migration, and portfolio growth
▪ Retail: -$9M, reflects continued strong
performance
▪ Non-retail: $27M, reflecting migration and
updated scenario weight
▪ USSF&I: $2M, primarily driven by portfolio
growth at ABA
Q4 Total PCL
▪ $110M (27bps) reflecting continued strong
performance and portfolio mix
FY 2020 Full Year PCL
▪ Impaired: 23 bps; Performing: 30 bps; Total:
53 bps
FY 2021
▪ Target range for Total PCLs: 25-35 bps

ALLOWANCE FOR CREDIT LOSSES
9(1) Performing ACL includes allowances on drawn ($872M), undrawn ($157M) and other assets ($28M)
(2) Total PCL in Q4 20 includes -$3M of FX variation
Total Allowances:
▪ Continued to build allowances in Q4
▪ Since Q1 2020, Total Allowances for Credit
Losses increased from $769M to $1.34B
▪ 119% increase in allowances for non-retail
portfolios since Q1 and a 33% increase in
allowances for retail portfolios reflecting our
product and geographic mix
Performing Allowances:
▪ Performing ACLs increased by 80% since Q1
2020, reaching $1,057M
▪ Represents 2.8 times coverage
of LTM impaired PCLs
Non-Performing Allowances:
▪ Increased to $352M or 43% of
GIL, stable QoQ
(1
)
ACL Q4 20
($MM)
$1,305
USSF&I $104USSF&I
$134
USSF&I
$149
USSF&I
$ 151
Retail
$378
Retail$490
Retail
$509Retail$504
Non-Retail
$345
Non-Retail
$656
Non-Retail
$720
Non-Retail$754
Performing
$1,057
Non-
Performing
$352
POCI ($58) POCI ($69) POCI ($73) POCI ($66) POCI ($66)
$769
$1,211
$1,343
ACL Q1 20 ACL Q2 20 ACL Q3 20 Variation Q4 20 ACL Q4 20 ACL Q4 20ACL Q4 20(1)(2)
75% increase in allowances since Q1 20
PCL $110
NCO ($69)
PRUDENT PROVISIONING IN UNCERTAIN ECONOMIC ENVIRONMENT
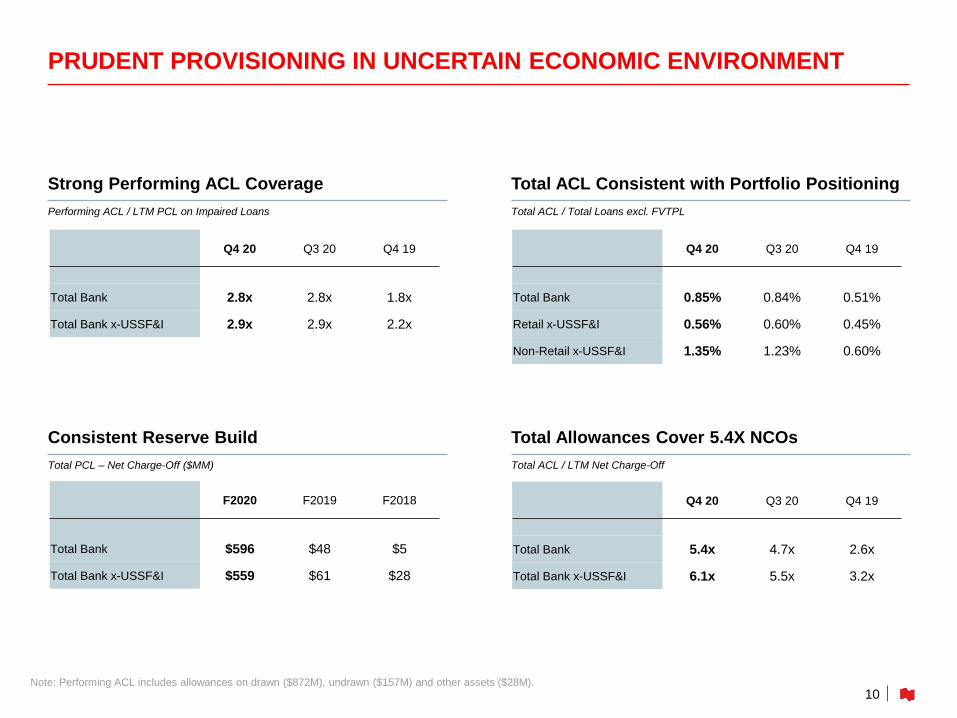
10Note: Performing ACL includes allowances on drawn ($872M), undrawn ($157M) and other assets ($28M).
Strong Performing ACL Coverage
Performing ACL / LTM PCL on Impaired Loans
Total ACL Consistent with Portfolio Positioning
Total ACL / Total Loans excl. FVTPL
Consistent Reserve Build
Total PCL – Net Charge-Off ($MM)
Total Allowances Cover 5.4X NCOs
Total ACL / LTM Net Charge-Off
Q4 20 Q3 20 Q4 19
Total Bank 2.8x 2.8x 1.8x
Total Bank x-USSF&I 2.9x 2.9x 2.2x
Q4 20 Q3 20 Q4 19
Total Bank 0.85% 0.84% 0.51%
Retail x-USSF&I 0.56% 0.60% 0.45%
Non-Retail x-USSF&I 1.35% 1.23% 0.60%
Q4 20 Q3 20 Q4 19
Total Bank 5.4x 4.7x 2.6x
Total Bank x-USSF&I 6.1x 5.5x 3.2x
F2020 F2019 F2018
Total Bank $596 $48 $5
Total Bank x-USSF&I $559 $61 $28
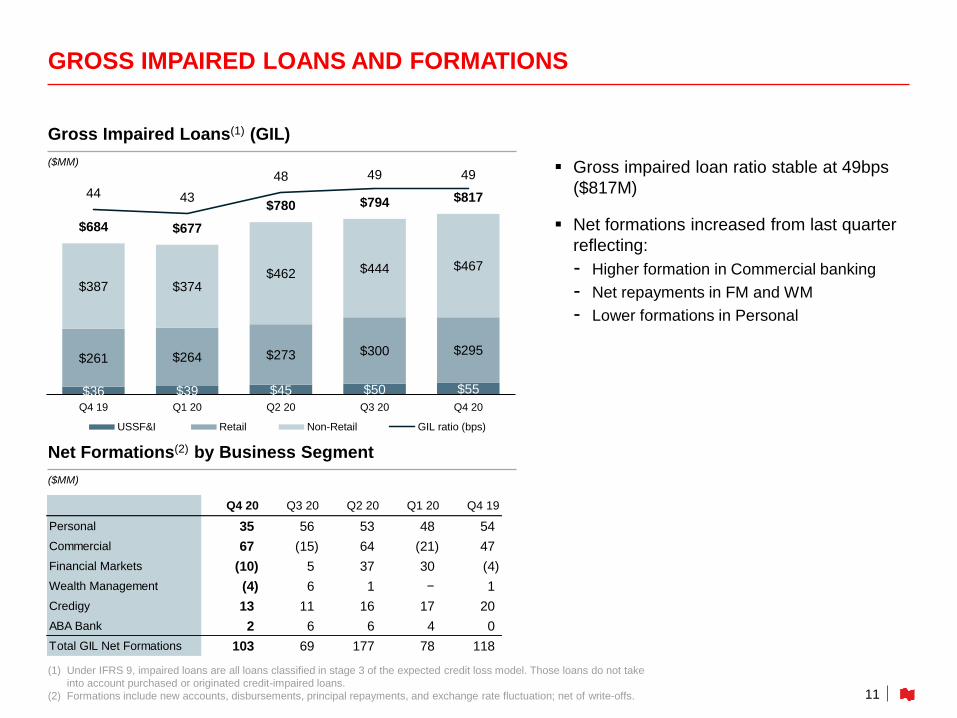
(1) Under IFRS 9, impaired loans are all loans classified in stage 3 of the expected credit loss model. Those loans do not take
into account purchased or originated credit-impaired loans.
(2) Formations include new accounts, disbursements, principal repayments, and exchange rate fluctuation; net of write-offs.
GROSS IMPAIRED LOANS AND FORMATIONS
11
▪ Gross impaired loan ratio stable at 49bps
($817M)
▪ Net formations increased from last quarter
reflecting:
- Higher formation in Commercial banking
- Net repayments in FM and WM
- Lower formations in Personal
Gross Impaired Loans(1) (GIL)
($MM)
Net Formations(2) by Business Segment
($MM)
$36 $39 $45 $50 $55
$261 $264 $273 $300 $295
$387 $374$462 $444 $467
$684 $677
$780 $794 $81744 43
48 49 49
Q4 19 Q1 20 Q2 20 Q3 20 Q4 20
USSF&I Retail Non-Retail GIL ratio (bps)
Q4 20 Q3 20 Q2 20 Q1 20 Q4 19
Personal 35 56 53 48 54
Commercial 67 (15) 64 (21) 47
Financial Markets (10) 5 37 30 (4)
Wealth Management (4) 6 1 − 1
Credigy 13 11 16 17 20
ABA Bank 2 6 6 4 0
Total GIL Net Formations 103 69 177 78 118

LOANS UNDER DEFERRALS DOWN TO 1.3% OF CANADIAN PORTFOLIO(1)
12
Deferrals as at Q4 2020
(As at October 31, 2020)
Deferrals as at Q3 2020
(As at July 31, 2020)
Retail
▪ New deferral requests down materially to ~1K
in Q4 vs 10K in Q3 and 75K in Q2(1)
▪ Value of retail loans under deferral declined by
81% QoQ
▪ Insured mortgages represent 43% of remaining
mortgages under deferrals
- Average LTV of uninsured RESL is 59%
▪ 98% of expired RESL deferrals have restarted
regular payments
Non-Retail
▪ Value of non-retail loans under deferral
declined by 74% QoQ
▪ Non-investment grade unsecured loans
represent less than 2% of outstanding
deferrals
▪ 99% of expired deferrals have restarted their
payments
(1) Excluding student loans, which are government insured.
Number of
Loans
Value of
Loans ($MM)
As % of
Loans Balances
RESL 14,405 $3,651 5.0%
Personal Loans(1) 1,093 $20 0.2%
Credit Cards 2,700 $15 0.8%
Retail 18,198 $3,686 4.4%
Non-Retail 2,739 $4,479 7.5%
Number of
Loans
Value of
Loans ($MM)
As % of
Loans Balances
RESL 2,865 $695 0.9%
Personal Loans(1) - - -
Credit Cards - - -
Retail 2,865 $695 0.8%
Non-Retail 780 $1,182 2.0%

RETAIL MORTGAGE AND HELOC PORTFOLIO
13
▪ Insured mortgages account for 38% of the
total RESL portfolio (71% in Alberta)
▪ Distribution across product and geography
remained stable
▪ Uninsured mortgages and HELOC in GTA and
GVA represent 10% and 2% of the total
portfolio and both segment have an average
LTV(1) of 51%
▪ Uninsured mortgages and HELOC for condos
represents 7.4% of the total portfolio and have
an average LTV(1) of 59%
(1) LTV are based on authorized limit for HELOCs and outstanding amount for Uninsured Mortgages.
They are updated using Teranet-National Bank sub-indices by area and property type.
(2) Of which $15.0B are amortizing HELOC.
Canadian Distribution by Province
(As at October 31, 2020)
Canadian Uninsured and HELOC Portfolio
Canadian Distribution by Mortgage Type
Insured
$28.9B / 38%
Uninsured
$23.3B / 30%
HELOC
$24.1B(2)
/ 32%
$76.3B
58% 51% 70% 52% 56%
Average LTV - Uninsured and HELOC(1)
HELOC Uninsured
Average LTV(1) 55% 58%
Average Credit Bureau Score 792 777
90+ Days Past Due (bps) 12 24
31%
36%71% 42% 61%
69%
64%
29%58% 39%
55%
27%
7%6% 5%
QC ON AB BC Other Provinces
Uninsured & HELOC
Insured

Ghislain Parent
Chief Financial Officer and
Executive Vice-President, Finance
FINANCIALREVIEW

BALANCED APPROACH BETWEEN COST MANAGEMENT AND INVESTMENTS
15
▪ Resilient business mix supporting strong revenue and PTPP growth in FY 2020
▪ Expense growth reflecting higher compensation from revenue growth, brand and
technology investments, and COVID-related costs
▪ Positive operating leverage of 1.6% for FY 2020
- Efficiency ratio down 80 bps over the same period
▪ Transformation translating into efficiency measures
- Write-off of intangible assets of $71M; expected pre-tax savings of ~$20M in each of
FY 2021 and FY 2022
- Severances of $48M; expected pre-tax savings of ~$23M in FY 2021 and ~$30M in FY
2022
▪ Maintaining a balanced approach between cost management and technology
investments to support business growth and efficiency
▪ Targeting positive PTPP growth in FY 2021
(1) Excluding Specified Items. Please refer to slide 36 for additional information.
Revenue Growth:
7.2%(1)
FY 2020
Expense Growth:
5.6%(1)
FY 2020
Operating Leverage:
1.6%(1)
FY 2020
PTPP Growth:
9.0%(1)
FY 2020
11.43%
0.00% 11.78%
0.43%0.04% 0.01%
(0.08%) (0.05%)
Q3 20 Net IncomeEx. PCL and
Specified(Net of Div.)
Total PCL(After-tax)
SpecifiedItems
RWA PensionFund
ECLTransitionalAdd-Back
Q4 20
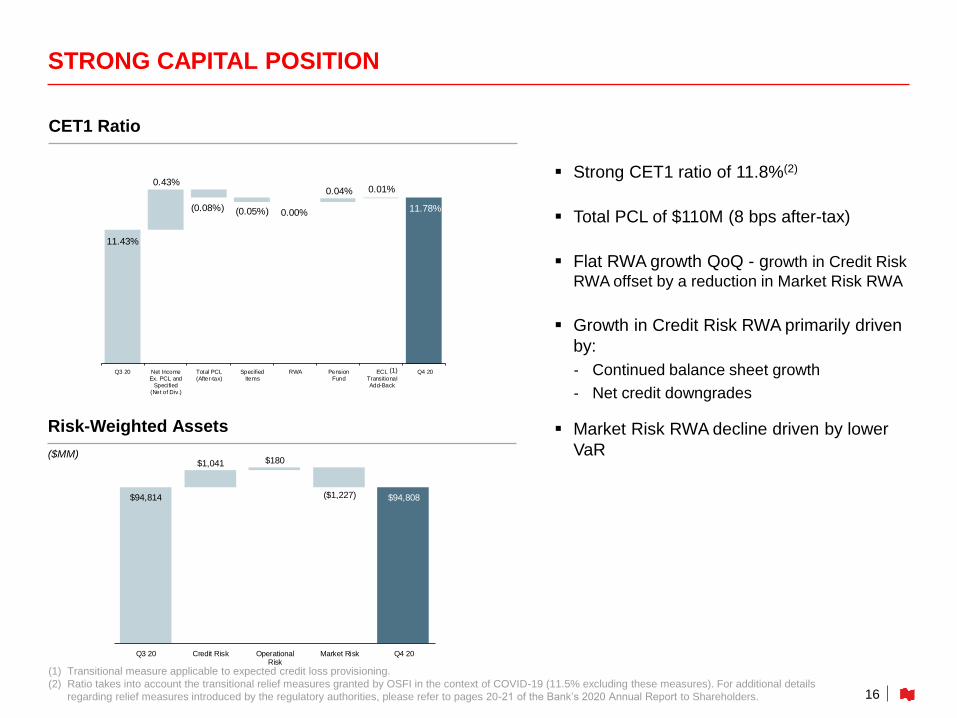
STRONG CAPITAL POSITION
(1) Transitional measure applicable to expected credit loss provisioning.
(2) Ratio takes into account the transitional relief measures granted by OSFI in the context of COVID-19 (11.5% excluding these measures). For additional details
regarding relief measures introduced by the regulatory authorities, please refer to pages 20-21 of the Bank’s 2020 Annual Report to Shareholders.
▪ Strong CET1 ratio of 11.8%(2)
▪ Total PCL of $110M (8 bps after-tax)
▪ Flat RWA growth QoQ - growth in Credit Risk
RWA offset by a reduction in Market Risk RWA
▪ Growth in Credit Risk RWA primarily driven
by:
- Continued balance sheet growth
- Net credit downgrades
▪ Market Risk RWA decline driven by lower
VaR
(1)
CET1 Ratio
16
Risk-Weighted Assets
($MM)
$94,814 $94,808
$1,041 $180
($1,227)
Q3 20 Credit Risk OperationalRisk
Market Risk Q4 20

STRONG CAPITAL AND LIQUIDITY POSITIONS
▪ Our capital levels remain strong
▪ Total capital ratio of 16%
▪ Strong liquidity coverage ratio of 161%
Capital and Capital Ratios
($MM)
17
Q4 20 Q3 20 Q2 20
Capital
CET1 $11,167 $10,840 $10,568
Tier 1 $14,112 $13,290 $13,368
Total $15,167 $14,336 $14,370
Capital ratios
CET1 11.8% 11.4% 11.4%
Tier 1 14.9% 14.0% 14.4%
Total 16.0% 15.1% 15.5%
Leverage 4.4% 4.3% 4.4%
Liquidity Coverage Ratio 161% 161% 149%

APPENDICES

Total Bank Summary Results - FY 2020
($MM, TEB)
APPENDIX 1 │ FY 2020 TOTAL BANK RESULTS
19
▪ Strong business performance with
revenues up 7% and PTPP up 9%
▪ Positive operating leverage
▪ Prudent provisioning with PCL up 144%
▪ Industry-leading ROE
FY 20 (1)
FY 19 (1) YoY
Revenues 8,216 7,666 7%
Non-Interest Expenses 4,413 4,178 6%
Pre-Tax / Pre-Provisions 3,803 3,488 9%
PCL 846 347 144%
Net Income 2,216 2,328 (5%)
Diluted EPS $6.06 $6.36 (5%)
Key Metrics FY 20 FY 19 YoY
Avg Loans & BAs - Total 159,275 148,765 7%
Avg Deposits - Total 207,381 184,460 12%
Efficiency Ratio 53.7% 54.5% -80 bps
Return on Equity 15.8% 18.0%
CET1 Ratio 11.8% 11.7%
(1) Excluding Specified Items. Please refer to slide 36 for additional information.

APPENDIX 2 │ FY 2020 SEGMENT RESULTS
20
P&C Banking
($MM)
Financial Markets
($MM, TEB)
Wealth Management
($MM)
USSF&I
($MM)
FY 20 FY 19 YoY
Revenues 3,463 3,451 -
Personal 2,154 2,163 -
Commercial 1,309 1,288 2%
Non-Interest Expenses 1,849 1,837 1%
Pre-Tax / Pre-Provisions 1,614 1,614 -
PCL 517 237
Net Income 807 1,011 (20%)
Efficiency Ratio (%) 53.4% 53.2% +20 bps
FY 20 FY 19 YoY
Revenues 1,855 1,743 6%
Fee-Based 1,087 1,013 7%
Transaction & Others 326 275 19%
Net Interest Income 442 455 (3%)
Non-Interest Expenses 1,115 1,073 4%
Pre-Tax / Pre-Provisions 740 670 10%
PCL 7 -
Net Income 539 494 9%
Efficiency Ratio (%) 60.1% 61.6% -150 bps
FY 20 FY 19 YoY
Revenues 2,054 1,751 17%
Global Markets 1,268 1,032 23%
C&IB 786 719 9%
Non-Interest Expenses 809 756 7%
Pre-Tax / Pre-Provisions 1,245 995 25%
PCL 239 30
Net Income 740 708 5%
Efficiency Ratio (%) 39.4% 43.2% -380 bps
FY 20 FY 19 YoY
Revenues 820 715 15%
Non-Interest Expenses 319 285 12%
PCL 80 80 -
Net Income 352 279 26%
Credigy
Revenues 406 402 1%
Net Income 160 144 11%
ABA Bank
Revenues 410 303 35%
Net Income 192 128 50%

APPENDIX 3 │ TOTAL BANK – Q4 20 RESULTS
21
Total Bank Summary Results - Q4 2020
($MM, TEB)▪ Revenues up 3% YoY and PTPP up 1%
YoY
- Expenses up 5% YoY on higher corporate
expenses
▪ EPS of $1.69, stable YoY
▪ Industry-leading ROE of 17.1%
Q4 20 (1) Q3 20 Q4 19
(1) QoQ YoY
Revenues 2,073 2,021 2,008 3% 3%
Non-Interest Expenses 1,140 1,074 1,084 6% 5%
Pre-Tax / Pre-Provisions 933 947 924 (1%) 1%
PCL 110 143 89 (23%) 24%
Net Income 615 602 612 2% -
Diluted EPS $1.69 $1.66 $1.69 2% -
Key Metrics Q4 20 Q3 20 Q4 19 QoQ YoY
Avg Loans & BAs - Total 162,092 160,457 152,382 1% 6%
Avg Deposits - Total 217,953 207,450 194,454 5% 12%
Efficiency Ratio 55.0% 53.1% 54.0% +190 bps +100 bps
Return on Equity 17.1% 17.0% 18.4%
CET1 Ratio 11.8% 11.4% 11.7%
(1) Excluding Specified Items. Please refer to slide 36 for additional information.

APPENDIX 4 │ PERSONAL AND COMMERCIAL BANKING
P&C Summary Results - Q4 2020
($MM)
P&C Net Interest Margin(1)
22(1) NIM is on Earning Assets.
▪ Revenues up 1% YoY:
- Strong mortgage and deposit growth
- Partly offset by lower margin from low
interest rate environment and lower client
activity
▪ Business resumption in commercial
banking
▪ NIM up 4 bps QoQ due to higher margin on
mortgage and commercial portfolios
Q4 20 Q3 20 Q4 19 QoQ YoY
Revenues 883 852 875 4% 1%
Personal 547 536 545 2% -
Commercial 336 316 330 6% 2%
Non-Interest Expenses 465 457 455 2% 2%
Pre-Tax / Pre-Provisions 418 395 420 6% -
PCL 67 79 59 (15%) 14%
Net Income 258 233 265 11% (3%)
Key Metrics Q4 20 Q3 20 Q4 19 QoQ YoY
Avg Loans & Bas 118,994 116,371 114,481 2% 4%
Personal 81,000 78,944 77,015 3% 5%
Commercial 37,994 37,427 37,466 2% 1%
Avg Deposits 72,252 68,974 64,488 5% 12%
Personal 35,555 34,825 31,247 2% 14%
Commercial 36,697 34,149 33,241 7% 10%
NIM (%) 2.19% 2.15% 2.23% 0.04% (0.04%)
Efficiency Ratio (%) 52.7% 53.6% 52.0% -90 bps +70 bps
PCL Ratio 0.22% 0.27% 0.20% (0.05%) 0.02%
2.23% 2.21% 2.22%2.15% 2.19%
Q4 19 Q1 20 Q2 20 Q3 20 Q4 20

APPENDIX 5 │ WEALTH MANAGEMENT
23
Wealth Management Summary Results - Q4 2020
($MM)
Assets Under Management
($MM)
▪ Revenues up 4% YoY
- Strong net sales and favorable markets
- Lower net interest income as strong deposits
were more than offset by lower interest rates
▪ Flat operating leverage reflecting revenue
mix
- Higher commissions and management fees
in line with fee-based revenue growth
- Disciplined cost management
Q4 20 Q3 20 Q4 19 QoQ YoY
Revenues 466 450 446 4% 4%
Fee-Based 281 266 263 6% 7%
Transaction & Others 78 78 72 0% 8%
Net Interest Income 107 106 111 1% (4%)
Non-Interest Expenses 281 274 271 3% 4%
Pre-Tax / Pre-Provisions 185 176 175 5% 6%
PCL 1 2 -
Net Income 135 128 129 5% 5%
Key Metrics Q4 20 Q3 20 Q4 19 QoQ YoY
Avg Loans & BAs 4.9 4.7 4.8 5% 1%
Avg Deposits 35.8 35.3 31.8 2% 13%
Asset Under Administration 509.1 500.3 484.6 2% 5%
Asset Under Management 87.6 86.7 80.8 1% 8%
Efficiency Ratio (%) 60.3% 60.9% 60.8% -60 bps -50 bps
($B)
43,941 47,238 46,224 47,565 48,140
36,819 38,776 36,324 39,177 39,445
Q4 19 Q1 20 Q2 20 Q3 20 Q4 20
Individual Mutual funds
86,014 80,760 82,548
87,585 86,742

Global Markets Revenues
($MM)
APPENDIX 6 │ FINANCIAL MARKETS
▪ Solid performance in Global Markets, against strong Q4/19
- Continued momentum in fixed income trading
- Partly offset by a reduction in opportunities in Equity Finance
▪ Strong quarter for C&IB with revenues up 9% YoY, mainly driven by M&A
▪ Lower non-interest expenses in Q4 from compensation adjustment
- F2020 expenses up 7% against revenue growth of 17%
Financial Markets Summary Results - Q4 2020
($MM, TEB)
24(1) Corporate Banking only.
24 3064
19 19
78 85
105 126 114
197 174
227
157 148
Q4 19 Q1 20 Q2 20 Q3 20 Q4 20Commodity and Foreign exchange Fixed income Equity
289299
396
281302
Q4 20 Q3 20 Q4 19 QoQ YoY
Revenues 495 503 495 (2%) -
Global Markets 281 302 299 (7%) (6%)
C&IB 214 201 196 6% 9%
Non-Interest Expenses 184 206 209 (11%) (12%)
Pre-Tax / Pre-Provisions 311 297 286 5% 9%
PCL 27 41 10
Net Income 209 188 203 11% 3%
Other Metrics Q4 20 Q3 20 Q4 19 QoQ YoY
Avg Loans & BAs(1) 18,589 20,093 16,950 (7%) 10%
Efficiency Ratio (%) 37.2% 41.0% 42.2% -380 bps -500 bps

APPENDIX 7 │ US SPECIALTY FINANCE & INTERNATIONAL
25
USSF&I Summary Results - Q4 2020
($MM)
USSF&I
▪ Strong performance with net income up 36% YoY
▪ Well positioned to continue delivering strong growth
ABA Bank
▪ Continued momentum with net income up 24% YoY, loans up 39% and deposits up 37%
- Continued market share gains for ABA
Credigy
▪ Strong performance with net income up 84%
- Driven by higher revenues and lower PCL
▪ Disciplined growth to continue in 2021
▪ National Bank acquiring remaining ~20% interest in Q1/21
Q4 20 Q3 20 Q4 19 QoQ YoY
Revenues 232 210 192 10% 21%
Credigy 122 104 95 17% 28%
ABA 111 105 90 6% 23%
Other (1) 1 7
Non-Interest Expenses 80 79 74 1% 8%
Credigy 38 36 38 6% 0%
ABA 41 42 36 (2%) 14%
Other 1 1 -
PCL 17 21 20 (19%) (15%)
Credigy 12 16 18 (25%) (33%)
ABA 5 5 2 0% 150%
Net Income 106 87 78 22% 36%
Credigy 57 41 31 39% 84%
ABA 51 46 41 11% 24%
Other (2) - 6
Other Metrics Q4 20 Q3 20 Q4 19 QoQ YoY
Avg Loans - Credigy 7,432 7,806 6,174 (5%) 20%
Avg Loans - ABA 4,395 4,124 3,159 7% 39%
Avg Deposits - ABA 5,791 5,040 4,227 15% 37%
Efficiency Ratio (%) 34.5% 37.6% 38.5% -310 bps -400 bps
ABA Bank - Branches 77 77 70 - 10%

APPENDIX 8 │ OTHER
▪ Higher non-interest expenses YoY:
- Incremental expenses for health and safety measures in context of pandemic
- Year-end compensation adjustment
- Technology investments
- Marketing spend
- Payment to an outsourcer
Other Segment Summary Results - Q4 2020
($MM, TEB)
26
Adjusted Results Q4 20 (1) Q3 20 Q4 19
(1)
Revenues (3) 6 -
Non-Interest Expenses 130 58 75
Pre-Tax / Pre-Provisions (133) (52) (75)
PCL (2) - -
Pre-Tax Income (131) (52) (75)
Net Income (93) (34) (63)
Reported Results Q4 20 Q3 20 Q4 19
Specified Items (123) - (8)
Net Income (216) (34) (71)
(1) Excluding Specified Items. Please refer to slide 36 for additional information.

APPENDIX 9 │ TOTAL LOAN PORTFOLIO OVERVIEW
27
▪ Secured lending accounts for 94%
of Retail loans
▪ Indirect auto loans represent 1.8% of total
loans ($3.0B)
▪ Limited exposure to unsecured retail and
cards (4% of total loans)
▪ Non-Retail portfolio is well-diversified
across industries
(1) Includes indirect lending and other lending secured by assets other than real estate.
(2) Includes Mining, Finance & Insurance, Transportation, Professional Services, Construction, Communication, Government and Education & Health Care.
Loan Distribution by Borrower Category
($B)
As at
October 31, 2020 % of Total
Retail
Secured - Mortgage & HELOC 81.5 49%
Secured - Other (1) 9.1 5%
Unsecured 4.3 3%
Credit Cards 1.8 1%
Total Retail 96.7 58%
Non-Retail
Real Estate and Construction RE 14.2 9%
Agriculture 6.7 4%
Manufacturing 5.5 3%
Other Services 5.3 3%
Retail & Wholesale trade 5.2 3%
Oil & Gas and Pipeline 5.1 3%
Oil & Gas 2.5 2%
Pipeline & Other 2.6 2%
Utilities 4.4 3%
Other(2) 21.9 13%
Total Non-Retail 68.3 41%
Purchased or Originated Credit-Impaired 0.9 1%
Total Gross Loans and Acceptances 165.9 100%

APPENDIX 10 │ REGIONAL DISTRIBUTION OF CANADIAN LOANS
28
Within the Canadian loan portfolio:
▪ Limited exposure to unsecured consumer
loans (3.6%)
▪ Modest exposure to unsecured consumer
loans outside Quebec (0.8%)
▪ RESL exposure predominantly in Quebec
(1) Oil regions include Alberta, Saskatchewan and Newfoundland
(2) Maritimes include New Brunswick, Nova Scotia and P.E.I.
(3) Includes Corporate, Other FM and Government portfolios
Prudent Positioning
(As at October 31, 2020)
Quebec Ontario
Oil
Regions(1)
BC/MB
and
Territories Total
Retail
Secured
Mortgage & HELOC27.8% 13.6% 4.8% 3.6% 1.1% 50.9%
Secured
Other2.8% 1.3% 0.5% 0.7% 0.3% 5.6%
Unsecured
and Credit Cards2.8% 0.4% 0.1% 0.1% 0.2% 3.6%
Total Retail 33.4% 15.3% 5.4% 4.4% 1.6% 60.1%
Non-Retail
Commercial 17.6% 4.0% 1.9% 1.3% 0.6% 25.4%
Corporate Banking
and Other(3) 4.2% 5.2% 3.3% 1.4% 0.4% 14.5%
Total Non-Retail 21.8% 9.2% 5.2% 2.7% 1.0% 39.9%
Total 55.2% 24.5% 10.6% 7.1% 2.6% 100.0%
Maritimes(2)

APPENDIX 11 │ LIMITED EXPOSURE TO COVID-19 MOST IMPACTED INDUSTRIES
▪ Limited exposure to COVID-19 most impacted industries (down 3.5% QoQ)
29
Gross Loans % of
($MM) Book
Non-Food / Non-Pharmacy Retailers
Essential Services Retailers $408 0.2% n Increase of 8% QoQ / Majority of exposure is secured / No loan still under moratorium
Other Retailers $530 0.3% n Decrease of 4% QoQ / Diversified customer base / Less than 25% in apparel
Car Dealerships $555 0.3% n Decrease of 4% QoQ / Typically secured by real estate / Strong recovery in car sales
Hospitality and Entertainment
Entertainment $509 0.3% n Flat QoQ / 53% in professional sports teams which are 77% IG
Hotels $346 0.2% n Remained disciplined in sector / Secured portfolio with conservative LTV and branded assets
Restaurants $203 0.1% n Decrease of 17% QoQ / Maintained a low risk appetite for the sector throughout the years / 57% IG
Air Transportation and Aeronautics
Aviation $528 0.3% n Decrease of 18% QoQ / 22% related to airports and airport operations
Aeronautics $62 0.0%
Auto and Auto Parts Manufacturing $193 0.1% n Decrease of 18% QoQ
Retail Real Estate n Constrained portfolio growth in recent years
Diversified REITs $750 0.5% n Primarily IG REITs with good liquidity and continued access to capital markets
Commercial Retail $1,931 1.2% n More than 90% with street access / about 50% of leases with essential services tenants

APPENDIX 12 │ OIL & GAS AND PIPELINES SECTOR
30
▪ O&G producers and services exposure
significantly reduced
- 37% reduction in outstanding loans: down
from $4B in Q1/15 to $2.5B in Q4/20 (vs
$2.8B in Q3/20)
- Reduction as a % of total loans: down from
3.7% in Q1/15 to 1.5% in Q4/20
- Canadian focused strategy, minimal direct
US exposure
▪ Overall O&G and Pipeline portfolio
refocused from mid-cap to large cap
- Producers share declined from 82% in
Q1/15 to 45% in Q4/20
- 51% of the portfolio is Investment Grade
(as of Q4/20)
▪ Very modest indirect exposure to
unsecured retail loans in the oil regions
(~0.1% of total loans)
O&G Producers and Services Exposure
Gross Loans in $MM and % of Total Loans
O&G and Pipeline sector
Total Gross Loans of $5.1B as at October 31, 2020
82%
45%
9%
40%
5%4%
4%11%
Q1 15 Q4 20
Producers Midstream Services Refinery & Integrated
IG: 30%
IG: 67%
IG: 8%
IG: 100%
$3,956
$2,506
Q1 15 Q4 20
3.7%
1.5%

APPENDIX 13 │ COMMERCIAL REAL ESTATE PORTFOLIO
31
Total CRE Portfolio of $11.3B
▪ Corporate Banking accounts for 19% of
portfolio, primarily public REITs, well diversified
across sectors
▪ Commercial Banking accounts for 81% of
portfolio, well controlled growth in recent years
Drill down on Commercial Banking CRE:
Residential (2.5% of total loans)
▪ 1/3 of portfolio is insured
▪ LTV on uninsured ~60%
▪ Accounted for majority of portfolio growth in
2020 (+15% QoQ)
Retail (1.2% of total loans)
▪ Limited growth (-2% QoQ)
▪ Portfolio LTV ~58%
▪ ~50% of leases with essential services tenants
Office (0.8% of total loans)
▪ Portfolio LTV ~62%
▪ Long term leases (over 6 years)
Total CRE Portfolio
$11.3B (6.8% of total loans)
Commercial Banking share
$9.2B (5.6% of total loans)
(As at October 31, 2020)
Geographic Distribution (Commercial Banking CRE)
68%
16%
6% 5% 4%
QC ON BC Other Provinces AB

APPENDIX 14 │ DAILY TRADING AND UNDERWRITING REVENUES VS. VAR
32
($MM)
(20)
(15)
(10)
(5)
0
5
10
15
20
25
August-2020 September-2020 October-2020
Trading P&L Trading VaR

APPENDIX 15 │ TRADING VaR TREND
33
($MM)

APPENDIX 16 │ LOAN & DEPOSIT OVERVIEW
▪ Loan Growth YoY 7.5%
- Retail 8.4%
- Business & Govt 6.1%
▪ Deposit Growth YoY 21.3%
- Retail 12.4%
- Business & Govt 27.6%
34
Loans and BA’s(1)
($B)
Deposits(2)
($B)
(1) As per balance sheet total net loans.
(2) As per balance sheet total deposits, excluding deposits from deposit-taking institutions and wholesale funding.
96.1 97.2 98.5 100.5 104.1
57.2 58.9 64.2 61.3 60.7
153.3 156.2 162.7 161.8 164.7
Q4 19 Q1 20 Q2 20 Q3 20 Q4 20
Retail Business & Govt
60.1 61.4 63.9 66.2 67.5
85.3 90.6 95.0 102.3 108.8
145.3 152.0
158.9 168.5
176.3
Q4 19 Q1 20 Q2 20 Q3 20 Q4 20
Retail Business & Govt

APPENDIX 17 │ RANGE OF MACROECONOMIC SCENARIOS - IFRS9
35
Canada Real GDP
($ Trillions)
Canada Unemployment Rate
(%)
NBC Macroeconomic Forecast: Q4 vs. Q3
(Full Calendar Years)
Source: NBF Economics and Strategy. Macroeconomic assumptions are for calendar years. Please refer to pages 17-18 and 177-178 of the Bank’s 2020 Annual Report
for additional information.
1.75
1.85
1.95
2.05
2.15
2.25
Q1
19
Q2
19
Q3
19
Q4
19
Q1
20
Q2
20
Q3
20
Q4
20
Q1
21
Q2
21
Q3
21
Q4
21
Q1
22
Q2
22
Q3
22
Q4
22
5
6
7
8
9
10
11
12
13
14
15
Q1
19
Q2
19
Q3
19
Q4
19
Q1
20
Q2
20
Q3
20
Q4
20
Q1
21
Q2
21
Q3
21
Q4
21
Q1
22
Q2
22
Q3
22
Q4
22
Baseline (Oct. '19)Baseline (Oct. '20) Baseline (Jul. '20)
Range of Alternative Scenarios (Oct. '20)
Base Scenario C2020 C2021 C2022
Real GDP (Annual Average % Change)
As at July 31 (7.1%) 4.9% 3.0%
As at October 31 (5.7%) 4.1% 2.7%
Unemployment Rate (Average %)
As at July 31 9.6% 8.8% 8.4%
As at October 31 9.6% 8.8% 8.4%
Housing Price Index (Q4/Q4 % Change)
As at July 31 1.3% (8.0%) 4.5%
As at October 31 5.3% (6.9%) 2.9%
WTI (Average US$ per Barrel)
As at July 31 38 46 53
As at October 31 38 43 52
S&P/TSX (Q4/Q4 % Change)
As at July 31 (8.8%) 5.9% 3.5%
As at October 31 (4.6%) 1.3% 3.5%
BBB Spread (Average Spread %)
As at July 31 2.2% 2.1% 2.0%
As at October 31 2.0% 2.0% 1.9%

36
(1) All Specified Items recorded during the fourth quarter of 2020 are accounted for under the “Other” heading of segment results. The currency translation loss
on disposal of subsidiaries is reflected in “Non-interest income”. The impairment loss and severance pay are reflected in “Non-interest expenses”. Please refer
to pages 22-23 of the Bank’s 2020 Annual Report for additional information.
(2) During the fourth quarter of 2019, the Bank recorded a charge of $11 million related to the company Maple Financial Group Inc. The charge is reflected in
“Non-interest expenses” and accounted for under the “Other” heading of segment results. Please refer to pages 22-23 of the Bank’s 2020 Annual Report for
additional information.
Income
Before
Taxes
Net
Income
Non-
controlling
interest
EPS
Income
Before
Taxes
Net
IncomeEPS
Charge related to Maple (11) (8) (0.02 $)
Impairment losses on premises and
equipment and on intangible assets(71) (52) - (0.15 $)
Severance pay (48) (35) - (0.10 $)
Foreign currency translation loss on
disposal of subsidiaries(24) (36) (10) (0.08 $)
Total impact (143) (123) (10) (0.33 $) (11) (8) (0.02 $)
Q4 20 (1) Q4 19 (2)
($MM, except EPS)
APPENDIX 18 │ SPECIFIED ITEMS

Investor Relations Contact InformationW: www.nbc.ca/investorrelations
1-866-517-5455
Linda Boulanger, Senior Vice-President
514-394-0296 | [email protected]
Arslan Benbakouche, Senior Manager
514-412-8027 | [email protected]
Marie-Claude Jarry, Senior Advisor
514-412-8144 | [email protected]
Marianne Ratté, Senior Director
514-412-5437 | [email protected]
Rock Regimbald, Senior Analyst
514-394-8468 | [email protected]