N90-23318 - CORE
14
N90-23318 The High Energy Source 3C 273 Corinna yon Montigny Max-Planck-lnstitut ffirPhysik u. Astrophysik I.nstitutffr Extraterrestrische Physik D-8046 Garching, F.R.G Abstract In this paper I review the properties of 3C 273 and attempt to find an answer to the question why 3C 273 is the only extragalactic source so far,which has been detected at energies _> 50 MeV. Introduction 3C 273 ((rv, _)=1226-02, z = 0.158) is a very bright optical quasar with a one- sided, faint optical jet. Its apparent magnitude is rnv = 12.5 mag and its optical luminosity at 2500 ,_ is Lopt = 2.3- 1031 erg/sec (Wilkes & Elvis, 1987). In 1962 it was detected to be a very bright radio double source with an intensity at 20 cm of 46 Jy (=46. lO-26W/rn2Hz) (fig.l). QSO G JET A '_ B O O O Figure i: 408 MHz radio contour map of 3C 273 (adapted from Conway 1982). Component A of the double source was identified with the optical quasar and has a very flat but complex radio spectrum with a spectral index between 2.7 GHz 289 PRECEDING PAGE BLANK NOT FILMED brought to you by CORE View metadata, citation and similar papers at core.ac.uk provided by NASA Technical Reports Server
Transcript of N90-23318 - CORE

N90-23318
The High Energy Source 3C 273
Corinna yon Montigny
Max-Planck-lnstitut ffirPhysik u. Astrophysik
I.nstitutffr Extraterrestrische Physik
D-8046 Garching, F.R.G
Abstract
In this paper I review the properties of 3C 273 and attempt to find an answer to the question
why 3C 273 is the only extragalactic source so far,which has been detected at energies _> 50 MeV.
Introduction
3C 273 ((rv, _)=1226-02, z = 0.158) is a very bright optical quasar with a one-
sided, faint optical jet. Its apparent magnitude is rnv = 12.5 mag and its optical
luminosity at 2500 ,_ is Lopt = 2.3- 1031 erg/sec (Wilkes & Elvis, 1987).
In 1962 it was detected to be a very bright radio double source with an intensity
at 20 cm of 46 Jy (=46. lO-26W/rn2Hz) (fig.l).
QSO GJET
A '_ B
OO
O
Figure i: 408 MHz radio contour map of 3C 273 (adapted from Conway 1982).
Component A of the double source was identified with the optical quasar and
has a very flat but complex radio spectrum with a spectral index between 2.7 GHz
289
PRECEDING PAGE BLANK NOT FILMED
https://ntrs.nasa.gov/search.jsp?R=19900014002 2020-03-19T22:12:38+00:00Zbrought to you by COREView metadata, citation and similar papers at core.ac.uk
provided by NASA Technical Reports Server

and 5 GHz of _r = 0.01 ± 0.07 (Kfihr et al., 1981). Component B is associated
with the optical jet and its radio spectral index is ar _ 0.7.
3C 273 was detected in X-rays in 1970. Its luminosity in the 2 - 10 keV band is
,-, 1046 erg/sec and the X-ray spectral index lies in the range 0.35 _< ax _< 0.5. Two
positive detections of a high energy source in the Virgo region have been reported
with the COS-B satellite in 1976 and 1978. This source has been identified with
3C 273 because of the positional coincidence (Swanenburg et al., 1978) and has
been confirmed by Bignami et al., 1981. So far the radio-loud quasar 3C 273 is
the only extragalactic source which has been detected at energies > 50 MeV. Since
it shows all the characteristics which are typical for high luminosity quasars: an
optical and radio jet, superluminal motion and an UV excess, it seems to be the
source which is best suited for detailed studies in order to learn more about the
physical processes taking place in quasars.
Observations
Recent simultaneous multifrequency observations from radio to X-rays (Cour-
voisier et al., 1987) have once again confirmed that 3C 273 is variable in all
wavebands. The source was observed at several epochs between December '83 and
March '86. The temporal behavior of 3C 273 in the far infrared (FIR) and near
infrared (NIR) regions is shown in fig. 2a. The fluxes were normalized to the flux
of the first observation. To avoid confusion the flux variations in the three NIR
bands have been averaged after the normalization. This seemed to be appropriate,
because the temporal behavior in these three bands was the same.
As fig. 2a clearly shows there is no direct correlation between the FIR and
the NIR. After a sharp rise shortly after the beginning of the observations, the
FIR decreased rather steadily while the NIR stayed nearly constant, except for
a possible dip in May '85. From this behavior can be followed that there have
to be two well separated components which do not overlap. This implies a sharp
cut-off of the FIR component between 10 and 5 /zm, the beginning of the NIP,.
(Courvoisier et al., 1987).
The latest theories attempt to explain the generation of X-rays by inverse
Compton scattering on infrared synchrotron photons. Therefore the temporal
290
ORIGINAL PAGE IS
OF POOR QUALITY
0
L
0
©>
o¢)
3
i[Illl
;\/ "\
+\
l _ I I I = I J I I 1 l I i l i I _ = L I
O. 10. 20.
time (month== since Dec. "83)
*_ J"
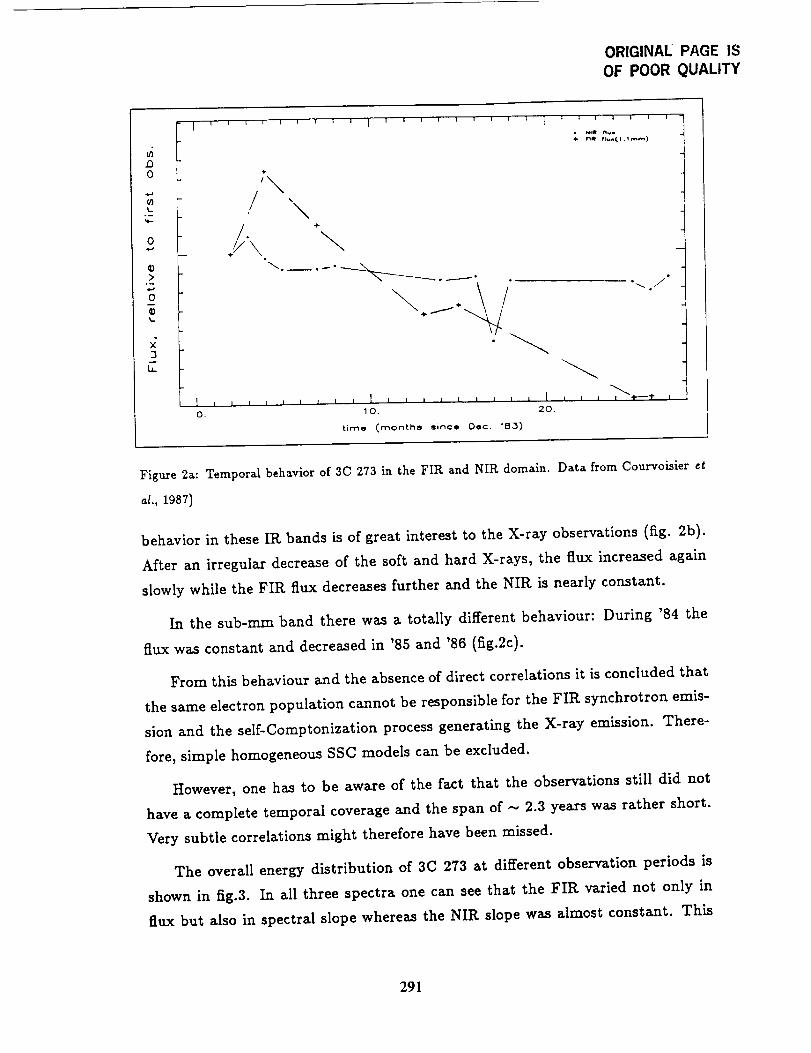
Figure 2a: Temporal behavior of 3C 273 in the FIR and NIR domain. Data from Courvoisier et
al., 1987)
behavior in these IR bands is of great interest to the X-ray observations (fig. 2b).
After an irregular decrease of the soft and hard X-rays, the flux increased again
slowly while the FIR flux decreases further and the NIR is nearly constant.
In the sub-ms band there was a totally different behaviour: During '84 the
flux was constant and decreased in '85 and '86 (fig.2c).
From this behaviour and the absence of direct correlations it is concluded that
the same electron population cannot be responsible for the FIR synchrotron emis-
sion and the self+Comptonization process generating the X-ray emission. There-
fore, simple homogeneous SSC models can be excluded.
However, one has to be aware of the fact that the observations still did not
have a complete temporal coverage and the span of ,,- 2.3 years was rather short.
Very subtle correlations might therefore have been missed.
The overall energy distribution of 3C 273 at different observation periods is
shown in fig.3. In all three spectra one can see that the FIR varied not only in
flux but also in spectral slope whereas the NIR slope was almost constant. This
291
OR!GrN,_,L PAGE IS
OF POOR QUALITY
DO
L.
0
©>
°--
0
Q)t.
3
IrilrF_ilT 1_l|lllll
o
/\
_ _t_ Wt_NFf_ _lum_ I _ 1 m_
, \o
\ \
l L t t l L Z L I I ( I L L t l | t I l I I I I'_l fl _-I_ {
o. lO. 20.
time (months since Dec. "83)
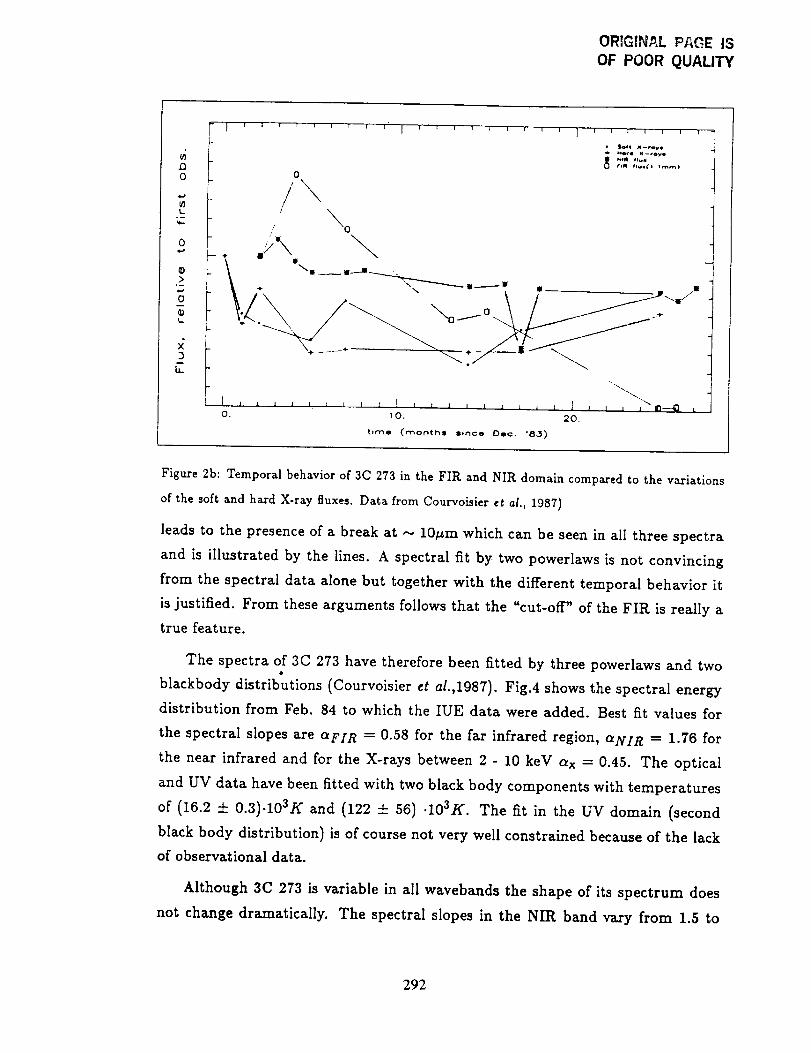
Figure 2b: Temporal behavior of 3C 273 in the FIR and NIR domain compared to the variations
of the soft and hard X-ray fluxes. Data from Courvoisier et al., 1987)
leads to the presence of a break at --- 10/_m which can be seen in all three spectra
and is illustrated by the lines. A spectral fit by two powerlaws is not convincing
from the spectral data alone but together with the different temporal behavior it
is justified. From these arguments follows that the _cut-off" of the FIR is really a
true feature.
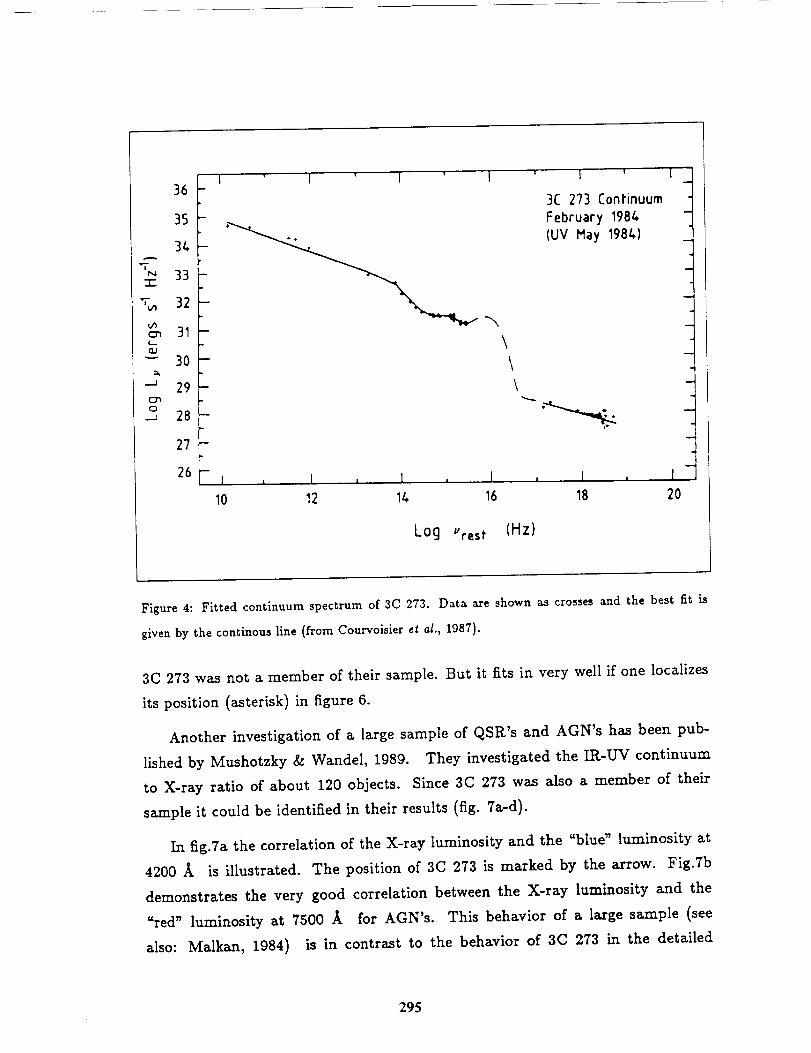
The spectra of 3C 273 have therefore been fitted by three powerlaws and two
blackbody distributions (Courvoisier ¢t a/.,1987). Fig.4 shows the spectral energy
distribution from Feb. 84 to which the IUE data were added. Best fit values for
the spectral slopes are aFi R = 0.58 for the far infrared region, aNi R = 1.76 for
the near infrared and for the X-rays between 2 - 10 keV ax = 0.45. The optical
and UV data have been fitted with two black body components with temperatures
of (16.2 :i= 0.3)-103K and (122 + 56) .103K. The fit in the UV domain (second
black body distribution) is of course not very well constrained because of the lack
of observational data.
Although 3C 273 is variable in all wavebands the shape of its spectrum does
not change dramatically. The spectral slopes in the NIR band vary from 1.5 to
292

OF POOR QUALITY
r_0
k_
0,oa
>
o
x"3
b-
[ i
1. ÷\
\\
I ,o.
llllllllIIlllllll ' I i i ! I I 1
• IIO41_I* 4kam (22GMI)
_ r,u.
10. 20.
time (months since Oe¢. "83)
III¢
Figure 2c: Temporal behavior of 3C 273 in the Radio, optical and UV domain. Data from Cour-
voisier et aL, 1987)
1.75, in the FIR band from 0.6 - 0.9 and in the 2 - 10 keV X-ray range from 0.35
- 0.5. All in all it is a very usual spectrum.
Comparison with other QSR's and AGN's
Since the Einstein IPC database is now available many investigations of large
samples of quasars and AGN's (here Seyfert I) have been done. One of those
investigations was performed by Wilkes & Elvis, 1987. They found that radio-
loud (RL) quasars have a flatter X-ray spectrum than radio-quiet (RQ) quasars
(see fig. 5). 3C 273, a member of their sample, is encircled by a dashed line. This
correlation between radio-loudness and steepness of the X-ray spectrum has been
very well confirmed by Brunner et al., 1989.
In the beginning of 1989 Canizares & White published investigations of high
redshift quasars. They had a more detailed look into the properties of RL quasars.
They found that if they divide them into two classes, one class with flat radio
spectra (FRS; r,r<_ 0.35) and one class with steep radio spectra ($RS; at>_ 0.35),
the average steepness of the X-ray spectra is different (fig. 6). Unfortunately,
293

ORIGINAL PAGE IS
OF POORQUALITY
-2Z
"_ -2)-r-
-2/,
-ZS
,,.- -z7
_,= a
-29
-2t
-2Z
--- -23-r-
"E -Zt,,_a
%, -Z5
_, -zJ
,,., -27
-29
-21
-22
--- -n:E
_'E -21,
-_, -Z5
_ .27
-29
L • J _ ! , X . J . ! , ] . ! . I . ] , I "1.
10 11 lZ 13 v. 15 16 f/ 111 I'1 20
Log, (HZ)
-_,. 3C 273 May 19tls(R_lio inAprd} -
F_Ir IR m M;Iff_ !
.!
1 . J . 1 • J . 1 . t
',4 11 12 13 14 _ ¼ 17 _II
Lo9 , (Hzl
• i • i [ • I - t - i - l - i t
3C173 Febr_lr_ _966
\
l . I . I . I . I
20
I _ I , !, , I L l I I l , I .
lO I1 12 1] lk 15 IA 17 111 19
Log, (Hz}
"1
.Ji
I
1
it
2O
Figure 3: Overall energy distributions of 3C 273 from different observations where the spectral
coverage was most complete (adapted from Courvoisier et sl.,1987).
294
36 I ' 1 ' I ' I ' I ' I_13C 2"/3Continuum _r
35 ._ February 1984 .
34 _ (UV May 1984)
33
";'L,,, 32
_ 3031 -- _ _\\\29
28 "_ -_._....__J
27
26 _ , I , l , [ , I , 1
10 12 14 16 18 20
Log _'rest (Hz)
Figure4: Fittedcontinuumspectrum of3C 273. Data axe shown as crossesand the bestfitis
givenby thecontinousline(fromCourvoisieretal.,1987).
3C 273 was not a member of their sample. But itfitsin very well ifone localizes
itsposition (asterisk)in figure6.
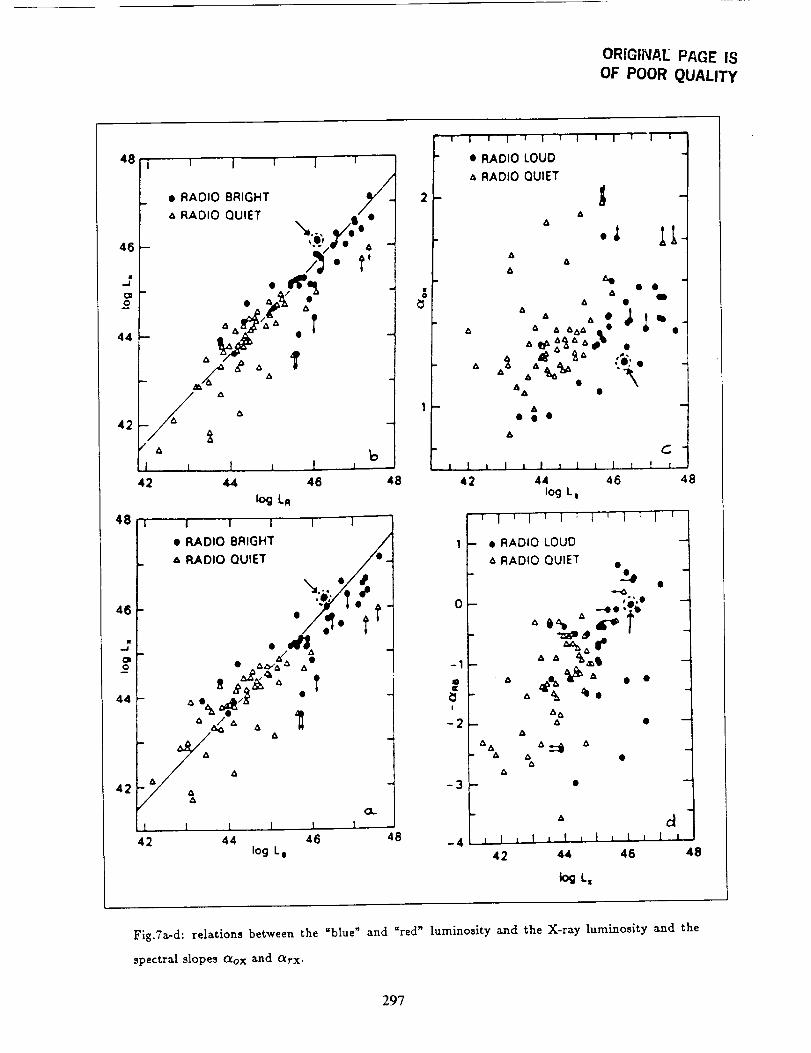
Another investigationof a large sample of QSR's and AGN's has been pub-
lishedby Mushotzky & Wande], 1989. They investigatedthe IR-U¥ continuum
to X-ray ratio of about 120 objects. Since 3C 273 was also a member of their
sample itcould be identifiedin theirresults(fig.7a-d).
In fig.Tathe correlationof the X-ray luminosity and the "blue" luminosity at
4200 k is illustrated.The position of 3C 273 ismarked by the arrow. Fig.Tb
demonstrates the very good correlation between the X-ray luminosity and the
=red" luminosity at 7500 _ for AGN's. This behavior of a large sample (see
also: Malkan, 1984) is in contrast to the behavior of 3C 273 in the detailed
295

Or,,G,NAt: PAGE IS
OF POOR QUALITY
RADIO- LOUD
4
.a 2n,.
0
RADIO-QUIET -
I I • I I
p_
• •
I t ° I I,0 0.5 I 1.5
ENERGY INDEX
Figure 5: Radio loudness ofquasars versusX-ray slope GE (from Wilkes & Elvis,1987).
1,5
- I
i! i
r '
)
T
T
RO
SR5i
i Z=
FR5
0 $ 1 15 2 25 3 35Redshl(l.
Figure 6: X-ray power-law index exversusredshiftfor FRS, SRS and radioquiet (RQ) quasars.
observations by Courvoisier et al. 1987, where a correlation between the infrared
and X-ray emission could not be found. Therefore, there must exist some kind
296
ORfGINII.[ PAGE IS
OF POOR QUALITY
41
4E
.,J
OD_¢
44
42
48
46
..4
OI@
44
42
I I f I
. Aoos ,GHT" RADIO QUIET
"- ,m, "_A ?
°°
42 44
bl I 1
46 48
log L_
I I I 1 I
• RADIO BRIGHT
& RADIO QUIET • _/_
• A/dliP__• _ _:>,'__
A /A _
l i u 1 1 1 [ i i' i "[ 'J"-"-t _
• RADIO LOUD
,'- RADIO QUIET
&
.,L&
• •
&A • •
A• • •
A
1 ] ,I I t ! I I t I ]. I t
42 44 46log L0
• RADIO LOUO
,*' RADIO QUIET
%.
1 m
0
-1
mE
!
-2
-3
o_,O
_%,,r"" _=t
A
A •
46 4842 44 log Lz -4 _, I _ [ _ I z J , 1 _ !
42 44 46
log L,
48
48
Fig.Ta-d: relations between the "blue" and =red" luminosity and the X-ray luminosity and the
spectral slopes CZox and C_rx.
297

of time averaging mechanism which correlates the infrared to the X-ray emission.
But this does not change the fact that even here 3C 273 behaves very normal.
Figures 7c and 7d show the relation between the _blue" luminosity of AGN's
(quasars and Seyfert I's) and their spectral slopes between the optical and the
X-ray region (aox) and between the _red" and the X-ray region (arx), respec-
tively. Although there is no correlation between these parameters these figures
demonstrate that 3C 273 fits in here, too.
The only difference which could be found is demonstrated in figure 8 where
the 2 - 10 keV X-ray luminosities of the Mushotzky & Wandel sample are plotted
versus redshift. Here, 3C 273 clearly stands out against the general trend which
might be due to some kind of evolution effect.
Conclusion
3C 273 is not at all a particularly special source. This follows from the com-
parisons with other active galactic nuclei. It shows no extraordinary spectral
features, neither in its radio to X-ray ratio nor in its IR-UV continuum to X-ray
ratio. The only peculiarity is its extreme luminosity in all wavebands together
with a relatively small distance (z = 0.158). It is therefore very probable that the
"_-ray emission is not a special feature of 3C 273 but is common for all quasars
and Seyfert I galaxies. Under this assumption and the requirement that the if-ray
luminosity is at least as high as the X-ray luminosity (as it is the case for 3C 273
and possibly for all radio loud quasars) EGRET should be able to detect some
more AGN's in the q-ray domain.
This prediction is illustrated by figure 9 which shows once again the 2-10 keV
X-ray luminosity of quasars and AGN's versus redshift relation. Since 3C 273 was
the only source detected by COS-B it is taken as reference point. The solid line
then indicates the detection limit for sources to be detectable by COS-B.
A corresponding limit is shown for EGRET (broken line). Here a sensitivity
for EGRET is assumed which is at least a factor of ten better than that of COS-
B. As can be seen then from figure 9, EGRET should be able to detect new
sources especially at low redshifts. Since the radio loud sources are expected to be
more luminous in the if-ray region than the radio quiet AGN's (Kazanas, 1989)
298

48
47
46
2>
_' 45O_y===--
Ic,q
440c-"
E
430
42
3C273
@
: °
a
• ¢,• 41 •
o °
4
4] i I I ill111 I [ I l llil I I i I I llll
10-2 iO-1 100 101
Redshift
Fig.8:2-10 keV X-ray luminosity of quasars and AGN's versus redshi£t (Data from Mushotzky &
Wandel, 1989).
299

48
47
46
45
44c'-
_ 430
42
41
COS-B EGRET
/
I
i m
• _[_ *
/ •I
l 1 i 1 l ill I l I I I i lli I 1 I i 1 1
t0-2 10-1 100 10
Redshift
Fig.9:2-10 keV X-ray luminosity of quasars and AGN's versus redshift. The solid line indicates
the _detection limit" of COS-B, the broken line that of EGRET. The crosses mark the radio loud
quasars and AGN's.
300
the probability of detecting RL quasars (marked by crosses) is of course higher.
These radio loud objects are: MCG 8-11-11, 3C 120, 3C 390.3, III Zw 2 and Mkn
618. These sources should therefore be good candidates for an observation with
EGRET.
References
Bignami, G.F., et al. 1981, Astron. Astrophys., 93, 71.
Brunner, H., Worrall, D.M., Wilkes, B.J. and Elvis, M. 1989, in press
Canizares, C.R. and White, J.L. 1989, Ap. J., 339, 27.
Conway et al. 1982, IA U Syrup. 97: Extragalactic Radio Sources,
Dordrecht, p. 167.
Courvoisier, T.J.-L., et al. 1987, Astron. Astrophys., 176, 197.
Kazanas, D. 1989, priv. communication.
Kfihr, H. et al. 1981, Astron. Astrophys. Supp., 45, 367.
Malkan, M.A. 1984, Proc. X-Ray and UV Emission from AGN's,
MPE report 1984, eds. W. Brinkmann, J. Trfimper, p. 121.
Mushotzky, R.F. and Wandel, A. 1989,
Swanenburg, B.N., et al. 1978, Nature,
Wilkes, B.J. and Elvis, M., 1987,
Ap. J., 339, 674.
275,298.
Ap. J., 323,243.
DISCUSSION
Richard Mushotzky:
The diagram shown is conservative in its prediction of the number of AGN that EGRET
will detect because the x-ray data are not a complete sample over the relevant flux range.
The ROSAT complete sample should provide several times the numbers of candidate
objects as shown in the figure.
Corinna Von Montigny:
Yes, that's true.301