N78- 1ao5 - NASA · N78- 1ao5 , NASA CR-112183 ... Two-Phase Separator Deionizer Resin Bed...
138
N78- 1ao5 , NASA CR-112183 DEVELOPMENT OF A SOLID POLYMER ELECTROLYTE ELECTROLYSIS CELL MODULE AND ANCILLARY COMPONENTS FOR A BREADBOARD WATER ELECTROLYS_ SYSTEM By F. J. Porter, Jr. August 1972 Prepared Under Contract NAS 1-9750 by General Electric Company Direct Energy Conversion Programs Lynn, Massachusetts 01910 for NATIONA L AERONAUTICS AND S PACE ADMINISTRAT ION https://ntrs.nasa.gov/search.jsp?R=19730004325 2020-03-23T06:27:04+00:00Z
Transcript of N78- 1ao5 - NASA · N78- 1ao5 , NASA CR-112183 ... Two-Phase Separator Deionizer Resin Bed...

N78- 1ao5 ,
NASA CR-112183
DEVELOPMENT OF A SOLID POLYMER ELECTROLYTE
ELECTROLYSIS CELL MODULE AND ANCILLARY COMPONENTS
FOR A BREADBOARD WATER ELECTROLYS_ SYSTEM
By F. J. Porter, Jr.
August 1972
Prepared Under Contract NAS 1-9750 by
General Electric Company
Direct Energy Conversion Programs
Lynn, Massachusetts 01910
for
NATIONA L AERONAUTICS AND S PACE ADMINISTRAT ION
https://ntrs.nasa.gov/search.jsp?R=19730004325 2020-03-23T06:27:04+00:00Z

ABSTRACT
A laboratory development program was undertaken to evaluate the use of the
solid polymer electrolyte (SPE) technology in a water electrolysis system (WES) along
with ancillary components to generate oxygen and hydrogen for a manned space station
application. Standard commercial components were utilized wherever possible. This
report presents the results of investigations, surveys, tests, conclusions and recom-
mendations for future development efforts.

CONTENTS
Section
SUMMARY
i. INTRODUCTION
. WATER ELECTROLYSIS SYSTEM (WES) DESCRIPTION
2.1 Specification
2.2 Configuration
. WES COMPONENT DEVELOPMENT
3.1 Electrolysis Module
3.2
3.3
3.4
3.5
3.6
3.7
3.8
3.9
3.10
3.11
3.12
3.13
3.14
3.1.1 History and Typical Performance Characteristics
3.1.2 One-Man Rated Breadboard Systems Testing
3.1.3 Four-Man Electrolysis Module Design
Power Conditioner
Breadboard Control Panel
Two-Phase Separator
Deionizer Resin Bed
Biological Filter Resin Bed
Regenerative Heat Exchanger
Water Temperature Regulating Valve
Process Water Pump
DC/AC 3-Phase Inverter
Water Flow Valve
Absolute Hydrogen Back-Pressure Regulator
Absolute Oxygen Back-Pressure Regulator
Differential Back-Pressure Regulator
4. CONCLUSIONS
5. RECOMMENDATIONS
6. Appendix - Heat Transfer Study Data
Page
2
2
2
5
5
5
8
12
13
14
15
16
17
18
18
19
20
20
21
21
21
22
24
105
iii
Figure
lo
2.
3.
o
5.
6.
7.
8.
9.
10.
11.
12.
13.
14.
15.
16.
17.
18.
19.
20.
21.
22.
23.
24.
25.
26.
27.
28.
29.
30.
31.
32.
33.
34.
35.
36.
LIST OF FIGURES
"4-Man" Breadboard Water Electrolysis System Fluid Schematic
SPE Electrolysis Cell Schematic
Laboratory 3 x 3 Inch Single Cell and Full-Size Prototype Single Cell
(Photo)
Laboratory Single-Cell Life Test Performance
Single-Cell Module Performance/Life Testing
Seven-Cell Module "A" Life Testing
Seven-Cell Electrolysis Module "A" (Photo)Seven-Cell Module "A" Tie Bolt Locations
Parasitic Current Density for 20 rail SPEEffect on Performance Decrease with Pressure
Effect of SPE Thickness on Performance
Breadboard Water Electrolysis System Test Schematic - Cathode Feed
Water Electrolysis System Test Setup (Photo)
Water Electrolysis System Test Setup (Closeup Photo)
Four-Cell Module Voltage Plot
Four-Cell Module Polarization Data
Layout-Electrolysis Module 13 Cells (1076527-910P1)
13-Cell Electrolysis Module (Photo)
75 Amp Power Conditioner (Photo)
Power Conditioner Schematic (SK 67A490-767)
Control Panel (Photo)
Control Panel Schematic (SK 67A490-766)
Detailed Assembly - Two-Phase Separator Breadboard Model
(1076527-845P1 and P/L)
H2 Flow vs. Pressure Drop of Two-Phase Separator
"Close Gap" Hydrophobic Subassembly
H2 Flow vs. Pressure Drop ("Close Gap" IIydrophobic Subassembly)
Assembly and Detail - Two-Phase Separator Prototype Model
(I076527-968P1)
Two-Phase Separator Prototype Model (Photo)
Water Flow vs. Ap (Two-Phase Separator Prototype Model
(1076527-968P1)Water Flow Permeability vs. AP (Two-Phase Separator Prototype
Model 1076527-968P1)
Detailed Assembly - Deionizer Resin Bed (1076527-957P1)
Deionizer Resin Bed (Photo)
Deionizer Resin Bed (1076527-968P1) Water Flow vs. Ap
Detailed Assembly - Biological Resin Bed (1076527-958P1)
Biological Filter Resin Bed (Photo)
Regenerative Heat Exchanger with Thermal Insulation (Photo)
Page
25
26
27
28
29
30
31
32
33
34
35
36
37
38
39
40
41
42
43
44
45
46
47 -49
50
51
52
53 -55
56
57
58
59
60
61
62
63
64
iv

Figure
37.
38.
39.
40.
41.
42.
43.
44.
45.
46.
47.
48.
LIST OF FIGURES (Continued)
Typical Electrolysis System Schematic
Valve-Temperature Regulating (Typical)
Water Temperature Regulating Valve (As Procured) (Photo)Process Water Pump Vendor Data
Water Flow Valve and Process Water Pump (Photo)
Inverter, Process Water Pump and Flow Valve Characteristics
DC/AC 3-Phase Inverter (Photo)
DC/AC 3-Phase Inverter Schematic (SK 67A490-765)Water Flow Valve
02 Abs. Back-Pressure, H2 Abs. Back-Pressure and H2-H20
Differential Back-Pressure Regulators (Photo)
02 and H2 Abs. Back-Pressure Regulators (P320-51 and P320-52)
H2-H20 Differential Back-Pressure Regulator (P321-50)
Page
65
66
67
6869
70
71
72
73
74
75, 76
77
V

LIST OF TABLES
Table Page
I,
IX,
Ill.
IV.
V.
VIo
VII.
VIIIg
IX.
X.
XI.
XII.
XIH.
XIV.
XV.
XVI.
XVII.
XVIII.
XIX.
XX.
XXI.
XXH.
XXIII.
XXIV.
XXV.
XXVI.
Guideline Specification for Four-Man Rated Water Electrolysis
System (WES)
WES Component Weights and Volumes
Electrolysis Unit Operation History
Seven-Cell Module "A" Tie-Bolt Torque History
Breadboard 4-Cell Module System Test Measurements Taken at1147 Hours
13-Cell Water Electrolysis Module - Significant Design Data
Hydrogen-Water Vapor/Water Separator Hydrohpilic MaterialData
Hydrogen/Water Separator Hydrophobic Material Data
Anion Exchange Resin Data (Deionizer)
Cation Exchange Resin Data (Deionizer)
Anion Exchange Resin Data (Biological Filter)
Cation Exchange Resin Data (Biological Filter)
Summary of Computer Case Studies for Electrolysis System
Comparison of Design Cooling Criteria for GE/DECP and
NASA/LRC Facilities for Electrolysis System Testing
Water Temperature Regulating Valve Specification
Process Water Pump Specification
Water Flow Valve Specification
Hydrogen Absolute Back-Pressure Regulator Specification
Oxygen Absolute Back-Pressure Regulator Specification
H2-H20 Differential Back-Pressure Regulator Specification
Electrolysis System Performance Summary - Case 103
Electrolysis System Performance Summary - Case 114
Electrolysis System Performance Summary - Case 115
Electrolysis System Performance Summary - Case 132
Electrolysis System Performance Summary - Case 143
Electrolysis System Performance Summary - Case 145
78
79
80
81
82, 83
84, 85
86, 87
88
89, 90
91, 92
93
94, 95
96
97
98
99,100
101
102
103
104
106,107
108,109
110,111
112,113
114,115
116,117
vi

SUMMARY
The purpose of the work described in this report was to investigate and describe
the use of a solid polymer electrolyte (SPE) for water electrolysis in a life support sys-
tem appropriate for a manned space station. The NASA contract required the develop-
ment of an electrolysis module rated at a one-man capacity of 2.5 lb O2/day, the inves-
tigation of system accessory requirements, a preliminary system design study for a
12-man oxygen generation system, and finally the assembly of a small breadboard sys-
tem. Reports of the 12-man system study and of the cell/module design were submitted
to NASA. One of three four-cell modules was tested at temperature and after about
1700 hours the test was discontinued due to gasket degradation. NASA operated one of
the four-cell modules at ambient temperature and 100 ASF for over a period of one year
and reported excellent performance. A seven-cell electrolysis module completed more
than 11,000 hours of operation without failure or disassembly. A complete one-man
rated laboratory breadboard system was fabricated and tested to evaluate system and
component performance. System prototype components (including a 13-cell electrolysis
module) were designed and fabricated for an oxygen system design point of 10 lb/day
(four-man rate). Checkout testing was accomplished on these components to completethe contract.
SECTION i. INTRODUCTION
The need for a reliable, long-lived, and efficient water electrolysis unit for
closed-cycle life-support systems has prompted a number of development programs
encompassing both acid and alkaline technologies. Early acid systems using liquid sul-
furic or phosphoric acid electrolytes suffered a significant performance penalty, as
compared with alkaline systems, in that they required considerably more power to gen-
erate a given amount of oxygen. Both acid and alkaline systems with liquid electrolytehave also encountered problems with leakage, materials compatibility, performance
stability, and life.
In March 1970, NASA Langley Research Center Contract NAS 1-9750 was
awarded to General Electric Company, Direct Energy Conversion Programs, Lynn,
Massachusetts, to investigate the use of the solid polymer electrolyte (SPE) technology
in a water electrolysis system to generate oxygen and hydrogen for manned space sta-
tion applications. The program was completed in August 1972, resulting in demonstra-
ted performance/life characteristics of the SPE electrolysis technology and the fabri-
cation of the major components of a four-man rated breadboard oxygen generation
system.
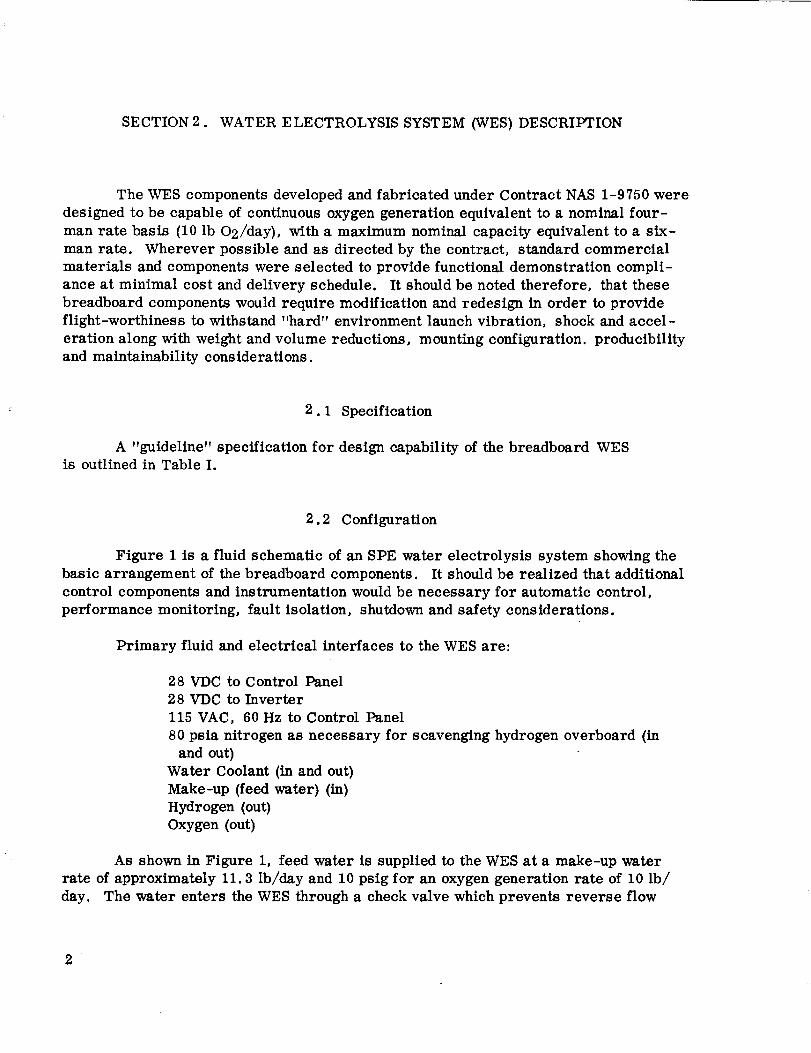
SECTION 2. WATER ELECTROLYSIS SYSTEM (WES) DESCRIPTION
The WES components developed and fabricated under Contract NAS 1-9750 were
designed to be capable of continuous oxygen generation equivalent to a nominal four-
man rate basis (i0 lb O2/day), with a maximum nominal capacity equivalent to a six-
man rate. Wherever possible and as directed by the contract, standard commercialmaterials and components were selected to provide functional demonstration compli-
ance at minimal cost and delivery schedule. It should be noted therefore, that these
breadboard components would require modification and redesign in order to provide
flight-worthiness to withstand "hard" environment launch vibration, shock and accel-
eration along with weight and volume reductions, mounting configuration, producibility
and maintainability considerations.
2.1 Specification
A "guideline" specification for design capability of the breadboard WESis outlined in Table I.
2.2 Configuration
Figure 1 is a fluid schematic of an SPE water electrolysis system showing the
basic arrangement of the breadboard components. It should be realized that additional
control components and instrumentation would be necessary for automatic control,
performance monitoring, fault isolation, shutdown and safety considerations.
Primary fluid and electrical interfaces to the WES are:
28 VDC to Control Panel
28 VDC to Inverter
115 VAC, 60 Hz to Control Panel
80 psia nitrogen as necessary for scavenging hydrogen overboard (in
and out)
Water Coolant (in and out)
Make-up (feed water) (in)
Hydrogen (out)
Oxygen (out)
As shown in Figure 1, feed water is supplied to the WES at a make-up water
rate of approximately 11.3 Ib/day and 10 psig for an oxygen generation rate of 10 lb/
day. The water enters the WES through a check valve which prevents reverse flow
2

whenthe system is shutdownat normal working pressures. The feed water is mixedwith recycled module cooling water upstream of the particulate filter to the water pump.This process water is circulated throughout the WESby a gear-type pump with quantityregulation maintained by the water flow valve and needle bypass valve. The pump de-sign includes an internal relief valve which becomesfunctional if an internal dead-endedcondition arises within the pump. Pressurization of the feed water to 10psigreduces the pump pressure rise and subsequentjournal bearing load and also preventsthe relief valve from continuously relieving. Excess pump capacity is deliveredthrough the needlebypass valve, An orifice could beused in place of the needle valvefor a flight designedsystem. The water pump is powered through a DC to 3-phase ACinverter with a 28 VDC input. Downstream of the pump, the water flows through adeionizer resin bed which reduces the ionic contamination level to acceptable WESpurity limits of ->400,000 ohm-cm.
The water then passes through a regenerative heat exchanger prior to mixing in
a temperature regulating valve which controls the supply temperature to the electroly-
sis module at approximately +100°F. This temperature control maintains electrolysis
module performance essentially independent of coolant and environmental temperature
variations. The process water is delivered to the cathode (hydrogen generating) side
of the 13-cell electrolysis module. Since the electrolysis occurs at the anode, water
required for this reaction diffuses through the solid polymer electrolyte at a rate just
equal to that required for oxygen generation. The generated oxygen will be saturated
at the cell temperature and pressure (approximately +12 0°F and 62 psia), but will con-
tain no liquid water. The free liquid water required for cell cooling will remain on the
cathode side and will exit with the hydrogen as a two-phase mixture. This heated mix-
ture passes through the regenerative heat exchanger to transfer its heat to the incom-
ing colder process water. The two-phase mixture (hydrogen and module cooling water)
leaving the regenerative heat exchanger is then cooled to approximately room tempera-ture in the primary heat exchanger which transfers heat to the interface coolant fluid.
Waste heat from the power conditioner is removed by the attached heat sink through
which the interface coolant is also circulated. A biological resin bed filter is installed
immediately upstream of the two-phase separator to remove micro-organisms (i. e.,
bacteria, molds, fungi, yeast} and particulate matter by three possible mechanisms,
namely:
Electrostatic attraction to the resin beads.
Particulate matter depth filtration through the resin bed column.
Retardation or actual destroying of bacteria and mold growth by anylocalized acidified water within the resin bed column.
The two-phase mixture, therefore, has been pre-cleaned prior to entry into the
two-phase separator. The life of the hydrophilic tubes with a pore size of 2 to 3.5
microns within the separator is therefore increased since pore clogging is minimized.
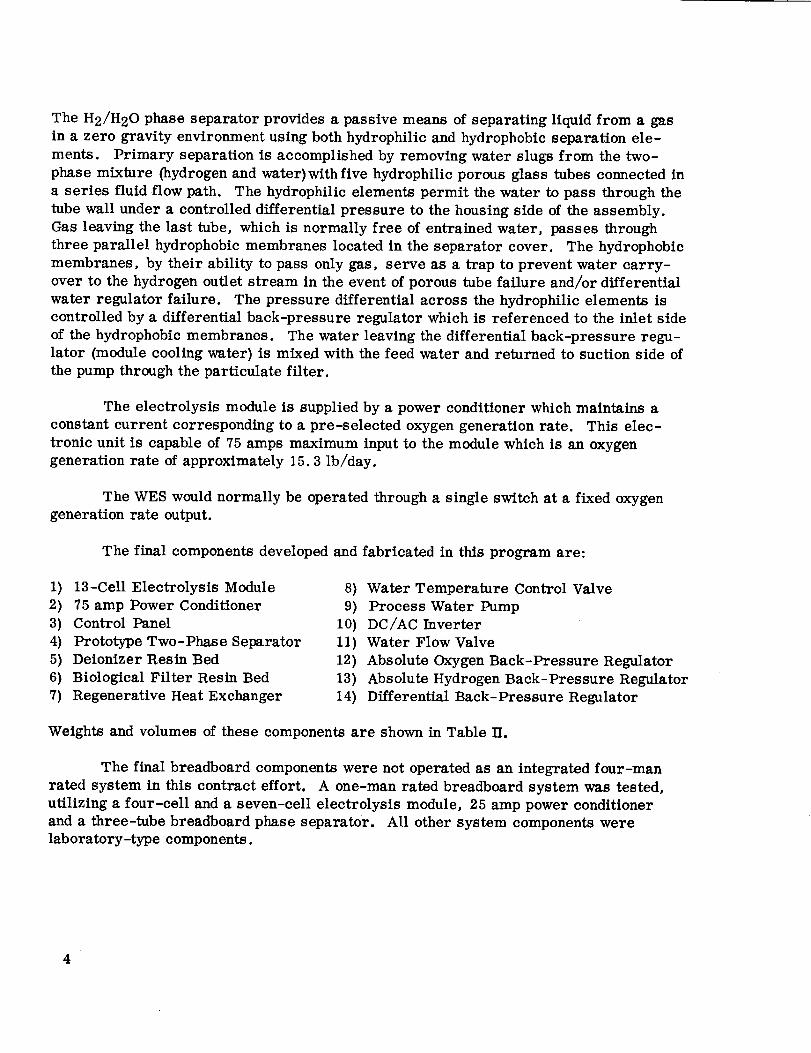
The H2/H20 phase separator provides a passive means of separating liquid from a gas
in a zero gravity environment using both hydrophilic and hydrophobic separation ele-
ments. Primary separation is accomplished by removing water slugs from the two-
phase mixture (hydrogen and water)with five hydrophilic porous glass tubes connected in
a series fluid flow path. The hydrophilic elements permit the water to pass through the
tube wall under a controlled differential pressure to the housing side of the assembly.
Gas leaving the last tube, which is normally free of entrained water, passes through
three parallel hydrophobic membranes located in the separator cover. The hydrophobic
membranes, by their ability to pass only gas, serve as a trap to prevent water carry-
over to the hydrogen outlet stream in the event of porous tube failure and/or differential
water regulator failure. The pressure differential across the hydrophilic elements is
controlled by a differential back-pressure regulator which is referenced to the inlet side
of the hydrophobic membranes. The water leaving the differential back-pressure regu-
lator (module cooling water) is mixed with the feed water and returned to suction side of
the pump through the particulate filter.
The electrolysis module is supplied by a power conditioner which maintains a
constant current corresponding to a pre-selected oxygen generation rate. This elec-
tronic unit is capable of 75 amps maximum input to the module which is an oxygen
generation rate of approximately 15.3 lb/day.
The WES would normally be operated through a single switch at a fixed oxygen
generation rate output.
The final components developed and fabricated in this program are:
i) 13-Celi Electrolysis Module
2) 75 amp Power Conditioner
3) Control Panel
4) Prototype Two-Phase Separator
5) Deionizer Resin Bed
6) Biological Filter Resin Bed
7) Regenerative Heat Exchanger
8) Water Temperature Control Valve
9) Process Water Pump
10) DC/AC Inverter
11) Water Flow Valve
12) Absolute Oxygen Back-Pressure Regulator
13) Absolute Hydrogen Back-Pressure Regulator
14) Differential Back-Pressure Regulator
Weights and volumes of these components are shown in Table II.
The final breadboard components were not operated as an integrated four-man
rated system in this contract effort. A one-man rated breadboard system was tested,
utilizing a four-cell and a seven-cell electrolysis module, 25 amp power conditioner
and a three-tube breadboard phase separator. All other system components were
laboratory-type components.
4

SECTION3. WESCOMPONENTDEVELOPMENT
Breadboard componentsdevelopedand/or evaluated in this program are themajor elements of an oxygengeneration system for space station life support or otherapplications requiring oxygenand hydrogen. Thesecomponents, whenfully designedand modified for flight-worthiness and maintainability, could comprise a reliable andefficient life support water electrolysis system (WES)similar to that shownby Figure Ifor the production of oxygenand hydrogen by electrochemical dissociation of waterwithin a solid polymer electrolyte (SPE)module. The following sections describe themajor componentsof this type of WESconfiguration.
3.1 Electrolysis Module
The solid polymer electrolyte (SPE) electrolysis module is the heart of the sys-
tem. With water and DC power supplied to the module, oxygen and hydrogen will be
generated. Figure 2 is a typical cell schematic. Figure 3 shows the components of
laboratory and prototype size electrolysis cells.
The electrolyte used in the SPE electrolysis cell is a solid plastic sheet about
10 mils thick having a cation exchange function with perfluorinated sulfonic acid groups.
This ion exchange membrane when saturated with water is the only electrolyte utilized.
There are no free acids or alkaline liquids in the system. Ionic conductivity is pro-
vided by the mobility of the hydronium ions passing to and from sulfonlc acid groups
(SO_) from the anode site to the cathode site. The sulfonic acid groups are fixed anddo not move, thus the concentration of the acid remains constant within the SPE. In
this application, process water is fed to the cathode catalyst electrode to provide the
water for electrolysis and waste heat removal. Stoichiometric water for the reaction
diffuses through the permeable SPE from the cathode to the anode. Process water
could be fed to the anode but liquid water would have to be continuously separated from
both H2 and O2 gas streams.
3.1.1 History and typical performance characteristics. - Table III presents
the history of SPE water electrolysis operation on this contract, excluding any time
accumulated during the special high-pressure electrolysis evaluation.
Figure 4 shows the performance of the initial small SPE laboratory cells (No.
7, 10, 11 and 13) with life and at several current densities.
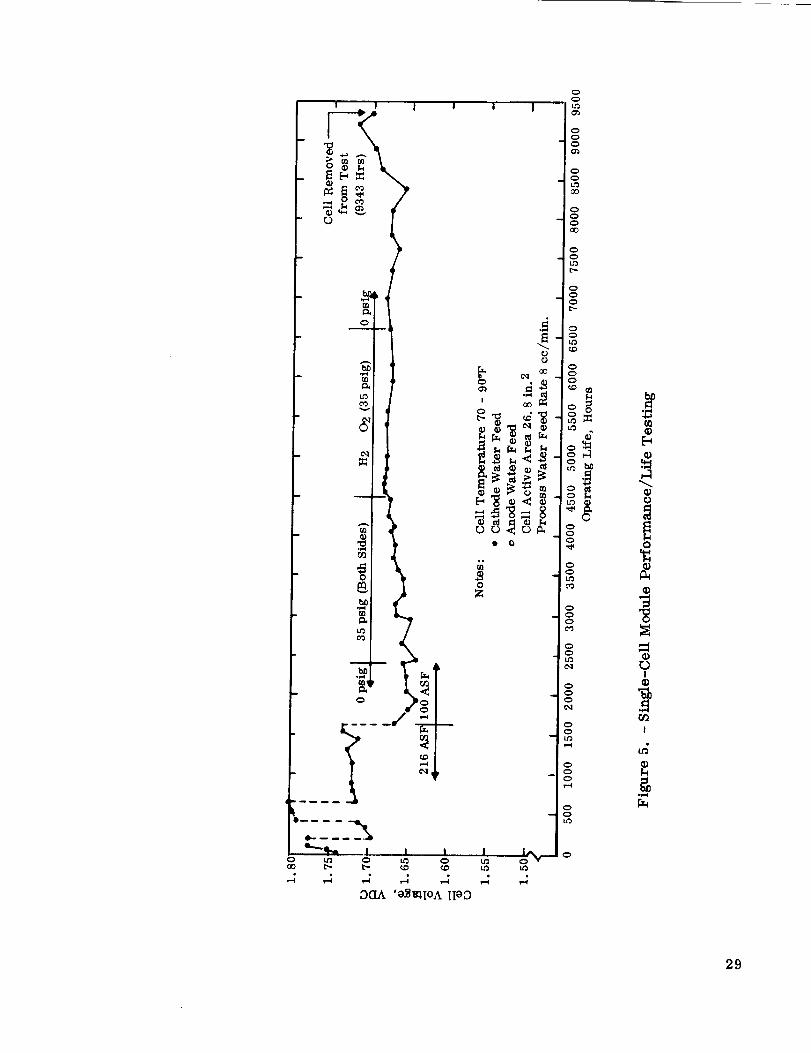
Figures 5 and 6 are chronological performance plots of a full-size single-cell
assembly and seven-cell module under various conditions of pressure, temperature,
process water feed site, current density, etc.
5

Table HI indicates that the unit which was operated for the longest time was
the seven-cell module. All units completed their objectives successfully except the
breadboard systems test four-cell module (S/N 1D) which failed due to rubber gasket
relaxation during continued high temperature operation. This failure is covered in
detail in section 3.1.2.
Except for the number of cells, the four-cell module and the seven-cell module
were identical. The seven-cell module "A" is shown in Figure 7. The single-cell
module was the first larger size unit and except for size, was similar in configuration
to the four- and seven-cell modules•
As shown in Figure 7, the module design consists of a sandwich of SPE mem-
brane and electrode assemblies sealed by rubber gaskets to ambient and stacked to-
gether by tie-bolts between aluminum end plates. Belleville washers on each tie-bolt
pre-load the rubber in compression to compensate for life-gasket relaxation. Table IV
shows the typical tie-bolt torque variation, or conversely rubber gasket relaxation,
recorded during the life of the seven-cell module. Figure 8 shows the tie-bolt position
location. This unit's more than 11,000 hours of operation were accumulated at rela-
tively low temperature (below 100_F), whereas the four-cell module (S/N 1D) which
failed, was operated at a maximum temperature of 190°F.
The structural integrity of the solid polymer electrolyte is demonstrated by the
following table of cross-membrane leakage data recorded on the seven-cell Module "A"
at two points in time. Nitrogen was delivered to the H2 cathode side under pressure
and with the O2 anode side at approximately ambient pressure:
Date
Cumulative Gas H 2 Side Leakage, cc/hrGeneration Time, Pressure, Allowable
hr psig Measured (max.)
9/1/71 8,463 40.0 41.5 10 cc/hr-cell
or
4/27/72 11,062 50.0 57.5 70 cc/hr total
Tabulated below are single-cell impedance checks taken on the seven-cell
module at two points in time which illustrate the stability of the SPE with life:
Date Life, hrs
Impedance, ohmCells
1 2 3 4 5 6 7
8/16/71 8,313 • 0024 .0024 .0025 .0025 .0021 .0022 .0023
4/27/72 11,062 •0025 .0028 .0027 .0029 .0022 .0025 .0025

The purity levels of the generated gases from the electrolysis module were
checked for compliance against Table I requirements. Typical samples extracted
through a "DRIERITE" crystal chamber from the seven-cell Module "A" are as follows:
Oxygen Sample
Constituent
500 Hour Life Point
8/12/70, ppm by Vol.
Unless DesignatedOther:ccise
10628 Hour Life Point
12/2/71, ppm by Vol.
Unless Designated
Otherwise
Limits, ppm by Vol.
Unless Designated
Otherwise
02 (99.724%) (_>99.764%) (99.7% min. )
N2 2,370 1,253
CO2 310 1,032
Argon < 25
H 2 80 < 50 1,000 max.
Hydrogen Sampl e
H2 ( 99. 734%) (99.3% min.)
N2 2,028
CO2 191
Argon <25
02 30 2,000 max.
HD (heavy 391
hydrogen)
* Sample removed during the separate 8313 hour 7-cell module S/N "A" testing
(see Table HI).
** Sample removed during the 2775 hour breadboard system testing with 7-cell
module S/N "A" (see Table III).
*** Extracted from Table I.
It is most probable that the N 2 and argon constituents are leakages into the
electrolysis system from the air and show up in the sampling equipment during the gas
sample extraction. The CO2 constituent may arise from a combination of:
- air leakage into the electrolysis system,
7

the soluble gas in the process make-up water which comes out of
solution and permeates the SPE membrane from the cathode hydrogenside to the oxygen anode side,
- minute degradation of the S PE membrane as a byproduct.
A water constituent (2110 ppm) although found in the sample after drying is
deleted from the O2 table since it is not considered an impurity.
The H2 constituent in the O2 sample is most probably the result of unreacted
hydrogen at the oxygen electrode which probably permeated through the module elec-
trolysis SPE membrane (i. e., from the cathode (hydrogen) side to the (oxygen) anodeside).
The 02 content in the H2 sample is most probably the result of unreacted oxy-
gen at the hydrogen electrode which originally permeated through the module electroly-
sis SPE membrane (i. e., from the oxygen anode side to the cathode hydrogen side).
The presence of HD, "heavy" hydrogen gas (the hydrogen isotope deuterium) is
expected when water is electrolyzed, since ordinary water contains approximately onedeuterium atom for every 6999 hydrogen atoms. The higher thannormal concentration
of deuterium evident in the cathode water is probably "normal" in this system.
Figures 9 - 11 show the results obtained during the high-pressure electrolysis
evaluation phase of the program. For this invesUgation, a small SPE single-cell
assembly (7.2 in. 2 cell area) was gasketed in a fixture and tested up to 180°F tempera-
ture and 1500 psig pressure. Higher test pressures could not be experienced due to
test fixture leakage limitations. Figures 9 and 10 demonstrate the effect on perfor-
mance of the SPE with pressure and temperature utilizing a 20 rail thick SPE which was
selected to reduce the gas permeability effects on cell operation. This increased
thickness reduces cell performance as illustrated by Figure 11 which compares 10 and
20 rail thick SPETs at various operating temperatures at constant current density (100ASF). Due to the increased thickness of the membrane, the performance of the cell at
greater than 100 ASF current density was unstable in the cathode feed mode. Opera-
tion of the unit in the anode feed mode showed stable operation over the complete testrange of 0 to 300 ASF.
3.1.2 One-man rated breadboard systems testing. - This contract requiredthat systems testing be accomplished on a laboratory breadboard basis to demonstrate
compatibility and endurance capability of a four-cell SPE electrolysis module and a two-
phase breadboard model separator which are the two major or critical items of the
WES. A four-cell module (S/N 1D) was designed and fabricated along with the b_ead-
board separator. These items along with a regenerative heat exchanger manufactured
by Parker-Hannifin Co., Model No. 3101-6, 4-8-6X316SST, were installed into a lab-
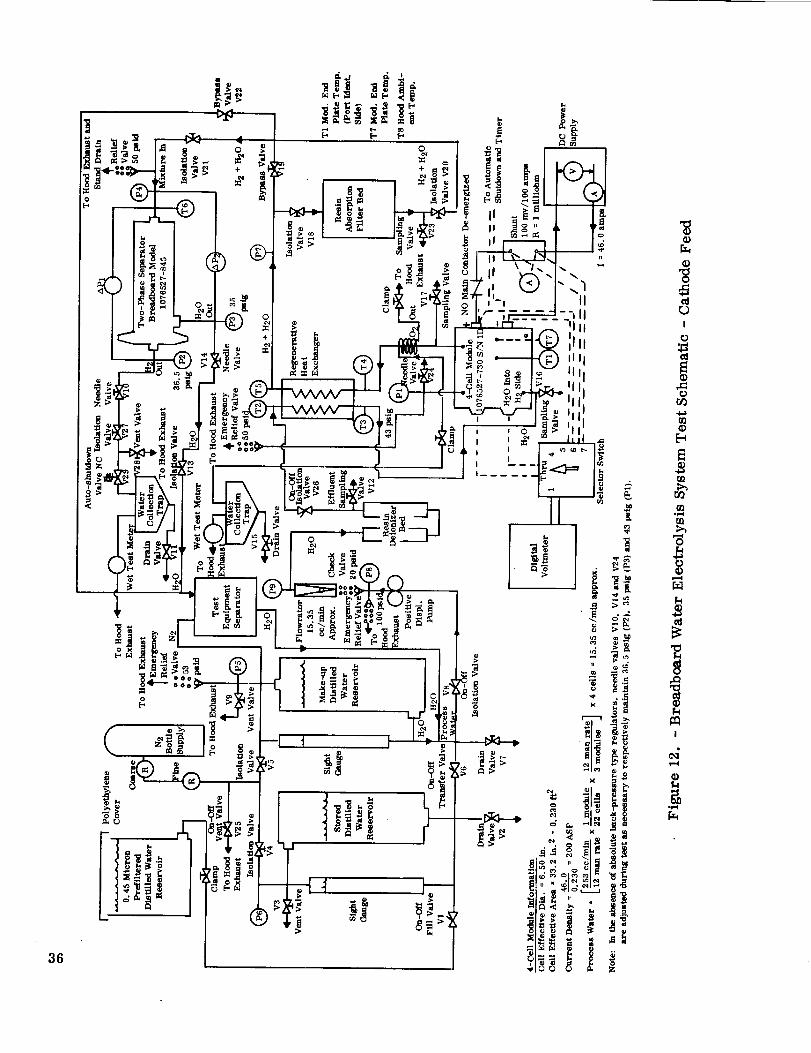
oratory breadboard facility as shown in Figures 12 - 14. Testing was initiated on
8

April 13, 1971, and continued with minimal attendance and monitoring for 1682 hours.
Typical performance is shown by the chronological voltage plot of Figure 15. Polari-zation data at 22, 26 and 526 hours are shown in Figure 16. Table V lists module data
taken at 1147 hours cumulative gas generation time.
On 6/21/71, after 1682 hours of operation, the test was terminated due to a
failure of the four-cell module caused by rubber gasket relaxation with subsequent
overboard leakage and internal mixing of gases (O2 and H2) in the module manifold.
The system had operated trouble-free until this point in the continuous life test. Per-
formance of all cells had been normal and all other system components had performed
at design levels. It was noted, however, that the hydrogen and oxygen outputs had
decreased by 3.56% from approximately the 900-life hour point. This was withininstrumentation error, and was not considered sufficient change to shutdown the test
at that time.
An immediate investigation of the failure was undertaken to establish the cause
and necessary corrective action. Details of the investigation are as follows.
Module failure analysis.- At 0902 hours on 6/21/71, a routine check of the sys-
tem was made, indicating operation to be normal. At that time a set of performance,
pressure and temperature readings was taken. The water tank was refilled due to elec-
trolysis consumption, system operation was resumed and determined to be normal for
approximately two hours. The system was then left unattended to continue the life test.
At 1400 hours (6/21/72), an abnormally high pressure differential was noted across the
phase separator. This had resulted in some gas breakthrough to the water side.
Attempts to reduce the differential were unsuccessful, and it was found that pressure
stabilization was not possible. Test conditions were immediately recorded and are
listed below along with the previous readings:
Voltage, VDCTime Cell 1 Cell 2 Cell 3 Cell 4
0902 1.615 1. 624 1.614 1.620
1413 1. 606 1. 614 1. 603 1. 610
Pressures,
psi_
H2 ____02
38 48
Unstable
_Temperature, OF
Avg H2Out H20 InStack Stack Stack
183 186 -168.5
190 194 182.5
Stack gas pressures were subsequently checked and found to be equalized, indi-
cating either internal or external stack leakage. The unit was then shutdown for further
investigation.

A module cross-membrane check was made by circulating water through the H2
side at approximately 38 psig while observing the O2 outlet for water accumulation. In
a short interval, water flow was evident at the oxygen discharge port, which established
that an internal leakage failure had occurred. Further verification of this leakage was
made by supplying nitrogen to the dead-ended H2 side and observing flow from the oxy-
gen outlet. Nitrogen pressure of 40 psig supplied to the H2 and O2 sides of the module
with the module submerged in distilled water demonstrated that overboard (external)
leakage was occurring in the region of the "O 2 out manifold", "H2 out manifold" and"H20-in to O2 side manifold".
Upon removal of the module from the test stand, it was found that the torque
levels of the stack tie-rods had decreased by 10 to 15 lb-in. This resulted in torque
values of 0 to 3 lb-in, on the external manifold tie-rods (originally 10 lb-in. ) and 10 to
12 Ib-in. on other perimeter tie-rods (originally 25 lb-in. ). In addition, the distance
between end plates had decreased by 0. 010 in. from initial assembly. The module was
retorqued to its original value, resulting in a further decrease in the distance between
end plates of 0.020 in. Retorquing eliminated the external leakage; however, internalleakage was still apparent.
Module teardown observations. -- The module was then disassembled and the
following observations made.
1) Gasket thickness was 0. 023 in. at the manifold and 0.025 in. around the
perimeter vs. an original thickness of 0. 026 to 0.027 in.
2) Cells visually appeared unchanged from their original state, except in the
border areas where they had adhered to the gasket and torn slightly during disassembly.
3) Leak checks of the individual cells showed cells 1 and 3 to have leakage areas
at 5 psi, whereas cells 2 and 4 evidenced no leakage. Cell 1 showed leakage at the
water-in port and cell 3 showed leakage near the hydrogen-out port.
4) Cells 1 and 3 were stripped of catalyst in aqua regia for microscopic exami-
nation. Visual and microscopic inspection showed many small pinholes in cell 3 about
1 in. in from the hydrogen-out port. These were apparently caused by excessive heat
in the hydrogen compartment. Cell 1 had one hole at the water-in port atthe very edge
of the active area. This may have been a result of removing the adhered gasket which
was strongly bonded to the cell in that area.
5) Also observed but apparently unrelated to the failure were slight evidences of
membrane delamination under the screen protector ring on the hydrogen side of the celland outside of the active area.
6) Wrinkling of the membrane was also noticeable in the gasket areas opposite
the water and gas tubes.
10

7) Loose cell voltage test lead between cell 2 and 3.
8) Reddish-brown corrosion residue deposits at all end plate ports but heavy at
stagnant "H20-in to 0 2 side port".
9) Whitish discoloration of the gasket on three of the four manifold lobes (absent
from the stagnant lobe) and only on the side facing the membrane.
Failure analysis conclusions. - As this was the first module of this design tobe disassembled (a 7-ce11/8313 hr at 80 - 100°F module, a 4-ce11/6072 hr at 80 - 170°F
module and a single-cell/9344 hr at 80°F module have been operated without failure), itis difficult to determine the significance of all of the above observations. The remain-
ing units were subsequently checked. The four--cell module showed only a 5 lb-in, de-
crease in torque. It is obvious that the sustained operation at 180°F on the breadboard
module caused a relaxation of the silicone rubber gasket material beyond the ability of
the Belleville washers to compensate particularly in the manifold lobe area. This
would permit hydrogen and oxygen to leak externally, and also permit the higher pres-
sure oxygen to leak into the hydrogen side manifold and then into the hydrogen compart-
ments. The oxygen entering the cell would cause burning in the manner observed on
cell 3, ultimately resulting in the holes observed in the membrane.
The delamination of the membrane under the screen protector ring was due to
the inability of water to reach the catalyst under the ring. Thus, as catalyst was pre-
sent, gases could be evolved but water could not readily replenish itself. This resulted
in drying and the observed delamination. This condition has been shown to be readily
corrected by removal of the catalyst under the protector ring.
The membrane wrinkling under the water and gas manifold _bes is no doubt
caused by non-uniform pressure distribution in this area. This is due to the fact that
the two or three tubes (depending on which manifold) are molded into the gasket, and the
rubber between and on either side relaxes while the tubes do not; thus, tending to wrinkle
the membrane in that area. This is readily corrected by replacing the inlet tubes with
multi-layered screen sandwiched between two flat metal sheets.
The loose cell voltage lead accounts for occasional erratic cell voltage readout
(cells 2 and 3) experienced during the test.
The reddish-brown corrosion residue was analyzed and found to be iron, Pre-
sumably the iron accumulation was released by the deterioration of the 316 SST heat
exchanger which is adjacent and upstream of the module. This amount of iron did not
contribute to any noticeable cell performance degradation during the 1682 hours of
operation. Cell electrode contamination was not enough to cause detectable performance
change.
11

Failure analysis corrective actions. -- The following corrective actions wereinitiated.
1) Modify the Belleville washer design to allow for a larger degree of gasketrelaxation.
2) Investigate alternate gasket materials which exhibit less relaxation at 170 -190°F.
3) Review applications for the implications of operating at a lower temperature
where successful long-term operation has been demonstrated until the above actions are
shown to be positive corrections of the problem.
4) Remove catalyst under the screen protector ring to prevent delamination ofthe membrane.
5) Replace the inlet tube configuration with a multilayer screen concept to pre-
vent membrane wrinkling.
6) Continue evaluation of present SE-4404 silicone compound material for
application as a gasket material for SPE designs.
3. 1.3 Four-man electrolysis module design. -- Failure analysis corrective
actions 1), 4) and 5) above were introduced into a redesigned module per Figure 17 (GE
dwg. 1076527-910Pl) to provide gas generation of a four-man rate (10 lb O2/day ).
Table VI lists the significant design data. Figure 18 shows the assembled unit.
Details of the improvements included in this 13-cell module design are asfollows.
1) Unfilled silicone rubber compound SE-4404 offers the lowest compression to
date of those elastomers meeting current requirements of module redesign. Compres-
sion set of the SE-4404 compound will be additionally lowered by using a "Varox" curing
agent and a longer high-temperature (480°F for 24 hours) post-oven cure, resulting in a
one-half reduction in the compression set value.
2) The 13-cell module is designed for a proof pressure of 126 psig (2 times
maximum operating pressure) and a burst pressure of 252 psig (4 times maximum opera-
ting pressure). High strength bolts of 17-4 PH stainless steel and nuts of A286 steel
alloy have been utilized for the tie rods. The module end plate thickness has also been
increased to accommodate the higher design pressure.
3) The terminal plates have been increased from . 020 to . 060 inch thick to de-
sign for the higher current rating of the module, in addition to increasing thickness of
the electrical input tab.
12
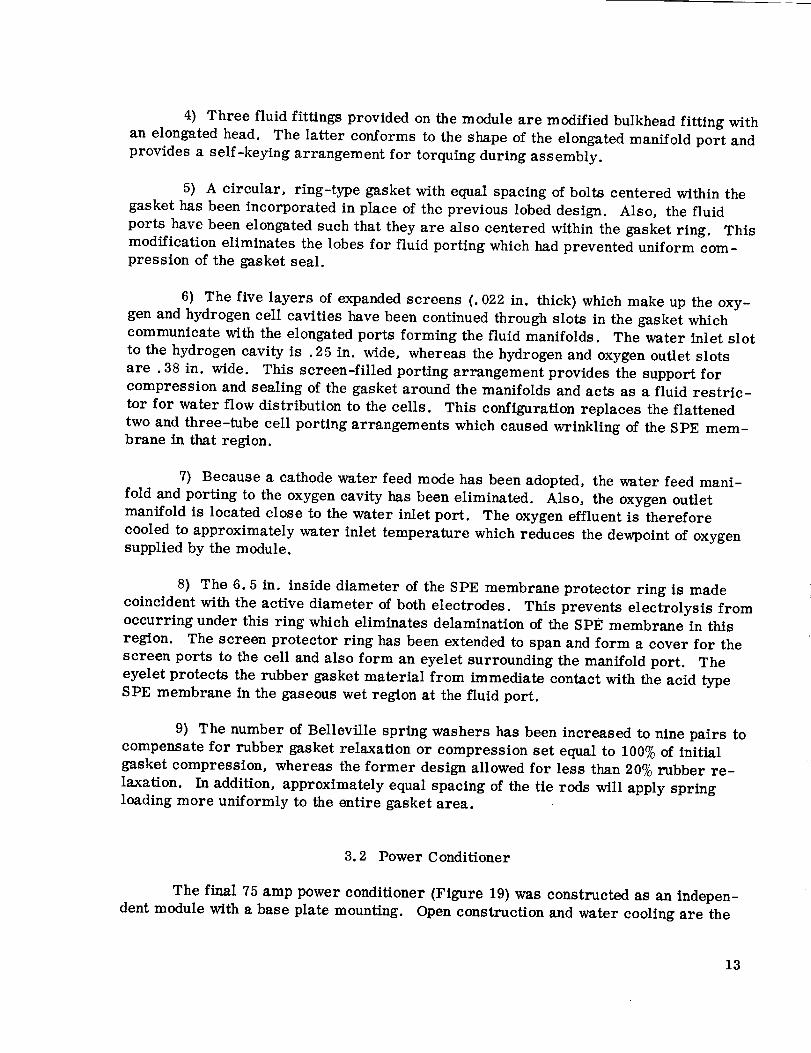
4) Three fluid fittings provided on the module are modified bulkhead fitting with
an elongated head. The latter conforms to the shape of the elongated manifold port and
provides a self-keying arrangement for torquing during assembly.
5) A circular, ring-type gasket with equal spacing of bolts centered within the
gasket has been incorporated in place of the previous lobed design. Also, the fluid
ports have been elongated such that they are also centered within the gasket ring. This
modification eliminates the lobes for fluid porting which had prevented uniform com-
pression of the gasket seal.
6) The five layers of expanded screens (. 022 in. thick) which make up the oxy-
gen and hydrogen cell cavities have been continued through slots in the gasket which
communicate with the elongated ports forming the fluid manifolds. The water inlet slot
to the hydrogen cavity is . 25 in. wide, whereas the hydrogen and oxygen outlet slots
are . 38 in. wide. This screen-filled porting arrangement provides the support for
compression and sealing of the gasket around the manifolds and acts as a fluid restric-
tor for water flow distribution to the cells. This configuration replaces the flattened
two and three-tube cell porting arrangements which caused wrinkling of the SPE mem-
brane in that region.
7) Because a cathode water feed mode has been adopted, the water feed mani-
fold and porting to the oxygen cavity has been eliminated. Also, the oxygen outlet
manifold is located close to the water inlet port. The oxygen effluent is therefore
cooled to approximately water inlet temperature which reduces the dewpotnt of oxygen
supplied by the module.
8) The 6.5 in. inside diameter of the SPE membrane protector ring is made
coincident with the active diameter of both electrodes. This prevents electrolysis from
occurring under this ring which eliminates delamination of the SPE membrane in this
region. The screen protector ring has been extended to span and form a cover for the
screen ports to the cell and also form an eyelet surrounding the manifold port. The
eyelet protects the rubber gasket material from immediate contact with the acid type
SPE membrane in the gaseous wet region at the fluid port.
9) The number of Belleville spring washers has been increased to nine pairs to
compensate for rubber gasket relaxation or compression set equal to 100% of initial
gasket compression, whereas the former design allowed for less than 20% rubber re-
laxation. In addition, approximately equal spacing of the tie rods will apply spring
loading more uniformly to the entire gasket area.
3.2 Power Conditioner
The final 75 amp power conditioner (Figure 19) was constructed as an indepen-
dent module with a base plate mounting. Open construction and water cooling are the
13
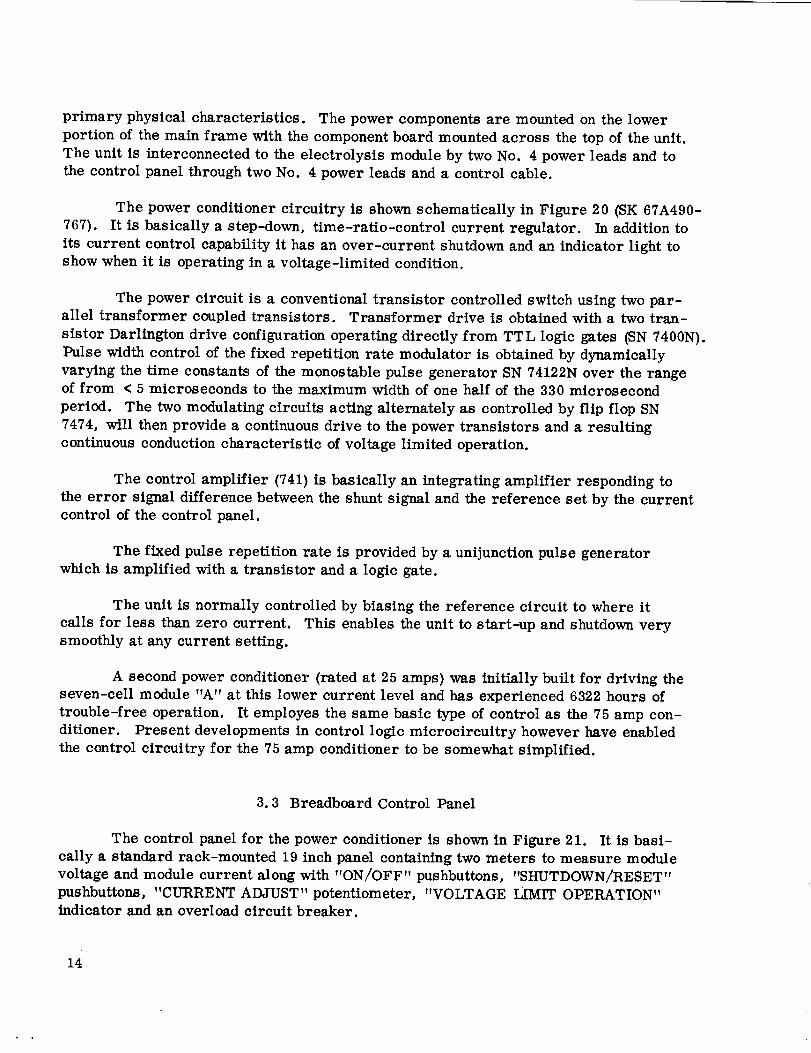
primary physical characteristics. The power components are mounted on the lower
portion of the main frame with the component board mounted across the top of the unit.
The unit is interconnected to the electrolysis module by two No. 4 power leads and to
the control panel through two No. 4 power leads and a control cable.
The power conditioner circuitry is shown schematically in Figure 20 (SK 67A490-
767). It is basically a step-down, time-ratio-control current regulator. In addition to
its current control capability it has an over-current shutdown and an indicator light toshow when it is operating in a voltage-limited condition.
The power circuit is a conventional transistor controlled switch using two par-allel transformer coupled transistors. Transformer drive is obtained with a two tran-
sistor Darlington drive configuration operating directly from TTL logic gates (SN 7400N).
Pulse width control of the fixed repetition rate modulator is obtained by dynamically
varying the time constants of the monostable pulse generator SN 74122N over the rangeof from < 5 microseconds to the maximum width of one half of the 330 microsecond
period. The two modulating circuits acting alternately as controlled by flip flop SN
7474, will then provide a continuous drive to the power transistors and a resulting
continuous conduction characteristic of voltage limited operation.
The control amplifier (741) is basically an integrating amplifier responding to
the error signal difference between the shunt signal and the reference set by the currentcontrol of the control panel.
The fixed pulse repetition rate is provided by a unijunction pulse generator
which is amplified with a transistor and a logic gate.
The unit is normally controlled by biasing the reference circuit to where it
calls for less than zero current. This enables the unit to start-up and shutdown verysmoothly at any current setting.
A second power conditioner (rated at 25 amps) was initially built for driving the
seven-cell module "A" at this lower current level and has experienced 6322 hours of
trouble-free operation. It employes the same basic type of control as the 75 amp con-
ditioner. Present developments in control logic microcircuitry however have enabled
the control circuitry for the 75 amp conditioner to be somewhat simplified.
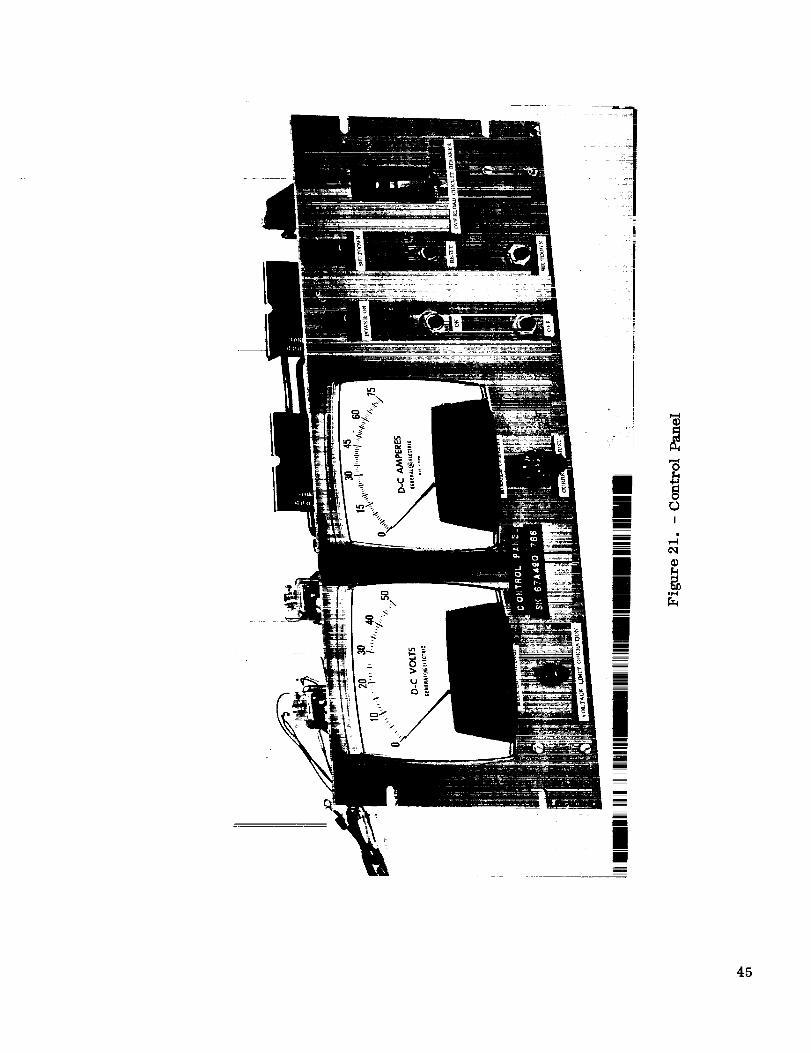
3.3 Breadboard Control Panel
The control panel for the power conditioner is shown in Figure 21. It is basi-
cally a standard rack-mounted 19 inch panel containing two meters to measure module
voltage and module current along with "ON/OFF" pushbuttons, "SHUTDOWN/RESET"
pushbuttons, "CURRENT ADJUST" potentiometer, "VOLTAGE LIMIT OPERATION"
indicator and an overload circuit breaker.
14

The control panel circuitry is shown in Figure 22 (SK 67A490-766). In addition
to the basic control components above, the control panel assembly contains the under-
voltage circuit which will shutdown the power conditioner when the input voltage is too
low for normal operation.
3.4 Two-Phase Separator
In the water electrolysis system (WES), process water for dissociation and heat
rejection is continuously circulated to the cathode (hydrogen) evolution side of the SPE
module, A mixture (hydrogen/water) exits therefore from the module, In space appli-
cations the conservation of water is a prerequisite for life support during extended
missions. Consequently, the separation and reuse of water becomes functionally im-
portant to the WES. Equally important for space life support criteria is the use of the
hydrogen product, when separated from the mixture, to produce more water (e. g., by
the reduction of CO2 in a catalytic reactor). The conversion of the hydrogen, however,
was not a requirement of this contract.
In a zero g space environment, two approaches can be employed for the separa-
tion of fluids in a two-phase mixture; either passively by hydrophilic and/or hydropho-
bic materials or dynamically by centrifugal force. The passive approach was investi-
gated for this contract.
Literature surveys were made on materials which under controlled differential
pressure will pass water but not gas (hydrophilic) and conversely will pass gas but not
water (hydrophobic). This search along with the results from tests made by the GE/
DECP laboratory throughout the program are listed in Tables VII and VIII. From ini-
tial tables of material data, porous glass tubes and porous polypropylene, respectively,
were selected as the hydrophilic and hydrophobic materials. Bench testing of samples
was initiated to demonstrate their functional capability on bubble point, flow permeabi-
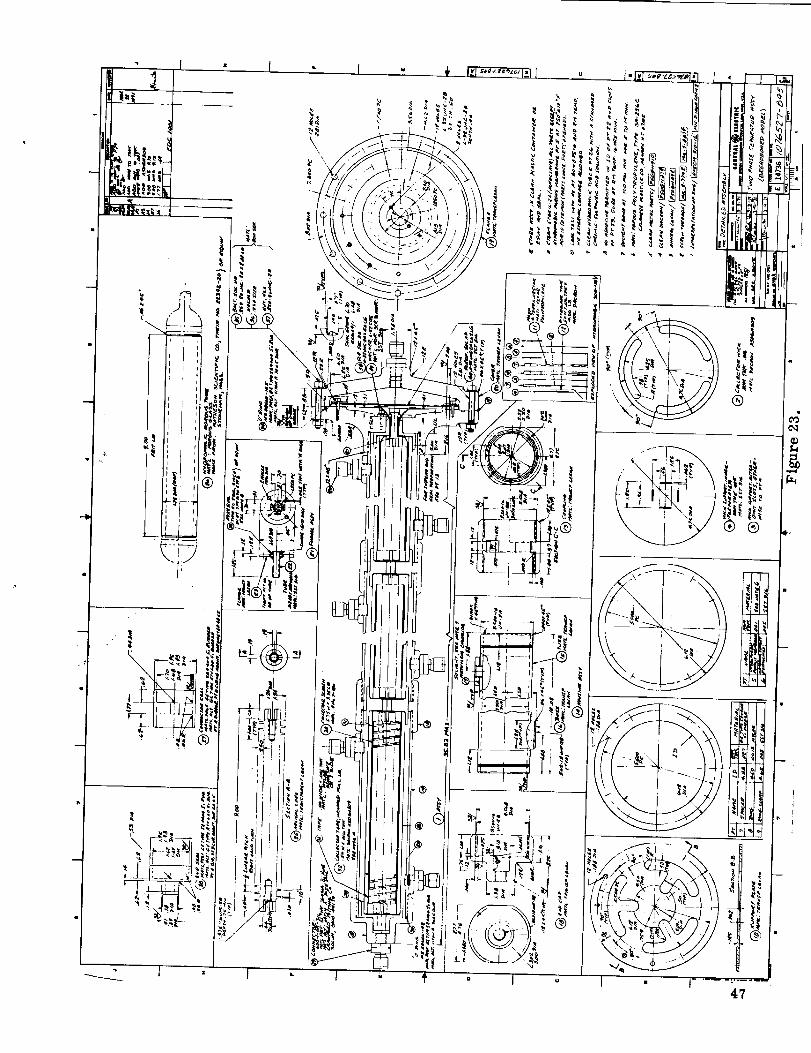
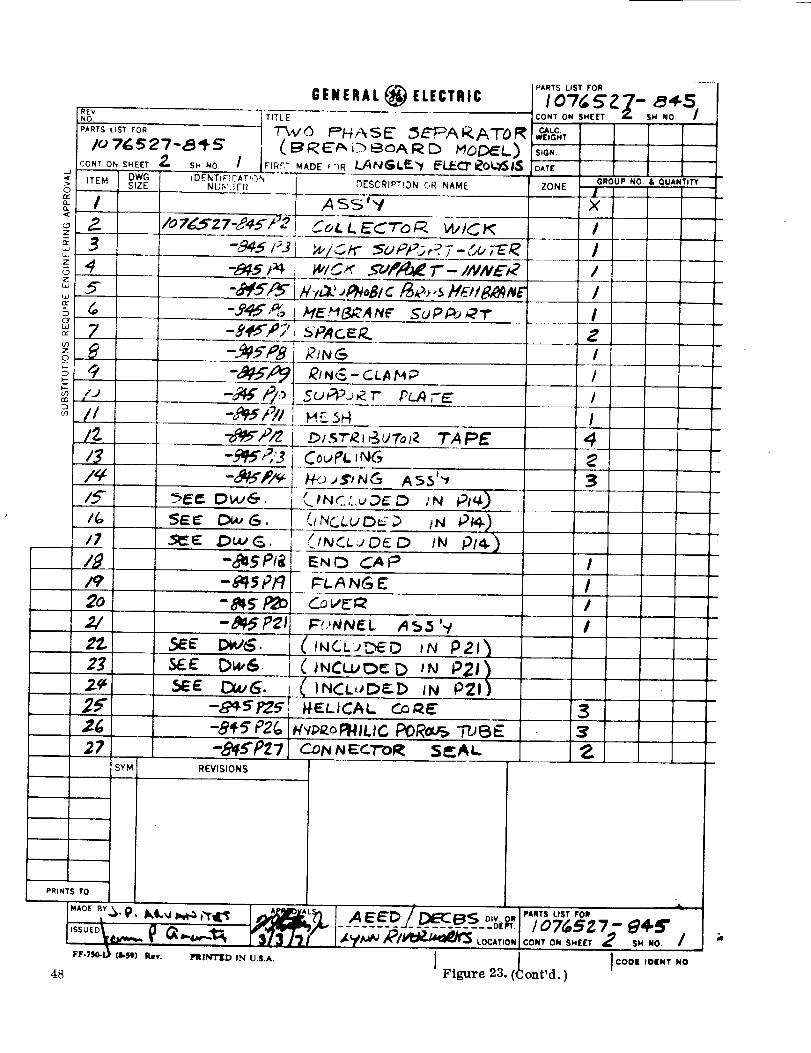
lity and filtration life. The encouraging results prompted the design of a laboratory
breadboard model separator employing both elements and capable of visual observation
(transparent Lexan plastic housing). Figure 23 (1076527-845Pl) provides the details of
this design. In this configuration, the mixture of H2/H20 enters the first of three
series-arranged porous tubes. The mixture traverses a helical path against the inner
surface of the tubes which causes the water content to centrifugally scrub the inner tube
wall at approximately gas velocity. With a controlled differential pressure below the
bubble point across the tube wall thickness and water-primed tube pores, the water
passes through the tube while the gas continues towards the helical exit. This model
included a single porous polypropylene hydrophobic subassembly. The model, after
fabrication, was installed in the breadboard systems test facility (Figures 12 - 14) and
thereupon accumulated 4458 hours of operation separating hydrogen and water within
the limitations of tube bubble points which were in series (inlet to outlet) 6.0, > 11.0
and 7.0 psid and at a one-man rate (equivalent oxygen generation). Figure 24 shows a
comparison of dry hydrogen and two-phase mixture vs. pressure drop of the two-phase
separator breadboard model (Figure 23).
15

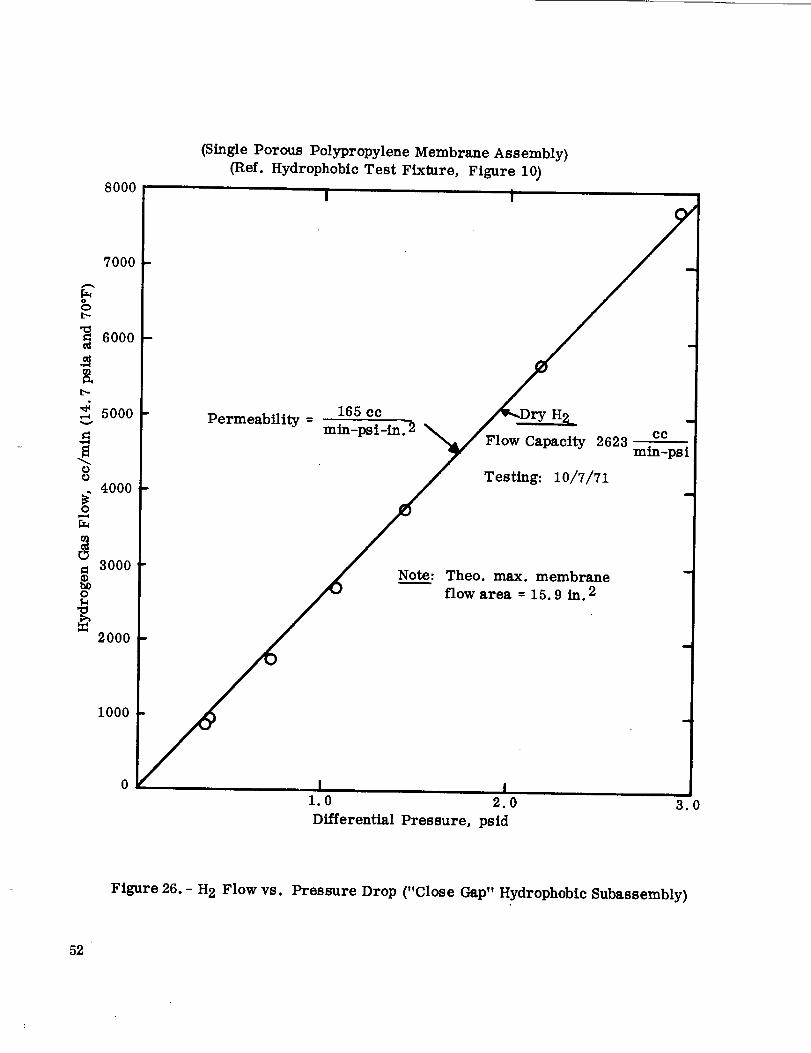
In the fall of 1971, direction was given to develop a four-man rate (equivalent
oxygen generation) prototype model separator employing the same nominal size hydro-
philic porous tubes (1 3/4 in. OD x 9 in. lg) and hydrophobic porous polypropylene mat-
erial. The major objective was to design a smaller package by improving the internal
functional configuration. Component bench tests were conducted to explore a "close-
gap" hydrophobic subassembly configuration (Figure 25) in an attempt to increase the
gas permeability beyond that of the breadboard model configuration. Figure 26 presents
the results of the evaluation. Comparing the permeability on dry hydrogen shown in
Figure 26 with Figure 24, an improvement factor of 1.93 results.
CC165
min. -psi-in. 2cc
85.5rain. -psi-in. Z
= 1.93
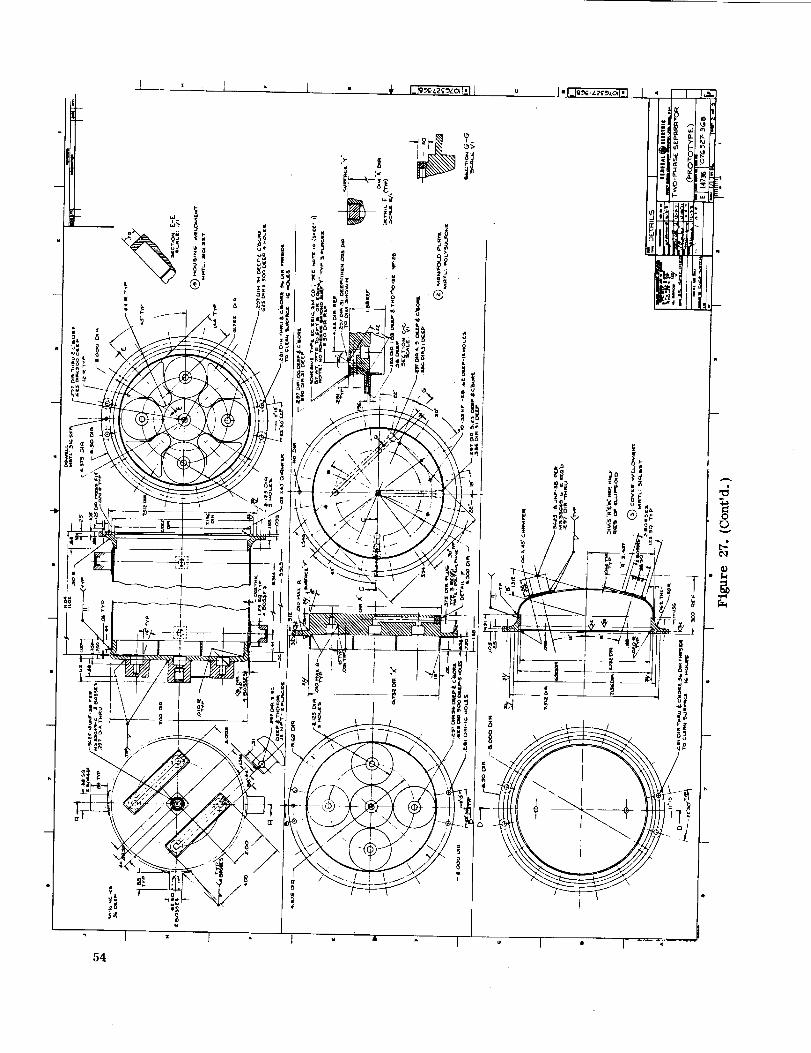
The "close-gap" design approach was therefore adopted for the prototype model
with three parallel membrane assemblies to provide the flow area for four-man rate
capability. In this same period, water permeability evaluation was also performed on
full size 1 3/4 in. OD x 9 in. lg porous tubes. The average results of four tubes sepa-
rately evaluated was a water permeability of 0.3 cc/min. -psi-in. 2. However, actual
component test results of the prototype model, Figures 27 (1076527-968Pl) and 28,
which contains five tubes in series, resulted in an average water permeability of 0. 195
cc/min. -psi-in. 2 under pressure conditions simulating WES operation. The difference
between the 0.3 and 0. 195 permeabilities is most probably due to gas blockage of pores.
This is demonstrated by Figures 29 and 30 in comparing "pressurized" with "unpres-
surized" data and also the effective area used for the permeability calculation.
3. 5 Deionizer Resin Bed
For prolonged water electrolysis system operation using a solid polymer elec-
trolyte module to generate oxygen and hydrogen, it is necessary to supply the module
with ionically-clean process water for the electrochemical dissociation reaction. This
is to prevent the exchange of dissolved water ions with the hydrogen ion of the SPE
membranes, which would result in higher cell resistance and subsequent increased
voltage at constant current. More input power would be required by the module to gen-
erate the same oxygen and hydrogen rate. Consequently, in all WES operation, a
deionizer was used to produce an acceptable ionic water level.
The deionizer configuration is a mixed monobed in volume proportions of cation
and anion resins to chemically exchange with any water ions, resulting in increased
water quality. Resins are supplied by Illinois Water Treatment Co., Rockford, Ill.,
per their specification Anion Exchange Resin IWT-A-204G and Cation Exchange Resin
ILLCO-C-211. Tables IX and X are summaries of these specifications.
16

The breadboard model design as shown in Figures 31 (GE dwg. 1076527-957Pl)
and 32 is capable of removing ionic dissolved solid species up to 100 ppm for 180 days
at a make-up water rate equivalent to a nominal six-man off-design condition of 75
amps electrolysis module input current.
Water flow vs. pressure drop testing was completed on the assembled unit with
results as shown in Figure 33.
3.6 Biological Filter Resin Bed
During bench life tests of scaled-down size hydrophilic porous tubes for develop-
ment of the two-phase separator, clogging of the tube pores was occasionally experi-
enced. These sample tubes were installed in the simple electrolysis test setups of the
single-cell module and four-cell module "B" with tube pressure drop vs. time being
monitored. Pore contamination by bacteria, mold, etc. was verified by extensive
water sample analysis. These test setups, although adequate for SPE module evalua-
tion, provided an environment for growth of microorganisms; namely temperature,
open reservoirs, plastic nutrients, etc. Consequently, the setups were uncontrolled
test vehicles for the porous tubes, whose pores of 2 to 3.5 microns became excellent
filters for the setup.
In an effort to increase tube life by reducing microorganism clogging, a biolo-
gical filter resin bed was installed in the test setup upstream of the tube. This was
proven to be successful in accelerated test setups. It is hypothesized that the biologi-
cal resin bed performs this filtering function most probably by three mechanisms:
1) Electrostatic attraction of microorganisms to the resin beads.
2) Particulate matter depth filtration through the lengthy resin bed column.
3) Retardation or actual destruction of bacteria and mold growth by thelocalized acidified water within the resin bed column.
The biological filter configuration is a mixed monobed in volume proportions of
cation and anion resins. Resins used are supplied by the Illinois Water Treatment Co.,
Rockford, Ill., per their specifications Anion Exchange Resin IWT-A-704A and Cation
Exchange Resin IWT-C-381. Tables XI and XII are summaries of these specifications.
A breadboard model design of a biological filter resin bed would be employed in
the WES immediately upstream of the separator. The unit is shown in Figures 34 (GE
dwg. 1076527-958P1) and 35.
This bed performs a dual function in that it will also ionically clean thecirculation water of the WES.
17

3.7 Regenerative Heat Exchanger
The water electrolysis system schematic (Figure 1) includes regenerative and
primary heat exchangers. The heat exchanger design is a tube within a tube shapedinto a coil.
The regenerative heat exchanger transfers heat picked-up by the hydrogen/
water mixture within the module to the relatively cool process water entering the tem-
perature regulating valve. Consequently, the module heat loss from the circulating
water is reduced and the module temperature is elevated and a steady temperature is
maintained resulting in less variation in module performance (voltage at constant cur-rent as a function of temperature).
A commercial heat exchanger (Model No. 3101-6 4-8-6x316 SST) was purchased
from the Parker-Hannffin Co., Cleveland, Ohio, to provide the regenerative function
during the breadboard systems testing. Figure 36 shows this heat exchanger which wasthermally insulated with a polyether urethane foam.
The primary heat exchanger function is to transfer the remaining heat picked-up by the two-phase hydrogen/water mixture to the interface coolant fluid available to the
WES. Thus, the H2/H20 mixture entering the two-phase separator will be at or near
cabin temperature. Water-masking of the hydrophobic subassemblies due to condensa-
tion of the saturated hydrogen is less likely in the close-gap, multiple porous polypro-pylene assemblies.
Laboratory coolers were improvised for the function of a primary heat exchanger.
It is expected that for flight hardware, the primary and regenerative heat ex-
changers would be designed and fabricated into a single assembly with considerableweight and volume savings.
A heat transfer study was made of a typical water electrolysis system as shown
in the schematic of Figure 37. A mathematical model for the system using primary and
regenerative heat exchangers was programmed on the GE Mark II Time Sharing Com-
puter System. Summaries of computer case studies and test facility coolant criteria
are given in Tables XIH and XIV, respectively. The Appendix includes the results of sixcase studies.
3.8 Water Temperature Regulating Valve
The water temperature regulating valve controls the process water temperature
entering the electrolysis module. This valve mixes the water heated by the regenera-
tive heat exchanger with a portion of the process water which bypasses the regenerative
18

heat exchanger to maintain essentially constant temperature leaving the valve. The
functional advantage of such a valve in the system is twofold: a wide range in coolant
temperature is permissible while maintaining a constant electrolysis module tempera-
ture; and a rapid rise in mean temperature of the electrolysis module is provided for
during start-up.
Table XV presents the GE/DECP valve procurement specification. The
Standard-Thomson Corp., Waltham, Mass., fabricated a valve (Model No. 8A767-Rev.
002) for breadboard WES operation. Figure 38 is a drawing of a typical valve. The
actual valve purchased is as shown in Figure 39. Valve function is performed by an
internal spool or actuator which contains a hermetically sealed eutectic wax. Expan-
sion and contraction of the wax due to temperature variations results in valve displace-
ment and subsequent proportioned mixing of "hot" and "cold" entering water.
3.9 Process Water Pump
Table XVI presents the process water pump procurement specification.
The pump (Model No. 02-70-316-731) which is similar to an "off-the-shelf"
item used as a galley pump in the Boeing 707 aircraft, was purchased from the Micro-
pump Corp., Concord, Calif. Figure 40 presents an abstract of data from the vendor's
pump data bulletin. Figure 41 shows the water pump, along with the water flow valve.
Figure 42 presents component test results. The performance characteristics
demonstrate that this magnetically-coupled gear pump has considerably more flow
capacity than required for four- or six-man WES operation. Consequently, as shown
by the WES fluid schematic (Figure 1), a bypass valve is required to deliver excessflow from the pump discharge to suction inlet. This technique was decided upon for
this particular pump after having experienced an internal relief valve spring failure.
During earlier component testing, excess flow would return to the suction side through
an internal pump relief valve. It is hypothesized that cyclic stressing of the spring
occurring with many starts and stops of the pump caused material fatigue with subse-
quent spring rupture. With a bypass around the pump, the relief valve operates only
in a redundant safety mode. According to the vendor, reduced capacity pumps could be
supplied after a design modification to the gears.
Also, during earlier component testing, magnetic uncoupling of the motor driver
magnet from the pump driven magnet was experienced. Pump teardown revealed rub
and wear marks on the driven "canned" magnet, with corresponding marks on the sur-
rounding seal cup. It was hypothesized that during pump operation when the driven
"canned" magnet rotor is revolving at approximately 12,000 rpm, a pressure difference
existed across the magnet to cause magnet shift on the rotor shaft resulting in facial
contact with the seal cup and subsequent uncoupling. Corrective action was to drill two
19
.055 in. diameter holes 180 ° apart in the hub of the magnet to permit pressure equali-
zation. No uncoupling failures of the pump have been experienced since introducingthis change.
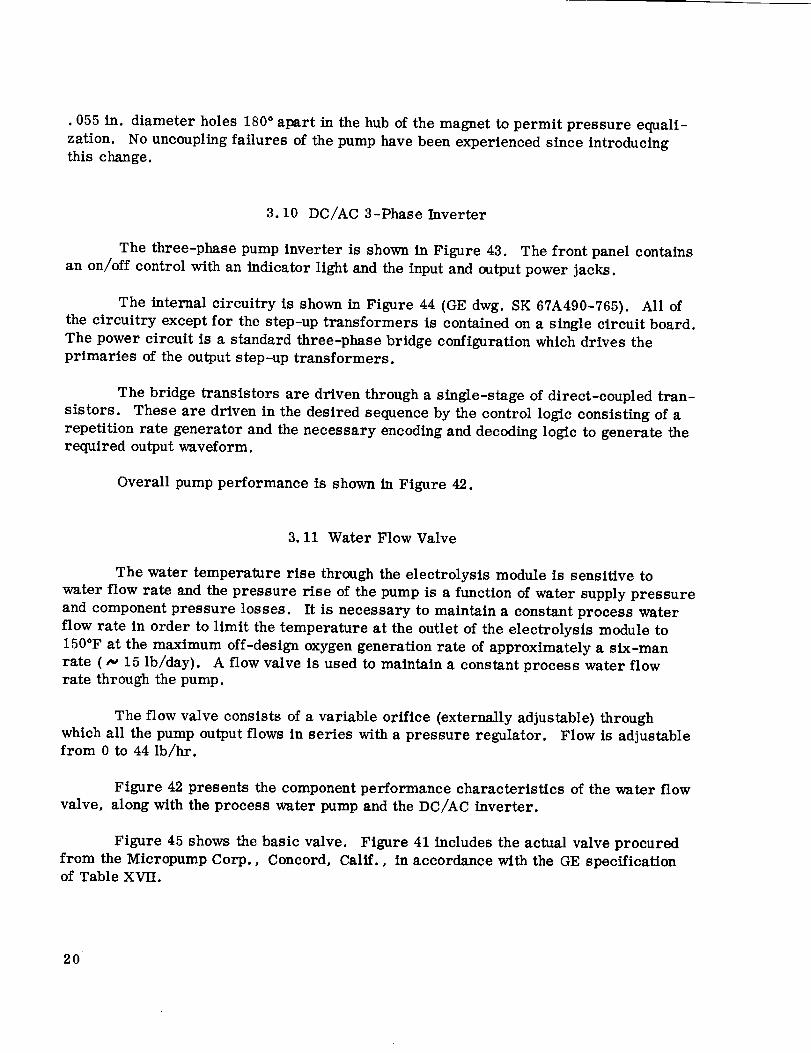
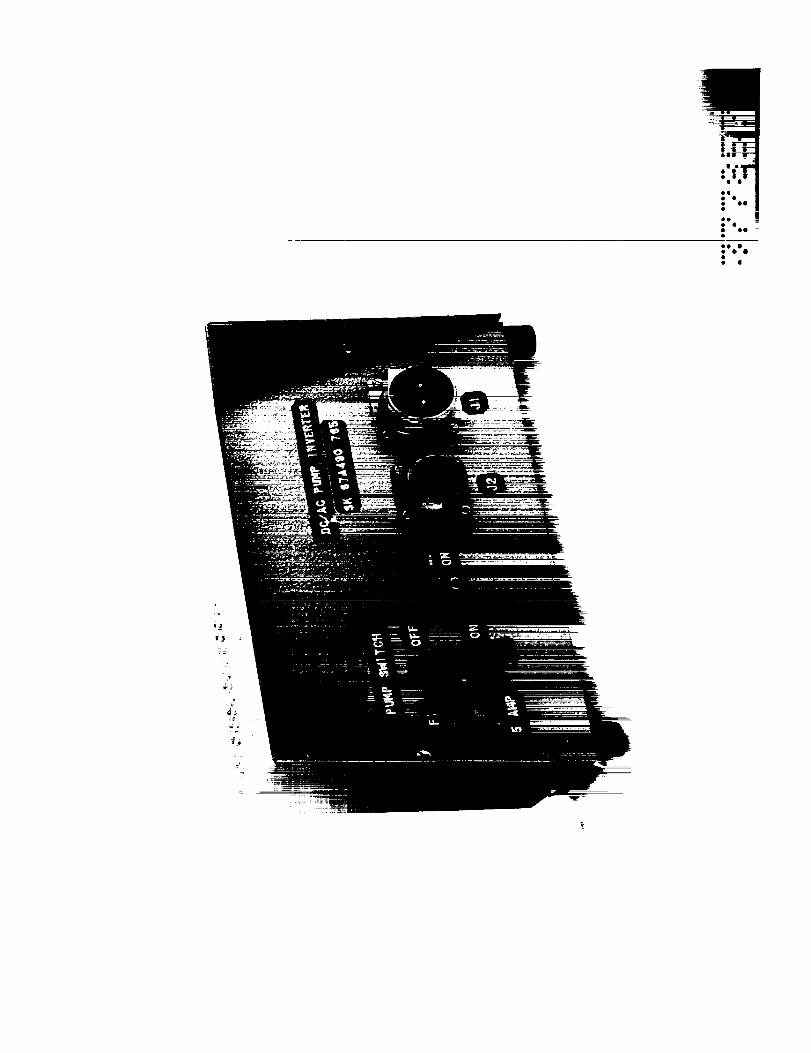
3.10 DC/AC 3-Phase Inverter
The three-phase pump inverter is shown in Figure 43. The front panel contains
an on/off control with an indicator light and the input and output power jacks.
The internal circuitry is shown in Figure 44 (GE dwg. SK 67A490-765). All of
the circuitry except for the step-up transformers is contained on a single circuit board.
The power circuit is a standard three-phase bridge configuration which drives the
primaries of the output step-up transformers,
The bridge transistors are driven through a single-stage of direct-coupled tran-
sistors. These are driven in the desired sequence by the control logic consisting of a
repetition rate generator and the necessary encoding and decoding logic to generate therequired output waveform.
Overall pump performance is shown in Figure 42.
3.11 Water Flow Valve
The water temperature rise through the electrolysis module is sensitive to
water flow rate and the pressure rise of the pump is a function of water supply pressure
and component pressure losses. It is necessary to maintain a constant process water
flow rate in order to limit the temperature at the outlet of the electrolysis module to
150°F at the maximum off-design oxygen generation rate of approximately a six-manrate ( N 15 lb/day). A flow valve is used to maintain a constant process water flowrate through the pump.
The flow valve consists of a variable orifice (externally adjustable} through
which all the pump output flows in series with a pressure regulator. Flow is adjustablefrom 0 to 44 lb/hr.
Figure 42 presents the component performance characteristics of the water flow
valve, along with the process water pump and the DC/AC inverter.
Figure 45 shows the basic valve. Figure 41 includes the actual valve procured
from the Micropump Corp., Concord, Calif., in accordance with the GE specificationof Table XVII.
20 ¸
3.12 Absolute Hydrogen Back-Pressure Regulator
As shown in the WES schematic (Figure 1), a "hydrogen-side" regulator is em-
ployed to establish a pressure level on the discharge side of the two-phase separator
and for system operation in conjunction with the process water pump pressure rise.
Table XVIII presents the GE specification to which the manufacturer, AUSCO,
Inc., Port Washington, N. Y., designed and fabricated a regulator. The delivered
regulator (Figure 46) was manufactured in accordance with the vendor drawing of
Figure 47.
The regulator is a soft-seated valve with biasing compression spring capable of
external adjustment and a sealed evacuated bellows to control the upstream pressure
{back-pressure).
Towards the latter portion of the program, the regulator was installed in the
test facility and breadboard system tests performed using seven-cell Module "A t' and
the nominal 25 amp power conditioner. Steady state operation (101 ASF current den-
sity), starts and stops were performed during which time the regulator performed very
satisfactorily.
3.13 Absolute Oxygen Back-Pressure Regulator
An absolute oxygen back-pressure regulator was designed and fabricated by
AUSCO, Inc., in accordance with the GE specification of Table XIX and Figure 47.
Figure 46 shows the actual regulator procured. The regulator is identical to the hydro-
gen type described in section 4.12 except for control point setting and performed equally
as well as the hydrogen regulator.
This regulator establishes a nominal 20 psi O2 side greater than H 2 side differ-
ential in the electrolysis module, without inter-reference of the two sides.
3.14 Differential Back-Pressure Regulator
The WES (Figure 1) includes a differential regulator to control the water outlet
pressure on the discharge side of the two-phase separator below a reference pressure
of the system. This pressure regulation controls the pressure difference across the
hydrophilic tubes of the two-phase separator. AUSCO, Inc., designed and fabricated a
differential regulator to perform this function in accordance with GE specification
(Table XX) and their drawing (Figure 48). The regulator is similar to the O 2 and H2
absolute types except the inboard side of the bellows is not evacuated but referenced as
explained above. Figure 46 shows the actual regulator as purchased. The system test
results on this regulator were very satisfactory. However, conclusion of the program
precluded extensive testing of this regulator.
21

SECTION4. CONCLUSIONS
1) The solid polymer electrolyte (SPE) electrolysis module demonstrated a cap-
ability for long life and invariant performance. Endurance testing under this program
included the following*:
• Four single laboratory cells: 9606, 9134, 8971 and 8265 hours,
respectively.
• Single-cell module: 9344 hours.
• Four-cell module: 6072 hours (including 3151 cycles of 60
minutes "on"/40 minutes "off" power).
• Seven-cell module: 11,088 hours•
• Four-cell module
breadboard system test: 1682 hours.
2) The present temperature limitation of breadboard electrolysis module opera-
tion is about +150°F. However, this limitation is expected to be raised ( ..> +180°F) in
the near future as improvements are realized in the temperature tolerance of resilient
gasket materials and the module mechanical design.
3) The SPE cell is capable of high-pressure application although testing was
limited to 1500 psig due to fixture leaks. It is anticipated that 3000 psig is feasible with
fixture improvements.
4) Long life operation (six months) at higher temperature is expected with resili-
ent material changes in the cell assembly of the electrolysis module.
5) Operational limits of the passive two-phase separator designed in the program
is largely determined by two factors:
a) Differential pressure across the hydrophilic tubes must be regulated
below the bubble point.
* NASA Langley Research Center tests of a four-cell module over a period of one year
verified performance characteristics obtained in this laboratory at ambient tempera-ture and 100 ASF.
22
b) Flooding of the hydrophobic membrane has not been fully evaluated.
Transients occurring during stop/starts are felt to be potential causeof such flooding.
6) The "cathode-feed" method of process water supply has the advantage of re-
quiring only one separator, but at the expense of slightly higher voltage at constantcurrent density.
7) The "anode-feed" method of process water supply has the advantage of lower
voltage at constant current density, but at the expense of requiring two separators.
23

SECTION 5. RECOMMENDATIONS
The successful development of water electrolysis system components under this
contract reached a point which warrants more extensive verificationand off-design
testing to demonstrate system compatibility. This follow-on work should include the
development of a full"membrane-type" hydrophilic/hydrophobic separator and an ad-
vanced technology module for higher current density and temperature operation which
promises significantweight and volume savings for space application.
It is therefore recommended that the following new program by considered:
1) Assemble into a laboratory system and test the breadboard components
developed under Contract NAS 1-9750 and including the procurement of a primary heat
exchanger, check valves, particulate filter and associated test equipment and instru-
mentation. This system would be used to explore continuous and cyclic (starts and
stops) operation up to and beyond the four-man rate design point, and also define com-
ponent limitations during system operation up to an off-design point of a six-man rate
(approximately 75 amps current demand).
2) Redesign, refurbish as necessary and package the components along with
controls, electronics and instrumentation into a frame with acceptance test WES opera-
tion at GE/DECP. This system would then be delivered to NASA or a designated test
contractor for extensive testing.
3) Develop materials suitable for use at higher temperatures, which would allow
an electrolysis module to operate at higher current density. This advanced module
along with ancillary components procured as necessary for higher temperature opera-
tion (e. g., temperature regulating valve, temperature sensors, etc. ) would be designed
to replace the respective components in the breadboard system test above. After de-
velopment and testing at GE/DECP, these items would be delivered to NASA or a
designated test contractor for further WES operation and evaluation.
4) Develop and fabricate a breadboard full "membrane-type" separator and/or
a dynamic centrifugal separator. After acceptance testing at GE/DECP, the separator
would be delivered to NASA or a designated test contractor for WES operation.
24

I!
0
25

H 2 + Saturated Water Vapor
@ Press. and Temp.
of Cathode Site
Cathode CatalystElectrode '_
Site
ElectrochemicalReaction A
4H + + 4e- --_ 2H 2 |
/
_"/O_ -_
Excess
+ Liquid
Water]
Ill
-A
_ Solid Polymer Electrolyte
(SPE)
+ SCr:::t e:ndaT et:: Vapf r @
Anode Site
Anode CatalystElectrode
4e-
Imm
Site
Electrochemical
Reaction
2H20-_4H + + 4e-+O 2
Figure 2. - SPE Electrolysis Cell Schematic
26

wml
Q_
Q_
0
r_
c_
T_
ol,.4
r_
27

IJ! • •
I
o

"8
P" I | i i IIIIII I I I I I
;z:t_
[.-,
E
0
0
m _
r_
mu "_
o o
D_A 'O_lOA IIOD
o
g
g
=
t'--
oc=,
t-,-
go.
gN_
,.-1
o
u_
Oo
t_
O
O
u_
o
O
3:
II1
O
O
r_I
O
r_
O
I
o_,,,!
28
i1)
ID
I1)
r.,)I
r_
I
_4
29

rD
I
o_,,I
3O
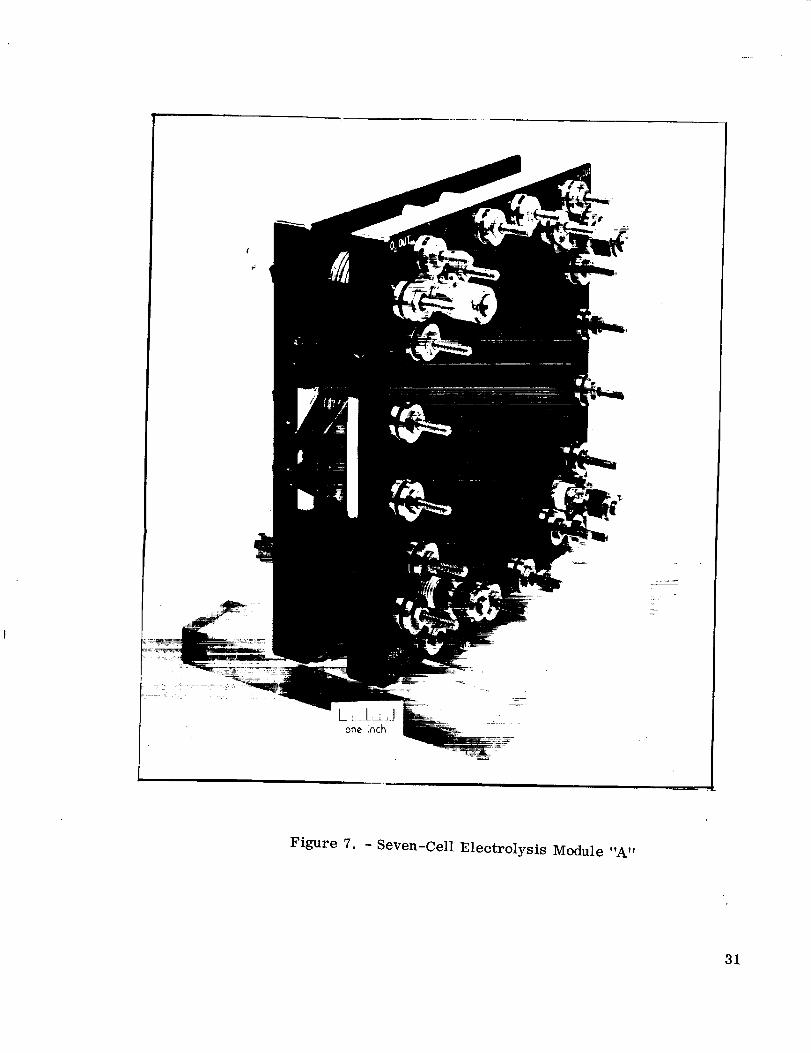
Figure 7. - Seven-Cell Electrolysis Module "A"
31
OF
"i"eeoo
:_:_:
i"_s

_c
32
k
,ill
40
_4
_mf0
E_
_)C.)I
C/2
P_

\
\
\
\
\
\
1 I I I
\
\
\
\\
\\
\
c_
ol-I
0
\\
¢:)L¢)
I--4
0
°_1
B
..,-i
I
33

34
\
I I
o
o
oo
m
o
i

LOCO O0
L_b'-
I I I I I I
o_)IOA IIOO
oo
oo
q_
o
0
E_
I
3S
86
• 0 !
C.
, _: _ _ I_ <-._I _1_ _
r_ _ _ II
I
t'I, I
I
I
_;_ ,Io
...'1'-, II
..... --_ II_111
"--- IIIiill IIII IIllihi:
, 11 1I I
' 0 II.I _ lill ._
/ IT_ E
II "
_g
...,2.
It ii
-T
r..)I
o
or_
I1)
r_
I11°_=.1
e_
glI
d
oP,I

c_
C_
E_
r_
!
c_
37

4
p_
,i_-___ :
_ -F 4_i"
r
._. _ I ;
@
k: "
o

0
v
0
r_
c_
I
I--4
38


43psig O2 Outand 40 psig H2 Out Discharge PressureModule Condition: Hot
Note: AET = Average Skin Temperature of Two End Plates
Ambient Hood Temperature Variation = 70 to 80°F
Module Thermally Insulated
Module Cathode Feed Water = 15.6 cc/min.
Module Current Density = 200 ASF
1.70
0
i. 60
1.50
L)
N 1.40
1.30
I i I
_ L_- L'-- L'-- _ L_ QO
II
(Test Ended6/21/71 Due to
Module Failure)1682 Hrs.
] I I500 1000 1500 2000
Cumulative Gas Generation Time, hr
Figure 15. -Four-Cell Module Voltage Plot
39

t_
_D
t-- r-_
! I¢D
o,1
m
tO
o_._ or.4_t2 m
0
u
I I I
O(IA 'e_IOA I_I_zoJ_ II_O el'_po_ "_AV
oLt_
0
0I
I
oe,,I
40

.k
Is
a_,ip
I
i
i
• l I °t_ I ° I • I ' "
tl
!
I-I
41

.............i......................j
Figure 18. - 13-Cei1 Electrolysis Module
42


Figure 19. - 75 Amp Power Conditioner
43


i
e_
r_
r_
o
i
or,_
44
|
n
|II
I
¢q
45

II_|

73NVd 70_IN00
Q-
_Z0O:OD
Z
8
m
I
0
p..
_0
o
o
or_
"6
rj
!
d
N
46
I
0Z
Z
Z
PRINTS TO
GENERAL _._ ELECTRIC
DESCRIPTION OR NAME
-_._ /;3j_____,/'r"_uP_;,,_..7 -_u ,-E_
.._e; bw,_.
,SEE
(tNCCuOcD _N P21
REVISIONS
PARTS LIST FOR'
1074 ffZCONT ON SHEET
CONT ON SHEET ICOOE IDENT NO.
48 '"'_ (*"}"" ,lwr,_,Nu.s.*. IFigure 23.(_ont'd.)
;l

PAI_S LIST FOR
GENEIIAL _ ELECTIIIC
0
n
PRINTS TO
IDENTIFICATION .
NUMBER
-9_YP_2
m
REVISIONS
........... -.... IoTtJZ'l R45.... - "" MN IVe2_oc, T,O,,CON,ON,.t_l_I/.,..o. ;_
,,.,o.: m.,,) ,... -,_,_,_ u.,.,. I I Ic°°''",N_"°
Figure 23.(Cont'd. ) 49

,.Q
I _ I I I
\
/i" i• i_ _
rj _;I
\.
\\
\
\\
\
I I I I I Ic.
(_Io0L pws _I_d _ "_,T) uTm/oo 't_oi_ _'j u_$ozp,_H
O
O
\
\\
\\
I
_V
1
C_
d
o_
Cq
I
Cq
5O

i
El'
m
l
o
l
A
t_4
L_.
,-4
O¢J
O
8000
7000
6000
5000
4000
3000
2000
1000
0
(Single Porous Polypropylene Membrane Assembly)
(Ref. Hydrophobic Test Fixture, Figure 10)
I ' I
Permeability =165 cc
Capacity 2623
Testing: 10/7/71
rain-psi
Note: Theo. max. membrane
flow area = 15.9 in. 2
I I1.0 2.0
Differential Pressure, psid
3.0
Figure 26. - H 2 Flow vs. Pressure Drop ("Close C_p" Hydrophobic Subassembly)
52

: I!
li!ll !
53
Ii
J o!
I " I..... <.....
r.)

® ®
- _L__I
T o T •
55
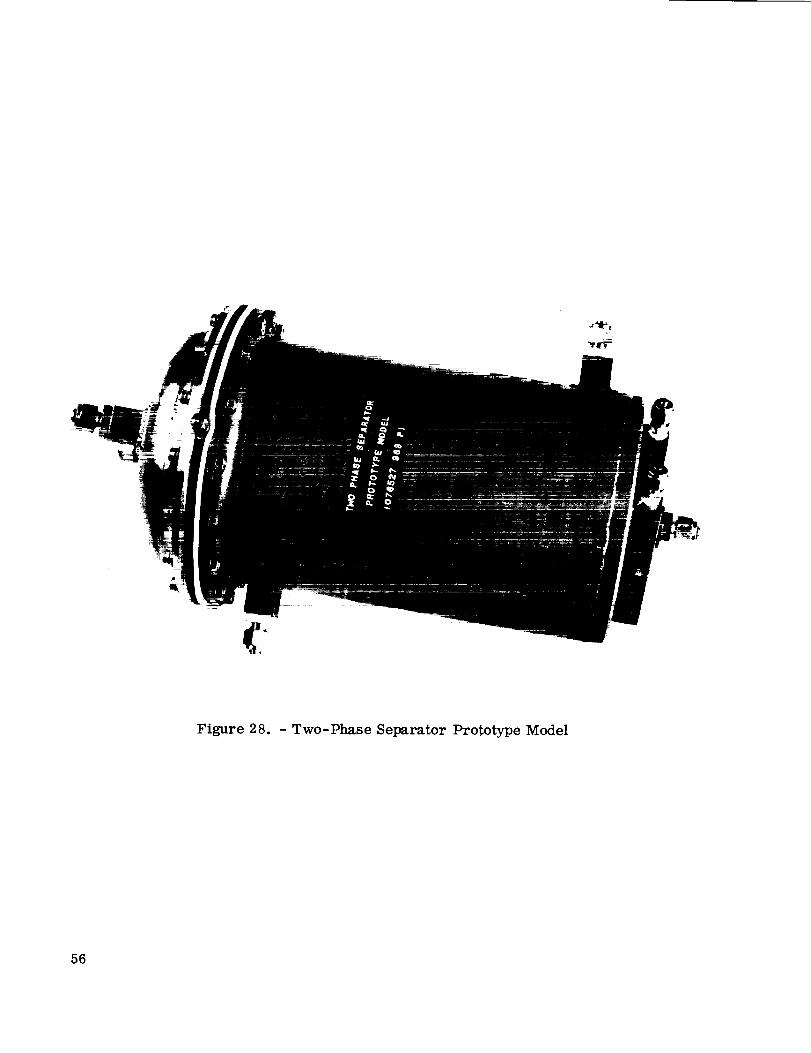
Figure 28. - Two-Phase Separator Prototype Model
56

O00Q
OU
ooo
• Iw
::Z
°o00
Iw
°Ooo
_°Q° o

\
I
\\
\
1
\
\
-- t"-
O1
UTm/Oo "_oI,E amsA_
ooc.o
IL'--
L_
L"-
0
0
C/]
I0
<1
_>
r--,4
F_
I
or,4
57

O
O
C,
O
OO
O O
OO
%O
IO_
I r ii |
'C_ C'
O..,
4_° _ ._ ._
•_ ." _ _
o_ _ _ °_p4 _- o
w oo
ted-_ "uT-uTm/Oo ",_TTTq'eom,z_cI ,,_OT,,:r-"__A_
[....
g_
g_
...l.a,
I
f_"<I
h.,
OO
_t.-.
!
gD
68

• i -@
N
,q

#z
Figure 32. - Deionizer Resin Bed
6O

l_°°i
"% |oll
oe
I°:°:
000
I.: :
Io,|,

500
4OO
o 3000
200
100 0
o i0 2 4
I I I I I I I i
0
Testing: 7/10/72 inHorizontal Attitude
Ionic Effectivity:Influent Water 350,000 ohm-cmEffluent Water 1.5 x 10+6 ohm-era
i I I I I I6 8 10 12 14 16
Differential Pressure, in. H20
18
Figure 33. - Deionizer Resin Bed (1076527-968P1) Water Flow vs. AP
61

tI
k
I-t
I62
0

Figure 35. - Biological Filter Resin Bed
63

:_rs
:.S|:'S'S
O0
! "..
emo0

Figure 36. - Regenerative Heat Exchanger with Thermal Insulation
64

\

I
_.,.e
r,.,i
'tJ
@-®
o -_ C _%o
I _/ 0 .,_ _ ,_ _ _ ,_
0 ['" _oo_ 0_,
dtttn_i - -0
o
o
I
t..:¢Q
]°.p,4
65

a I v ,. _ rT7-_'r
66

\
\
Figure 39. - Water Temperature Regulating Valve (As Procured)
67

,• g
_o
,.0"0
i'.gQ
| %*:%o: oII
.
•

Micropump Model 668D5 (Data abstracted from Micropump Corp. Bulletin No. 700)
Pump Specifications
303 or 316 Stainless Steel
Ceramic (Barium Ferrite)Delrin AF
Polypropylene
Nitrile (Others available)
Motor Specification
Seal-less, magnetically coupled
3-Phase, 400 Hz, 200 VAC
115 Volts, 400 Hz, 1-Phase Available
4 Leads Including Neutral
Thermal Protection Optional
Total Unit Weight 2.2 Pounds
_'_ T.84 -_
Figure 40. - Process Water Pump Vendor Data
S

|
i
Figure 41. - Water Flow Valve and Process Water Pump
69

_400
C,
:%
eo
..:1oO
:%ID
:..J

_0
II
DID
I
I
II
x_I
I
I
1
I
' o
I
!
i
I
I
C
D
I
o
cq
I
eq
i
.o
I
I
t_
!
C,
X
0,..._ I e,a
D_
0
"0
e_
°
E =
,r?
e_
r/1
o
r.,)
I11II1
0
I
7O
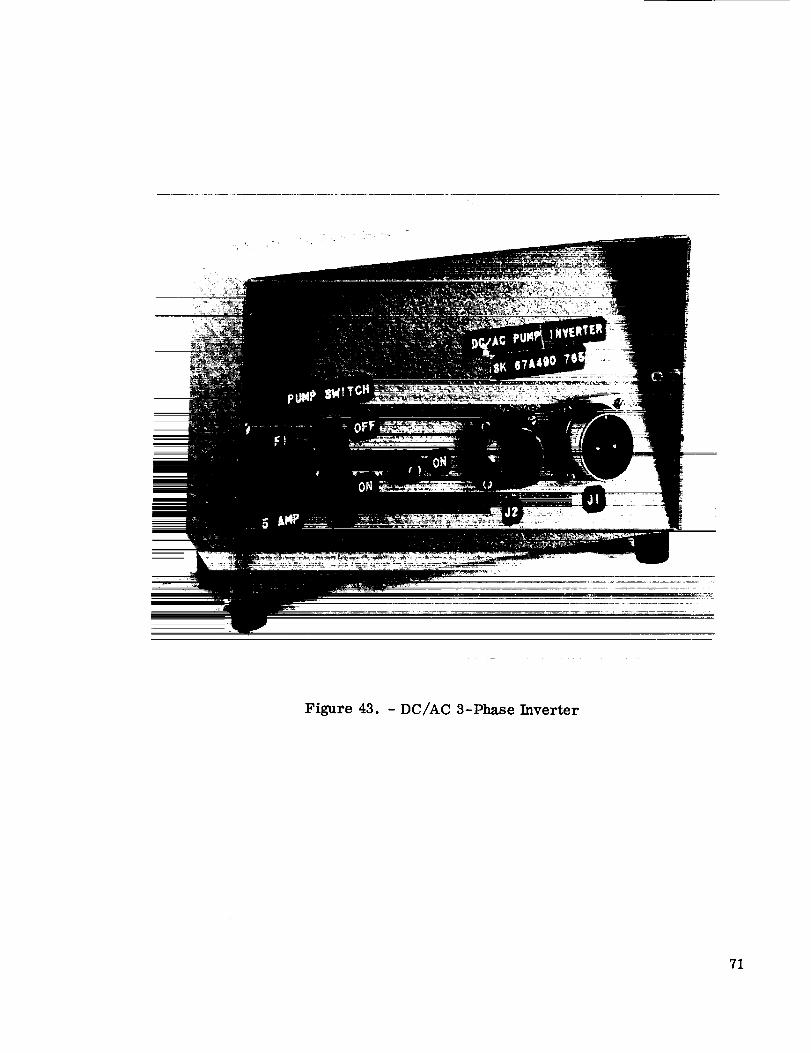
Figure 43. - DC/AC 3-Phase Inverter
71
6iVeO
_OO00
_eo _ I
oO •• at, 4

cj
-_ S.I_ z_T
c_
_zN
OD
I
i
t
_1 .,.I
Illlo
I
I
_F-4
?2

m
m D
0
)
,_-,.
k,,,
...j
,P,i
ii
L;
!kJ_
• ii
i
i
©
o [-'4
=k.3_
i li:
J
dI
It i
'-ri ,
=I
v
c
Z_PC3
i
C
i
73

q_
r_
74

_9
o
0r_
.<
.<
LO
,.o
c_
r--(
Z
0 0 00 ¢q
CO
_e O
eo •
S°II
Io
!'°:11
.i

co
" l}!i'i ,,,Jb
9, u ,,I I_
0 _ _.
d: _ J
_, • ,
2_ < ,j . 4
_,1 g _," }
0
i
rz
:_ I.,,.."v'
Z_ __
U1 ,_ .
_a,q
<
i i t I _
u i
1_-: " " !_ll--n-_:'1:1 _:: ¢
.f o _ _ I__
(U
r_
i
ii
i
P_°_,-I
?5

....... I I _- - I "'
G.E. ITEM 4
i. NAME Oo ABS. BACK-PRESSURE R. V.2. TEMP_" AMBIENT 40 TO ii0°I r.;
3. PRESSURES P--'_OF I_5 I_STG, NURST 252 PSIG.4. PERFORMANCE
TEMPERATURE I00 TO 170°F.
CRACK 61 _0--62 PSIAFULL F-'L-OW .154 TO 1.750 PPH AT 62 TO 63 PSIARESEAT "gD--PSIA MINIMUMDC_NS_M PRESSURE VARIATION 0 TO 57.0 PSIA
5. WEIGHT 1.25 POUNd9 _M_M
6. MARKI_ AUSC0, P320-51 S___._, PORTS
FLUID i00 TO 170OF.
G.E. ITEM 5
I. NAME__._H 2 ABS. BACK-PRESSURE R. V.2 TEMPERATUEE AMBIENT 40 TO IIOOF., FLUID 60 TO 80°F.
3. PRESSURES -'I_OOF 84 PSIG, BURST 168 PSIG.4. PERFORMANCe--
TEMPERATURE 60 TO 80°F.
CRACK 40 _0--41 PSIAFULL F--L-OW .0194 TO .22 PPH AT 41 TO 42 PSIARESEAT _9--PS IA MINIMUMDOWNST_---AM PRESSURE VARIA@ION 0 TO 25 PSIA
5. WEIGHT 1.25 POUNDg _AX_MUM
6. MARKIN______.AUSC@, P320-52, S/N_._, PORTS
MATIR IAL! .....
STOCK IIZIf
FINIEH:
DRAWN_
F. MARTINCHECKEDI
TOI._RANCfI
FRACTIO NI "P lie4
DICIMAUI I PL. + .O1
• pL_ "b .OO8
i
AI NOTED,
AUSCO, Inc.820 PORT WASHINGTON BLVD,
PORT WASHINGTON, N. Y. IlOSO
VALVE, RELIEF,ABS OLUTE PRESSURE
NOTlll I
I, REMOVE A ll IURRI,
I_ _i_ ALk MACHINED IURFACEI EXCEPT
iIGAL-E$
DATE:
Ii-9-71DW@, NO.
P320-50SHEET 2
RE¥.
A
76 Figure 47. - Continued

I °i
_)_I') -
I
o3CbC_
, .'M _1
I -) .3
o
o
4
77
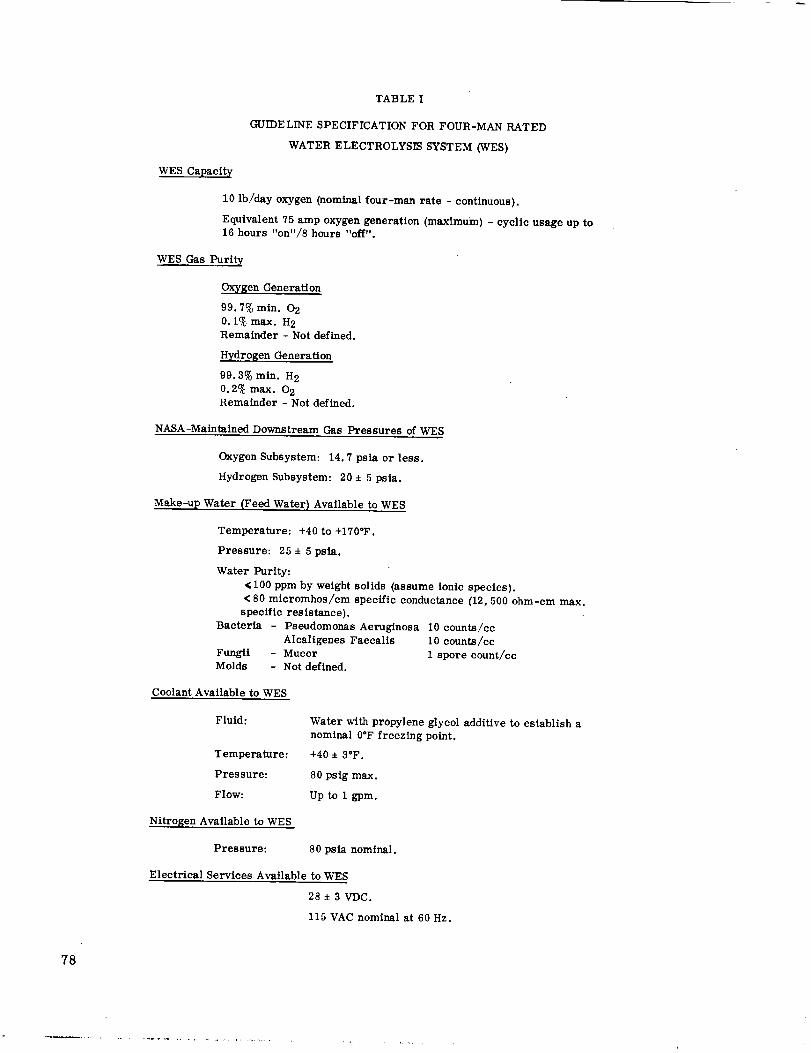
TABLE I
GUIDELINE SPECIFICATION FOR FOUR-MAN RATED
WATER ELECTROLYSIS SYSTEM (WES)
WES Capacity
10 lb/day oxygen (nominal four-man rate - continuous).
Equivalent 75 amp oxygen generation (maximum) - cyclic usage up to16 hours "on"/8 hours "off".
WES Gas Purity
Oxygen Generation
99.7% min. 02
0.1% max. H 2Remainder - Not defined.
Hydrogen Generation
99.3% rain. H 2
0.2% max. 02Remainder - Not defined.
NASA-Maintained Downstream Gas Pressures of WES
Oxygen Subsystem: 14.7 psia or less.
Hydrogen Subsystem: 20 * 5 psia.
Make-up Water (Feed Water.) Available to WES
Temperature: +40 to +170°F.
Pressure: 25 ± 5 psla.
Water Purity:• 100 ppm by weight solids (assume ionic species).
< 80 micromhos/cm specific conductance (12,500 ohm-cm max.
specific resistance).
Bacteria - Pseudomonas Aeruginosa 10 counts/ccAlcaligenes Faecalis 10 counts/cc
Fungti - Mucor 1 spore count/ccMolds - Not defined.
Coolant Available to WES
Fluid:
Temperature:
Pressure:
Flow:
Water with propylene glycol additive to establish a
nominal 0°F freezing point.
+40 + 3°F.
80 psig max.
Up to 1 gpm.
NitroGen Available to WES
Pressure: 80 psia nominal.
Electrical Services Available to WES
28 • 3 VDC.
115 VAC nominal at 60 Hz.
78

q_
"8
c_ o
L_- _ ao Lr_ _ _ i_4 _-i _._ _ a_ c_I t _-
_ i _ _ _i_ _ _
!I °
d
_o =I_
rD
0
o o _
79

TABLE HI
ELECTROLYSIS UNIT OPERATION HISTORY
Unit
Laboratory
Laboratory
Laboratory
Laboratory
Single-Cell
(26.8 in.2
Cell No. 7
Cell No. 10
Cell No. 11
Cell No. 13
Module
cell area)
Four-Cell Module "B"
(33.2 in. 2 cell area)
Seven-Cell Module "A"
(33.2 in. 2 cell area)
Four-Cell Module (S/N 1D)
(33.2 in. 2 cell area)
Operating Time,Hours
9606
9134
8971
8265
9344
6072 which includes 3151 cycles
of 60 minutes "on" power
and 40 minutes "off" power
8313.3 Component testing
+2775.4 System testing11088.7 Total
1682 One-man rated breadboard
system test
Comments
No failure
No failure
No failure
No failure
No failure
No failure
No failure
Rubber
gasketrelaxation
failure
caused cell
burn -out
Note: This table does not include the cumulative operating time during the
special high-pressure electrolysis evaluation under this contract nor
does it include the operating time performed on the delivered 4-cellModule "C".
8O

TABLE IV
SEVEN-CELL MODULE "A" TIE-BOLT TORQUE HISTORY
Cumulative
Gas Torque, Ib-in.
Generation Tie-Bolt Position
Date Time _rs)
8/16/71 8313
1 2 3 4 5 6 7 8 9 10 11 12 13 14 15 16
15 25 25 15 15 25 25 15 15 25 25 15 15 25 25 15
11/2/71 9913 13 17 20 15 15 23 22 12 14 23 22 20 (*)20 22 (*)
4/27/72 11062 10 12 17 9 8 15 12 8 10 16 13 7 8 15 ]5 11
(*) These two positions were inaccessible since the 11/2/71 check was made with
the module operating and installed in the breadboard systems test facility.
81

TABLE V
BREADBOARD4-CELL MODULE SYSTEMTEST MEASUREMENTS
MeasurementTAKEN AT 1147 HOURS
Cell 1
Cell 2
Cell 3
Cell 4
Total Term.
Total Sum. Cell
Total Shunt Current DC (200 ASF)
Power Supply
Power Supply Current DC
Module Input Power (Cal.)
2 ¢_Sep. Mix. - In to H z Out (AP1)
2 d Sep. Mix. - In to H20 Out (AP2)
Module 02 Out Press. ('P1)
Sep. H2 Out Press. (P2)
Sep. H20 Out Press. (P3)
Sep. Mix. - In Press. (P4)
Make-Up Water Reservoir Press. (Ps)
Stored Water Reservoir Press. (P6)
Reg. Heat Exch. Mix. - Out Press. (P7)
Pump Disch. Press. (Ps)
Deionizer Resin Bed Inlet Press. (P9)Deionizer Resin Bed Effluent Specific Resistance
Deionizer Resin Bed Effluent pH
Module Influent Specific Resistance
Module Influent pH
Module Effluent Specific Resistance
Module Effluent pH
Absorption Resin Bed Effluent Specific Resistance
Absorption Resin Bed Effluent pH
Water Collected Module 02 Out
Water Collected 2 d Sep. H2 OutProcess Water Flow
Hydrogen Flow (wet test meter at STP)
Oxygen Flow (wet test meter at STP)
Cumulative Gas Generation Time
Date of Test Events
A and N Time of Events
Comments
Typical Recorded Data
1.626 VDC
1.630 VDC
1.620 VDC
1.627 VDC
6.562 VDC
6.492 VDC
45.98 amps7.3 VDC
46.0 amps301.5 watts
3.5 psid
4.7 psid
45.0 psig
36.0 psig
35.0 psig
38.0 psig
33.0 pslg
0 psig
40.0 psig
56.5 psig
38.5 psig_i. 10 x 106 ohm-cm
5.67
not requii-ed
not required
not required
not required1.25 x 106 ohm-era
6.25
0.325 cc/min
None
15.8 ec/min
1355 cc/min
678 cc/min
1147.1 hr
6/1/71
0820
Gauge accuracy must
be considered.
82

TABLE V. - Continued
H20 Into
_r H2 Side
(Identification
Side)
H 2 Out
H20 Into
02 Side
Measurement
Module 0 2 Out (External Tubing)
"Heavy'_TC's
-Reg. Heat Exch. H20- In (Skin)
Reg. Heat Exch. H20 - Out (Skin)
Reg. Heat Exch. Mix. - In (Skin)
Reg. Heat Exch. Mix. - Out (Skin)
2 (_ Sep. Mix. - In (Skin)
Hood Ambient
Hood Ambient
rModule H20 - In to H2 Side (Skin)
|Module Mix. - Out from H2 Side (Skin)
|Module O2 - Out (Skin)|Module End Plate (Skin) Adj. to H20-In Port to H2 Side"
|Module End Plate (Skin) Adj. to Mix. -OUt Port H2 Side
|Module End Plate (Skin) Adj. to O2 - Out Port
|Module End Plate (Skin) Center
"Light"_Module End Plate (Skin) Adj. to H20-In Port to O2 Side
TC's |Module End Plate (Skin) Center
|Module End Plate (Skin) Adj. to O2 - Out Port|Module End Plate (Skin) Adj. to H20 -in Port to H2 Side
|Module End Plate (Skin) Adj. to Mix. -Out Port H2 Side
|Module End Plate (Skin( Adj. to H20- In Port to 02 Side
|Module Insulation Surface Ident. Side (Center)
|Module Insulation Surface Non-Ident. Side (Center)[..Module Insulation Surface (Top)
Code
T1
T2T3
T4
T5
T6
T7
T8
T9
T10
Tll
TI2
T13
TI4
TI5
T16
TI7
T18
T19
T20
T21
T22
_T23
T24
oF
114.5
69.8
149.0
154.2
75.3
73.4
74.6
75.1
155.2
176.5
167.4
173.2
174.6
174.8
175.2
175.2
174.5
174.8
174.3
176.3
174.9
103.0
88.8
92.9
83

TABLE VI
13-CELL WATER ELECTROLYSIS MODULE
Cell Design Parameters
Electrode Diameter
Active Area
Ion Exchange Membrane
Anode (O2 Side) Catalyst
Cathode (H2 Side) Catalyst
Cathode Catalyst Support
H2 and 02 Gas Gap Screening
H2/O 2 Separator Sheet
Gas Gap Gasket Seal
H2 Cell Water Feed Port
H2 and 0 2 Cell Outlet Gas Ports
Operating Mode
Normal Current
Normal Current Density
Normal Cell Voltage
Nominal Cell Spacing (Including one
pressure pad)
Module Design Parameters
Normal Oxygen Generation Rate
Min. Supply Voltage (Out of Power
Conditione r)
Number of Modules
Number of Cells per Module
Nominal End Plate Loading
SIGNIFICANT DESIGN DATA
Design Point
6.5 in.
33.2 in. 2 or 0.23 ft 2
Spec: ASOGN342
ES0, 12.5?0 Teflon
Pt Black, 12.5% Teflon
Expanded Gold Screen. 003 in. thick,6.75 in. dia.
5 Layers Expanded Screen 5 Nb 7, 3/0,Platinized and Welded Pressed to. 022 in.
Thick
• 003 in. Thick Niobium Platinized
• 025 in. Thick GE Silicone SE-4404,
Unfilled
• 022" Thick Screen Gap x. 25" Wide
• 022" Thick Screen Gap x. 38" Wide
Cathode Water Feed
48.5 amp
210 ASF
1.81 VDC
0. 110 in.
10 lb O2/day
23. 5 VDC
One
13
12, 900 lb
84
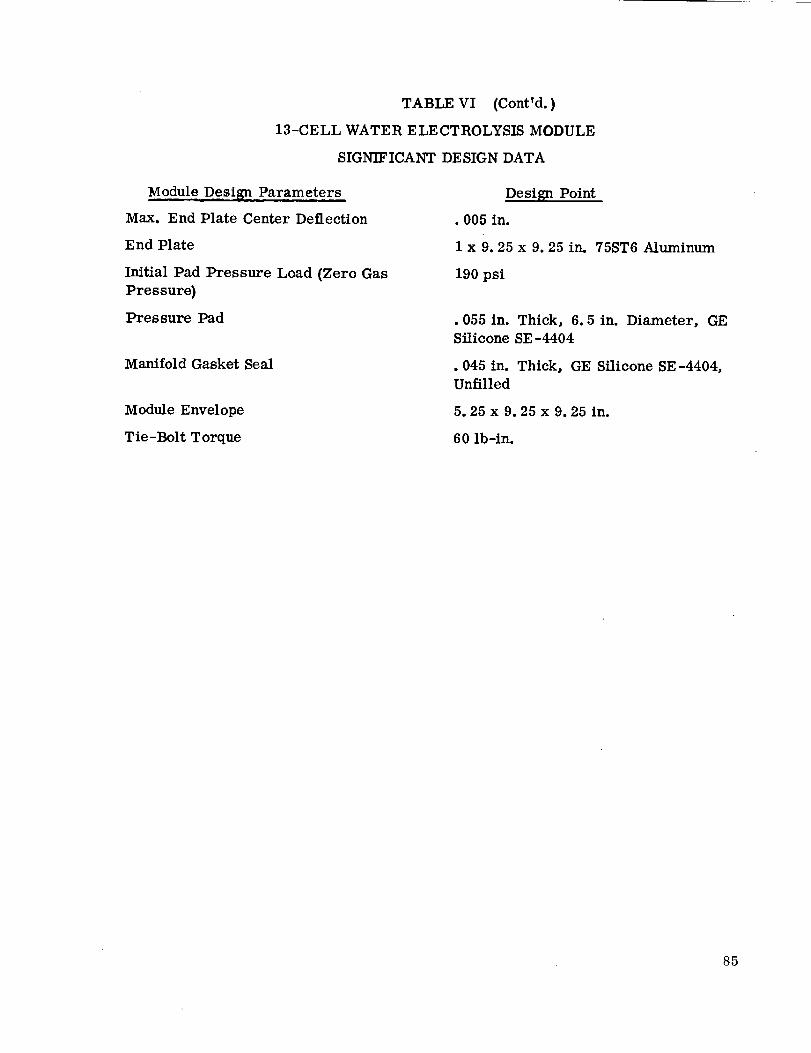
TABLE VI (Cont'd.)
13-CELL WATER ELECTROLYSIS MODULE
SIGNIFICANT DESIGN DATA
Module De_sign Parameters
Max. End Plate Center Deflection
End Plate
Initial Pad Pressure Load (Zero Gas
Pressure)
Pressure Pad
Manifold Gasket Seal
Module Envelope
Tie-Bolt Torque
Design Point
• 00S in.
1 x 9. 25 x 9.25 in. 75ST6 Aluminum
190 psi
• 055 in. Thick, 6.5 in. Diameter, GESilicone SE-4404
.045 in. Thick, GE Silicone SE-4404,
Unfilled
5.25 x 9.25 x 9.25 in.
60 lb-in.
85

TABLE VII
Material Desert tl_
Stainless Steel Screens
I00 mesh
200 mesh
230 mesh
330 mesh
400 mesh
Porous Metal Plates
Mlllipore Glass Filter Paper
Nylon Cloth
Asbestos Mats
Manville
ACCO-I
Ulti Pore 1
PVC Membranes
Synpore 15 rail thk
Synpore 10 roll thk
Stainless Steel Filter Cloth
325 x 2300 mesh
250 x 1370 mesh
200 x 1400 mesh
Riglmesh K
450 x 2750 mesh
Porous Glass Tubes
Fine No. 2
Fine No. 8
Fine No. 9
Fine No. 10
Fine No. ll
Fine No. 12
Very Fine No. 1
Very Fine No. 3
Very Fine No, 4
Very Fine No. 5
Very Fine No. 0
Very Fine No. 7
Fine No. 1E
Fine No. 1G
Fine No. Itl
Acropor AN-3000
Acropor AN-800
Acropor AN-450
E610-222/L Zltex
GE-EH 2038 Nuclepore
GE-RU 1703 Nuclepore
GE-MC 1588 Nuclepore
GE-UC I7_8 Nuclepore
GE-306 N_elepore
GE- 100 Nuel epore
Micro-Per I00 Tube
Metrieel Type _,%1-i
Metrice] Type \%!- 100
Microweb {I Layer)
Microweb (2 Layer)
Microweb (I Layer)
DAWP 04700
IIAWP 04700
WItWP 14200
Porous Polypropylene
with Surfactani
AMICON XM'300
AMICON XM300A
Type 100-25AA
Type 100-25A
Type 100-25B
Type 100-25C
Pore
Size,
Micron
10 nom
20 hem
40 nom
I00 nom
t0 nom
4to5.5
4 to 5.5
4 to5.5
4 to 5.5
4to5.5
41o5.5
2 to3.5
2 to 3.5
2 to 3.5
2 to3.5
2 to3,5
2to3.5
4 to 5.5
4 to 5.5
4 to5.5
5
0.8
0.45
2to5
3
1
0.8
0.6
3
1
5
10
3
3
5
0,65
0.45
0.45
0.1
HYDROGEN-WATER VA l'_R/WATER SE PARATOR
HYDROPHILIC MATERIAL DATA
Air
Bubble
Point
Tes t_2 psid
0.0676
0.2120
0.1352
0,2120
0.2510
0.3090
0.3090
0.3090
0.1448
2.339
0.675
14,700
4.900
10.300
4.320
5.910
1.737
1.350
0.984
0.945
5.15
5.89
7.61
6.14
5.65
5.89
9.08
9.33
7.86
13,25
8.59
7.86
7.50"
5.25
7.50
1,5 to 4,3
>10
>I0
1,0
1.0
10
>10
>10
2to3
<1.0
<1.0
1.0
<0.5
2.6
4.4
2.4
>10
>I0
>:tO
I00,0
5,0
5,0
5.0
3,0
1.O
1,3
H20 Volumetric Flow
cc._._.q_____-ln. 2 @ 14.097 psta and 6_'F Disehar_
0.483 0.966 1.932 3._64 9.000
psld psld psid psid psld
1388.0 2775.0 5550.0 11100.0 27750.0
0,46 0,921 1,94 3.69 9,21
7.26 14.53 29.05 5q.1 145.3
3.26 6.52 13.04 26.1 05.2
33,55 67.10 134.2 26S,4 671,0
14.20 28.4 56.8 113.6 284.0
1322.0 2644,0 5288.0 10576,0 26440.0
1612.0 3224.0 644_.0 12896,0 32240.0
2580.6 5161,2 10322.4 20644,_ 51612,0
1995.0 3990.0 7980.0 15960.0 39900.0
2325,0 4650.0 9300,0 19600.0 46500.0
0.75 1.60 4.05 13,40 43,55
0.25 0.60 1.25 3.65 10.80
2.00 4.30 9.25 20.95 55.90
2.40 4.70 9.80 20.95 55,20
2,00 4.30 9.00 19.90 52.60
3.10 6.10 12.00 24.40 61.05
0.15 0,32 0.60 2,75 9.40
0.20 0.42 0.88 2.10 6.04
0.45 0.92 1.96 4.5_ I2,85
0,25 0,52 1,15 2,50 7,25
0.30 0. 56 1.16 2.22 5,42
0.82 1.66 3.34 6.68 16.71
2.60 3,97 6.68 12,5
2.27 3.00 6.12 10.7
5.13 6.45 11.30 20.4
9.66
3,86
24.15
19.32
12.08
3.44
I4.99
9.66
5.80
0.0353
Comments
111), (2)
I
I
I
IJ-'3
I(31
• (4) '
Gelman Instrument Co. PVC>
on a nylon cloth support.
Chemplast Inc.
_ Poly-earbonate membranes
ABS Thermoplastic.
Gelman Instrument Co.
Gelman Instrument Co.
Mllllpore Type WSWP (Sample No. 1)
Millipore Type WSWP
MilIipore Type WSWP (Sample No. 2)
Milliporc Cellulose
Millipore Cellulose
Millipore Cellulose with
nylon cloth support
Celanese Plastic Co.
published data.
l.exing'to,, Mass.
1 P, alston Co., I.exlng-torl Mass.
]_ asbestos cylinders with cpoxvimpre_latloa,
86

TABLE VII (Cont'd.)NOTES:
(i) Converted flow data from Figures 16 thru 26 of Lockheed Missiles and Space Co.,
Sunnyvale, Calif., Report No. NASA CR-66922, dated 5/18/70 for ContractNAS 1-822 8.
(2) After initial water wetting of material by passing water through material and with a
light water film on one side and air applied to other side, observe for first bubble
indication on water film side. Converted data from Tables 4 and 6 of Lockheed
Missiles and Space Co., Sunnyvale, Calif., Report No. NAS CR-66922, dated5/18/70 for Contract NAS 1-8228.
(3)After initial water wetting of material on ID and OD and with OD to ambient air,
observe for first bubble indication in ID when a vacuum is applied to ID. Converted
data from 10/28/70 tests made at GE/DECP, Lynn, Mass. Corning filter tube type
5/8" OD x . 45" ID x 4" lg, Pyrex Laboratory Glassware, Corning Glass Works.Mean lateral area =
(3 1416) E "625+'450]• 2 (4) = 6.75 in.2.
(4) After initial wetting of material on ID and OD and with ID to pressurized air,
observe for first bubble indication on OD (immersed in water). Coming filter tubetype 1" OD x 3/4" ID x 8" lg. Mean lateral area = 22 in. 2.
87

TABLE VIII
HYDROGEN,,"WAT ER SEPARATOR
]tYDROPHOBIC MATERIAL DATA
Material Description
Coated 230 Mesh Screens
Teflon TFE
Teflon FEP
Teflon S
Kynar
Vydax
Zitex Membranes
E610-122
H662-123
II022-124
K233-222
E610-122+H662-123
E610-122 2 Ply
E610-122 3 Ply
E010-122 6 Ply
E610-122 12 Ply
E610-122C
E610-122C+E610-122
6 Ply
E610-122C 2 Ply +')
E610-122 3 Ply +
[1662-123 2 Ply __
12-104
Pallfle× Products
TV20 A40
TV20 AT0
TS. 1GC-32
TX40 1t80
Saunders Engineering
8-20 Teflon Tape
S-22 Teflon Tape
Aquapel {Type SSttP)
\rmalon (Type 406A-116}
Mitex /Type LCHP)
E24,_-122D IZite×}
11201-122D {Zitexl
Unsintered Teflon Sample
No, 3
E610-222 IZItex)
E610-122D Bonded to a
40 x 40 Nickel Mesh
Screen
H662-123 I1 Layer)
H622-123 {2 Layers)
Porous Polypro_'lene
(Type SR _ 256C)
E606-223/35 IZltex)
E606-223/5.0 {Zitex)
E606-222/5.0 (Zitex)
Armalon _T)'pe 403G-108)
Armalon (Type 405A-I12)
Armalon (Type 408-128SC)
Armalon (Type 95-502)
Pore
Size,
Mlcrol
I0
2 to 5
Water
Inltiatio
Point,
ps Id
O, 367
0.213
O. 154
0.213
O. 019
2.320
1,312
I. 526
0. 483
5.150
6.620
8.330
7.110
5. 380
8. 100
9.320
14. 697
14. 097
1.197
1.968
8. 100
8.330
28.95
28.95
5.0
15.0
3.6
0.5
0.5
40.0
1.0
1.0
0.8
1.5
500
3.0
3.25
4.00
3.0
3.0
2.5
0.5
H 2 + Water Vapor Volumetric Flow
ec/min-tn. 2@ 14. 697psia and 68°F Dis
0.483 0.966 1.932 3.864 9.660
psid paid psid psid psid
1062.0 2120.0 4250.0 8480.0 21200.0
1942.0 3880.0 7750.0 15520.0 38800.0
2060.0 4120.0 8250.0 16500.0 41200.0
2160.0 4320.0 8650.0 17320.0 43200.0
619.0 1238.0 2470.0 4950.0 12380.0
505.0 1008.0 2015.0 4020.0 lOlO0. O
255.0 510.0 1020.0 2040.0 5100.0
200.0 407.0 813.0 1628.0 4060.0
230.0 460.0 920.0 1840.0 4600.0
232.0 464.0 926.0 1850.0 4630.0
55.8 111.5 223.0 446.0 1115.0
47.3 94.5 189.0 378.0 944.0
53,3 106.6 213.0 426.0 1060.0
1430.0 2850.0 5720.0 11400.0 28500.0
1501.0 3000.0 6100.0 12000.0 30000.0
89.7 179.6 359.0 718,0 1795.0
15.78 31.5 63.0 126,0 314.0
66.6 133.5 267.0 534.0 2140.0
35.6 71.2 142.3 284.0 712,0
.q 5(4) 435(4 ) 865(4)
192(4) 386(4) 775(4)
0,054/
0.124(3)
Comments
(i), (2)
Mlllipore Corp. 5 mils thk,
duPont Teflon coated glass
fabric (6 mils thk. }
Mllllpore Corp. 5 mils thk.
Chemplast Inc.
Chemplast Inc.
W. S. Shamban Co. (7 mils thk.',
(improved quality)
Chemplast Ine,
Chemplast Inc. 5 mils thick.
Chemplast Inc.
Chemplast Ine,
Celanese Plastics Co. 0.9 rail
thick.
Chemplast Inc.
Chemplast Inc.
Chemplast Inc. (Zltex)
duPont; Teflon coated glass
fabric; 3 mils thick.
duPont; Teflon coated glass
fabric; 5 mils thick.
duPont; Teflon coated (one side)
on glass fabric; a mils thick.
duPoni: Teflon coated glass
fabric: 27 mile thick.
NOTES:
(ll Converted flow data from Figures 27 thru 45 of Lockheed Missiles and Space Co., Sunnyvale, Calif., Report No. NASA CR-66022,
dated 5/'l_,'70, for Contract NAS1-8226.
(2) After applying a light water film to one side of materiaI and applying air pressure above this film, observe for first water indication
on other side of material. Converted data from Tables 5 and 7 of Lockheed Missiles and Space Co., Sunnyvale, Calif., Report No.NASA CR-66922, dated 5/l_/70, for Contract NAS1-8228.
(3) Airflou magnitude _tt2 flow magnitude.
(h It 2 [low magnitude.
88

TABLE IX
ANION EXCHANGE RESIN DATA (DEIONIZER)
(Illinois Water Treatment Co. Specification IWT-A-204G)
This is an intermediate base, high capacity anion exchange resin. This resin is manu-
factured in granular form. It is shipped in 2 ft 3 bags or 7 ft 3 fiber drums in a partiallydried form.
Chemical and Physical Properties
Ionic Form Supplied
Moisture Content
Shipping Weight
Total Anion Exchange Capacity
Economical Usable Exchange Capacity
Effective Size
Screen Grading
Hydraulic Expansion
Pressure Drop
Swelling
Regeneration Levels
Solubility
Usable pH Range
Service Flow Rate
Regenerant Flow Rate
Hydroxide Form
53 to 57%
17 lb/ft3
2. 50 meq/ml - based on SO4 = form7.40 meq/dry gm - based on SO 4= form
20 to 25 kg/ft 3, CaCO3 equivalent
0.4to 0.7 mm
14 to 50 mesh U.S. Standard screens
Upflow Rate,
gpm/ft 2 % Expansion at 70_F2 22
3 45
4 68
6 110
Flow Rate, Pressure Drop,
gpm/ft 2 psi/ft of bed depth4 0.45
5 0.58
6 0.70
8% from OH- to C1- form
3 to 5 lb NaOH/ft 3 - 4 to 6% by wt.
5 to 7 lb Na2CO3/ft3 - 5 to 7% by wt.
Insoluble in acids, bases and all common
organic solvents
0to 8.5
1 to 2.5 gpm/ft3 for water treatment
O. 5 to 1.0 gpm/ft3
89

TABLE IX (Cont'd.)
ANION EXCHANGE RESIN DATA (DEIONIZER)
(Illinois Water Treatment Co. Specification IWT-A-204G)
Rinse Flow Rate
Rinse Volume
Maximum Operating Temperature
Chemical and Physical Properties
0. 5 to 2.0 gpm/ft3
50 to 80 gal/ft 3
130_F in hydroxyl cycle
9O

TABLE X
CATION EXCHANGE RESIN DATA (DEIONIZER)
(IllinoisWater Treatment Co. SpecificationILLCO-C-211)
This is a cation exchange resin, manufactured in bead-like particles from styrene and
divlnylbenzene. The active exchange group (sulfonic)is added after polymerization of
the bead by sulfonation.
Chemical and Physical Properties
Ionic Form Supplied
Moisture Content
Shipping Weight
Cation Exchange Capacity
Economical Usable Exchange Capacity
Effective Size
Screen Grading
Hydraulic Expansion
Pressure Drop
Swelling
Regeneration Levels
Solubility
Usable pH Range
Sodium Form. Hydrogen form can also
be supplied.
45 to 50%
53 lb/ft 3
Minimum of 2. 0 meq/ml - based on sodium
form - 4. 5 meq/dry gm.
10 to 25 kg/ft 3, CaCO3 equiv.
0.45 to 0. 60 mm
16 to 50 mesh (wet) U.S. Std. screens
Upflow Rate,
gpm/ft 2 _Expansion at 70_F2 12
4 33
6 54
8 75
Flow Rate, Pressure Drop,
gpm/ft2 psi/ft of bed depth4 0.40
6 0.65
8 0.82
10 1.10
7% from Na + to H + form
2.5 to 20 lb 66 ° Be' H2SO4/ft 3-2 to 10_by wt.
5 to 30 lb 30% HC1/ft3 - 5 to 10% by wt.
4 to 15 lb NaC1/ft3 - 10% by wt.
Insoluble in acids, bases, and all common
organic solvents
1 to 14
91
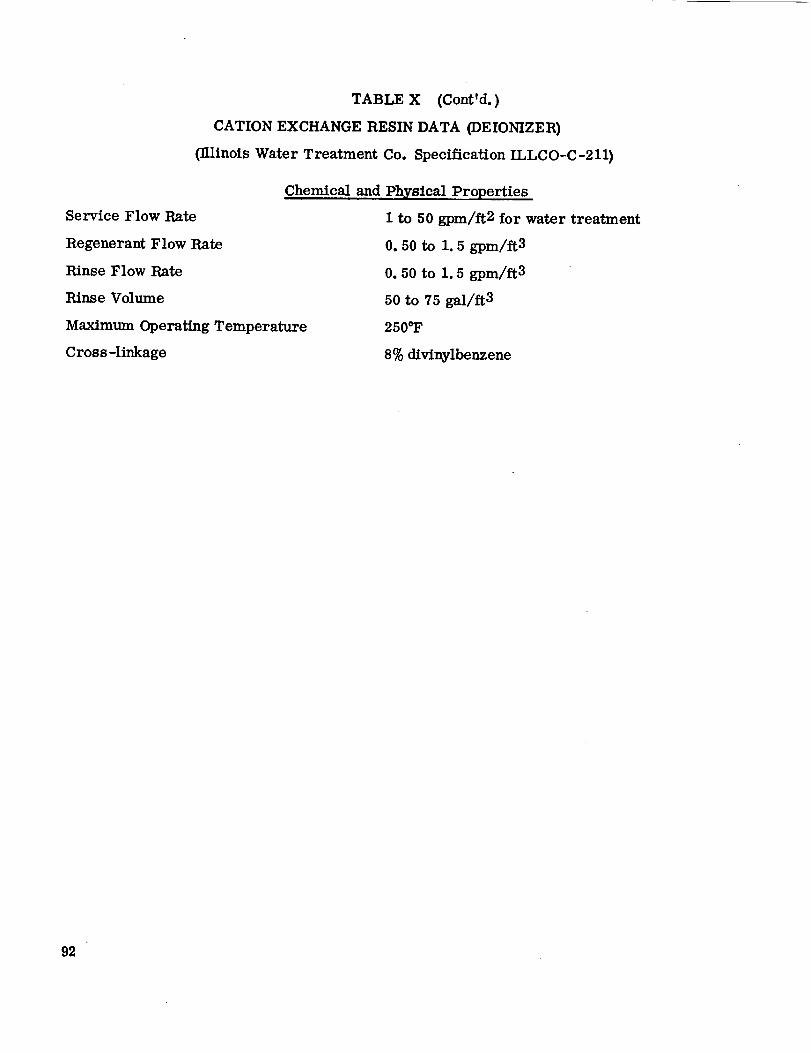
TABLE X (Cont'd.)
CATION EXCHANGE RESIN DATA (DEIONIZER)
(Illinois Water Treatment Co. Specification ILLCO-C-211)
Service Flow Rate
Regenerant Flow Rate
Rinse Flow Rate
Rinse Volume
Maximum Operating Temperature
Cross-linkage
Chemical and Physical Properties
I to 50 gpm/ft2 for water treatment
0.50 to 1. 5 gpm/ft3
0. 50 to 1.5 gpm/ft3
50 to 75 gal/ft3
250_F
8% divinylbenzene
92
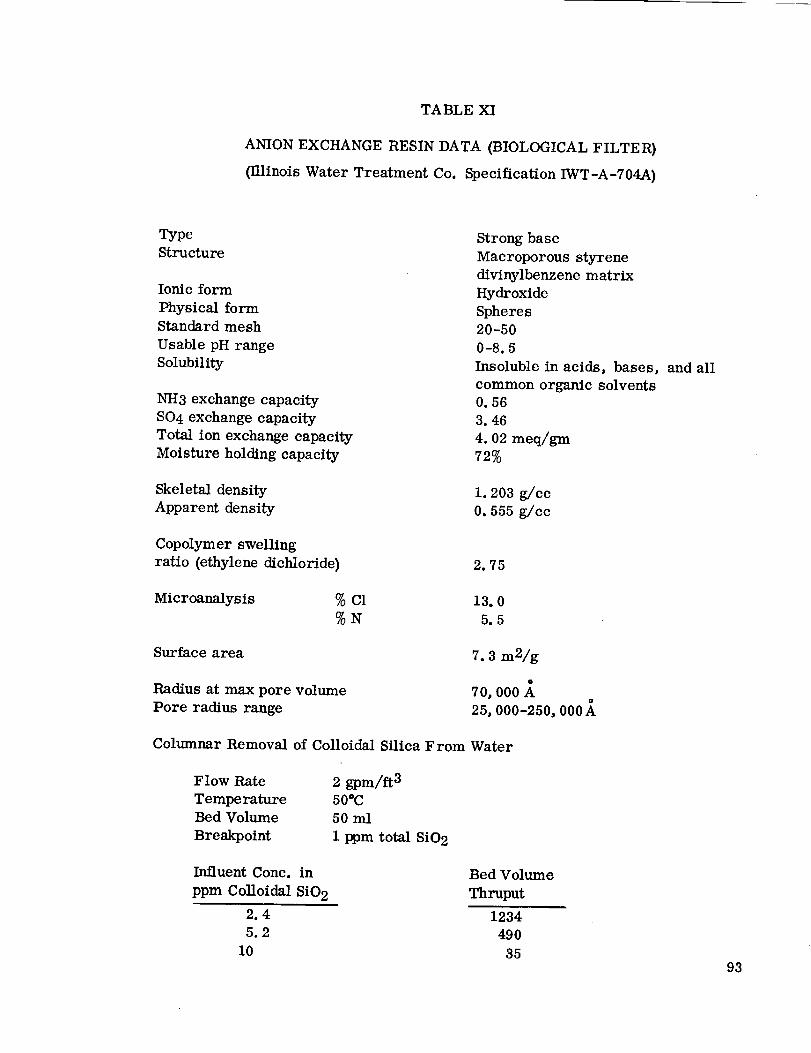
TABLE XI
ANION EXCHANGE RESIN DATA (BIOLOGICAL FILTER)
011inois Water Treatment Co. Specification IWT-A-704A)
Type
Structure
Ionic form
Physical form
Standard mesh
Usable pH range
Solubility
NH3 exchange capacity
SO4 exchange capacity
Total ion exchange capacity
Moisture holding capacity
Strong base
Macroporous styrene
divinylbenzene matrix
Hydroxide
Spheres
20 -50
0-8.5
Insoluble in acids, bases, and all
common organic solvents
0.56
3.46
4.02 meq/gm
72%
Skeletal density
Apparent density
1. 203 g/cc
0. 555 g/cc
Copolymer swelling
ratio (ethylene dichloride) 2.75
Microanalysis % C1
%N13. 0
5.5
Surface area
Radius at max pore volume
Pore radius range
7.3 m2/g
70, 000 ,_
25, 000-250, 000
Columnar Removal of Colloidal Silica From Water
Flow Rate 2 gpm/ft 3
Temperature 50°C
Bed Volume 50 ml
Breakpoint 1 ppm total SiO 2
Influent Conc. in
ppm Colloidal SiO 2
2.4
5.2
10
Bed Volume
Thruput
1234
490
3593

TABLE XH
CATIONEXCHANGERESINDATA (BIOLOGICAL FILTER)
(Illinois Water Treatment Co. Specification IWT-C-381)
This is a macroreticular sulfouic type cation exchange resin.
Chemical and Physical Properties
Ionic Form Supplied
Moisture Content
Shipping Weight
Cation Exchange Capacity
Economical Usable Exchange Capacity
Effective Size
Screen Grading
Hydraulic Expansion
Pressure Drop
Swelling
Regeneration Levels
Solubility
Usable pH Range
Sodium form. Hydrogen form can also be
supplied.
47 to 53%
50 lb/ft3
1. 80 meq/ml, Na + form, 4. 30 meq/dry gm
10 to 20 kg/ft 3, CaCO 3 equivalent
0.4to 0.5 mm
16 to 50 mesh (wet) - U.S. Standard screens
Upflow Rate,
gpm/ft 2 % Expansion at 70_F2 5
4 25
6 45
8 60
10 80
Flow Rate, Pressure Drop,
gpm/ft 2 psi/ft of bed depth
2 0.1
4 0.2
6 0.4
8 0.5
10 0. 7
5% from Na+ to H + form
2. 5 to 20 lb 66 ° B_ H2SO4/ft 3 -2 to 10%bywt.
5 to 30 lb 30% HC1/It3 - 5 to 10% by wt.
4 to 15 lb NaCI/ft 3 - 10% by wt.
Insoluble in acids, bases, and all common
organic solvents
lto 14
94

Service Flow Rate
Regenerant Flow Rate
Rinse Flow Rate
Rinse Volume
Maximum Operating Temperature
TABLE XII (Cont'd.)
CATION EXCHANGE RESIN DATA (BIOLOGICAL FILTER)
(Illinois Water Treatment Co. Specification IWT-C-381)
Chemical and Physical Properties
1 to 50 gpm/ft3 for water treatment
0.50 to 1.5 gpm/ft 3
0. 50 to 1.5 g-pm/ft3
50 to 75 gal/ft3
250°F
95

<:
Cl 0 C:_ ,-_ 00 cD• • o • •
U
;:4
C_
r_
_ ,-_ ,-4 ,-q ,-_ ,-_ t-I
J_
I
! I
r_
96
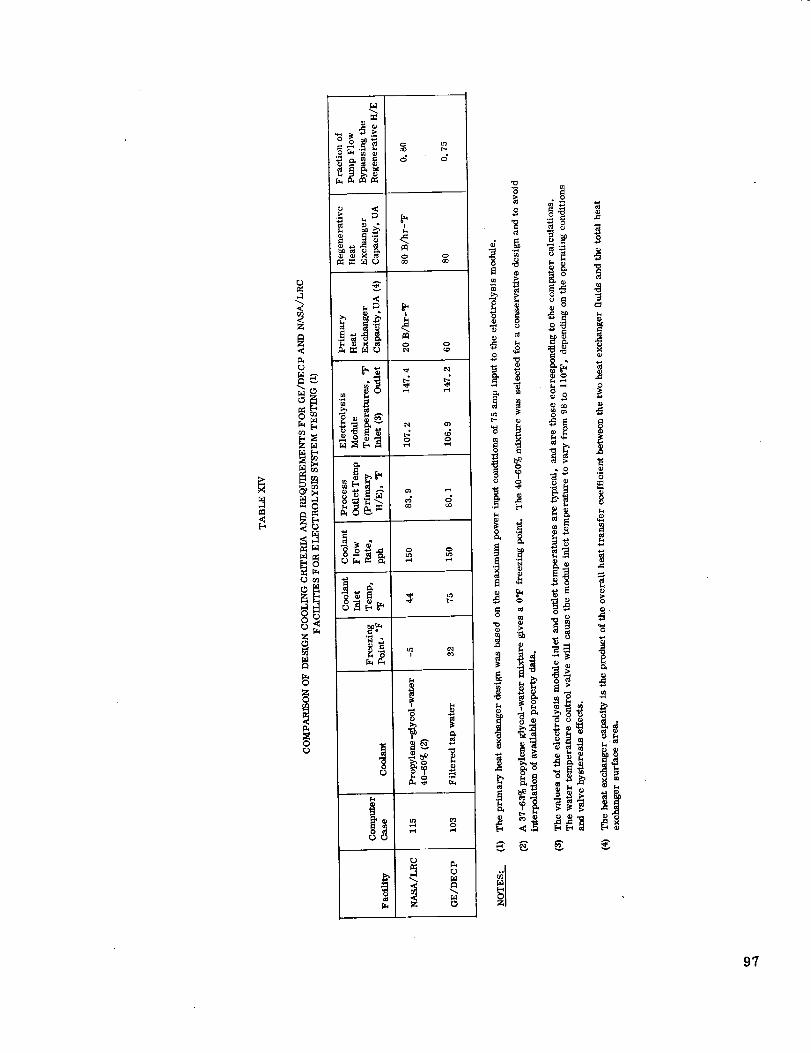
r_
O
v_ vl_
o_
A
0
o
p_
c_
_4
f_
97

TABLE XV
WATER TEMPERATURE REGULATING VALVE SPECIFICATION
1. Functional Description: The water temperature regulating
valve mixes the process water which is heated by the regenerative heat exchanger with
water bypassing the same heat exchanger. The water temperature regulating valve
provides an essentially constant mixing temperature over the range of operatingconditions.
2. Mechanical Description: The water temperature regulatingvalve consists of a sleeve mixing valve actuated by a eutectic wax linear actuator.
The proprietary wax mixture that is selected for the actuator causes the actuator to be
linear for a total temperature range of 20_F over approximately 80% of the total travel.
Only a travel corresponding to 8-10_F is selectdd to produce full heated flow or fullbypass flow.
3. Weight: 1.6 lb (max)
4. Port Configuration: MS33649-8.
5. Mounting Provisions: The water temperature regulating valvewill be surface mounted.
6. Predominant Materials: All parts in contact with the fluid will be
AISI 316 or 17-4 PH stainless steel and compatible elastomeric compounds. The wax
in the linear actuator is completed sealed by a compressed elastomeric seal.
o
e
Performance Requirements:
Maximum hot flow at not less than 97_F
Maximum cold flow at not less than 107°F
Total water flow rate
Pres sure loss
Nominal working pressures
Fluid temperatures
Leakage
Proof pressure
Burst pressure
Life:
0. 85-33 lb/hr
less than 0.25 psid
60-65 psia
40-110_F
Zero external leakage
140 psig
280 psig
Life of 2 years including 5514 temperature cycles.
98

TABLE XVI
PROCESS WATER PUMP SPECIFICATION
1. Functional Description: To provide circulation of the make-up
and process water in the electrolysis subsystem. A portion of the water circulated
is lost due to either electrolysis of water or to saturate the effluent gases. The
remaining water which is circulated by the pump is utilized as the principal medium
for cooling the electrolysis module.
2. Mechanical Description: The pump shall be a positive displace-
ment, self-priming type with an induction motor. The pump shall incorporate a bypass
pressure relief valve to prevent operation of the pump at an excessive differential
pressure.
3. Weight: 3.75 lb (max).
4. Port Configuration: 1/8 N'PT female ports.
5. Mounting Provisions: The pump assembly shall be supportedprincipally by a motor bracket.
6. Predominant Materials: The water pumped by this component
will be exposed to the following materials: AISI 316 stainless steel, polypropylene or
Delrin AF (gears and hydrodynamic bearings), barium ferrite (magnetic drive), andsilicone rubber or Viton A elastomeric seals.
.
with neutral ground.
8.
9.
10.
11.
Electrical Requirements: 70 watts, 208 volts, 3 phase, 400 Hz,
Performance Requirements: 0. 85 to 33 lb/hr.
Working Fluid: Potable Water.
Allowable Leakage:
External
No external leakage
Internal
Bypass relief valve 1 cc/min
Normal Working Fluid Pressures:
Pump inlet pressure
Pump pressure rise
Normal working fluid
temperatures
14. 7 to 24. 7 psia
27 to 39.5 psid
40 to 100_F
99

TABLE XVI (Cont'd.)
PROCESS WATER PUMP SPECIFICATION
12. Internal Relief: A bypass relief valve shall prevent the pumping
elements from exceeding a differential pressure of 45 psid.
13. l>root Pressure: 140 psig
14. Burst Pressure: 280 psig
15. Duty Cycle: 5514 cycles of operation for 55 minutes and shutdown
for 39 minutes (94 minute orbit) for 180 day (4320 hr) mission.
16. Reliability: Life of 2 years.
100

TABLE XVII
WATER FLOW VALVE SPECIFICATION
1. Functional Description: The water flow valve is connected at
the outlet of the process water pump to maintain an essentially constant process water
flow rate.
2. Mechanical Description: The water flow valve maintains a constant
flow by regulating the pressure drop _) 5 psid across an external adjustable orifice.
The water flow valve maintains the flow within 4- 5% of the set point with >_5 psid pressure
loss,
3. Weight: 1. 3 lb (max).
4. Port Confi_lration: MS 33649-4.
5. Mounting Provisions: The water flow valve will be line mounted.
6. Predominant Materials: AISI 304 stainless steel and silicone or
Viton "A" elastomeric seals.
7. Performance Requirements:
Flow Rate: 0. 85 to 33 lb/hr.
Adjustable to within :_ 10go of set point at min flow rate
and to within ± 5go of set point at high flow rate.
Pressure Loss: 10 psid (max)
8. Working Fluid: Potable water.
9. Allowable Leakage: No external Leakage.
10. Normal Working Fluid Conditions:
Inlet Pressure: 69 psia (max)
Temperature: 40 - 100_F
11. Proof Pressure: 140 psig
12. Burst Pressure: 280 psig
13. Duty Cycle: 5514 cycles of operation for 55 minutes and
shutdown for 39 minutes (94 minute orbit) for 180 days.
14. Reliability: Useful life - 2 years.
101

TABLE XVIII
HYDROGENABSOLUTE BACK-PRESSUREREGULATORSPECIFICATION
.
(aneroid) with resilient
3.
4.
5.
6.
7.
1. Functional Description: To establish a controlled pressure
level on the hydrogen discharge side of a hydrogen-water separator assembly.
Mechanical Description: Spring-loaded evacuated bellowsmaterial seat.
Weight: 1. 25 lb max.
Port Configuration: MS 33649-4 inlet and outlet ports.
Electrical Interfaces: None.
Mounting Provisions: In-line tubing installed.
Predominant Materials: 17-7 PH and 316 SST: Viton "A" and/orunfilled silicone seal material.
8. Max. Overall Envelope Dimensions: 1.56 in. dia. x 2.50 in. long.
9. Performance Requirements: With 60 to 80"F mixture of hydrogen
and water vapor supplied to the inlet, the upstream cracking pressure shall be 40
to 41 psia independent of the downstream pressure. The regulator shall be capable
of controlling the upstream pressure to 41 to 42 psia, when passing a 60 to 80_F
saturated mixture of 0. 0194 to 0. 220 lb/hr of hydrogen independent of the downstream
pressure. The regulator shall reseat (shut off hydrogen flow) at 39 psia minimum.
10. Working Fluid: Hydrogen and water vapor.
11. Allowable Leakage Rate: No internal leakage after the reseating
condition has been reached; no external leakage. Note: Redundant seals shall be
provided for all external hydrogen leak paths except on inlet and outlet "MS" ports.
12.
normal 14.7 psia.Downstream Working Fluid Pressures: Min. 0 psia; max. 20 psia;
13. Upstream Working Fluid Temperature: Min. 60_F; max. 80_F;nominal 70"F.
14. Proof Pressure: 84 psig.
15. Burst Pressure: 168 psig.
16. Temperature Environment Requirements: 40 to 140_F.
17. Continuous Mission Rate Duty: Steady-state flows for 6 months
varied within a hydrogen range of 0. 0194 to 0. 220 lb/hr of 80_F saturated.
18. C_clic Mission Rate Duty: 5514 cycles of hydrogen/water vapor
flow "on and off", i.e., one cycle equals 55 min. of 80"F saturated hydrogen "on" flowtime at 0. 220 lb/hr and 39 min. of no flow.
19. Reliability: Useful life - 2 years.102
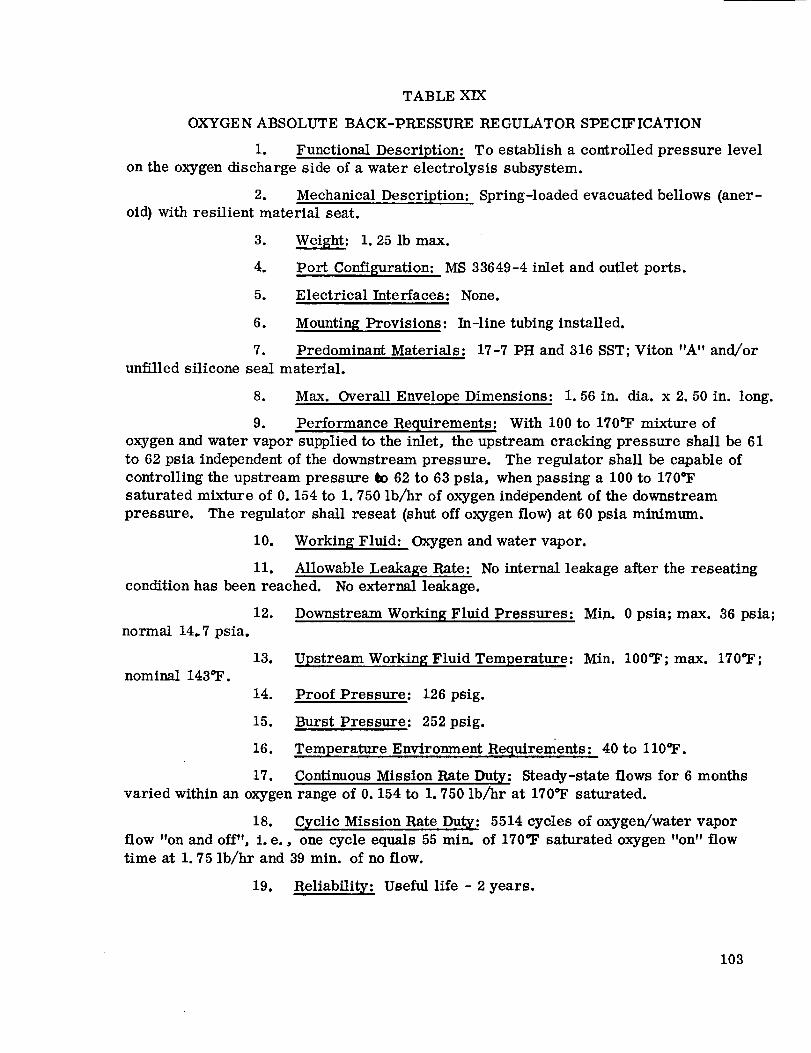
TABLE XIX
OX"TGE N ABSOLUTE BACK-PRE SSURE RE GULATOR SlOECIF ICATION
i. Functional Description: To establish a controlled pressure level
on the oxygen discharge side of a water electrolysis subsystem.
2. Mechanical Description: Spring-loaded evacuated bellows (aner-oid) with resilient material seat.
3. Weight: 1.25 lb max.
4. Port Configuration: MS 33649-4 inlet and outlet ports.
5. Electrical Interfaces: None.
6. Mounting Provisions: In-line tubing installed.
7. Predominant Materials: 17-7 PH and 316 SST; Viton "A" and/or
unfilled silicone seal material.
8. Max. Overall Envelope Dimensions: 1. 56 in. dia. x 2. 50 in. long.
9. Performance Recluirements: With 100 to 170_F mixture of
oxygen and water vapor supplied to the inlet, the upstream cracking pressure shall be 61
to 62 psia independent of the downstream pressure. The regulator shall be capable of
controlling the upstream pressure ¢o 62 to 63 psia, when passing a 100 to 170_F
saturated mixture of 0. 154 to 1. 750 lb/hr of oxygen ind_ipendent of the downstream
pressure. The regulator shall reseat (shut off oxygen flow) at 60 psia minimum.
10. Working Fluid: Oxygen and water vapor.
11. Allowable Leakage Rate: No internal leakage after the reseating
condition has been reached. No external leakage.
Min. 0 psia; max. 36 psia;12. Downstream Working Fluid Pressures:
normal 14.7 psia.
13. Upstream WorkingFluidTemperature: Min. 100_F; max. 170_F;nominal 143_F.
14. Proof Pressure: 126 psig.
15. Burst Pressure: 252 psig.
16. Temperature Environment Requirements: 40 to ll0_F.
17. Continuous Mission Rate Duty: Steady-state flows for 6 months
varied within an oxygen range of 0. 154 to 1. 750 lb/hr at 170_F saturated.
18. Cyclic Mission Rate Duty: 5514 cycles of oxygen/water vapor
flow "on and off", i.e., one cycle equals 55 min. of 170_F saturated oxygen "on" flowtime at 1.75 lb/hr and 39 min. of no flow.
19. Reliability: Useful life - 2 years.
103

TABLE XX
H2-H20 DIFFERENTIAL BACK-PRESSURE REGULATOR SPECIFICATION
1. Functional Descriptiom To establish a controlled pressure level on the
water discharge side of a hydrogen-water separator assembly.
2. Mechanical Description: Spring-loaded bellows (aneroid) referenced
to a set pressure and with resilient material seat.
3. Weight: 1.50 lb max.
4. Port Configuration: MS 33649-4 inlet, outlet and reference ports.
5. Electrical Interfaces: None.
6. Mounting Provisions: In-line tubing installed.
7. Predominant Materials: 17-7 PH and 316 SST, Viton "A" and/or unfilledsilicone seal material.
8. Max. Overall Envelope Dimensions: 1. 56 in. dia. x 3 in. long.
9. Performance Recluirements: With 60 to 80_F water supplied to the inlet
along with a supplied referenced pressure, the upstream water cracking pressure shall
be 1. 5to 3. 5 psi below any set referenced pressure up to 42 psia and be in-dependent of the downstream water pressure. The regulator shall be capable of control-
ling the upstream water pressure 1.5to 3.5 psi below a setreference pressure of 39
to 42 psia when passing 60 to 80 _F water of 25 to 45 lb/hr and be independent of the
downstream water pressure.
10. Working Fluid: Water and hydrogen reference gas.
11. Allowable Leakage Rate: No internal leakage after the reseating condi-
tion has been reached; no external leakage. Note {1): Redundant seals shall be provi-
ded for all external hydrogen leak paths except on reference "MS" port. Note (2):
Redundant seals shall be provided for all internal hydrogen-to-water side leak paths.
12. Downstream Working Fluid Pressures: Mln. 0 psia, max. 24. 7 psia;normal 16 psia.
Upstream Working Fluid Temperature: Min. 60_F, max. 80_F,13.
70_F.
14. Proof Pressure: 84 psig.
15. Burst Pressure: 168 psig.
16. Temperature Environment Requirements: 40 to ll0_F.
17. Continuous Mission Rate Duty: Steady-state flows for 6 months variedwithin a water range of 25 to 45 lb/hr at 80_F and with a reference pressure of 42 psia.
18. Cyclic Mission Rate Duty: 5514 cycles of water flow "on and offl',
i. e., one cycle equals 55 min. of 90_F water "on" flow time at 45 lb/hr and with a
reference pressure of 42 psia and 39 min. of no flow.
19. Reliability: Useful life - 2 years.104
nominal

SECTION 6. APPENDIX
HEAT TRANSFER STUDY DATA
Table XXI
Table XXH
Table XXKI
Table XXIV
Table XXV
Table XXVI
Electrolysis System Performance Summary - Case 103
Electrolysis System Performance Summary - Case 114
Electrolysis System Performance Summary - Case 115
Electrolysis System Performance Summary - Case 132
Electrolysis System Performance Summary - Case 143
Electrolysis System Performance Summary - Case 145
105

WES* 2
TABLE XXI
CASE 103
ELECTROLYSIS SYSTEM PERFORM/_CE SUMMARY
NO, CELLS ! 3ELEC MOD STKS IN PARALLEL |CELL ACT AREA 33.2 SQ IN,CELL DIAM(ACTIVE) 6,5 IN,CELL VOLTAGE I. 7"/7 VOLTS
MODULE TERM VOLTAGE 23. ! VOLTS
AVAIL MOD INPUT VOLTS 22 VOLTS
MODULE INPUT CURRENT 74.99 AMPDESIGN CURRENT DENSITY 323, B ASFPERM LOSS(EQUIV J) 1,41 ASKOPERATING CURRENT DENSITY 325,2 ASFELECT HOD TEMP RISE 40,3 DEG FMEAN CELL TEMP 127 DEG F
SUBSYSTEM OPERATING MODE
HEAT GEN RATE 1021,4MOD HEAT LOSS TO CABIN "/6, 75HOD HEAT LOSS FACTOR !.44"/OXYGEN OUT TEMP FACTOR 0,2OXYGEN FLOW RATE 0,639
OXYGEN PRODUCTION(LB/DAY) !5,33OXYGEN HEAT LOSS RATE 1402 END PLATE HEAT LOSS RATE 1,'/4
CONTINUOUSB/H RB/H R
B/H R- DEG F
L B/H R
B/H RB/H R
HYDROGEN FL.OW RATEWATER PUMPING RATEWATER SUPPLY RATE
0,0804 LB/HR22 LB/HR0, "/33
REGEN H/E EFFECT !C(COLD) 5, 5C(HOT) 22, 4
HEAT TRANS RATE 283HEAT TRANS FACTOR 80BYPASS FLOW RATE 16.5BYPASS FLOW RATIO 0o 75H/E EFFECT WITH BYPASS CORR 0,25
B/HR- DEG FB/H R- DE G FB/HRB/H R- DEG FL B/H R
PRIM H/E EFFECT 0,914SPECIFIC HEAT OF COOLANT IC(COLD) I 50C(HOT) 22, 104
HEAT TRANS RATE 1211,3HEAT TRANS FACTOR 60
B/LB- DE G FB/H R- DEG FB/H R- DE G FB/H RB/H R- DE G F
POWER COND EFF(MIN) 0.8|2Mh_X CURRENT 84,06 AMPHEAT GENERATION RATE 1368 B/HR
POWER COND LOSS, WATTS 400,8REG POWER FOR CONTROL(28VDC) 0.15POWER I NPUT(Mh_X ) 2,221 KW
NOM POWER SUPPLY VOLTAGE 28SUPPLY VOLT TOL,PCT 10,"/
VOL TS
!06
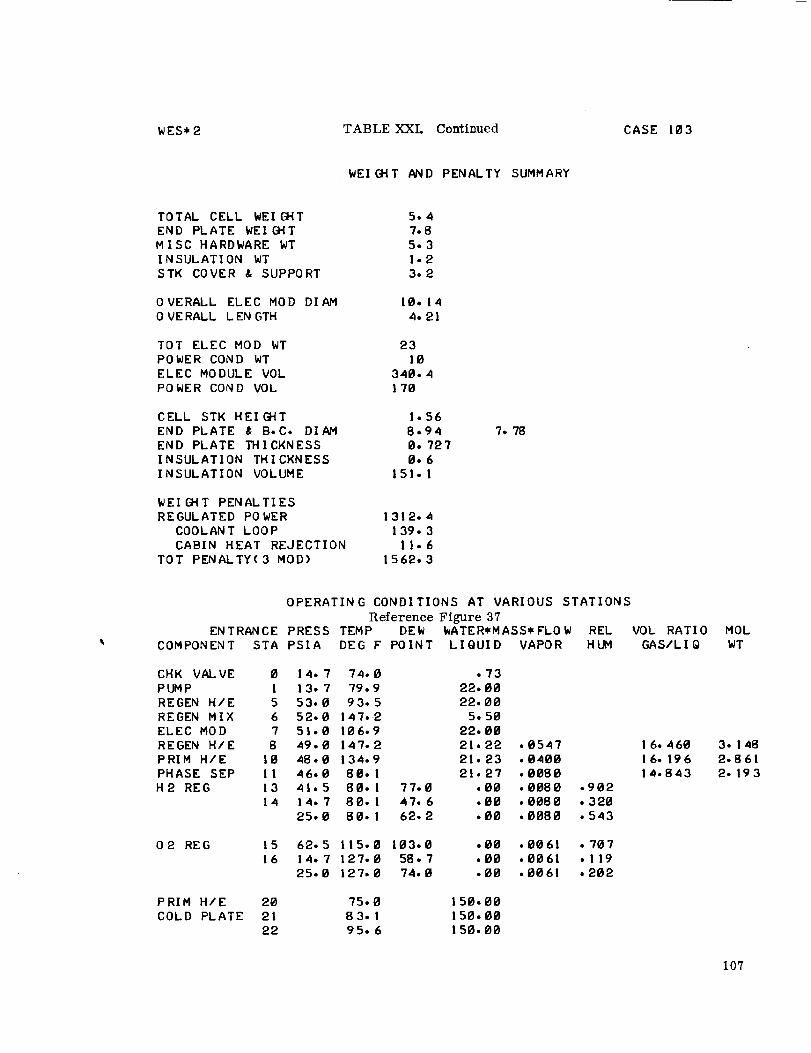
W ES* 2 TABLE XXL Continued CASE 103
WEIGHT AND PENALTY SUMMARY
TOTAL CELL WEIEHT
END PLATE WEIGHT
MISC HARDWARE WT
INSULATION WT
STK COVER & SUPPORT
OVERALL ELEC MOD DIAM
0 VERALL LEN GTH
TOT ELEC MOD WT
POWER COND WTELEC MODULE VOL
POWER COND VOL
CELL STK HEIGHTEND PLATE & B.C. DIAH
END PLATE THICKNESS
INSULATION THICKNESS
INSULATION VOLUME
WEIGHT PENALTIES
REGULATED POWER
COOLANT LOOP
CABIN HEAT REJECTION
TOT PENALTY(3 MOD)
5.4
7. 85.3
1.2
3.2
10. 14
4. 21
23
10340.4
170
!.56
8,940. 727
0.6
151.1
1312.4
139. 3!1.6
I 562.3
7. 78
EN T RAN CE
COMPONENT STA
OPERATING CONDITIONS AT VARIOUS STATIONS
Reference Figure 37PRESS TEMP DEW WATER*MASS*FLOW REL VOL RATIO
PSIA DEG F POINT LIQUID VAPOR HUM GAS/LIQ
CHK VALVE 0 i 4. 7 74.0 • "/3
PUMP ! 13. 7 "/9.9 22.00
REGEN H/E 5 53.0 93. 5 22.00REGEN MIX 6 52-0 147-2 5.50
ELEC HOD 7 51.0 106.9 22.00
REGEN H/E 8 49.0 147.2 21.22PRIM H/E 10 48.0 134.9 21.23
PHASE SEP 11 46.0 80.1 21.27
H2 REG 13 41.5 80. I 77.0 .00
14 14. 7 80. 1 47. 6 .0025.0 8e. I 62.2 .00
• 0547 16.460
• 0400 16. 196
• 0080 I 4.843• 0080 .902
• 0080 • 320
• 0080 • 543
02 REG 15 62.5 115.0 103.0 .00 .0061 .70716 14.7 127.0 58,7 .00 ,0061 .119
25.0 127.0 74.0 .00 .0061 .202
PRIM H/E 20 75.0 150.00
COLD PLATE 21 83. 1 150.00
22 95. 6 150.00
MOL
WT
3. 148
2.861
2. 193
107

W ES* 2 TABLE XXII CASE l|4
ELECTROLYSIS SYSTEM PERFORMANCE
NO. CELLS i 3ELEC MOD STKS IN PARALLEL ICELL ACT AREA 33.2 SQ IN.CELL DI AM(ACTI VE) 6.5 IN.
CELL VOLTAGE i. 775 VOLTSMODULE TERH VOLTAGE 23,08 VOLTSAVAIL MOD INPUT VOLTS 22 VOLTSMODULE INPUT CURRENT 74.99 AMPDESI_ CURRENT DENSITY 323.8 ASFPERM LOSS(EQUIV J) 1.43 ASF
OPERATING CURRENT DENSITY 325.3 ASFELECT MOD TEMP RISE 39.9 DEG FM EAN CELL TEHP ! 28 DEG F
SUBSYSTEM OPERATING MODE CONTINUOUSHEAT GEN RATE 1015.9 B/HRHOD HEAT LOSS TO CABIN 78.22 B/HRHOD HEAT LOSS FACTOR !.447 B/HR-DEG FOXYGEN OUT TEMP FACTOR 0.2OXYGEN FLOW RATE 0. 639 LEVHROXYGEN PRODUCTION(LB/DAY) 15,33OXYGEN HEAT LOSS RATE 14.42 B/HR02 END PLATE HEAT LOSS RATE I. 73 B/HR
HYDROGEN FLOW RATE 0.0804 LB/HRWATER PUMPING RATE 22 LB/HRWATER SUPPLY RATE 0. 733
REGEN H/E EFFECTIVENESS 0.999"/C(COLD) 7.04C(HOT) 22. "/41
HEAT TRANS RATE 41 6. !HEAT TR/_S FACTOR 80BYPASS FLOW RATE 14.96BYPASS FLOW RATIO 0. (,8H/E EFFECT WITH BYPASS CORR 0.32
B/H R- DEG FB/H R- DEG FB/H RB/H R- DEG FLB/HR
PRIM H/E EFFECTIVENESS 0.5"/58SPECIFIC HEAT OF COOLANT 0.89C(COLD) 150C(HOT) 22. {}38
HEAT TRANS RATE 1191,4HEAT TRANS FACTOR 20
B/LB- DEG FB/H R- DE G FB/H R- DEG FB/H RB/H R- DEG F
POWER COND EFF(MIN) 0.812MAX CURRENT 83.99HEAT GENERATION RATE 1368. 1
POWER COND LOSS, WATTS 400.9POWER INPUT(HAX) 2. 219
AMP
B/H R
KW
NOM POWER SUPPLY VOLTAGE 28SUPPLY VOLT TOL, PCT 10.7
VOL TS
SUMMARY
108
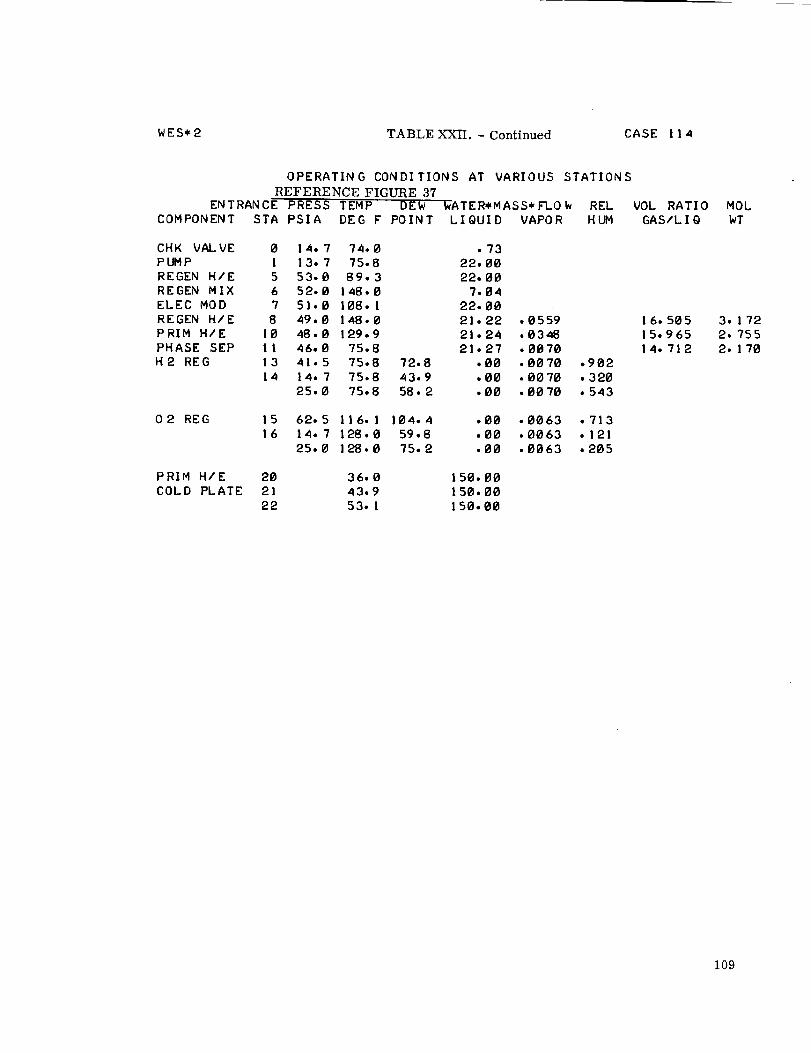
WES* 2 TABLE X3(II, - Continued CASE 1 1 4
OPERATING CONDITIONS AT VARIOUS STATIONS
REFERENCE FIGURE 37
ENTRANCE PRESS TEMP DEW WATER*MASS*FLOW REL VOL RATIO
COMPONENT STA PSIA DEG F POINT LIQUID VAPOR HUM GAS/LIQ
CHK VALVE 0 14.7 74.0 .73
PUMP I 13. 7 75.8 22.00
REGEN H/E 5 53.0 89. 3 22.00
REGEN MIX 6 52.0 148.0 7.84
ELEC MOD 7 51.0 108. I 22.00
REGEN H/E 8 49.0 148.0 21.22 .0559
PRIM H/E 10 48.0 129.9 21.24 .0348PHASE SEP !1 46.0 75.8 21.27 .0070
H2 REG 13 41.5 75.8 72.8 .00 .0070
14 14. 7 75.8 43.9 .00 .0070
25.0 75.8 58.2 .00 .0070
.902
• 320
• 543
1 6.50 5
15.965
14. 712
02 REG 15 62.5 116.1 104.4 .00 -0063
16 14. 7 128.0 59.8 .00 -0063
25.0 128.0 75.2 .00 .0063
.713
.121
• 205
PRIM H/E 20 36.0 150.00
COLD PLATE 21 43.9 150.00
22 53. I 150.00
MOL
WT
3. 1 72
2. 7552. 170
109

_ES,_2 TABLE xxnI CASE ! 15
ELECTROLYSIS SYSTEM PERFORMANCE SUMMARY
NO, CELLS I 3
ELEC MOD STKS IN PARALLEL I
CELL ACT AREA 33,2 SQ IN,
CELL D° AM(ACTI VE) 6,5 IN.
CELL VOLTAGE I,'/?? VOLTS
MODULE TERM VOLTAGE 23, I VOLTS
AVAIL MOD INPUT VOLTS 22 VOLTS
MODULE INPUT CURRENT "/4.99 AMP
DESIG_ CURRENT DENSITY 323.8 ASF
PERM LOSS(EQUIV J) 1.41 ASF
OPERATING CURRENT DENSITY 325,2 ASF
ELECT HOD TEMP RISE 40.2 DEG F
M EAN CELL TEHP I 2"/, 3 DEG F
SUBSYSTEM OPERATING MODE
HEAT GEN RATE 1020. I
HOD HEAT LOSS TO CABIN ./'/.I
HOD HEAT LOSS FACTOR 1,44'/
OXYGEN OUT TEMP FACTOR 0,2
OXYGEN FLO_ RATE 0, 639
OXYGEN PRODUCTI ON (L EV DAY) 15.33
OXYGEN HEAT LOSS RATE 14, I
02 END PLATE HEAT LOSS RATE 1.74
CONTINUOUS
B/H R
B/H R
B/HR- DEG F
LEVHR
B/H R
B/H R
HYDROGEN FLOk RATE
_VATER PUMPING RATE
_'ATER SUPPLY RATE
0, 0804 LB/HR
22 L B/H R
0. ?34
REGEN H/E EFFECTIVENESS I
C(COLD) 4.4
C(HOT) 22.689
HEAT TRANS RATE 219,9HEAT TRANS FACTOR SO
BYPASS FLO_ RATE I ?,6
BYPASS FLOk, RATIO OoBH/E EFFECT _ITH BYPASS CORR 0°2
B/H R- DEG F
BtHR- DEG F
B/H RB/HR- DE G F
L B/H R
PRIM H/E EFFECTIVENESS
SPECIFIC HEAT OF COOL/_TC(COLD) ! 50
C(HOT) 22. I53
HEAT TRANS RATE
HEAT TRANS FACTOR
0. 5"/39
0,89
1190.8
20
B/L B- DEG F
B/HR- DEG F
B/H R- DE G FB/H R
B/H R- DEG F
PO_vER COND EFF(MIN)
MAX CURRENT
HEAT GENERATION RATE
PO_ER COND LOSS, kATTS
POWER INPUT(MAX)
0.812
84°04! 368
400.8
2.22
AMPB/H R
Kk
NOM PO_ER SUPPLY VOLTAGE
SUPPLY VOLT TOL,PCT
VOLTS
110

WES* 2 TABLE.XXTIT. - Co=l:inued CASE I I 5
OPERATIL',I( CONDITIOn, S AT VARIOUS STATIO_IS
REFERENCE FIGURE 37
ENTRANCE PRESS TEMP DEk kATER*MASS*FLOV, REL VOL RATIO
COMPONENT STA PSIA DE6 F POI_'qT LIQUID VAPOR HUM GAS/LIQ
CHK VALVE 0 14. 7 74.0 • 73
PUMP I 13. 7 83. 6 22.00
REGE=_I H/E 5 53.0 97.2 22.00
REGEN MIX 6 52.0 147.4 "4.40
ELEC MOD 7 51.0 107.2 22.00
REGEN HIE 8 49.0 147.4 21.22
PRIM HIE 10 '48.0 137. 7 21.23
PHASE SEP 1 1 '46.0 83.9 21.27H2 REG 13 41.5 83.9 80. 7 .00
14 14. 7 83.9 50.9 .00
25.0 83.9 65. 7 .00
• 0550 16.471
• 0432 16.328
• 0091 I'4.961
• 009| .902
• 0091 .320
• 0091 .543
02 RE6 15 &2.5 115,2 103.3 .00 .0061 .70816 1'4.7 127.3 59.0 .00 .0061 • 119
25.0 127.3 7'4.3 .00 .0061 .203
PRIM H/E 20 4'4.0 150.00COLD PLATE 21 51.9 150.00
22 61- ! 150.00
MOL
kT
3. 154
2. 923
2.216
111

_ES*2 TABLE XXIV
DESIGN P oiler
ELECTROLYSIS SYSTEM PERFORM/_CE SUMMARY
CASE 132
NO, CELLS I 3
ELEC HOD STKS IN PARALLEL I
CELL ACT AREA 33,2 SQ IN.
CELL DIAM(ACTIVE) 6,5 IN.
CELL VOLTAGE !* 704 VOLTS
MODULE TEN'H VOLTAGE 22.15 VOLTS
AVAIL MOD INPUT VOLTS 22 VOLTS
MODULE INPUT CURRENT 49,06 AMP
DESIGN CURRENT DENSITY 211,2 ASF
PERM LOSS(EQUIV J) 1.56 ASF
OPERATING CURRENT DENSITY 2|2.8 ASF
ELECT HOD TEMP RISE 36.7 DEG FMEAN CELL TEMP 123.9 DEG F
SUBSYSTEM OPERATING MODEHEAT GEN RATE 518. I
MOD HEAT LOSS TO CABIN 72.25
MOD HEAT LOSS FACTOR 1,44"/
OXYGEN OUT TEMP FACTOR 0.2
OXYGEN FLOW RATE 0.417
OXYGEN PRODUCTI ON(L B/DAY) 10
OXYGEN HEAT LOSS RATE 9.3`4
02 END PLATE HEAT LOSS RATE 1.09
CON TI NUOUSB/H R
B/HR
B/HR- DEG F
LB/H R
BIH R
BIH R
HYDROGEN FLOW RATE
WATER PUMPING RATE
WATER SUPPLY RATE
B,052,4 LB/HR
]0. 6 LB/HR
0. 475
REGEN H/E EFFECTIVENESS I
C(COLD) `4, 2.4
C(HOT) 10,923
HEAT TRANS RATE 273. 6HEAT TRANS FACTOR 80
BYPASS FLOW RATE 6,36BYPASS FLOW RATIO 0,,6
HIE EFFECT WITH BYPASS CORR 0.4
B/H R- DEG F
B/H R- DEG FB/H R
B/HR- DEG F
L B/HR
PRIM H/E EFFECTIVENESS 0,8381SPECIFIC HEAT OF COOLANT 0,89
C(COLD) 150
C(HOT) 10.514
HEAT TRANS RATE 723,1
HEAT TRANS FACTOR 2@
B/L B- DEG F
B/H R- DEG FB/HR- DEG F
B/H R
B/H R- DEG F
POWER COND EFF(MIN) 8.805MAX CURRENT 52, 76 AMP
HEAT GENERATION RATE 901 B/HR
POWER COND LOSS_,WATTS 264
POWER INPUT(MAX) !.438 KW
NOM POWER SUPPLY VOLTAGE 26
SUPPLY VOLT TOL. PCT 10,'/
VOLTS
112

NES*2 TABLE XXIV. - Continued CASE i 32
OPERATING CONDITIONS AT VARIOUS STATIONS
REFERENCE FIGURE 37
ENTRANCE PRESS TEMP DEt_ _,ATER*MASS*FLO_ REL VOL RATIO
COMPONENT STA PSIA DEG F POINT LIQUID VAPOR HUM GAS/LIQ
CHK VALVE 0 14,7 74,0 ,48
PUMP I 1 3, 7 50, 4 10, 6@
REGEN H/E 5 53,0 78, 7 10, 60
REGEN MIX 6 52,0 143,3 4,24
ELEC MOD 7 51,0 104,6 10,60
REGEN H/E 8 49.0 1.43.3 10,09 ,0321
PRIM HIE 10 48,0 liB,1 10.11 ,0162
PHASE SEP II 46.0 49,3 10,12 ,0018
H2 REG 13 41,5 49,3 46,5 ,00 ,0018
14 14,7 49,3 21,9 ,00 ,0018
25,0 49,3 33,5 ,00 ,0018
.902
.320
.543
02 REG 15 62.5 112,3 106,7 .00 .0044 .851
16 14. 7 123.9 61.8 ,00 .0044 ,14525.0 123,9 77,3 ,00 ,0044 ,246
PRIM H/E 20 36,0 150,00
COLD PLATE 21 40,8 150,00
22 46.8 t 50, 00
22, 29421.2t8
19. 10_
MOL
kT
3,043
2. 55 !2.076
113

WES*2 TABLEXXV CASEI_3
ELECTROLYSIS SYSTEM PERFORMANCE SUMMARY
NO. CELLS I 3
ELEC MOD STKS IN PARALLEL I
CELL ACT AREA 33.2 SQ IN.
CELL DIAM(ACTIVE) 6.5 IN,
CELL VOLTAGE I. 665 VOLTS
MODULE TERM VOLTAGE 21.65 VOLTS
AVAIL HOD INPUT VOLTS 22 VOLTS
MODULE INPUT CURRENT 32,83 AMP
DESIGN CURRENT DENSITY t40,9 ASF
PERM LOSS(EQUIV J) 1.51 ASF
OPERATING CURRENT DENSITY lA2.4 ASF
ELECT MOD TEMP RISE 20.8 DEG F
MEAN CELL TEMP !14.3 DEG F
SUBSYSTEM OPERATING MODE
HEAT GEN RATE 296,3
HOD HEAT LOSS TO CABIN 58,26
MOD HEAT LOSS FACTOR 1.4A'/OXYGEN OUT TEMP FACTOR 0.2
OXYGEN FLOW RATE 0.278
OXYGEN PRODUCTION(LB/DAY) 6, 67
OXYGEN HEAT LOSS RATE 5,46
02 END PLATE HEAT LOSS RATE 0. 39
CON TINUOUS
B/H R
B/H R
B/H R- DE G F
L B/HR
B/H R
B/H R
HYDRO GEN FLOW RATE
WATER PUMPING RATE
WATER SUPPLY RATE
0.035
10.6
0.317
L B/HR
L B/HR
REGEN H/E EFFECTIVENESS
C(COLD) 5,83
C(HOT) 10. 655
HEAT TRANS RATE 2"/0.3
HEAT TRANS FACTOR SO
BYPASS FLOW RATE 4,"/7
BYPASS FLOW RATIO 0.45
H/E EFFECT WITH BYPASS CORR 0.55
0.9991
B/H R- DEG FB/H R- DEG F
B/H R
B/HR- DEG FL B/HR
PRIM H/E EFFECTIVENESSSPECIFIC HEAT OF COOLANT
C(COLD) 150
C(HOT) 10. 506
HEAT TRANS RATE
HEAT TRPu_IS FACTOR
0.8383
0.89
523, 4
20
B/LB- DEG F
B/H R- DEG F
B/H R- DE G FB/H R
B/H R- DEG F
POWER COND EFF(MIN)
MAX CURRENT
HEAT GENERATION RATEPOWER COND LOSS, WATTS
POWER INPUT(MAX)
0, 799
34. 3
608 • 5
178,30.977
AM P
B/H R
KW
NOM POWER SUPPLY VOLTAGESUPPLY VOLT TOL,PCT
28
10. '/
VOLTS
114

WES*2TABLE XXV. - Continued CASE 143
EN T RAN C E
COMPONENT STA
OPERATING CONDITIO._S AT VARIOUS STATIONS
REFERENCE FIGURE 37.
PRESS TEMP DEW I_ATER*MASS*FLOW REL VOL RATIO
PSIA DEG F POINT LIQUID VAPOR HUM GAS/LIQ
CHK VALVE 0 14. 7 74.0PL_IP I I 3. 7 50. 3
REGEN H/E 5 53.0 78. 5
REGEN MIX 6 52,0 124.6
ELEC MOD 7 51.0 103.9REGEN H/E 8 49.0 124. 6
PRIM H/E 10 48,0 99,4
PHASE SEP 1 I 46.0 49. 6H2 REG 13 41.5 49.6
14 14.7 ,49.625.0 49. 6
.32
10. 60
10. 60
5.83
10. 60
10.27 .0128
10.28 • 0062
10.28 .0012
46.9 -00 .0012 .90222.2 .00 ,0012 ,320
33.8 . 00 . 0012 . 543
02 REG 15 62.5 108.0 104.9
16 14.7 114.3 60.3
25.0 IIA. 3 75,, 7
PRIM H/E 20 40,0
COLD PLATE 21 43,5
22 4 7.5
13.863
13.333
12.554
• 00 ,0028 .913
• 00 ,0028 • 179• 00 ,00_ .305
150.00
150.00
150.00
M0L
kT
2. 645
2. 327
2. 077
115
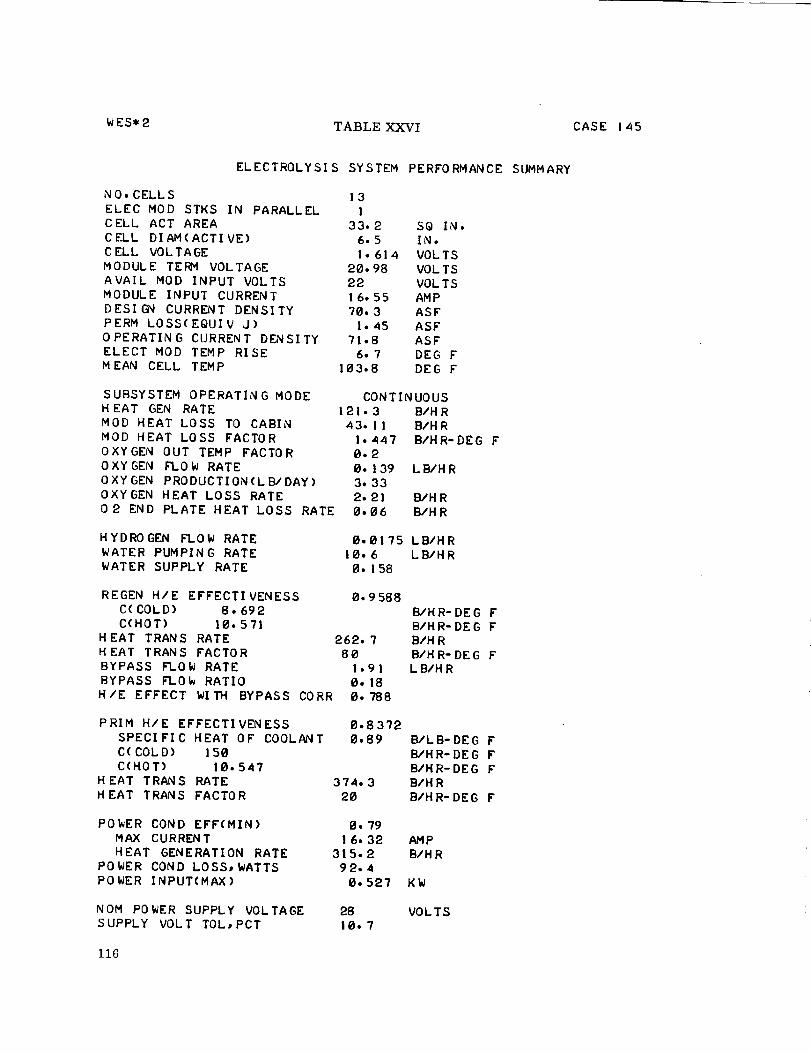
WES*2 TABLEXXVI CASE !,45
ELECTROLYSIS SYSTEM PERFORMANCE SUMMARY
NO. CELLS !3
ELEC MOD STKS IN PARALLEL ICELL ACT AREA 33.2 SQ IN.
CELL DI AM(ACTI VE) 6.5 IN.
CELL VOLTAGE 1.614 VOLTS
MODULE TERM VOLTAGE 20.98 VOLTS
AVAIL MOD INPUT VOLTS 22 VOLTSMODULE INPUT CURRENT 16.55 AMP
DESIG_ CURRENT DENSITY 70.3 ASF
PERM LOSS(EQUIV J) 1.45 ASF
OPERATING CURRENT DENSITY 71.B ASFELECT MOD TEMP RISE 6. 7 DEG F
MEAN CELL TEMP 103.8 DEG F
SUBSYSTEM OPERATING MODEHEAT GEN RATE 121.3MOD HEAT LOSS TO CABIN 43. I1MOD HEAT LOSS FACTOR 1,4,47OXYGEN OUT TEMP FACTOR 0.2OXYGEN FLOW RATE 0. 139
OXYGEN PRODUCTION(LB/DAY) 3, 33
OXYGEN HEAT LOSS RATE 2.2102 END PLATE HEAT LOSS RATE 0,06
CONTINUOUS
B/H RB/H R
B/H R- DEG F
LB/HR
B/H R
B/H R
HYDROGEN FL.OW RATE
WATER PUMPING RATE
WATER SUPPLY RATE
0. O175 LB/HR10.6 LB/HR
0. 158
REGEN H/E EFFECTIVENESSC(COLD) 8,692C(HOT) 10. 571
HEAT TRANS RATE 262. 7HEAT TRANS FACTOR 80
BYPASS FLOW RATE 1.91BYPASS FLOW RATIO 0. 18H/E EFFECT WITH BYPASS CORR 0. 788
0.9568
B/HR- DEG FB/HR- DE G FB/H RB/H R- DEG FLB/HR
PRIM H/E EFFECTIVENESSSPECIFIC HEAT OF COOLANTC(COLD) 150C(HOT) |0.547
HEAT TRANS RATEHEAT TRANS FACTOR
0.8372
0,89 B/L B- DEG FB/H R- DEG FB/H R- DEG FB/H RB/H R- DEG F
POWER COND EFF(MIN)MAX CURRENTHEAT GENERATION RATE
POWER COND LOSS, WATTSPOWER INPUT(MAX)
0. 79! 6.32
315.292.4
0. 527
AMPB/H R
KW
NOM POWER SUPPLY VOLTAGESUPPLY VOLT TOL,PCT
VOLTS
i16

WES*2 TABLE XXVL - Continued CASE 145
ENTRANCE
COMPONENT STA
OPERATING CONDITIONS AT VARIOUS STATIONS
REFERENCE FIGURE 37.
PRESS TEMP DEW WATER*MASS*FLOW REL VOL RATIO
PSIA DEG F POINT LIQUID VAPOR HUM GAS/LIQ
CHK VALVE 0 14. 7 74.0
PUMP 1 13. 7 47. 3REGEN H/E 5 53.0 75. 5
REGEN MIX 6 52.0 105.9
ELEC M0D 7 51.0 100-4REGEN H/E 8 49.0 107. 1
PRIM H/E 10 48.0 82.4
PHASE SEP I I 46.0 46.9
H 2 REG I 3 41.5 46.9
14 14. 7 46.9
25.0 46.9
.16
10. 6010. 60
8. 69
10. 60
10.44 .003810.44 ,0018
10.44 • 0005
. 44.2 .00 .0005 .902
20. I • 00 • 0005 • 320
31.4 .00 .0005 .543
02 REG 15 62.5 101.8 100.4
16 14.7 103.8 56.525.0 103.8 71. 7
PRIM H/E 20 40.0
COLD PLATE 21 42, 5
22 44.6
6. 5286. 320
6. 138
• 00 .0012 .960
.00 .0012 .213
.00 .0012 .361
150.00
150.00
150.00
MOL
_T
2. 400
2. 199
2.071
117