N2: Phosphorus Need Filtration or Equivalent ... · Demonstration Testing Prepares Communities for...
36
Need Filtration or Equivalent? Demonstration Testing Prepares Communities for Low Level Phosphorus Wisconsin Wastewater Operators Association 2014 Annual Conference KI Center Green Bay, WI October 9, 2014 Eric Lynne, P.E. N2: Phosphorus
Transcript of N2: Phosphorus Need Filtration or Equivalent ... · Demonstration Testing Prepares Communities for...
Need Filtration or Equivalent? Demonstration Testing Prepares
Communities for Low Level Phosphorus
Wisconsin Wastewater Operators Association 2014 Annual Conference KI Center Green Bay, WI October 9, 2014 Eric Lynne, P.E.
N2: Phosphorus

Presentation Will Cover......
1. Background
2. Technology Review
3. Demonstration Tests
a) RESULTS!?!
b) Key Points
4. Wrap Up and Questions

1 – Background
….NR102/NR217
2010: 7-9 yrs to construct filters or equivalent
Demonstration Tests
Performance
O&M costs
Operability/Familiarity
You Get What You Pay For!
Basic 2 Steps:
Conversion to Particulate
Removal of Particulate
2 – Technology Review

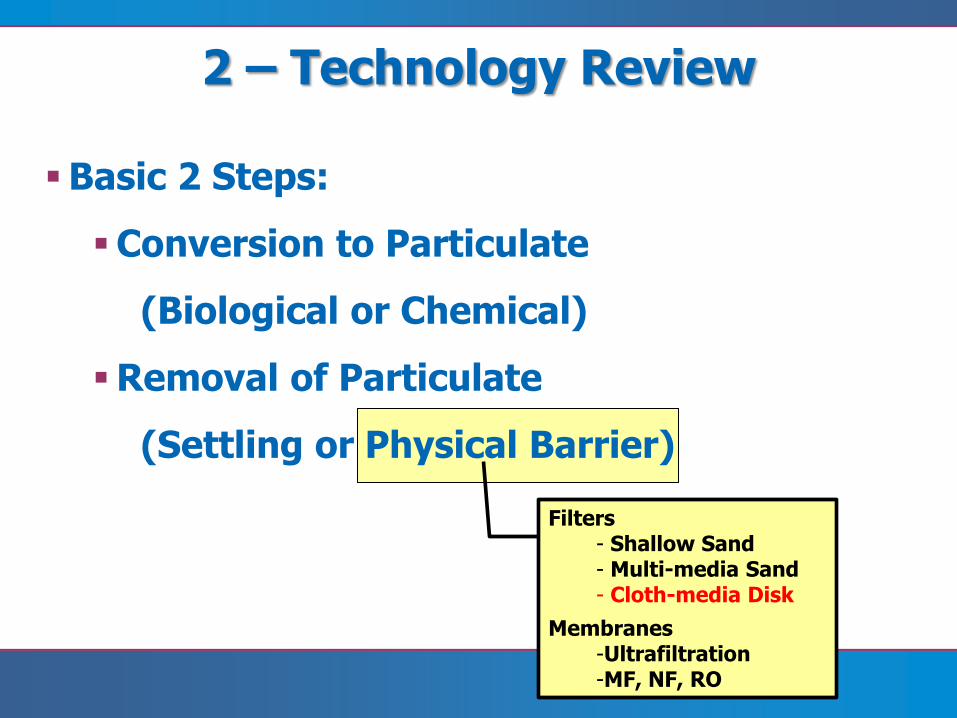
Basic 2 Steps:
Conversion to Particulate
(Biological or Chemical)
Removal of Particulate
(Settling or Physical Barrier)
2 – Technology Review
- Multi-Point - Rapid Mix - Flocculation - Coagulant Selection - pH Adjustment

2 – Technology Review
Basic 2 Steps:
Conversion to Particulate
(Biological or Chemical)
Removal of Particulate
(Settling or Physical Barrier)
Lagoons, Clarifiers, High-Rate Clarifiers
2 – Technology Review
Basic 2 Steps:
Conversion to Particulate
(Biological or Chemical)
Removal of Particulate
(Settling or Physical Barrier)
Filters - Shallow Sand - Multi-media Sand - Cloth-media Disk
Membranes -Ultrafiltration -MF, NF, RO
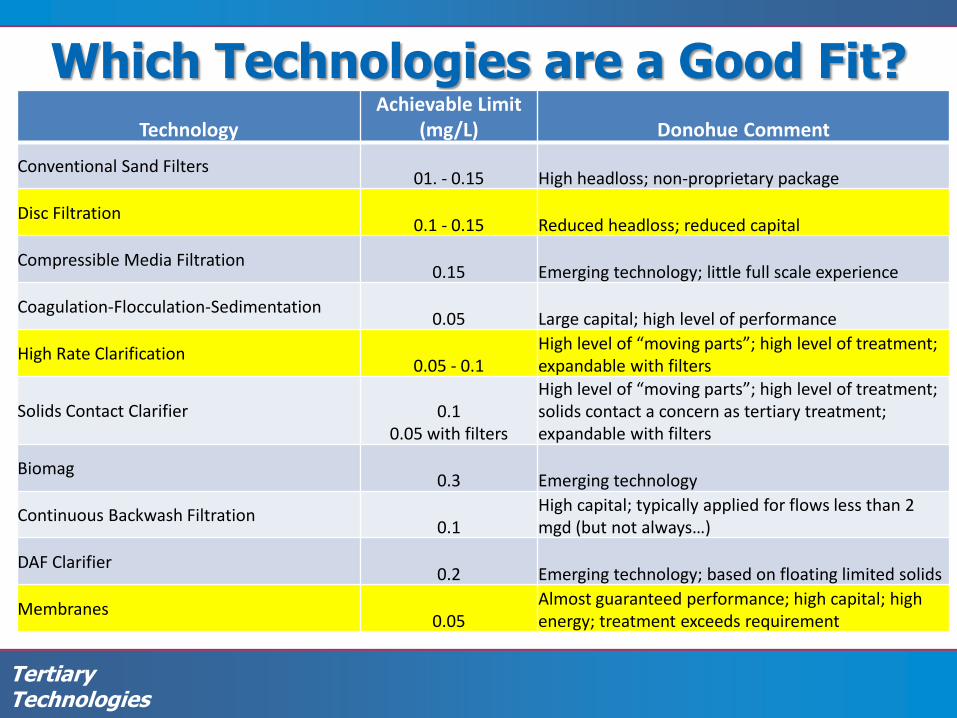
Which Technologies are a Good Fit?
Technology Achievable Limit
(mg/L) Donohue Comment
Conventional Sand Filters 01. - 0.15 High headloss; non-proprietary package
Disc Filtration 0.1 - 0.15 Reduced headloss; reduced capital
Compressible Media Filtration 0.15 Emerging technology; little full scale experience
Coagulation-Flocculation-Sedimentation 0.05 Large capital; high level of performance
High Rate Clarification 0.05 - 0.1
High level of “moving parts”; high level of treatment; expandable with filters
Solids Contact Clarifier 0.1 0.05 with filters
High level of “moving parts”; high level of treatment; solids contact a concern as tertiary treatment; expandable with filters
Biomag 0.3 Emerging technology
Continuous Backwash Filtration 0.1
High capital; typically applied for flows less than 2 mgd (but not always…)
DAF Clarifier 0.2 Emerging technology; based on floating limited solids
Membranes 0.05
Almost guaranteed performance; high capital; high energy; treatment exceeds requirement
Tertiary Technologies

Ultrafiltration Membranes
Capital Cost
Membrane Replacement Cost
Energy Cost
Typically a “worst-case” placeholder for Long-Term Planning
2 – Technology Review
What about those other technologies?

Jackson, WI (2010)
Filter Replacement (1.37 mgd avg)
– What about future TP requirements (0.075 mg/L)
Membrane/CBW Filters/Actiflo = 0.075
– still need RM/Coag/Floc
Disk Filter mfrs would not guarantee 0.075
– TP depends on the WWTP
– Might tout 0.1 mg/L TP as long as influent is “good” (<15 TSS and <0.3 TP)
– 0.075 mg/L TP if piloted

2013 WI Testing:
Hydrotech Discfilter
(<0.1 mg/L)
Actiflo
(<0.075 mg/L)
3 – Demonstration Testing

3 – Demonstration Testing
Cloth Media Filters (Hydrotech Discfilter)
Sun Prairie
Sun Prairie
Beloit
Brookfield
HOV
Stevens Point
3 – Demonstration Testing
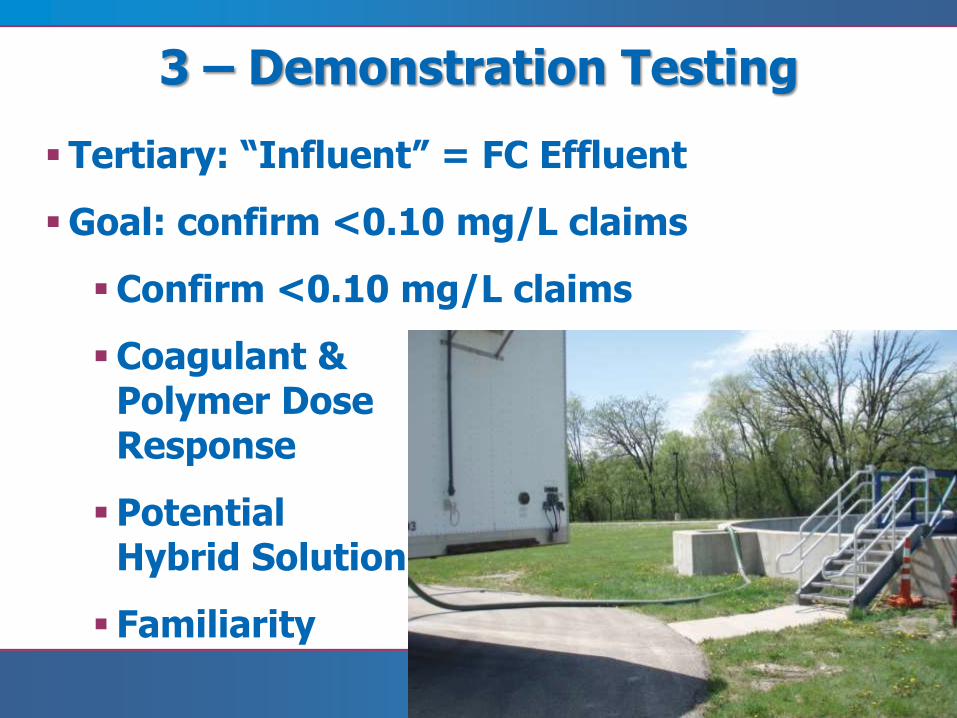
Tertiary: “Influent” = FC Effluent
Goal: confirm <0.10 mg/L claims
Confirm <0.10 mg/L claims
Coagulant & Polymer Dose Response
Potential Hybrid Solution
Familiarity
3 – Demonstration Testing
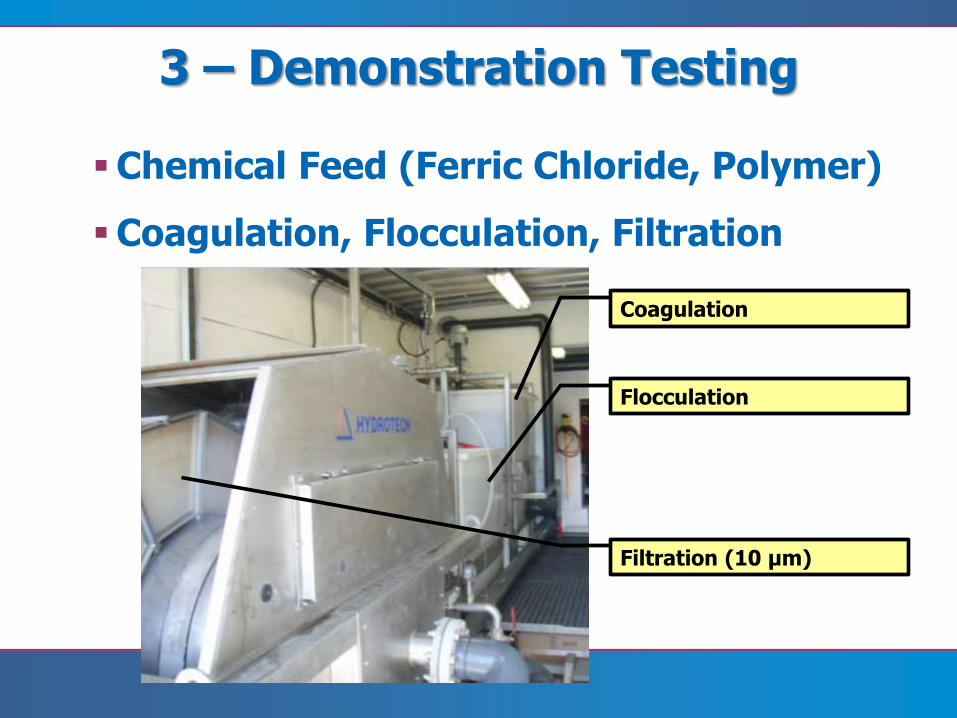
Chemical Feed (Ferric Chloride, Polymer)
Coagulation, Flocculation, Filtration
Coagulation
Flocculation
Filtration (10 μm)

3 – Demonstration Testing
Larger Particle Size = Easier Separation
Floc

0.000
0.075
0.150
0.225
0.300
0.375
0.450
0 10 20 30 40 50 60 70 80
Effluent TP
(mg/L)
Molar Ratio (Me:P)
Beloit
HOV
Stevens Point
Brookfield
3 – Demonstration Testing
Results: Compiled Data

Check the units!
Reported as mg/L
mg/L as Fe or Ferric Chloride?
3 – Demonstration Testing

Changes to the “influent” shift the molar
Case 1: Influent TP = 0.26 mg/L Effluent TP = 0.06 mg/L Removal = 0.20 mg/L
Fe:P Molar Ratio = 31
Case 2: Influent TP = 0.19 mg/L Effluent TP = 0.06 mg/L Removal = 0.13 mg/L
Fe:P Molar Ratio = 48
Situation: Constant Dose 60 mg/L Ferric Sulfate ~ 11.3 mg/L as Fe
3 – Demonstration Testing
3 – Demonstration Testing
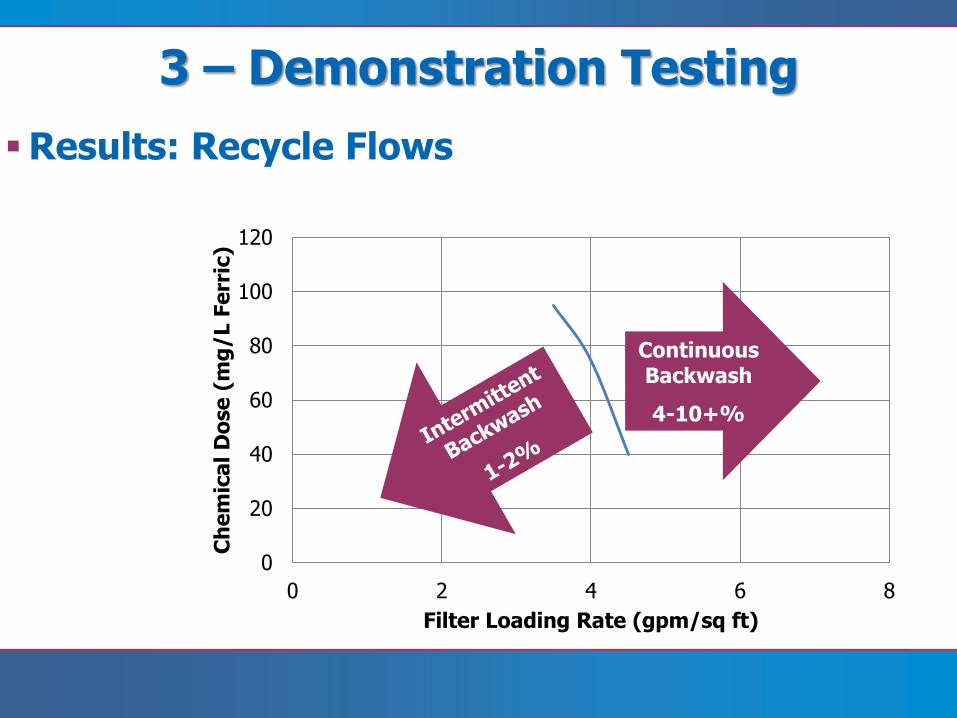
Results: Recycle Flows
0
20
40
60
80
100
120
0 2 4 6 8
Ch
em
ica
l D
ose
(m
g/L F
err
ic)
Filter Loading Rate (gpm/sq ft)
Continuous Backwash
4-10+%

3 – Demonstration Testing
Key Points
Sampling Requirements
LOD/LOQ for <0.075 Accuracy
Multiple vials per day/setup
Lab turn around
In-house vs. Commercial Lab
Operations
Normal vs. Stress-test the pilot

3 – Demonstration Testing
Discfilter:
- Exceeded goal of 0.1 mg/L Eff TP
- Sustained <0.075 mg/L when influent TP was <0.3 mg/L
- Staff enthusiastic about process simplicity
- Chemical dose ~ 18-25 molar ratio

3 – Demonstration Testing
Compliance Note:
0.075 mg/L (or 0.1 mg/L) on a 6-mo avg
Monthly limit = 3x
With one month excursion up to 0.2 mg/L
- Avg Day needs to be <0.05 mg/L
- Mass Balance = Right-size filters
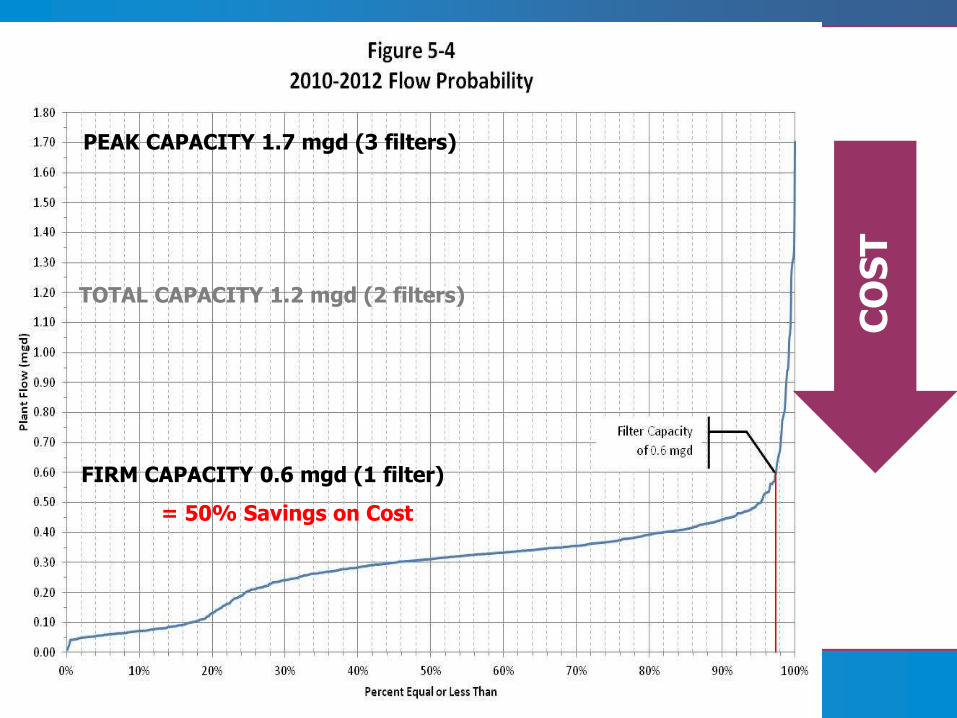
FIRM CAPACITY 0.6 mgd (1 filter)
TOTAL CAPACITY 1.2 mgd (2 filters)
PEAK CAPACITY 1.7 mgd (3 filters)
CO
ST
= 50% Savings on Cost


2013 WI Testing:
AquaDisk (Beloit, Brookfield, Sheboygan)
(<0.075 mg/L)
4 – Other Manufacturers

4 – Other Manufacturers

4 – Other Manufacturers

4 – Other Manufacturers
Keep “influent” <0.6 mg/L TP

4 – Other Manufacturers

4 – Other Manufacturers

Capital Cost (it depends)
Need for pumping
Structure
Land
Chemical System
$1.0 – 2.0 million/mgd
5 - Cost

Helps to have optimal “influent”
Use online analyzers
Caution on downstream side
consider manual only based on a steady molar ratio to handle the remaining P.
5 – Cost

Main Plant Chem Feed: 4.5 mg/L down to 0.8
mg/L; molar ratio ~ 2:1
Tertiary Filter Chem Feed: 0.8 down to 0.05; molar = 25:1
5 – Cost
Inputs Case 1 Case 2
Total Wastewater Flowrate to Process gpm 694 694
Total Wastewater Flowrate to Process MGD 1.000 1.000
Number of Parallel Ferric Feed Points in Process 1.0 1.0
Influent P Concentration to Process mg/L 4.5 0.8
Est. P Taken Up Biologically Within Process mg/L 0.0 0.0
Target Process Effluent TP Concentration mg/L 0.8 0.05
Dosage Calculations
P to be Removed Chemically mg/L 3.7 0.8
Target Fe to P Molar Ratio 2.00 25.00
Fe Dosage mg/L 13.3 33.8
Total FeCl3 Solution Feed Rate gal/hour 3.7 9.3
Ferric Chloride Cost
Ferric Price $/DT 400 400
Daily Cost of Ferric $/day $ 22 $ 56
Annual Cost of Ferric $/yr $ 8,124 $ 20,585
Ferric Price $/DT 500 500
Daily Cost of Ferric $/day $ 28 $ 70
Annual Cost of Ferric $/yr $ 10,155 $ 25,731
+$50-70/mgd/day
Or
$8-11/lb (chemical cost)
$20-30/mgd/day

“Clean Waters Healthy Economy Act”
$50/lb - $10/lb Ferric Cost (conservative) $40/lb contrast with capital cost
$40/lb @ 0.8 mg/L @ 1 mgd ~ $100,000/yr
$100k/yr debt service = $1.4 million project
Essentially Equal, variance wins if
effluent is optimized

Questions
ERIC LYNNE, P.E.
3311 WEEDEN CREEK ROAD
SHEBOYGAN, WI 53081
PHONE 920-803-7375
Contact Info