n We a 2011 Norms Report
268
RIT Scale Norms Study For use with Northwest Evaluation Association Measures of Academic Progress ® (MAP ® ) and MAP for Primary Grades 2011 Revised January 2012
Transcript of n We a 2011 Norms Report

8/10/2019 n We a 2011 Norms Report
http://slidepdf.com/reader/full/n-we-a-2011-norms-report 1/268
RIT Scale Norms Study
For use with Northwest Evaluation Association
Measures of Academic Progress® (MAP®) and MAP for Primary Grades
2011
Revised January 2012

8/10/2019 n We a 2011 Norms Report
http://slidepdf.com/reader/full/n-we-a-2011-norms-report 2/268
ii | N W E A 2 0 1 1 R I T S c a l e N o r m s
Copyright © 2011 Northwest Evaluation Association
All rights reserved. No part of this manual may be reproduced or utilized in any form orby any means, electronic or mechanical, including photocopying, recording, or by anyinformation storage and retrieval system, without written permission from NWEA.
Northwest Evaluation Association
121 NW Everett StreetPortland, OR 97209
www.nwea.orgTel 503-624-1951Fax 503-639-7873Email [email protected]
To cite this report, the recommended bibliographic entry is as follows:
Northwest Evaluation Association. (2011). RIT Scale Norms: For Use with Measures of AcademicProgress (MAP®) and MAP® for Primary Grades. Portland, OR: Author.

8/10/2019 n We a 2011 Norms Report
http://slidepdf.com/reader/full/n-we-a-2011-norms-report 3/268
N W E A 2 0 1 1 R I T S c a l e N o r m s | ii i
Document Revisions
This version of the 2011 RIT Scale Norms Study Document contains the following updates from the
September 2011 version:
•
Updated Table 2.1 – (page 7) added grade K for reading and mathematics• Updated Table 2.2 – (page 10) added grade K for reading and mathematics as growth and status
tests
• Chapter 4 – (page 21) slight changes to eliminate use of gender in pronouns
• Updated “Instructional and Testing Calendar” section – (page 21) added two sentences to note
the exceptions for grade 2 language usage and kindergarten growth
• Updated Tables 4.1 and 4.2 – (pages 24 & 26) added notes to describe parameters, and
eliminated upper (redundant) triangle in the sampling variance-covariance matrices
• Updated “Procedural differences” section – (page 26, now page 27) removed references to
kindergarten
• Updated Tables 5.1 and 5.3 – (pages 30 & 32) changed kindergarten status means and standard
deviations for winter and spring terms to values estimated from the comprehensive multi-level
model. Also added means and standard deviations for term-to-term kindergarten growth.
• Updated Tables B.2 & B.3 (reading) and B.8 & B.9 (math) – (pages 54-57 & 66-69) changed
kindergarten status percentiles for winter and spring
• Inserted new tables C.1 (kindergarten reading, pages 86-88) & C.21 (kindergarten math, pages
159-161) and renumbered remaining tables
• Modified Table C.11 (now C.12) – (pages 128-130) deleted starting weeks 32 and 36 to correct
for the absence of grade 1 test performance for estimating grade 2 language usage growth

8/10/2019 n We a 2011 Norms Report
http://slidepdf.com/reader/full/n-we-a-2011-norms-report 4/268
iv | N W E A 2 0 1 1 R I T S c a l e N o r m s
Acknowledgments
Few research studies are solely the result of their authors’ thought and effort, especially if the study
results are to be integrated into an operational setting. This study is certainly not one of the exceptions.
To the extent it has been successful is due, in no small part, to the shared expertise and generous
contributions of several individuals.
Pam Woodrow’s skills in organizing and negotiating the sundry aspects of this project through various
teams and subgroups without compromising its critical research aspects can only be described as
remarkable. Rebecca Ronshaugen provided not only valuable historical context but also helped us and
the entire project team understand how the study results could be integrated into the current reporting
system. Matt Hicks’s encouragement throughout the project and his enthusiasm for expanding the
current reporting system to incorporate more of the study’s capabilities is most appreciated.
Implementation of the study results into reporting tools were carried out by several key individuals.
Srinivasan Kannan is instrumental to developing the Achievement Status and Growth (ASG) Calculator.
Chris Gantz led the design of the ASG user interface and instructions. Nick Dechativong developed the
code to import the study results into the reporting system and to update historical test events with the new
norm information. He was also the go-to guy for all the post-release updates. Bonnie Boone-Altshuld,
Deb Adkins, and Jane Kauth made sure that the results appearing in the reporting system and in this
report are the intended results and are in their intended places. Barbara Mullins and Melanie Gaspro
provided very helpful information from the Professional Development and Technical Support
perspectives. Dr. Gage Kingsbury, Dr. Lingling Ma, Dr. Wei He, Dr. John Cronin, Dr. Shudong Wang, and
Dr. Steve Wise provided many thoughtful and helpful suggestions and comments to an earlier draft of this
document. Molly Held demonstrated once again why we consider her editing skills to be second to none.
Not only does Molly correct our grammar and punctuation, but she also suggests sentence constructions
and paragraph restructuring that most all readers will be grateful for.
And, finally, because of the contributions of our colleagues named above, we felt confident that readers
will find this document invaluable to their understanding of how students attending U.S. public schools
learn over time as measured by NWEA’s Measures of Academic Progress. Any errors remaining are of
course the sole responsibility for the authors.
Yeow Meng Thum, Ph.D.
Carl Hauser, Ph.D.
September, 2011

8/10/2019 n We a 2011 Norms Report
http://slidepdf.com/reader/full/n-we-a-2011-norms-report 5/268
N W E A 2 0 1 1 R I T S c a l e N o r m s | v
Table of Contents
Acknowledgments............................................................................................................................................ iv
Prologue ................................................................................................................................................... xv
Chapter 1 - Introduction .................................................................................................................................. 1
Chapter 2 - Test Structures and Pools of Candidate Test Events ..................................................................... 7
Chapter 3 - Approximating the Reference Population with Post-Stratification Adjustment ........................ 11
Chapter 4 - Norms Development Methodology ............................................................................................ 21
Chapter 5 - Grade Level Status and Growth Norms ....................................................................................... 29
References .................................................................................................................................................. 35
Appendix A - Test Record Pools by Content Area, Grade Level and State for Fall, 2009 and Spring,
2010 .......................................................................................................................................... 39
Appendix B - Percentile Ranks of Achievement Status in Reading, Language Usage, Mathematics,
General Science, and Science Concepts & Processes ............................................................... 51
Appendix C - RIT Point Growth Norms in Reading, Language Usage, Mathematics, General
Science, and Science Concepts & Processes by Grade, by Starting Instructional
Week, by Starting RIT Score, and by Length of Instructional Interval ...................................... 85
Appendix D - Technical Details of Obtaining Status and Conditional Growth Norms Using a Multi-
level Growth Model ................................................................................................................ 247

8/10/2019 n We a 2011 Norms Report
http://slidepdf.com/reader/full/n-we-a-2011-norms-report 6/268
vi | N W E A 2 0 1 1 R I T S c a l e N o r m s
Table of Tables
Table 2.1. Number of Items Per Test by Content Area ................................................................................. 7
Table 2.2. Content Area – Grade Combinations by Type of Norm Provided .............................................10
Table 3.1. NCES Variables Used In the School Challenge Index (SCI) .........................................................12
Table 3.2. Estimated population weights for NWEA schools based on the proportions of
NWEA schools in each SCI decile for Connecticut and South Carolina. .................................19
Table 3.3. Distribution of raw SCI index values for Connecticut and South Carolina. ................................19
Table 4.1 Pseudo-maximum likelihood estimates for Reading in focal grade 3. ........................................24
Table 4.2 Pseudo-maximum likelihood estimates for Mathematics in focal grade 4. ................................26
Table 5.1. Means and Standard Deviations (sd) of Grade Level Status for READING and
Means and Standard Deviations (sd) of Growth to Subsequent Terms Assuming
Status Norms as Starting RIT Score ........................................................................................30
Table 5.2. Means and Standard Deviations (sd) of Grade Level Status for LANGUAGE USAGE
and Means and Standard Deviations (sd) of Growth to Subsequent Terms
Assuming Status Norms as Starting RIT Score .......................................................................31
Table 5.3. Means and Standard Deviations (sd) of Grade Level Status for MATHEMATICS
and Means and Standard Deviations (sd) of Growth to Subsequent Terms
Assuming Status Norms as Starting RIT Score .......................................................................32
Table 5.4. Means and Standard Deviations (sd) of Grade Level Status for GENERAL SCIENCE
and Means and Standard Deviations (sd) of Growth to Subsequent Terms
Assuming Status Norms as Starting RIT Score .......................................................................33
Table 5.5. Means and Standard Deviations (sd) of Grade Level Status for SCIENCE
CONCEPTS & PROCESSES and Means and Standard Deviations (sd) of Growth to
Subsequent Terms Assuming Status Norms as Starting RIT Score ........................................34
Appendix A – Test Event Pools ....................................................................................................................... 39
Table A.1. Fall 2009 READING Test Events Pool by State by Grade ...........................................................40
Table A.2. Spring 2010 READING Events Pool by State by Grade ..............................................................41
Table A.3. Fall 2009 LANGUAGE USAGE Test Events Pool by State by Grade ............................................42

8/10/2019 n We a 2011 Norms Report
http://slidepdf.com/reader/full/n-we-a-2011-norms-report 7/268
N W E A 2 0 1 1 R I T S c a l e N o r m s | vi i
Table A.4. Spring 2010 LANGUAGE USAGE Test Events Pool by State by Grade .......................................43
Table A.5. Fall 2009 MATHEMATICS Test Events Pool by State by Grade .................................................44
Table A.6. Spring 2010 MATHEMATICS Test Events Pool by State by Grade .............................................45
Table A.7. Fall 2009 GENERAL SCIENCE Test Events Pool by State by Grade.............................................46
Table A.8. Spring 2010 GENERAL SCIENCE Test Events Pool by State by Grade ........................................47
Table A.9. Fall 2009 SCIENCE CONCEPTS and PROCESSES Test Events Pool by State by Grade ................48
Table A.10. Spring 2010 SCIENCE CONCEPTS and PROCESSES Test Events Pool by State by
Grade......................................................................................................................................49
Appendix B – Achievement Status Percentile Ranks ..................................................................................... 51
Table B.1. Fall READING .............................................................................................................................52
Table B.2. Winter READING ........................................................................................................................54
Table B.3. Spring READING .........................................................................................................................56
Table B.4. Fall LANGUAGE USAGE ..............................................................................................................58
Table B.5. Winter LANGUAGE USAGE ........................................................................................................60
Table B.6. Spring LANGUAGE USAGE .........................................................................................................62
Table B.7. Fall MATHEMATICS ....................................................................................................................64
Table B.8. Winter MATHEMATICS ..............................................................................................................66
Table B.9. Spring MATHEMATICS ...............................................................................................................68
Table B.10. End-of-Course MATHEMATICS ................................................................................................70
Table B.11. Fall GENERAL SCIENCE .............................................................................................................72
Table B.12. Winter GENERAL SCIENCE .......................................................................................................74
Table B.13. Spring GENERAL SCIENCE ........................................................................................................76
Table B.14.Fall CONCEPTS & PROCESSES ....................................................................................................78
Table B.15. Winter CONCEPTS & PROCESSES ............................................................................................80
Table B.16. Spring CONCEPTS & PROCESSES..............................................................................................82
Appendix C – RIT Point Growth Norms .......................................................................................................... 85

8/10/2019 n We a 2011 Norms Report
http://slidepdf.com/reader/full/n-we-a-2011-norms-report 8/268
viii | N W E A 2 0 1 1 R I T S c a l e N o r m s
Table C.1. Means (M) and Standard Deviations (sd) of Academic Growth by Starting RIT Score
and Starting Instructional Week for Various Ending Instructional Weeks -
READING, KINDERGARTEN .....................................................................................................86
Table C.2. Means (M) and Standard Deviations (sd) of Academic Growth by Starting RIT Score
and Starting Instructional Week for Various Ending Instructional Weeks -
READING, GRADE 1 ................................................................................................................89
Table C.3. Means (M) and Standard Deviations (sd) of Academic Growth by Starting RIT Score
and Starting Instructional Week for Various Ending Instructional Weeks -
READING, GRADE 2 ................................................................................................................93
Table C.4. Means (M) and Standard Deviations (sd) of Academic Growth by Starting RIT Score
and Starting Instructional Week for Various Ending Instructional Weeks -
READING, GRADE 3 ................................................................................................................97
Table C.5. Means (M) and Standard Deviations (sd) of Academic Growth by Starting RIT Score
and Starting Instructional Week for Various Ending Instructional Weeks -
READING, GRADE 4 ..............................................................................................................101
Table C.6. Means (M) and Standard Deviations (sd) of Academic Growth by Starting RIT Score
and Starting Instructional Week for Various Ending Instructional Weeks -
READING, GRADE 5 ..............................................................................................................105
Table C.7. Means (M) and Standard Deviations (sd) of Academic Growth by Starting RIT Score
and Starting Instructional Week for Various Ending Instructional Weeks -
READING, GRADE 6 ..............................................................................................................108
Table C.8. Means (M) and Standard Deviations (sd) of Academic Growth by Starting RIT Score
and Starting Instructional Week for Various Ending Instructional Weeks -
READING, GRADE 7 ..............................................................................................................112
Table C.9. Means (M) and Standard Deviations (sd) of Academic Growth by Starting RIT Score
and Starting Instructional Week for Various Ending Instructional Weeks -
READING, GRADE 8 ..............................................................................................................116
Table C.10. Means (M) and Standard Deviations (sd) of Academic Growth by Starting RIT
Score and Starting Instructional Week for Various Ending Instructional Weeks -
READING, GRADE 9 ..............................................................................................................120

8/10/2019 n We a 2011 Norms Report
http://slidepdf.com/reader/full/n-we-a-2011-norms-report 9/268
N W E A 2 0 1 1 R I T S c a l e N o r m s | ix
Table C.11. Means (M) and Standard Deviations (sd) of Academic Growth by Starting RIT
Score and Starting Instructional Week for Various Ending Instructional Weeks -
READING, GRADE 10 ............................................................................................................124
Table C.12. Means (M) and Standard Deviations (sd) of Academic Growth by Starting RIT
Score and Starting Instructional Week for Various Ending Instructional Weeks -
LANGUAGE USAGE, GRADE 2 ...............................................................................................128
Table C.13. Means (M) and Standard Deviations (sd) of Academic Growth by Starting RIT
Score and Starting Instructional Week for Various Ending Instructional Weeks -
LANGUAGE USAGE, GRADE 3 ...............................................................................................131
Table C.14. Means (M) and Standard Deviations (sd) of Academic Growth by Starting RIT
Score and Starting Instructional Week for Various Ending Instructional Weeks -
LANGUAGE USAGE, GRADE 4 ...............................................................................................135
Table C.15. Means (M) and Standard Deviations (sd) of Academic Growth by Starting RIT
Score and Starting Instructional Week for Various Ending Instructional Weeks -
LANGUAGE USAGE, GRADE 5 ...............................................................................................138
Table C.16. Means (M) and Standard Deviations (sd) of Academic Growth by Starting RIT
Score and Starting Instructional Week for Various Ending Instructional Weeks -
LANGUAGE USAGE, GRADE 6 ...............................................................................................141
Table C.17. Means (M) and Standard Deviations (sd) of Academic Growth by Starting RIT
Score and Starting Instructional Week for Various Ending Instructional Weeks -
LANGUAGE USAGE, GRADE 7 ...............................................................................................144
Table C.18. Means (M) and Standard Deviations (sd) of Academic Growth by Starting RIT
Score and Starting Instructional Week for Various Ending Instructional Weeks -
LANGUAGE USAGE, GRADE 8 ...............................................................................................147
Table C.19. Means (M) and Standard Deviations (sd) of Academic Growth by Starting RIT
Score and Starting Instructional Week for Various Ending Instructional Weeks -
LANGUAGE USAGE, GRADE 9 ...............................................................................................151
Table C.20. Means (M) and Standard Deviations (sd) of Academic Growth by Starting RIT
Score and Starting Instructional Week for Various Ending Instructional Weeks -
LANGUAGE USAGE, GRADE 10 .............................................................................................155

8/10/2019 n We a 2011 Norms Report
http://slidepdf.com/reader/full/n-we-a-2011-norms-report 10/268
x | N W E A 2 0 1 1 R I T S c a l e N o r m s
Table C.21. Means (M) and Standard Deviations (sd) of Academic Growth by Starting RIT
Score and Starting Instructional Week for Various Ending Instructional Weeks -
MATHEMATICS, KINDERGARTEN .........................................................................................159
Table C.22. Means (M) and Standard Deviations (sd) of Academic Growth by Starting RIT
Score and Starting Instructional Week for Various Ending Instructional Weeks -
MATHEMATICS, GRADE 1 ....................................................................................................162
Table C.23. Means (M) and Standard Deviations (sd) of Academic Growth by Starting RIT
Score and Starting Instructional Week for Various Ending Instructional Weeks -
MATHEMATICS, GRADE 2 ....................................................................................................166
Table C.24. Means (M) and Standard Deviations (sd) of Academic Growth by Starting RIT
Score and Starting Instructional Week for Various Ending Instructional Weeks -
MATHEMATICS, GRADE 3 ....................................................................................................170
Table C.25. Means (M) and Standard Deviations (sd) of Academic Growth by Starting RIT
Score and Starting Instructional Week for Various Ending Instructional Weeks -
MATHEMATICS, GRADE 4 ....................................................................................................173
Table C.26. Means (M) and Standard Deviations (sd) of Academic Growth by Starting RIT
Score and Starting Instructional Week for Various Ending Instructional Weeks -
MATHEMATICS, GRADE 5 ....................................................................................................176
Table C.27. Means (M) and Standard Deviations (sd) of Academic Growth by Starting RIT
Score and Starting Instructional Week for Various Ending Instructional Weeks -
MATHEMATICS, GRADE 6 ....................................................................................................179
Table C.28. Means (M) and Standard Deviations (sd) of Academic Growth by Starting RIT
Score and Starting Instructional Week for Various Ending Instructional Weeks -
MATHEMATICS, GRADE 7 ....................................................................................................182
Table C.29. Means (M) and Standard Deviations (sd) of Academic Growth by Starting RIT
Score and Starting Instructional Week for Various Ending Instructional Weeks -
MATHEMATICS, GRADE 8 ....................................................................................................185
Table C.30. Means (M) and Standard Deviations (sd) of Academic Growth by Starting RIT
Score and Starting Instructional Week for Various Ending Instructional Weeks -
MATHEMATICS, GRADE 9 ....................................................................................................188

8/10/2019 n We a 2011 Norms Report
http://slidepdf.com/reader/full/n-we-a-2011-norms-report 11/268
N W E A 2 0 1 1 R I T S c a l e N o r m s | xi
Table C.31. Means (M) and Standard Deviations (sd) of Academic Growth by Starting RIT
Score and Starting Instructional Week for Various Ending Instructional Weeks -
MATHEMATICS, GRADE 10 ..................................................................................................192
Table C.32. Means (M) and Standard Deviations (sd) of Academic Growth by Starting RIT
Score and Starting Instructional Week for Various Ending Instructional Weeks -
GENERAL SCIENCE, GRADE 3 ................................................................................................196
Table C.33. Means (M) and Standard Deviations (sd) of Academic Growth by Starting RIT
Score and Starting Instructional Week for Various Ending Instructional Weeks -
GENERAL SCIENCE, GRADE 4 ................................................................................................199
Table C.34. Means (M) and Standard Deviations (sd) of Academic Growth by Starting RIT
Score and Starting Instructional Week for Various Ending Instructional Weeks -
GENERAL SCIENCE, GRADE 5 ................................................................................................202
Table C.35. Means (M) and Standard Deviations (sd) of Academic Growth by Starting RIT
Score and Starting Instructional Week for Various Ending Instructional Weeks -
GENERAL SCIENCE, GRADE 6 ................................................................................................205
Table C.36. Means (M) and Standard Deviations (sd) of Academic Growth by Starting RIT
Score and Starting Instructional Week for Various Ending Instructional Weeks -
GENERAL SCIENCE, GRADE 7 ................................................................................................208
Table C.37. Means (M) and Standard Deviations (sd) of Academic Growth by Starting RIT
Score and Starting Instructional Week for Various Ending Instructional Weeks -
GENERAL SCIENCE, GRADE 8 ................................................................................................211
Table C.38. Means (M) and Standard Deviations (sd) of Academic Growth by Starting RIT
Score and Starting Instructional Week for Various Ending Instructional Weeks -
GENERAL SCIENCE, GRADE 9 ................................................................................................214
Table C.39. Means (M) and Standard Deviations (sd) of Academic Growth by Starting RIT
Score and Starting Instructional Week for Various Ending Instructional Weeks -
GENERAL SCIENCE, GRADE 10 ..............................................................................................218
Table C.40. Means (M) and Standard Deviations (sd) of Academic Growth by Starting RIT
Score and Starting Instructional Week for Various Ending Instructional Weeks -
SCIENCE CONCEPTS & PROCESSES, GRADE 3 .......................................................................222

8/10/2019 n We a 2011 Norms Report
http://slidepdf.com/reader/full/n-we-a-2011-norms-report 12/268
xii | N W E A 2 0 1 1 R I T S c a l e N o r m s
Table C.41. Means (M) and Standard Deviations (sd) of Academic Growth by Starting RIT
Score and Starting Instructional Week for Various Ending Instructional Weeks -
SCIENCE CONCEPTS & PROCESSES, GRADE 4 .......................................................................225
Table C.42. Means (M) and Standard Deviations (sd) of Academic Growth by Starting RIT
Score and Starting Instructional Week for Various Ending Instructional Weeks -
SCIENCE CONCEPTS & PROCESSES, GRADE 5 .......................................................................228
Table C.43. Means (M) and Standard Deviations (sd) of Academic Growth by Starting RIT
Score and Starting Instructional Week for Various Ending Instructional Weeks -
SCIENCE CONCEPTS & PROCESSES, GRADE 6 .......................................................................231
Table C.44. Means (M) and Standard Deviations (sd) of Academic Growth by Starting RIT
Score and Starting Instructional Week for Various Ending Instructional Weeks -
SCIENCE CONCEPTS & PROCESSES, GRADE 7 .......................................................................234
Table C.45. Means (M) and Standard Deviations (sd) of Academic Growth by Starting RIT
Score and Starting Instructional Week for Various Ending Instructional Weeks -
SCIENCE CONCEPTS & PROCESSES, GRADE 8 .......................................................................237
Table C.46. Means (M) and Standard Deviations (sd) of Academic Growth by Starting RIT
Score and Starting Instructional Week for Various Ending Instructional Weeks -
SCIENCE CONCEPTS & PROCESSES, GRADE 9 .......................................................................240
Table C.47. Means (M) and Standard Deviations (sd) of Academic Growth by Starting RIT
Score and Starting Instructional Week for Various Ending Instructional Weeks -
SCIENCE CONCEPTS & PROCESSES, GRADE 10 .....................................................................244

8/10/2019 n We a 2011 Norms Report
http://slidepdf.com/reader/full/n-we-a-2011-norms-report 13/268
N W E A 2 0 1 1 R I T S c a l e N o r m s | xiii
Table of Figures
Figure 3.1. Weighted and un-weighted means for NWEA schools and for all schools in each
state. ......................................................................................................................................... 18
Figure 4.1. Sample Instructional and Testing Calendar ................................................................................ 22
Figure 4.2. Data and results for MAP Reading in focal grade 3 ..................................................................... 23
Figure 4.3. Data and results for MAP Mathematics in focal grade 4 ............................................................ 25

8/10/2019 n We a 2011 Norms Report
http://slidepdf.com/reader/full/n-we-a-2011-norms-report 14/268

8/10/2019 n We a 2011 Norms Report
http://slidepdf.com/reader/full/n-we-a-2011-norms-report 15/268
N W E A 2 0 1 1 R I T S c a l e N o r m s | xv
Prologue
Since the RIT scale norms were first developed in 1996 each new norming study has included conceptual
and methodological improvements over its immediate predecessor. These improvements have been
made possible by the expanding NWEA partner base, technological enhancements in computingcapabilities and data storage, and broad advancements in statistical methods for analyzing complex data
structures. Over the past 15 years, norm studies have expanded from status norms (1996) to include
grade level growth (1999), growth conditioned on 10-point RIT blocks of the observed starting score
(2002), growth conditioned on observed starting score (2005), longitudinal growth and the use of
instructional weeks as a covariate for growth estimated in a two-level model (2008), the use of the
National Center for Education Statistics Common Core of Data to stratify the study sample to improve the
representativeness of status norms (2008), and the inclusion of norms for kindergarten and first grade
students (2008).
The current study continues that pattern of continual improvements and enhancements that have been
established in previous studies. While nearly all changes are methodological in nature, they all emerge
from a different conceptual framework for norms. Previous norms were developed from an empirical
perspective. The current norms couple the empirical data with a stronger model-based perspective. A
model-based post-stratification variable enabled us used to facilitate a straightforward and efficient
comparison of schools. A statistical model is used to better estimate true status and growth by
simultaneously controlling for factors that can affect those estimates (starting RIT score, standard errors
of measurement, sample weighting based on school characteristics, instructional weeks). These changes
create estimates that are more completely representative of kindergarten through grade 10 students
attending public schools in the U.S. and allow full inferential support.
We need to emphasize that no procedure in this study has changed any of the NWEA measurement
scales in any way. A particular RIT score has the same meaning today as it did three, six, or even nine
years ago. It is this constancy of scales that allows us to measure change and to compare student
performance across time. What may have changed is how any particular RIT score corresponds to the
score distributions (e.g., percentile ranks) from the norm studies carried out three, six, or nine years ago.
It is important to keep in mind that these percentile rank differences are not score differences but simply
reflect differences in the distributions of RIT scores between the various samples used in the studies.
Finally, we would like to acknowledge our educational partners who have demonstrated the foresight,
trust, and commitment to allow student test scores to be stored in NWEA’s Growth Research Database
(GRD). This database is the primary data source for the vast majority of NWEA’s research efforts. Strong
viability of the GRD helps us to return the benefits of research findings to the larger educational and
educational research communities. For this we are grateful and we will continue to work to maintain your
trust.

8/10/2019 n We a 2011 Norms Report
http://slidepdf.com/reader/full/n-we-a-2011-norms-report 16/268

8/10/2019 n We a 2011 Norms Report
http://slidepdf.com/reader/full/n-we-a-2011-norms-report 17/268
N W E A 2 0 1 1 R I T S c a l e N o r m s | 1
Chapter 1 - Introduction
Norming studies of achievement tests fall into a class of research studies that are guided by a common
objective: To deduce the summary features of an explicitly defined population of students based on the
performance of available students from that population. The study reported here shares this general
objective and is prompted by two interrelated motivations. The first is to provide a way for users of
Measures of Academic Progress® achievement tests to consistently and accurately reference the
performance of present and future students to performance expected in the population. The second is to
maximize the utility of norming study results and information. More specifically, we focused on
developing norms that are flexible and useful to professionals in schools, districts, and research settings
as they are asked to translate test performance to meaningful benchmarks and indicators for informing
educational decisions involving achievement data. Some elaboration on this focus should prove helpful.
Among the first questions asked about a score from an achievement test is, “What does a test score say
about the student? What does it mean?” The questions are simple and straight-forward, but their
answers can be involved. Since test scores have little intrinsic meaning, meanings must be carefully
constructed from their contextual framework. With achievement test scores in K-12 education, we are
helped somewhat knowing that they typically reference performance in a single content domain and that
the performance is typically expressed as a point on an underlying scale. However, the relationships
between the total score and the discrete skills, or knowledge that a student possesses, are not always
clear. As a result, it is the total score that holds the strongest link to the student’s skill and understanding
in the content domain. This is a view with large granularity and can be considered as one providing only
an estimate of general proficiency in the content domain. Strand or goal scores can provide some limited
information for additional inference. However, once we are satisfied that the test content is representative
of the intended domain, detailed knowledge of test content offers little help in determining a score’s
message about the student’s proficiency in the domain.
Common school realities and policies can, and often do, require scores to be used for different purposes,
effectively changing their intended meanings and uses. Issues such as those involving accountability,
estimating school effectiveness, estimating student progress, informing instructional content decisions,
and using test results to select students into programs or make promotion or graduation decisions are
among the more common uses of test scores. In these and other common situations, test scores take on
not only different meanings, but carry varying consequences as well. While it is unlikely that any set of
achievement test norms can fully accommodate such a broad range of uses and score meanings, it is a
reasonable challenge to develop norms that can optimize the information that is used in these contexts.
Critical to taking up this challenge is the availability of references to student achievement status and
change that can accommodate some variation in when tests are administered, differences in the precision
of achievement estimates, and how their results are to be used. The results from this norming study

8/10/2019 n We a 2011 Norms Report
http://slidepdf.com/reader/full/n-we-a-2011-norms-report 18/268
2 | N W E A 2 0 1 1 R I T S c a l e N o r m s
provide a clear move in this direction. To accomplish this, an integrated conceptual and analytic
framework was developed. The framework helps to define the operational boundaries within which
norming study results can be used to reference normal performance, while taking into account test
administration procedures that allows wide latitude in the amount of instructional time that precedes a test
or falls between two tests. Its implementation in the study provides the necessary conceptual and
statistical support in that the approach:
• Is internally consistent across all scores from the same content domain
• Acknowledges and incorporates each score’s measurement error in the analyses
• Accommodates the full range of scores that a test can yield
• Incorporates score variation both within and across groups of test takers
• Incorporates score changes of individual test takers from one test occasion to another
• Supports the use of scores and score changes within the psychometric constraints of the
underlying measurement scale
• Provides an integrated and tractable model for estimating the rate of change of test performance
over test occasions separated by varying intervals of instruction
• Incorporates a time dimension that has a positive correlation with the score both as an estimate
of achievement status at a point in time and as part of an estimate of score change from a prior
test occasion
•
Employs a sample post-stratification procedure to insure that inferences about test performancerelative to the population of interest are made based on a representative sample of that
population
The value of such a framework becomes clear when the differences in the tasks of developing norms for
MAP assessments and the tasks of developing norms for traditional large scale achievement tests are
compared.
In the case of traditional achievement tests, norming studies tend to follow a common pattern. A single
reference test form, perhaps with several additional parallel test forms, is administered to randomly
selected schools or groups of students within a pre-specified timeframe of 3 to 4 weeks. Sampling plans,
perhaps augmented by post-stratification procedures, are designed to yield a sample that is
representative of the target population for the test. Tests are scaled using the same sample. Results
from these norming studies can be referred to as test-centric. That is, the test or test form and the
performance scale used for reporting are inextricably linked; the representativeness of the sample
notwithstanding, scale score references (e.g., grade level mean, standard deviation, percentile ranks)
apply only to the reference test form and its associated parallel forms. Norms from such studies are

8/10/2019 n We a 2011 Norms Report
http://slidepdf.com/reader/full/n-we-a-2011-norms-report 19/268
N W E A 2 0 1 1 R I T S c a l e N o r m s | 3
technically only applicable as references to test performance that come from tests administered in a
timeframe that corresponds to that the one used for the study (e.g., Sept. 15 through Oct. 15).
NWEA uses a different approach.
MAP assessments are computerized adaptive tests. Individual tests are constructed based on the
student’s performance while responding to items constrained in content to a set of standards (usually
defined by a state). Items are selected from a pool of Rasch-calibrated items. Since all items in a single
content domain are calibrated to the same scale, different tests that may be constructed in that domain
are all children of the same parent, and scores from different tests constructed from that domain can be
interpreted in the same manner. For this study, all candidate test records represented well over 800
separate item pools across the five content domains of reading, language usage, mathematics, general
science, and science concepts and processes.
Test events used to construct the norms were taken from operational tests that are in routine use in
schools; special recruiting to achieve sample representativeness was avoided, in favor of a post-stratification procedure to achieve representativeness to the target (U.S. school-age) population. Using
operational tests requires that the time of test administration cannot be arbitrarily imposed. To be used in
improving the precision of norm references the time of test administration must be accounted for within
the conceptual and analytic framework. Results from this norming study, therefore, reference
performance that is related to scales of measurement and are representative of their target population.
Moreover, achievement estimates came from operational tests administered in active testing programs,
and since instructional schedules were known for each school, varying test administration times were
anchored to instructional time and accounted for in the analysis. This has the effect of strengthening the
representativeness of the norms in another way; they are based on performance data collected from tests
that were administered on schedules consistent with user needs, rather than according to arbitrarily
imposed timeframes.
There is a second key difference between the approach taken here and conventional norming studies.
Achievement status at particular points in time is the primary focus in conventional studies. While the
methodology in this study certainly includes estimation of status, estimates of magnitude and the rate of
change in performance from one point in time to another are given concurrent methodological attention.
In order to characterize changes in test performance over successive test occasions (i.e., achievement
growth), students rather than individual test scores are sampled. With students as the sampling unit, all
of a student’s test events (referred to herein as a student’s test event history) in a particular content area
over the five academic term time frame used for the study are included when a student is selected. The
results from these test events are used to estimate both status and growth norms, simultaneously.
The norms presented in this document can help to answer many of the questions teachers and parents
commonly ask about student test performance and achievement estimates provided from MAP tests.
These include but are not limited to:

8/10/2019 n We a 2011 Norms Report
http://slidepdf.com/reader/full/n-we-a-2011-norms-report 20/268
4 | N W E A 2 0 1 1 R I T S c a l e N o r m s
• How does this child’s reading performance compare with the performance of other children of his
age and grade across the U.S?
• How can this child’s mathematics performance, that was estimated six weeks later than her
peers, be compared to her peers?
•
How much progress might be expected of this grade 7 student after 42 weeks of instruction, whohad a RIT score of 212 in the fall of this year? And since initial achievement status has been
shown to be related to the rate of change, how does this expectation compare with those of her
peers who scored about 15 RITs higher in the fall?
• How does my child’s growth of 9 RITs over the past 27 instructional weeks compare with other
students in the same grade who started out with the same RIT score, with the same number of
instructional weeks before his first test and the same number of instructional weeks between
tests?
Readers of previous NWEA norming studies will immediately recognize that this study took a
fundamentally different approach to developing norms. Differences can be seen in the ways students
were sampled, the post stratification procedures used to achieve representativeness of kindergarten
through grade 10 students attending public schools in the U.S., the lengths of timeframes for data used,
the use of instructional time in producing norms estimates, and the statistical methods used to produce
both status and growth norm estimates. In addition, these methodological changes are accompanied by
a changing NWEA partner base. In view of both of these changes, it is fair and logical for theses readers
to ask what changes from the 2008 norms can be expected in the 2011 norms.
We expected and found that changes in status norms would be relatively minor. Both studies used a
method to post-stratify samples to reflect kindergarten through grade 10 students attending public schoolsin the U.S. Percentile ranks for grades 3 and above changed very little, with the largest differences in the
tails of the distributions. The differences that do exist are primarily the result of the differences in the
sample adjustment methodology and the changing NWEA partner base. Somewhat larger differences
may be observed for kindergarten and grades 1 and 2, again, particularly in the tails of the distributions.
Post-stratification of the 2008 kindergarten and grade one samples was not performed.
We anticipated changes in the growth norms as well in view of the fact that the 2008 growth norms were
fundamentally user norms; post-stratification was not employed. We found post-stratification weighting led
to differences that are minor in the middle of the achievement range and somewhat larger at the ends of
the range, particularly at the very extremes. These changes are the result of new methods to improve the
representativeness of the norming samples and the introduction of the new estimation procedures.
Substantial changes in the growth estimates for very high or very low achieving students may be
observed. For low achieving students, growth expectations will typically be somewhat lower than those
estimated from the 2008 study. For high achievers, expected growth will often be estimated to be
somewhat higher than corresponding estimates from 2008.

8/10/2019 n We a 2011 Norms Report
http://slidepdf.com/reader/full/n-we-a-2011-norms-report 21/268
N W E A 2 0 1 1 R I T S c a l e N o r m s | 5
The largest changes in growth estimates occur for the most extreme initial scores. This means that
relatively small numbers of students will see very large changes. However, in classrooms and schools
with large numbers of very low performing or very high performing students, larger changes in their
aggregate growth estimates are therefore to be expected.
The remainder of this document is organized into several chapters. In Chapter 2, a brief description of
the tests used to obtain achievement estimates is presented. The methods used to create pools of
candidate test records for the study are also provided in Chapter 2. Chapters 3 and 4 address different
aspects of the study methodology. Chapter 3 defines the target population for the study and identifies the
variables included in a School Challenge Index (SCI) developed for use in the post-stratification process.
A detailed description of the development and application of the SCI is included. In Chapter 4, the
statistical model used to compute status and growth norms is described. Grade level status and growth
norms are presented in Chapter 5. Several extensive appendices provide additional details of the
foregoing chapters.

8/10/2019 n We a 2011 Norms Report
http://slidepdf.com/reader/full/n-we-a-2011-norms-report 22/268
6 | N W E A 2 0 1 1 R I T S c a l e N o r m s
This page is intentionally blank.

8/10/2019 n We a 2011 Norms Report
http://slidepdf.com/reader/full/n-we-a-2011-norms-report 23/268
N W E A 2 0 1 1 R I T S c a l e N o r m s | 7
Chapter 2 - Test Structures and Pools of CandidateTest Events
All norms reported in this document are based on student performance on the Measures of Academic
Progress
®
(MAP®) achievement tests. Content areas included in MAP are reading, language usage,mathematics, general science, and science concepts and processes. All assessments are delivered as
computerized adaptive tests (CAT) in one of two forms: a survey test or a survey with goals test. Survey
tests are 20 items in length while survey with goals tests range from 30 items (for science-related tests) to
40 items (for reading), to 50 items (for mathematics and language usage). Only test events that were
based on survey with goals tests were included in this study because they are associated with relatively
lower measurement errors than survey tests.
Content for the overwhelming majority of MAP tests is aligned to the content area standards adopted by
the particular state in which the test is intended to be used. There is a set of tests for each content area
for each of the 50 states. At a minimum, a set of tests for a state consists of seven tests that are
structured by grade level and content area, as illustrated in Table 2.1.
Table 2.1. Number of Items Per Test by Content Area
Content area Grades
Numberof
Items
Reading K 54
2-5 40
6+ 40
Language Usage 2-10 50
Mathematics K 54
2-5 50
6+ 50
General Science 3-10 30
Science Concepts & Processes 3-10 30
For those tests that are not content-aligned to a particular state’s content standards, content is aligned to
standards proposed by a recognized professional organization (e.g., the National Council of Teachers of
Mathematics, NCTM, for mathematics; the National Council of Teachers of English, NCTE, and the
International Reading Association, IRA, for reading).
Test items are not unique to specific tests, but are typically shared across different state-aligned tests
within a content domain when different content specifications call for the same knowledge,
understandings, or skills. Items are pulled together in pools for the purpose of test delivery. There is one

8/10/2019 n We a 2011 Norms Report
http://slidepdf.com/reader/full/n-we-a-2011-norms-report 24/268
8 | N W E A 2 0 1 1 R I T S c a l e N o r m s
test pool for each state-grade level-content area combination. These pools range in size from roughly
1,500 to 3,000 items. Test events used in this study from across all content areas came from 883
separate item pools.
All items in a common content area are calibrated to the same underlying scale using a one parameter
logistic (1-PL or Rasch) model. The single parameter referred to is the location parameter; that is, the
location (difficulty) of test items and the location (achievement) of persons measured on the same scale.
With both items and persons occupying positions on the same scale, the task of selecting appropriately
difficult items for a person whose achievement is well estimated is straightforward. MAP tests capitalize
on this simple relationship – the software presents an item of known difficulty, collects the student’s
response, uses a Bayesian procedure (Owen, 1975) to estimate the student’s achievement from that
response in conjunction with the student’s responses to all previously administered items, and selects
another item that is closest to that estimate. As this cycle is repeated, each successive achievement
estimate is slightly more precise than the previous one until the error associated with the estimate is as
small as it is likely to be in the test session. The result, the final achievement estimate, or RIT score, is
based on maximum likelihood (ML) and represents the person’s location on the additive scale (RIT scale)
that is qualified by a standard error of measurement (SEM). Characteristically, MAP tests yield precise
achievement estimates; that is, their SEMs that are generally less than 0.3 of a typical large sample
standard deviation (Kingsbury & Hauser, 2004). Standard errors vary minimally across over 90% of the
achievement range of a grade level. This makes MAP scores well suited for use in growth models as well
as other statistical procedures that assume additive measures.
Tests can be administered to the same student between two and four times per calendar year, depending
on the depth of the item pool for content area, grade span, and content alignment. To control multiple
presentations of the same items to the same student, an item lockout period is imposed. The lockout
period prevents an item presented to a student during a test event from being presented in subsequent
test events that occur over a specified period. For all tests events that make up this study, the item
lockout period was 24 months. There are no restrictions concerning specific timeframes or even times of
the year in which tests may be administered. Test administration schedules are left entirely to schools
and/or school districts or agencies.
Further details about the background, development, technical, and operational characteristics of MAP
tests appears in the Technical Manual for Measures of Academic Progress (MAP) and Measures of
Academic Progress for Primary Grades (MPG) (NWEA, 2011).
Pools of candidate test events
Data source. The source for candidate test event records was the Growth Research Database (GRD).
The GRD is a repository of test event information (e.g., score, SEM, duration, test pool, test date);
accompanying information about demographics of the test taker (e.g., school, grade, gender, ethnic group
membership); collateral information about items taken and their characteristics; as well as links to

8/10/2019 n We a 2011 Norms Report
http://slidepdf.com/reader/full/n-we-a-2011-norms-report 25/268
N W E A 2 0 1 1 R I T S c a l e N o r m s | 9
datasets from external agencies such the National Center for Education Statistics’ Common Core of Data
(NCES-CCD). Created and maintained by Northwest Evaluation Association, the GRD currently holds
over 200 million test event records, dating back to spring, 2002. Roughly 99% of these records are from
MAP tests.
Timeframe and inclusion criteria. The study timeframe included the testing terms of spring 2009, fall
2009, winter 2010, spring 2010, and fall 2010. Any test event falling into one of these terms was treated
as a candidate for inclusion if it met several eligibility criteria:
• Test was a survey with goals test as opposed to a survey test
• Test terminated normally – was full length and was not terminated by a proctor
• Test duration was longer than 6 minutes
• For RIT scores < 240, 2 < SEM ≤ 4.5; for RIT scores ≥ 240, SEM > 2
• Number of students tested in the test taker’s school and grade was ≥ 75% of the 2007 -2008
enrollment provided in the NCES Common Core of Data (Sable & Plotts, 2010)
These criteria were applied to all test event records falling in the study timeframe. In addition to the RIT
score, several additional data elements were retrieved for each test record. These included:
• the test’s scale key – e.g., mathematics, language usage
• SEM of the score
• the district identifier key
• the school identifier key
• the GRD-assigned student identifier key
• the student’s grade when the test was taken
• the term the test was taken
• the date the test was taken
• the district-specific instructional day on which the test was taken
• the specific test version that was taken
• all relevant school-specific variables from the NCES-CCD Public School Universe dataset for the
test taker’s school (see Chapter 3 for specific variables)
The structures of the resulting test record pools varied primarily by content area and, to a lesser extent,
by testing term. Table 2.2 shows the grades for which growth and status norms were computed. This
structure is broken down further in Tables A.1 through A.10 in Appendix A, which summarize the
structures by state and grade level for each content area and the fall 2009 and spring 2010 testing terms.

8/10/2019 n We a 2011 Norms Report
http://slidepdf.com/reader/full/n-we-a-2011-norms-report 26/268
10 | N W E A 2 0 1 1 R I T S c a l e N o r m s
Table 2.2. Content Area – Grade Combinations by Type of Norm Provided

8/10/2019 n We a 2011 Norms Report
http://slidepdf.com/reader/full/n-we-a-2011-norms-report 27/268
N W E A 2 0 1 1 R I T S c a l e N o r m s | 11
Chapter 3 - Approximating the Reference Populationwith Post-Stratification Adjustment
As is shown in Appendix A (Tables A.2 – A.10), MAP tests are administered in virtually all states in the
U.S. The vast majority of tests are administered in reading, language usage, and mathematics in gradeskindergarten through 10. These facts were taken as justification for focusing on kindergarten through
grade 10 students attending public schools in the U.S. as the reference population for the study. As we
have also discussed in Chapter 2, the pool of students in our data archive represents NWEA’s partner
base in the 2010-2011 school year. It is reasonable to expect that the available students at any point in
time reflect to some unknown degree changes in MAP subscription patterns, in addition to the evolving
make-up of the U.S. school-age population. By itself, it is questionable whether data from our student
pool adequately informs the patterns of performance of all kindergarten through grade 10 students
attending public schools in the U.S., which is the population targeted in the 2011 norms. Norming results
that are based on such data alone would reflect baselines specific to NWEA’s partner base. Thus, a firststep towards building nationally representative norms from a convenience sample, such as that
represented by our student pool, is to consider how NWEA students differ from the students in the target
population on factors that might influence their achievement.
To extend inferences to kindergarten through grade 10 students attending public schools in the U.S from
NWEA schools, knowledge about differences in the joint distributions of certain key observed features
between NWEA (sampled) and non-NWEA (un-sampled) schools in the population can be employed to
construct “population weights” that, when applied, would allow the analyst to post-stratify the available
sample of schools to better reflect those key features of schools in the population. Post-stratificationadjustment to the data in hand is a common strategy in cases where stratification prior to sample
selection is impossible (Holt & Smith, 1979; Pike, 2007), as would largely be the case for convenience
samples like the data in the NWEA client data-base. Post-stratification is also often applied when one
suspects that simple random sampling or systematic sampling, upon comparing sample and population
distributions of key attributes describing the units, may not have been entirely satisfactory.
Generally speaking, suppose that a student is individually selected with a uniform probability ofi
p the,
the population weight for this student’s school j from a suitable post-stratification analysis is W j. The
total weight for a student i ’s observed score in an analysis would be1
W j
i p
. The 2008 NWEA norms
for achievement status post-stratify students using the two school-level measures: (a) the ethnic
composition of students in the school and (2) the proportion of students who are eligible for free-and-
reduced-priced lunch in the school. The need to collapse some empty cells was a concern and post-
stratification adjustment of the available data was not applied for growth norms in 2008 for several
analytic reasons. We remedied this situation in 2011 with a new approach that (1) estimates population

8/10/2019 n We a 2011 Norms Report
http://slidepdf.com/reader/full/n-we-a-2011-norms-report 28/268
12 | N W E A 2 0 1 1 R I T S c a l e N o r m s
weights for post-stratifying the available NWEA schools in each state to better represent schools in the
state on a wider set of school-level factors than previously attempted, and (2) employs the population
weights in a statistical model to estimate achievement and growth norms simultaneously for kindergarten
through grade 10 students attending public schools in the U.S..
Post-stratifying NWEA Schools on the School Challenge Index (SCI)
We elected to use several school-level variables that are routinely available from the National Center for
Education Statistics’ Common Core of Data in the Public School Universe (NCES-CCD-PSU) dataset
(Sable & Plotts, 2010). These variables were selected for the longstanding attention they have received in
the research literature, and discussions of educational policy. Each variable has been the topic of or
accounted for in hundreds of research studies ranging from their effects on achievement and learning to
their inclusion in policy development. The specific variables or the combination of variables created from
NCES data are presented in Table 3.1. All data were taken from the 2008-2009 NCES-CCD-PSU
dataset.
Table 3.1. NCES Variables Used In the Schoo l Challenge Index (SCI)
Table 3.1. NCES Variables Used In the School Challenge Index (SCI)
NCES variable SCI variable NCES Description Notes / codes
ULOCAL08 School locale NCES urban-centriclocale code
Used only the “urban” portion of the variablewithout the size/distance portion, resulting in thecategories of:1 = city2 = suburb3 = town4 = rural
TYPE08 School type NCES code forschool type 1 = Regular2 = Special education3 = Vocational (not included)4 = Other/alternative5 = Reportable program (not included)
LEVEL08 School level School level by lowand high gradesserved
1 = Primary (Low = PK – 3; High = PK – 8)2 = Middle (Low = 4 – 7; High 4 – 9)3 = High (Low = 7 – 12; High = 12 only)4 = any other grade configuration (e.g., 2 – 10)
TITLEI08 Title I Title I Eligible 1 = Yes2 = No
MAGNET08
continued
Magnet Regardless of the source of funding, a magnet school or program is aspecial school or program designed to attract students of different
racial/ethnic backgrounds for the purpose of reducing, preventing, oreliminating racial isolation and/or to provide an academic or social focus ona particular theme /
1 = Yes2 = No

8/10/2019 n We a 2011 Norms Report
http://slidepdf.com/reader/full/n-we-a-2011-norms-report 29/268
N W E A 2 0 1 1 R I T S c a l e N o r m s | 13
Table 3.1. NCES Variables Used In the School Challenge Index (SCI)
NCES variable SCI variable NCES Description Notes / codes
CHART08 Charter A school that provides free elementary and/or secondary education toeligible students under a specific charter granted by the state legislature orother appropriate authority /
1 = Yes2 = No
MEMBER08 -- Total students, allgrades
Used for calculation only – not used directly inschool challenge index
TOTFRL08 Proportion FRL Total of free luncheligible and reduced-price lunch eligible.
The proportion that TOTFRL08 represents of thetotal school enrollment (TOTFRL08 / MEMBER08)
AM08 -- Total AmericanIndian/Alaska Nativestudents
Used for calculation only – not used directly inschool challenge index – used to calculate theProportion of ethnic variable
HISP08 -- Total Hispanic
students
Used for calculation only – not used directly in
school challenge index – used to calculate theProportion the of ethnic variable
Black08 -- Total Black students Used for calculation only – not used directly inschool challenge index – used to calculate theProportion of ethnic variable
-- Proportion ofethnic
-- Proportion of “ethnic” students calculated as (AM08+ HISP08 + Black08) / MEMBER08
FTE08 Staff FTE Total full-timeequivalent classroomteachers
PUPTCH08 Pupil-Teacher
ratio
Calculated pupil/teacher ratio: Total reported students (MEMBER08) divided
by FTE classroom teachers (FTE08).
It should be noted that while the variables listed in Table 3.1 are relatively common across states, state-
specific demographics and adopted policies can and do cause their distributions to vary, sometimes
widely, between states. Review of these differences and the absence of a compelling, plausible
argument for aggregating these variables across states to create a single index, lead to the decision to
create a School Challenge Index for each state. These procedures are described in the next sections.
Background
A common approach for developing population weights can be illustrated by assuming that post-
stratifying be based on two variables: Student ethnicity and student free-and-reduced-priced lunch status.
Both are categorical variables and many cells in the resulting joint distribution may contain no schools of
interest if the available set of schools is small in number. In practice, some collapsing of the categories is
further needed to attain workable cell numbers, leading to a concern that the post-stratification weights
take on different meanings as cells in the two-by-two joint distribution are collapsed, or if a category
needs to be deleted in one margin or another. This is a frequently encountered problem, and one that

8/10/2019 n We a 2011 Norms Report
http://slidepdf.com/reader/full/n-we-a-2011-norms-report 30/268
14 | N W E A 2 0 1 1 R I T S c a l e N o r m s
becomes more likely as both the number of categories and the number of variables to be employed
increase. It is often difficult to produce weights to reflect adequately a multi-factor discrete distribution, a
situation that is made more difficult if both continuous and categorical variables are present.
If post-stratification is to be based on comparing the distributions of sampled units and units in the
population on a large number of factors, three approaches are plausible. The first is to work with the joint
distribution of the factors, as indicated above, if all factors are categorical or categorized (if it is originally
a continuous variable). The problems with empty cells noted above can be a huge stumbling block when
the numbers of variables and categories increase. A second approach is to employ a dimensional
reduction analysis, such as the Mahalanobis distance metric (Mahalanobis, 1936), or factor scores from a
one-factor factor analysis model. These methods are generally available for continuous variables but
working with a mix of both continuous and categorical variables would require a far greater level of
sophistication. Furthermore, it is often hard to explain what the resulting dimension represents, and this
has persuaded some users to consider approaches akin to the third alternative.
A strategy for using as much of the information from a large number of variables, categorical or
continuous, in post-stratification might draw upon the idea of the propensity score as a solution to
matching units on a large number of dimensions (Rosenbaum & Rubin, 1983). The probability that a unit
receives treatment is the propensity score for that unit. This probability is generally based on a logistic
regression of treatment status for a group of units (treated and untreated) on a number of relevant
covariates (whether categorical or continuous). The idea is that treatment and control units within a
suitable range on their propensity score are considered “similar” in terms of their shared covariate profiles
and so the difference on their outcomes can be more justifiably attributed to the treatment in question.
While the original intent of propensity score analysis is to support causal inference in observational
studies and quasi-experiments, its key methodological insight has far greater application. At the core of
the propensity score proposal is that, if units are to be matched on a large number of factors, they can be
matched efficiently on a single dimension that is built upon the information from a regression among the
same factors. Our third approach is exemplified by the Similar Schools Index (SSI) designed by the State
of California to facilitate the ranking of their schools (State of California DOE, 2000). It employed school-
level testing results as the outcome in a regression on a large number of school-level demographic,
community, and structural information to characterize the performance of schools in relation to the factors
under which they operate. Deriving a single dimension on which schools may be compared in this way
may serve to effectively compare the schools across multiple dimensions. We think post-stratifying
schools on such an index can lead to norming results that better represent kindergarten through grade 10
students attending public schools in the U.S. Thus, the SSI is a useful point of departure for
understanding the School Challenge Index (SCI).

8/10/2019 n We a 2011 Norms Report
http://slidepdf.com/reader/full/n-we-a-2011-norms-report 31/268
N W E A 2 0 1 1 R I T S c a l e N o r m s | 15
School Challenge Index (SCI)
Because schools serve students with a wide range of needs, and under an even wider range of
conditions, evaluators are rightly skeptical about comparisons of school effectiveness that do not also
take into account well-known differences in the challenges schools individually face every day at the
school site. The SCI is a new measure of how schools in a state compare in terms of the challenges andopportunities they operate under as reflected by an array of factors they do not control. This school
measure generally taps the collective economic circumstance of its students, but it also offers a broader
view of the “economic strain” they experience as seen through a relevant set of socio-demographic,
organizational, and educational policy programming factors. Unlike the California SSI, no achievement
data enter into its definition because doing so will potentially prejudice schools across strata when they
are later evaluated on their students’ achievement results.
The SCI considered many school-level variables. The distributions for each selected variable are
presented by state in Tables B.1 through B.12 in Appendix B. A school’s affiliation with NWEA was not a
part of constructing the SCI. Review of these differences and the absence of a compelling, plausible
argument for aggregating these variables across states to create a single index, lead to the decision to
create an SCI for each state. The state-specific SCI is used to construct post-stratification weights, the
use of which increases the generalizability of norming results based only on the NWEA schools in a state
to all schools in that state. Weights are attached to each student depending on the SCI decile of the
school he attends, and no further distinction is made among students from different states.
The SCI is based on school-level factors. Its aim is to measure the level of challenge a school in a state
faces in terms of the socio-economic composition of its student body and as moderated by other related
factors such as the ethnic make-up of its students, or the kind of assistance they receive (Title 1), or the
environment it operates within (such as whether it is located in a city, rural, or urban area, or whether it is
a large school, or whether it serves primarily elementary or middle school children, or if it is a magnet or
charter school, etc.). Broadly, the steps for constructing the SCI for a state are:
Step 1: Transformation
The variables in Table 3.1 are first transformed. The general approach is to turn categorical
variables into a set of dummy variables. Variables representing counts with known baseline
numbers (such as the number of White students in a school) are converted into log-odds, or logit
units, and variables showing dramatic skew, such as the number of full-time staff and pupil-teacher
ratio, are log transformed. The key variable for the SCI is of course the proportion of students who
received free-or-reduced-priced lunch, and it is analyzed in its logit transform as well.
Step 2: Data Completeness
Data within a state are cleaned. Some variables, such as whether a school is a charter school or is
a magnet school, are not present in a state. These variables are dropped. In some states, one or
several of the available variables may have some missing values. For these states, multiple

8/10/2019 n We a 2011 Norms Report
http://slidepdf.com/reader/full/n-we-a-2011-norms-report 32/268
16 | N W E A 2 0 1 1 R I T S c a l e N o r m s
imputation is conducted using Markov chain Monte Carlo (MCMC) with multiple chains for arbitrary
missing data patterns (as implemented by SAS® PROC MI). The imputation approach applies to all
variables without distinguishing their role as predictors or outcomes in subsequent analysis. The
number of imputed datasets range from 5 (less than 5% missing), to 7 (5% to less than 10%
missing), to 10 (10% to less than 20% missing), to 12 (more than 20% of the data are missing). The
approach here represents a rather cautious strategy for the handling of missing data.
Step 3: Estimating the SCI
The SCI model regresses the logit-transformed proportion of free-and-reduced-priced program
recipients in a school on the remaining variables, which are treated as predictors. In essence, the
predicted values from this model represent the economic challenges faced by a school that are also
explained by the other school-level factors spanning the predictor space of the model. It is a view of
economic strain seen through a set of similarly compelling factors differentiating the schools. The
residual is that portion of the outcome variable not explained by these school-level factors. Post-
stratifying on the proportion of students on free-and-reduced-priced lunch is now being replaced by
post-stratifying on a variable that is constructed to also take into account the other factors that are
correlated with the proportion of students on free-and-reduced-priced lunch measure.
If imputation is not required in a state, the predicted values ˆ j x of the regression are normalized to
the predicted mean µ̂ and residual standard deviation σ̂ . The normalized predicted values are
then re-scaled to give the SCI:
ˆ ˆSCI 50 21.06 .ˆ
j x µ
σ − = + ×
The rescaling places the SCI on a scale similar to the normal curve equivalent, or NCE, so that SCI
scores typically distributed about a mean of 50 and a standard deviation of 21.06 within a state.
Scores typically range from about 0 to about 100. Schools with higher levels on the SCI scale are
likely to experience relatively higher levels of economic challenge, as indicated by the mix of factors
they operate under.
If a dataset is imputed, the predicted values from a separate regression analysis for each imputed
dataset are aggregated via a multi-level model (with predicted scores from each imputation beingnested within the school). The school-level predicted values are then treated in a manner similar to
the above to produce the state SCI.
Step 4: Results
It should be clear from the above that the SCI from one state may not be compared with that from
another state. First, the SCI may be employing a slightly different set of predictor variables from
state to state. Second, the inter-correlations among the variables across the states may not be the

8/10/2019 n We a 2011 Norms Report
http://slidepdf.com/reader/full/n-we-a-2011-norms-report 33/268
N W E A 2 0 1 1 R I T S c a l e N o r m s | 17
same. The result is that the predictors explain the variation in the outcome differently across the
states. Therefore, what an SCI means in one state is bound to be slightly different from what the
SCI means in another state. The SCI, however, is a very concise and meaningful dimension for
post-stratifying the NWEA schools in their respective states.
Constructing Population Weights
Step 1: From SCI Deciles to Post-stratification Weights
Schools are placed into deciles according to their SCI. If NWEAPd is the proportion of NWEA schools
and ALLPd
is the proportion of all schools for a state in decile d , the population weight for an NWEA
school j is
ALL
NWEA
PW , if .
Pd
j
d
j d = ∈
Step 2: Sampling of Students and Analysis Weights
Sampling of students is done for the following reasons. Computational burden is very much
reduced and accuracy is not sacrificed with the large pool of students available. Depending on the
pool size Total N , a sampling proportion p is determined that would ensure that we have about 20,000
students (un-weighted count) for each analysis. The rule adopted is Total20,000 p N = if
Total 20,000 N > , else 0.8. p = Finally, the analysis weight for an student is determined both by the
sampling fraction and by the population weights from the post-stratification, or
W
.
j
iw p=
Illustrative Results
Figure 3.1 illustrated the anticipated impact of post-stratification. First, NWEA MAP users in 2008 are not
evenly distributed across the states. For example, only about 11% of schools in Connecticut were MAP
users in 2008, while about 97% of schools in South Carolina tested. The SCI regressions are fairly strong
in both states. In Connecticut, about 76% of the between-school variance of the transformed free-and-
reduced-priced lunch variable is explained by the in-state factors considered. The relationship is equally
impressive in South Carolina (about 70%).
Regardless of how the SCI behaved in each state, post-stratification clearly had the anticipated impact.
The plot in Figure 3.1 shows the difference in the average SCI with and without applying the population
weights. In states where NWEA clients are few in number, it is not uncommon to see some distance
between the average SCI of NWEA schools from the average SCI of non-NWEA schools. Weighting by
the SCI-based population weights made the two sets of schools essentially comparable. Details on the
decile proportions for the two states are also given in Table 3.2. Table 3.3 shows further details of the
impact of post-stratification adjustment on the SCI for these two states.

8/10/2019 n We a 2011 Norms Report
http://slidepdf.com/reader/full/n-we-a-2011-norms-report 34/268
18 | N W E A 2 0 1 1 R I T S c a l e N o r m s
min max
Weighting -0.7058 0 1.5464
State R 2 %NWEA Before After *----------------------------------------*
AL 0.64 1.67 0.37 0.05 | O X |
FL 0.58 3.40 0.32 -0.03 | O| X |
SD 0.58 3.65 0.27 0.02 | O X |
NY 0.55 3.82 -0.27 0.06 | X |O |
WV 0.50 4.02 0.02 -0.07 | O X |
OK 0.58 4.46 0.03 0.06 | XO |
VA 0.50 4.63 0.04 -0.02 | OX |
TX 0.30 4.82 -0.38 -0.01 | X O| |
TN 0.63 5.07 -0.36 -0.06 | X O | |
MO 0.22 5.14 0.45 0.06 | |O X |
PA 0.62 6.57 -0.22 -0.01 | X O| |
GA 0.58 6.69 0.14 0.01 | O X |
NC 0.49 7.52 -0.05 -0.01 | @| |
LA 0.67 9.24 0.81 0.05 | O X |
UT 0.50 9.88 0.29 -0.00 | O| X |
OH 0.20 10.90 0.63 0.01 | O X |
CT 0.76 11.10 1.55 -0.01 | O| X|
CA 0.58 11.97 0.04 0.01 | @ |
MA 0.74 11.98 0.91 0.01 | O X |
AZ 0.55 13.16 0.36 -0.00 | O X |
NJ 0.80 14.12 -0.16 -0.03 | X O| |
HI 0.56 16.32 0.40 0.00 | O X | AR 0.40 16.70 0.15 0.00 | O X |
MI 0.41 17.64 0.21 -0.00 | O X |
VT 0.32 18.59 0.03 -0.01 | OX |
MD 0.67 19.37 0.15 0.02 | O X |
RI 0.85 22.65 0.19 0.02 | O X |
OR 0.48 26.03 0.11 -0.00 | O| X |
IL 0.50 29.52 -0.71 0.01 |X O |
NV 0.74 30.96 0.02 0.01 | @ |
MS 0.70 33.26 0.20 0.01 | O X |
AK 0.53 35.19 0.03 0.01 | @ |
NE 0.25 38.72 0.07 -0.00 | O|X |
KY 0.46 40.57 -0.01 -0.00 | @| |
IA 0.47 47.51 -0.10 0.00 | X O |
MT 0.62 51.06 -0.06 -0.01 | XO| |
WA 0.52 52.46 0.15 0.01 | O X |
WI 0.56 57.59 0.13 0.00 | O X |
DE 0.57 57.64 0.05 0.03 | @ |IN 0.70 62.76 0.00 -0.01 | OX |
CO 0.47 63.01 0.02 -0.01 | OX |
KS 0.61 67.22 -0.04 -0.00 | XO |
NM 0.40 67.27 0.16 0.01 | O X |
NH 0.32 75.00 -0.05 -0.01 | @| |
MN 0.52 77.03 0.04 0.00 | @ |
ME 0.24 81.37 -0.03 -0.00 | XO |
ND 0.43 92.13 -0.03 -0.01 | @| |
ID 0.45 92.50 0.05 0.00 | @ |
SC 0.69 96.86 0.02 0.00 | @ |
WY 0.39 98.49 -0.02 -0.00 | @| |
*----------------------------------------*
Key: R 2 Adj. R2 of linear model.
X Mean difference btw NWEA and non-NWEA schools before weighting.
O Mean difference btw NWEA and non-NWEA schools after weighting.
@ Symbol over-print, X = O.
Figure 3.1. Weighted and un-weighted means for NWEA schools and for all schools in each state.

8/10/2019 n We a 2011 Norms Report
http://slidepdf.com/reader/full/n-we-a-2011-norms-report 35/268
N W E A 2 0 1 1 R I T S c a l e N o r m s | 19
Table 3.2. Estimated population weights for NWEA schools based on the proportions of NWEA schoolsin each SCI decile for Connecticut and South Carolina.
Non-NWEA NWEA State Pop.WeightDeci le N % N % N %
Connecticut
1 100 10.406 8 6.667 108 9.991 1.499
2 106 11.030 2 1.667 108 9.991 5.9943 102 10.614 7 5.833 109 10.083 1.7294 103 10.718 4 3.333 107 9.898 2.9695 102 10.614 6 5.000 108 9.991 1.9986 104 10.822 4 3.333 108 9.991 2.9977 102 10.614 6 5.000 108 9.991 1.9988 92 9.573 16 13.333 108 9.991 0.7499 87 9.053 21 17.500 108 9.991 0.57110 63 6.556 46 38.333 109 10.083 0.263
South Carolina
1 7 19.444 107 9.631 114 9.939 1.0322 6 16.667 110 9.901 116 10.113 1.0213 7 19.444 108 9.721 115 10.026 1.0314 4 11.111 109 9.811 113 9.852 1.004
5 2 5.556 114 10.261 116 10.113 0.9866 1 2.778 114 10.261 115 10.026 0.9777 4 11.111 109 9.811 113 9.852 1.0048 3 8.333 113 10.171 116 10.113 0.9949 1 2.778 113 10.171 114 9.939 0.97710 1 2.778 114 10.261 115 10.026 0.977
Table 3.3. Distribution of raw SCI index values for Connecticut and South Carolina.
N Mean SD Min Max
Connecticut
NWEAUn-Weighted 120 0.519 2.026 -4.501 2.864Weighted 120 -1.042 1.972 -4.501 2.864
State 1081 -1.027 1.917 -5.543 2.964
South Carolina
NWEAUn-Weighted 1111 0.441 0.965 -3.018 3.197Weighted 1111 0.425 0.968 -3.018 3.197
State 1147 0.424 0.968 -3.018 3.197

8/10/2019 n We a 2011 Norms Report
http://slidepdf.com/reader/full/n-we-a-2011-norms-report 36/268
20 | N W E A 2 0 1 1 R I T S c a l e N o r m s
This page is intentionally blank.

8/10/2019 n We a 2011 Norms Report
http://slidepdf.com/reader/full/n-we-a-2011-norms-report 37/268
N W E A 2 0 1 1 R I T S c a l e N o r m s | 21
Chapter 4 - Norms Development Methodology
Describing Achievement Growth over Instructional Time
In NWEA growth norm studies prior to the 2008 study, it was assumed that students who tested on thesame testing date, or term, would have had the same amount of instruction. This assumption was initially
challenged in the 2008 norms study by using instructional weeks rather than terms as the metric for time
between test occasions. However, the 2008 study’s use of instructional weeks was limited to the interval
between test occasions; it did not consider the instructional time from the beginning of a school year that
preceded a test occasion. In the 2008 study as well as in the current study’s data, we observed that
testing dates relative to the beginning of the school year and between instructional periods can and do
vary considerably both within and between terms. We assume that this is the result of schools being able
to determine when their students are to be assessed within each term. The analytical challenge comes in
accounting for instructional weeks when schools differ in how much instruction precedes a fall test and
how much instructional takes place between test occasions. The potential impact on test scores that is
due to differences in the amounts of instruction students receive cannot be ignored. Taking the details
about a student’s instructional and testing calendar into account explicitly would help reduce likely
differences in his opportunity-to-learn when performance is to be compared with that student’s peers. For
this reason, we introduce a procedure for estimating both status and growth norms based on a multi-level
growth model that included instructional time in this norming study.
Instruct ional and Testing Calendar
A typical instructional and testing time-table for a grade-level is depicted in Figure 4.1. For the analysis, astudent was included as long as the student had a valid test score. The typical student contributed a fall,
a winter, and a spring score from the focal grade-level to the estimation of their own growth trajectory. In
addition, the student’s spring score from the prior grade and fall score from the next grade were included.
Kindergarten and grade 2 (for language usage only) were the exceptions to this structure. In both cases
students were not tested using either MAP or MAP for Primary Grades.
The number of instructional days was determined for each student from additional information we have
collected about when the district school-year begins. Instructional calendars for school districts that used
MAP tests in the 2009-2010 school year were retrieved from their district websites. The specific datarecorded were the first day of school, the last day of school, non-instructional weekdays that fell between
the first and the last days of school. These dates were then used to extrapolate back one year and
forward one year, to infer the instructional days for those years. It should be noted from Figure 4.1 that
instructional time, either in terms of days or weeks, is counted from the beginning of the year prior to the
focal grade. Where instructional calendars could not be retrieved from a district website, a default
"traditional" calendar was used, with an August 31, 2009 starting date; the modal start date of district

8/10/2019 n We a 2011 Norms Report
http://slidepdf.com/reader/full/n-we-a-2011-norms-report 38/268
22 | N W E A 2 0 1 1 R I T S c a l e N o r m s
calendars that were retrieved. If specifics are unavailable for a school or district, an academic year of 180
instructional days is assumed. The default calendar was used for about 28% of districts.
Figure 4.1. Sample Instructional and Testing Calendar
Overview of Analytic Strategy & Illust rative Results
Status and growth norms are estimated for each grade-level and test subject combination listed in Table
A.2 using the score histories from a large random sample of students who attended that grade. As an
example, Panel (a) in Figure 4.2 shows reading test scores for a large sample of grade 3 students in the
2009-2010 school year. In addition to students’ 3rd grade fall, winter, and spring scores, their 2nd grade
spring score and their 4th grade fall score are included to strengthen inferences about achievement and
growth that are to be made near the beginning and the end of the 3rd grade instructional calendar.
The plot in Panel (a) suggests that the average reading achievement for the cross-section of 3rd graders
might be summarized by a cubic function of instructional day. Such a model, however, would over-
estimate the precision of its estimates because scores in the analysis are not likely to be independent
across students and occasions as the ordinary lease squares (OLS) solution would assume. In settings
where scores are nested within students and there is substantial variation between student growth
trajectories in the population as the sample of student growth curves in Panel (b) of Figure 4.2 indicates,
multi-level models provide a more defensible description of the growth of achievement over time (Bryk &
Raudenbush, 1987; Goldstein, 1995). Details of a solution using a multi-level growth model, in which
observed scores are weighted by their individual standard errors of measurement (SEM), can be found in
Appendix D.
Panel (c) of Figure 4.2 shows the result of a third-degree (or cubic) polynomial function of achievement
with instructional days, in which the intercept and the linear terms are correlated student random effects
estimated using SAS®
PROC NLMIXED (Pinheiro & Bates, 1995; SAS Institute Inc., 2008; Wolfinger,1999). The top half of Table 4.1 contains parameter estimates, their standard errors, and the sampling
variance-covariance matrix for the conventional form of the multilevel model. Status norms that are
conditional on instructional days (or weeks) are derived from these results, as explained in Appendix D.
See Appendix D for an explanation of the notation employed in the table.
We found in this study that multi-level models fit the student achievement growth data considered in this
report better than an OLS model, although the estimated results from a multi-level growth model, as

8/10/2019 n We a 2011 Norms Report
http://slidepdf.com/reader/full/n-we-a-2011-norms-report 39/268
N W E A 2 0 1 1 R I T S c a l e N o r m s | 23
plotted in Panel (c) of Figure 4.2, are rather similar to those obtained using OLS. The real value of a multi-
level model for this application, as compared with OLS, lies in its ability to capture the relationship of
“true” growth and “true” initial status in the population of students.
Figure 4.2. Data and results for MAP Reading in focal grade 3
(a) Cross-sectional display of RIT scores by instruction day, (b) Time-series plots for a small
representative sample of students attending the focal grade, (c) Predicted status as a function
of instructional day, (d) Predicted gains by pre-test RIT levels for spring-spring, fall-winter, fall-
spring, winter-spring, and fall-spring pre-post testing periods.

8/10/2019 n We a 2011 Norms Report
http://slidepdf.com/reader/full/n-we-a-2011-norms-report 40/268
24 | N W E A 2 0 1 1 R I T S c a l e N o r m s
Table 4.1 Pseudo-maximum l ikelihood estimates for Reading in focal grade 3.
Table 4.1 Pseudo-maximum l ikelihood estimates for Reading in focal grade 3.
Polynomial Growth Model Sampling variance-covariance matrix
Parm Estimate s.e. 00γ 10γ 20γ 30γ 00τ 01τ 11τ
00γ 1.90E+02 6.55E-02 4.28E-04
10γ 3.25E-01 1.61E-03 -1.00E-06 2.59E-07
20γ 8.95E-03 1.14E-04 -1.11E-07 -6.76E-09 1.31E-09
30γ -3.00E-04 2.80E-06 2.38E-09 3.90E-11 -2.95E-11 7.86E-13
00τ 2.15E+02 8.20E-05 1.26E-07 -8.18E-10 -4.28E-11 1.04E-12 6.66E-10
01τ -8.04E-01 1.54E-02 7.20E-07 -7.76E-08 -2.21E-09 7.14E-11 1.22E-07 2.36E-05
11τ 3.79E-02 3.57E-04 -9.10E-09 -1.15E-10 1.71E-10 -4.31E-12 -1.17E-09 -2.27E-07 1.27E-08
Latent variable Model
Parm Estimate s.e. 00γ 20γ 30γ 10a 11a 00τ *11τ
00γ 1.90E+02 6.55E-02 4.28E-04
20γ 8.95E-03 1.14E-04 -1.11E-07 1.31E-09
30γ -3.00E-04 2.80E-06 2.38E-09 -2.95E-11 7.86E-13
10a 3.25E-01 1.61E-03 -1.00E-06 -6.76E-09 3.90E-11 2.59E-07
11a -3.74E-03 7.10E-05 3.35E-09 -1.03E-11 3.32E-13 -3.61E-10 5.11E-10
00τ 2.15E+02 1.90E-05 1.22E-07 -3.14E-11 6.75E-13 -4.17E-10 9.59E-13 3.45E-11
*11τ 3.49E-02 3.27E-04 -3.72E-09 1.54E-10 -3.77E-12 -6.96E-10 -2.33E-10 -9.93E-13 1.07E-08
00γ : predicted RIT level mean at instructional week 4 of the focal grade (intercept term)
10γ , 20γ , 30γ : linear, quadratic, and cubic coefficients, respectively, of polynomial growth model,
00τ , 01τ , 11τ : variance-covariance terms for intercept and linear student random effects
10a : predicted true linear growth rate for students at the population status mean during instructional week 4
11a : regression coefficient of true status for predicting true linear growth rate
*11τ : residual variance of true linear growth rate conditional on student true status
In Appendix D, we detail how results from a multi-level model of achievement status over time may also
be employed to support inferences about the average growth between any two testing periods. We show
that translating the multi-level growth model into the form of its equivalent latent variable regression (LVR)
model of growth rates on initial achievement status provides a means for formulating post hoc hypotheses
about the growth between any two testing periods that are also conditional on the true performance status
of the student. The analyses also take into account the relative imprecision of test scores.
As illustrated in Panel (d) of Figure 4.2, growth norms for common pre-post testing periods (between any
two of the five terms: spring of grade 2, fall of grade 3, winter of grade 3, spring of grade 3, and fall of
grade 4), of 3rd graders, conditional on the student “true” initial status, are derived from the parameter
estimates, standard errors, and the sampling variance covariance matrix for the LVR solution in Table 4.1

8/10/2019 n We a 2011 Norms Report
http://slidepdf.com/reader/full/n-we-a-2011-norms-report 41/268
N W E A 2 0 1 1 R I T S c a l e N o r m s | 25
(bottom). Corresponding illustrative displays and results for grade 4 mathematics are also provided in
Figure 4.3 and Table 4.2, respectively.
(a) (b)
(c) (d)
Figure 4.3. Data and results for MAP Mathematics in focal grade 4
(a) Cross-sectional display of RIT scores by instructional day, (b) Time-series plots for a small
representative sample of students attending the focal grade, (c) Predicted status as a function of
instructional day, (d) Predicted gains by pre-test RIT levels for spring-spring, fall-winter, fall-spring,
winter-spring, and fall-spring pre-post testing periods.
Our approach to estimating conditional growth norms largely avoids many of the concerns scholars have
regarding how gains in achievement might be defined, measured, or modeled (Braun, 1988; Cronbach &
Furby, 1970; Good, Biddle, & Brody, 1975; Harris, 1963; Harris, 2007; Linn & Slinde, 1977; Mellenbergh,
1999; Rogosa, 1995; Seltzer, Frank, & Bryk, 1994; Thum, 2003; Willett, 1988; Williams & Zimmerman,
8/10/2019 n We a 2011 Norms Report
http://slidepdf.com/reader/full/n-we-a-2011-norms-report 42/268
26 | N W E A 2 0 1 1 R I T S c a l e N o r m s
1996; Yen, 2007). We have argued, in essence, that we measure achievement status and not growth.
Growth is an inference, a result that is based solely on an acceptable descriptive model of change in
achievement status over time.
Table 4.2 Pseudo-maximum l ikelihood estimates for Mathematics in focal g rade 4.
Table 4.2 Pseudo-maximum l ikelihood estimates for Mathematics in focal grade 4.
Polynomial Growth Model Sampling variance-covariance matrix
Parm Estimate s.e. 00γ 10γ 20γ 30γ 00τ 01τ 11τ
00γ 2.04E+02 5.72E-02 3.28E-04
10γ 2.71E-01 1.33E-03 3.78E-07 1.78E-07
20γ 9.65E-03 8.90E-05 -7.48E-08 -3.85E-09 8.01E-10
30γ -2.80E-04 2.22E-06 1.55E-09 2.64E-12 -1.80E-11 4.92E-13
00τ 1.63E+02 3.00E-05 1.68E-07 1.70E-10 -3.91E-11 8.19E-13 8.72E-11
01τ 1.65E-01 1.17E-02 8.76E-07 -5.59E-08 -2.84E-09 8.79E-11 5.10E-09 1.36E-05
11τ 2.53E-02 2.46E-04 -5.51E-09 -9.41E-10 1.77E-10 -4.25E-12 -2.97E-12 -6.22E-10 6.06E-09
Latent variable Model
Parm Estimate s.e. 00γ 20γ 30γ 10a 11a 00τ *11τ
00γ 2.04E+02 5.72E-02 3.28E-04
20γ 9.65E-03 8.90E-05 -7.48E-08 8.01E-10
30γ -2.80E-04 2.22E-06 1.55E-09 -1.80E-11 4.92E-13
10a 2.71E-01 1.33E-03 3.78E-07 -3.85E-09 2.64E-12 1.78E-07
11a 1.01E-03 7.20E-05 5.38E-09 -1.74E-11 5.39E-13 -3.43E-10 5.12E-10
00τ 1.63E+02 2.90E-05 1.67E-07 -3.81E-11 7.88E-13 1.89E-10 2.75E-12 8.53E-11
*11τ 2.51E-02 2.47E-04 -7.29E-09 1.829E-10 -4.42E-12 -8.28E-10 -1.72E-10 -3.67E-12 6.119E-09
00γ : predicted RIT level mean at instructional week 4 of the focal grade (intercept term)
10γ , 20γ , 30γ : linear, quadratic, and cubic coefficients, respectively, of polynomial growth model
00τ , 01τ , 11τ : variance-covariance terms for intercept and linear student random effects
10a : predicted true linear growth rate for students at the population status mean during instructional week 4
11a : regression coefficient of true status for predicting true linear growth rate
*11τ : residual variance of true linear growth rate conditional on student true status
Population weights, based on the post-stratification of schools using the School Challenge Index for each
state as described earlier, are applied during estimation to improve the representativeness of the state
student population by the available sample of NWEA schools in the state. As explained in Chapter 3,
these school-level weights are multiplied by the fraction of students randomly sampled from the student
pool to obtain the weights for the analysis. These weights are then introduced using the REPLICATE
statement in SAS® PROC NLMIXED following Skinner’s (1989) pseudo maximum likelihood (PML)
approach, recommended by Grilli and Pratesi (2004) as a relatively direct and effective means for dealing
with informative sampling designs. Note that the model of achievement growth is linear (in the

8/10/2019 n We a 2011 Norms Report
http://slidepdf.com/reader/full/n-we-a-2011-norms-report 43/268
N W E A 2 0 1 1 R I T S c a l e N o r m s | 27
parameters of the model) although a curvilinear function is estimated. A very sizable number of students
is also used. Thus, the possibility that the sampling variance-covariance matrix may not be well estimated
for nonlinear models with smallish samples under PML is less of a concern in our application.
Procedural Differences for Grade 11 Status Norms
Due to structural differences in the data available to develop grade 11 status norms, it was necessary to
depart from the above procedures. Data concerns revolved around differences in the prevalence of
testing grade 11 students compared to those tested in grade 10. In the 2009-2010 academic year,
approximately 66% fewer grade 11 students were tested in reading than were tested in grade 10 for the
same year. The corresponding percentages for mathematics looked only slightly better at roughly 61%
fewer. For both reading and mathematics, the number of schools administering tests in grade 11 dropped
by roughly 27% from the grade 10 numbers. The cause of these differences could not be determined but
the practice of focusing testing on primarily lower performing students could not be ruled out. As stated
earlier, one of the score inclusion criteria was that 75% or more of the students in the grade of a school
had to have been tested in the same term. When this criterion is paired with the observation that many
RIT scores in the lower half of the grade 11 distributions had a lower percentile than in the corresponding
grade 10 distributions, we also cannot rule out the possibility that an influentially greater proportion of
lower performing schools were represented in the grade 11 sample.
To provide plausible status estimates for grade 11 we reverted back to a simpler methodology. Observed
RIT scores were used without regard to instructional time – the nominal term of testing was used as a
proxy. Scores were weighted by the SCI value for the student’s school. A similar approach was used in
the 2008 norming study but with a different method of post-stratification (i.e., not SCI-based weighting).
The weighted means and standard deviations of these procedures were used to compute percentile ranks
using the cumulative distribution function, Φ , in
SD
globs
gl
RIT X −Φ
.

8/10/2019 n We a 2011 Norms Report
http://slidepdf.com/reader/full/n-we-a-2011-norms-report 44/268
28 | N W E A 2 0 1 1 R I T S c a l e N o r m s
This page is intentionally blank.
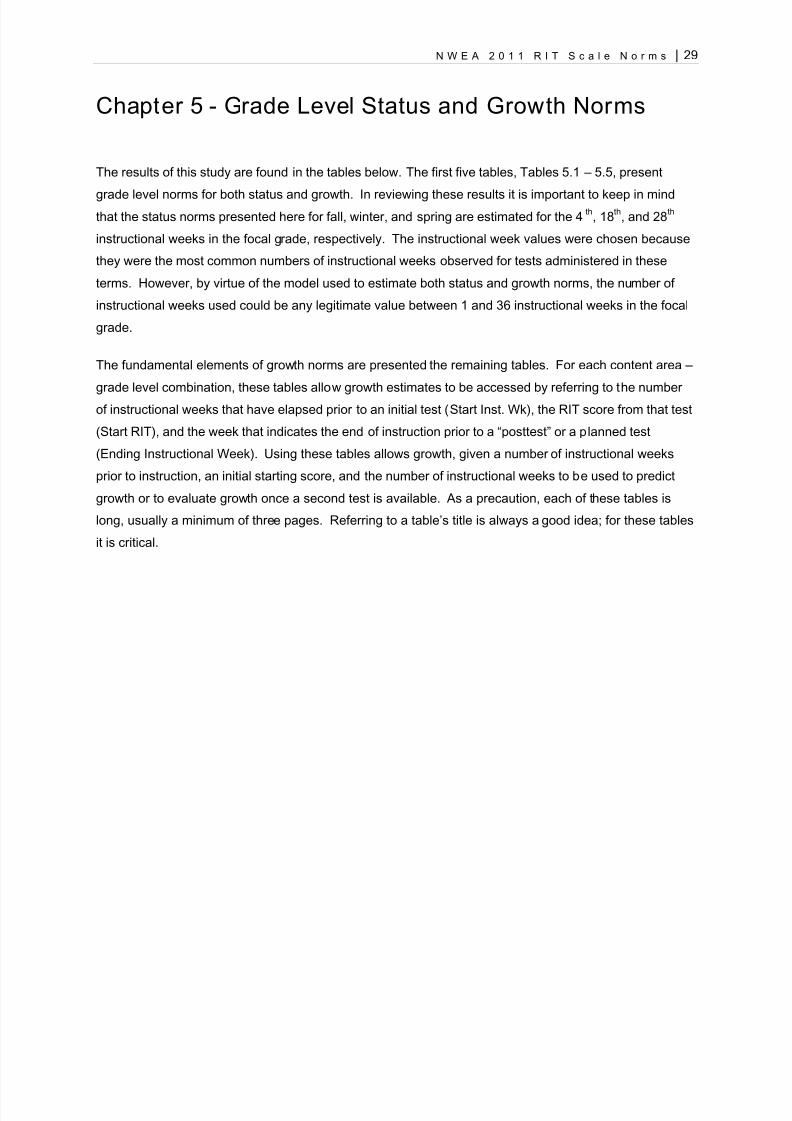
8/10/2019 n We a 2011 Norms Report
http://slidepdf.com/reader/full/n-we-a-2011-norms-report 45/268
N W E A 2 0 1 1 R I T S c a l e N o r m s | 29
Chapter 5 - Grade Level Status and Growth Norms
The results of this study are found in the tables below. The first five tables, Tables 5.1 – 5.5, present
grade level norms for both status and growth. In reviewing these results it is important to keep in mindthat the status norms presented here for fall, winter, and spring are estimated for the 4
th, 18
th, and 28
th
instructional weeks in the focal grade, respectively. The instructional week values were chosen because
they were the most common numbers of instructional weeks observed for tests administered in these
terms. However, by virtue of the model used to estimate both status and growth norms, the number of
instructional weeks used could be any legitimate value between 1 and 36 instructional weeks in the focal
grade.
The fundamental elements of growth norms are presented the remaining tables. For each content area –
grade level combination, these tables allow growth estimates to be accessed by referring to the numberof instructional weeks that have elapsed prior to an initial test (Start Inst. Wk), the RIT score from that test
(Start RIT), and the week that indicates the end of instruction prior to a “posttest” or a planned test
(Ending Instructional Week). Using these tables allows growth, given a number of instructional weeks
prior to instruction, an initial starting score, and the number of instructional weeks to be used to predict
growth or to evaluate growth once a second test is available. As a precaution, each of these tables is
long, usually a minimum of three pages. Referring to a table’s title is always a good idea; for these tables
it is critical.

8/10/2019 n We a 2011 Norms Report
http://slidepdf.com/reader/full/n-we-a-2011-norms-report 46/268
30 | N W E A 2 0 1 1 R I T S c a l e N o r m s
Table 5.1. Means and Standard Deviations (sd) of Grade Level Status for READING and Meansand Standard Deviations (sd) of Growth to Subsequent Terms Assuming StatusNorms as Starting RIT Score
Fall Status Growth from Fall to:
Winter Spring Fall of Next Grade
Grade Mean sd Mean sd Mean sd Mean sd N
K 142.5 10.71 8.4 5.15 15.1 7.23 18.0 9.31 20,099
1 160.3 12.76 10.4 5.65 16.6 8.13 15.3 10.50 20,103
2 175.9 15.44 7.8 5.47 13.7 7.70 14.0 9.86 20,280
3 189.9 14.97 4.7 4.80 9.3 6.45 9.5 7.95 20,298
4 199.8 14.30 3.4 4.71 6.8 6.13 6.9 7.46 20,369
5 207.1 14.21 2.7 4.71 5.2 6.13 4.9 7.45 20,263
6 212.3 14.39 2.0 4.71 4.1 6.15 4.1 7.48 20,173
7 216.3 14.23 2.0 4.88 3.4 6.17 3.9 7.52 20,206
8 219.3 14.86 2.0 5.05 3.2 6.63 3.0 8.24 20,373
9 221.4 15.17 2.0 5.40 2.0 7.52 2.2 9.59 20,446
10 223.2 15.30 2.0 6.01 2.0 8.98 2.0 11.75 20,056
11 223.4 16.93 39,844
Winter StatusGrowth from Winter
to:
Spring
Grade Mean sd Mean sd N
K 151.0 10.91 6.2 5.15 20,099
1 170.7 13.36 6.3 5.32 20,103
2 183.6 14.77 5.4 5.18 20,280
3 194.6 14.50 4.4 4.98 20,298
4 203.2 14.02 3.3 4.87 20,369
5 209.8 14.05 2.4 4.87 20,263
6 214.3 14.31 2.0 4.87 20,173
7 218.2 14.11 2.0 4.72 20,206
8 221.2 14.62 2.0 4.85 20,373
9 221.9 15.29 2.0 5.12 20,44610 223.4 15.59 2.0 5.60 20,056
11 223.5 17.16 --
Spring StatusGrowth from Spring
to:
Spring of NextGrade
Grade Mean sd Mean sd N
K 157.7 11.77 20.9 10.50 20,099
1 176.9 14.64 15.2 9.86 20,103
2 189.6 14.90 11.4 7.95 20,280
3 199.2 14.42 8.3 7.46 20,298
4 206.7 14.08 6.4 7.45 20,369
5 212.3 14.25 4.7 7.48 20,2636 216.4 14.60 3.7 7.52 20,173
7 219.7 14.34 3.7 8.24 20,206
8 222.4 14.84 2.0 9.59 20,373
9 222.9 15.97 2.0 11.74 20,446
10 223.8 16.72 20,056
11 223.7 17.38 28,476
8/10/2019 n We a 2011 Norms Report
http://slidepdf.com/reader/full/n-we-a-2011-norms-report 47/268
N W E A 2 0 1 1 R I T S c a l e N o r m s | 31
Table 5.2. Means and Standard Deviati ons (sd) of Grade Level Status for LANGUAGE USAGEand Means and Standard Deviations (sd) of Growth to Subsequent Terms AssumingStatus Norms as Starting RIT Score
Fall Status Growth from Fall to:
Winter Spring Fall of Next Grade
Grade Mean sd Mean sd Mean sd Mean sd N
2 175.4 15.32 9.9 5.44 14.6 7.60 16.1 9.71 20,103
3 191.1 14.62 5.5 5.04 9.2 6.61 9.7 8.20 20,155
4 200.9 14.02 3.5 4.87 6.1 6.14 6.9 7.46 20,233
5 208.0 13.39 3.0 4.87 4.9 6.13 4.9 7.45 20,230
6 212.3 13.18 2.1 4.85 3.9 6.08 4.1 7.38 20,259
7 215.8 13.15 2.0 4.79 2.9 5.93 3.4 7.13 20,279
8 218.7 13.09 2.0 4.89 2.6 6.21 2.6 7.57 20,362
9 220.6 13.23 2.0 5.09 2.0 6.74 2.0 8.40 20,104
10 221.9 13.66 2.0 5.50 2.0 7.76 2.0 9.95 19,960
*11 222.1 14.77 24,602
Winter StatusGrowth from Winter
to:
SpringGrade Mean sd Mean sd N
2 185.3 14.34 3.9 5.15 20,103
3 196.5 13.96 3.4 4.84 20,155
4 204.4 13.55 2.5 4.71 20,233
5 211.0 13.03 2.0 4.71 20,230
6 214.4 12.97 2.0 4.70 20,259
7 217.3 13.05 2.0 4.65 20,279
8 220.2 12.94 2.0 4.73 20,362
9 221.0 13.25 2.0 4.88 20,104
10 222.2 14.07 2.0 5.20 19,960
**11 222.7 14.93 --
Spring Status
Growth from Spring
to:Spring of Next
Grade
Grade Mean sd Mean sd N
2 190.0 14.23 11.9 8.20 20,103
3 200.3 13.85 7.7 7.46 20,155
4 207.0 13.50 6.3 7.45 20,233
5 212.9 13.08 4.0 7.38 20,230
6 216.2 13.13 2.9 7.13 20,259
7 218.7 13.27 3.0 7.57 20,279
8 221.3 13.19 2.0 8.40 20,362
9 221.8 13.74 2.0 9.95 20,104
10 222.7 15.08 19,960
*11 223.3 15.77 18,013
* Status means and standard deviations were computed using conventional methods with observations weighted by the SchoolChallenge Index
** Status means and standard deviations we interpolated from fall and spring data.

8/10/2019 n We a 2011 Norms Report
http://slidepdf.com/reader/full/n-we-a-2011-norms-report 48/268
32 | N W E A 2 0 1 1 R I T S c a l e N o r m s
Table 5.3. Means and Standard Deviations (sd) of Grade Level Status fo r MATHEMATICS andMeans and Standard Deviations (sd) of Growth to Subsequent Terms Assumi ngStatus Norms as Starting RIT Score
Fall Status Growth from Fall to:
Winter Spring Fall of Next Grade
Grade Mean sd Mean sd Mean sd Mean sd N
K 143.7 11.88 7.7 5.35 16.0 8.24 19.0 10.17 20,203
1 162.8 13.57 9.5 5.02 15.9 6.85 15.3 8.72 20,041
2 178.2 12.97 7.4 5.05 13.2 6.61 14.0 8.21 20,272
3 192.1 12.58 6.4 4.86 11.0 6.10 11.6 7.41 20,294
4 203.8 13.11 4.9 4.79 8.7 5.91 9.2 7.11 20,354
5 212.9 14.18 4.9 4.81 8.1 5.99 7.6 7.22 20,356
6 219.6 15.37 3.2 4.86 6.0 6.11 6.3 7.41 20,312
7 225.6 16.79 2.6 4.84 4.9 6.05 5.6 7.33 20,263
8 230.2 17.04 2.5 4.97 4.3 6.42 4.3 7.90 20,322
9 233.8 17.65 2.0 5.30 2.2 7.27 2.5 9.21 20,259
10 234.2 18.63 2.0 5.57 2.4 7.93 2.8 10.19 20,190
11 236.0 19.63 38,334
Winter StatusGrowth from Winter
to:
Spring
Grade Mean sd Mean sd N
K 150.7 12.45 7.1 5.35 20,203
1 172.4 12.83 5.7 5.02 20,041
2 185.5 12.46 5.4 4.85 20,272
3 198.5 12.61 4.5 4.70 20,294
4 208.7 13.47 3.8 4.65 20,354
5 217.8 14.38 3.3 4.67 20,356
6 222.8 15.58 2.8 4.70 20,312
7 228.2 17.06 2.2 4.69 20,263
8 232.8 17.21 2.0 4.79 20,322
9 234.9 18.01 2.0 5.04 20,259
10 235.5 18.73 2.0 5.25 20,190
11 237.2 19.81 --
Spring StatusGrowth from Spring
to:
Spring of NextGrade
Grade Mean sd Mean sd N
K 159.1 13.24 23.4 8.72 20,203
1 179.0 12.73 14.7 8.21 20,041
2 191.3 12.54 13.3 7.41 20,272
3 203.1 12.99 10.1 7.11 20,294
4 212.5 14.06 9.5 7.22 20,354
5 221.0 14.83 5.9 7.41 20,356
6 225.6 16.04 5.6 7.33 20,3127 230.5 17.53 5.2 7.90 20,263
8 234.5 17.66 2.1 9.21 20,322
9 236.0 18.76 2.5 10.19 20,259
10 236.6 19.36 20,190
11 238.3 20.00 27,560
End-of-Course Tests
Alg. 1 240.3 17.24 64,543
Geom. 249.5 17.29 20,005
Alg. 2 249.7 15.98 9,846

8/10/2019 n We a 2011 Norms Report
http://slidepdf.com/reader/full/n-we-a-2011-norms-report 49/268
N W E A 2 0 1 1 R I T S c a l e N o r m s | 33
Table 5.4. Means and Standard Deviations (sd) of Grade Level Status for GENERAL SCIENCEand Means and Standard Deviations (sd) of Growth to Subsequent Terms AssumingStatus Norms as Starting RIT Score
Fall Status Growth from Fall to:
Winter Spring Fall of Next Grade
Grade Mean sd Mean sd Mean sd Mean sd N
3 189.0 10.61 3.5 4.67 6.4 5.78 6.8 6.99 20,149
4 196.4 10.44 2.3 4.63 4.4 5.65 5.4 6.78 20,037
5 201.3 10.69 2.5 4.85 4.0 6.10 4.1 7.40 20,112
6 205.4 11.03 2.0 4.65 2.7 5.71 3.1 6.87 19,929
7 208.2 11.42 2.0 4.73 2.7 5.96 3.3 7.29 19,852
8 211.2 11.64 2.0 4.80 2.4 6.17 2.5 7.64 20,139
9 213.2 12.03 2.0 4.79 2.0 6.15 2.0 7.60 20,014
10 214.9 12.55 2.0 4.99 2.0 6.74 2.0 8.93 20,063
Winter StatusGrowth from Winter
to:
Spring
Grade Mean sd Mean sd N
3 192.5 10.29 2.7 4.67 20,149
4 198.7 10.25 2.0 4.63 20,037
5 203.7 10.65 2.0 4.70 20,112
6 206.8 10.85 2.0 4.65 19,929
7 209.5 11.26 2.0 4.73 19,852
8 212.4 11.74 2.0 4.80 20,139
9 213.6 12.18 2.0 4.79 20,014
10 215.6 12.58 2.0 4.99 20,063
Spring StatusGrowth from Spring
to:
Spring of NextGrade
Grade Mean sd Mean sd N
3 195.5 10.36 6.2 7.02 20,149
4 200.8 10.42 5.4 7.40 20,037
5 205.3 11.04 3.4 7.12 20,112
6 208.1 11.02 3.4 7.57 19,929
7 210.9 11.51 3.0 7.95 19,852
8 213.5 12.26 2.0 7.91 20,139
9 214.3 12.71 2.0 8.93 20,014
10 216.2 13.16 20,063

8/10/2019 n We a 2011 Norms Report
http://slidepdf.com/reader/full/n-we-a-2011-norms-report 50/268
34 | N W E A 2 0 1 1 R I T S c a l e N o r m s
Table 5.5. Means and Standard Deviations (sd) of Grade Level Status for SCIENCE CONCEPTS& PROCESSES and Means and Standard Deviations (sd) of Growth to SubsequentTerms Assuming Status Norms as Starting RIT Score
Fall Status Growth from Fall to:
Winter Spring Fall of Next Grade
Grade Mean sd Mean sd Mean sd Mean sd N
3 188.0 10.21 3.8 4.68 6.5 5.60 7.3 6.61 20125
4 195.4 9.74 2.2 4.52 4.1 5.26 5.2 6.12 20180
5 200.6 9.69 2.2 4.68 3.7 5.60 4.1 6.60 19917
6 204.6 10.26 2.0 4.59 2.4 5.51 3.0 6.53 19784
7 207.5 10.66 2.0 4.62 2.4 5.60 3.0 6.69 19884
8 210.4 10.75 2.0 4.72 2.0 5.92 2.1 7.23 20160
9 213.2 12.03 2.0 4.79 2.0 6.15 2.0 7.60 20014
10 213.9 11.28 2.0 4.86 2.0 6.35 2.0 8.27 19,975
Winter StatusGrowth from Winter
to:
Spring
Grade Mean sd Mean N
3 191.7 9.74 2.5 4.57 201254 197.5 9.62 2.0 4.52 20180
5 202.8 9.74 2.0 4.57 19917
6 205.9 10.23 2.0 4.59 19784
7 208.7 10.53 2.0 4.62 19884
8 211.5 10.74 2.0 4.72 20160
9 213.6 12.18 2.0 4.79 20014
10 214.3 11.43 2.0 4.86 19,975
Spring StatusGrowth from Spring
to:
Spring of NextGrade
Grade Mean sd Mean sd N
3 194.5 9.69 5.8 6.30 201254 199.5 9.76 5.1 6.60 20180
5 204.3 10.09 3.3 6.76 19917
6 207.1 10.49 3.2 6.93 19784
7 209.9 10.73 3.0 7.51 19884
8 212.4 11.14 2.0 7.91 20160
9 214.3 12.71 2.0 8.27 20014
10 214.6 12.06 19,975

8/10/2019 n We a 2011 Norms Report
http://slidepdf.com/reader/full/n-we-a-2011-norms-report 51/268
N W E A 2 0 1 1 R I T S c a l e N o r m s | 35
References
Bryk, A. S., & Raudenbush, S. W. (1987). Application of hierarchical linear models to assessing change.Psychological Bulletin, 101, 147-158.
Betebenner, D. W. (2008). Toward a normative understanding of student growth. In K. E. Ryan & L. A.Sheppard (Eds.), The Future of Test-based Educational Accountability (pp. 155-170). New York:Taylor & Francis.
Braun, H. I. (1988). A new approach to avoiding problems of scale in interpreting trends in mentalmeasurement data. Journal of Educational Measurement, 25 (3), 171-191.
Cronbach, L. J., & Furby, L. (1970). How should we measure ‘change’—or should we? PsychologicalBulletin, 74, 68-80.
Goldstein, H. (1995). Multilevel statistical models. London: Arnold.
Good, T. L., Biddle, B. J., & Brody, J. E. (1975). Teachers make a difference. Lanham, MD: University
Press of America.
Grilli, L., & Pratesi, M. (2004) Weighted estimation in multilevel ordinal and binary models in the presenceof informative sampling designs. Survey Methodology, Vol. 30, n. 1, 93-103.
Harris, C. W. (1963). Problems in the measurement of change. Madison: University of Wisconsin Press.
Harris, D. J. (2007). Practical Issues in vertical scaling. In N. J. Dorans, M. Pommerich, & P. W. Holland,(Eds.), Linking and aligning scores and scales (pp. 233-251). New York, NY: Springer.
Holt, D., & Smith, T. M. F. (1979). Post-stratification. Journal of the Royal Statistical Society, Series A(General), 142, 1, 33-46.
Huttenlocher, J., Haight, W., Bryk, A., Seltzer, M., & Lyons, T. (1991). Early vocabulary growth: Relationto language input and gender. Developmental Psychology, 27, 236-248.
Kingsbury G. G. & Hauser, C. (2004, April). Computerized adaptive testing and No Child Left Behind.Paper presented at the annual meeting of the American Educational Research Association, SanDiego, CA.
Linn, R. L., & J. A. Slinde, J. A. (1977). The determination of the significance of change between pre- andpost-periods. Review of Educational Research, 47, 121-50.
Mahalanobis, P C (1936). On the generalised distance in statistics. Proceedings of the National Instituteof Sciences of India, 2 (1): 49–55. Retrieved 2008-11-05.
Mellenbergh, G. J. (1999). A note on simple gain score precision. Applied Psychological Measurement23, 87-89.
Northwest Evaluation Association. (2011). Technical manual: For Measures of Academic Progress (MAP)and Measures of Academic Progress for Primary Grades (MPG). Portland, OR: Author.
Owen, R. J. (1975). A Bayesian sequential procedure for quantal response in the context of adaptivetesting. Journal of the American Statistical Association, 70, 229-244.

8/10/2019 n We a 2011 Norms Report
http://slidepdf.com/reader/full/n-we-a-2011-norms-report 52/268
36 | N W E A 2 0 1 1 R I T S c a l e N o r m s
Pike, G. R. (2007). Adjusting for nonresponse in surveys. In J. C. Smart (Ed.), Higher Education:Handbook of Theory and Research (Vol. XXII, pp. 411-449). Dordrecht, The Netherlands:Springer.
Pinheiro, J.C., & Bates, D.M. (1995). Approximations to the log-likelihood function in the nonlinear mixed-effects model. Journal of Computational and Graphical Statistics, 4, 12-35.
Raudenbush, S. W. (2001). Toward a coherent framework for comparing trajectories of individual change.Collins, L., & Sayer, A. (Eds.), Best Methods for Studying Change (pp. 33-64). Washington, DC:The American Psychological Association.
Raudenbush, S. W., & Bryk, A. S. (2002). Hierarchical linear models: Applications and data analysismethods (2nd ed.). Thousand Oaks, CA: Sage.
Rogosa, D. R. (1995). Myths and methods: Myths about longitudinal research plus supplementalquestions. Pp. 3-66 in The Analysis of Change, edited by J. M. Gottman. Mahwah, NJ: LawrenceErlbaum.
Rogosa, D. R., Brandt, D., & Zimowski, M. (1982). A growth curve approach to the measurement ofchange. Psychological Bulletin 90:726-48.
Sable, J., & Plotts, C. (2010). Documentation to the NCES Common Core of Data PublicElementary/Secondary School Universe Survey: School Year 2008–09 (NCES 2010-350 rev).U.S. Department of Education. Washington, DC: National Center for Education Statistics.Retrieved November 16, 2010 from http://nces.ed.gov/pubsearch/pubs.info.asp?pubid=2010350.
SAS Institute Inc. (2008). SAS/STAT® 9.2 user’s guide. Cary, NC: SAS Institute Inc.
Seltzer, M. H., Frank, K. A., & Bryk, A. S. (1994). The metric matters: The sensitivity of conclusions aboutgrowth in student achievement to choice of metric. Educational Evaluation & Policy Analysis, 16,41-49.
Seltzer, M., Choi, K., & Thum. Y. M. (2003). Examining relationships between where students start andhow rapidly they progress. Using new developments in growth modeling to gain insight into thedistribution of achievement within schools. Educational Evaluation & Policy Analysis, 25, 263-286.
State of California, Department of Education. Office of Policy and Evaluation. Construction of California’s1999 school characteristics index and similar schools ranks. PSAA Technical Report 00-1, April2000. Retrieved May 2011 from http://www.cde.ca.gov/ta/ac/ap/documents/tdgreport0400.pdf.
Thum, Y. M. (2002). Measuring student and school progress with the California API. CSE TechnicalReport No. 578, University of California, Los Angeles, National Center for Research onEvaluation, Standards, and Student Testing (CRESST).
Thum, Y. M. (2003). Measuring progress towards a goal: Estimating teacher productivity using amultivariate multilevel model for value-added analysis. Sociological Methods & Research, 32, 2,
153-207.
Thum, Y. M., & Bowe, B. (2009). An effect-size indicator for measuring the productivity of a teacher basedon the learning growth of her students with applications. Technical Report. Grand Rapids, MI: TheNational Heritage Academies.
Thum, Y. M., & Xiang, Y. (2010). Representing the learning productivity of students at a school with aneffect-size Indicator in a pay-for-performance application. Unpublished manuscript: NWEA.

8/10/2019 n We a 2011 Norms Report
http://slidepdf.com/reader/full/n-we-a-2011-norms-report 53/268
N W E A 2 0 1 1 R I T S c a l e N o r m s | 37
Willett, J. B. (1988). “Questions and answers in the measurement of change.” Review of Research inEducation, 15, 345-422.
Williams, R. H., & Zimmerman, D. W. (1996). Are gain scores obsolete? Applied PsychologicalMeasurement, 20, 59-69.
Wolfinger, R. D. (1999). Fitting nonlinear mixed effects models with the new NLMIXED procedure.Proceedings of the 24th Annual SAS Users Group International Conference (SUGI 24), 287-296.Retrieved June 2011 from http://support.sas.com/rnd/app/papers/nlmixedsugi.pdf
Yen, W. M. (2007). Vertical scaling and No Child Left Behind. In N. J. Dorans, M. Pommerich, & P. W.Holland, (Eds.), Linking and aligning scores and scales (pp. 273-282). New York, NY: Springer

8/10/2019 n We a 2011 Norms Report
http://slidepdf.com/reader/full/n-we-a-2011-norms-report 54/268
38 | N W E A 2 0 1 1 R I T S c a l e N o r m s
This page is intentionally blank.

8/10/2019 n We a 2011 Norms Report
http://slidepdf.com/reader/full/n-we-a-2011-norms-report 55/268
N W E A 2 0 1 1 R I T S c a l e N o r m s | 39
Appendix A - Test Record Pools by Content Area,Grade Level and State for Fall , 2009 andSpring, 2010
Appendix A – Test Event Pools

8/10/2019 n We a 2011 Norms Report
http://slidepdf.com/reader/full/n-we-a-2011-norms-report 56/268
40 | N W E A 2 0 1 1 R I T S c a l e N o r m s
Table A.1. Fall 2009 READING Test Events Pool by State by Grade
Student Test Events % K-10
StateEnrlmt
% ofStateSchls
Grade
State K 1 2 3 4 5 6 7 8 9 10 Total
AK 567 1,168 1,529 1,610 1,606 1,530 1,541 1,585 1,702 1,502 1,054 15,394 14.0 2.0
AL 0 82 68 61 78 65 78 0 0 0 0 432 0.1 0.2
AR 136 399 2,293 2,303 2,199 2,078 1,893 1,769 1,198 791 710 15,769 3.8 1.0
AZ 128 659 3,297 3,530 3,355 3,391 3,219 3,003 3,031 1,361 651 25,625 2.7 3.4
CA 2,504 3,941 12,617 14,087 14,796 14,458 13,095 10,890 10,532 3,491 2,265 102,676 1.9 1.3
CO 2,502 7,051 18,496 21,860 20,769 20,346 18,280 16,843 15,574 12,261 10,777 164,759 23.4 18.1
CT 101 458 291 560 557 610 538 554 515 379 530 5,093 1.1 1.2
DC 38 46 39 0 0 0 100 128 61 0 0 412 0.7 0.5
DE 830 1,481 4,999 4,917 4,848 4,709 5,024 4,893 4,893 4,255 3,465 44,314 41.3 27.4
FL 163 166 169 235 294 234 88 228 155 39 82 1,853 0.1 0.1
GA 1,294 1,553 1,622 2,375 2,191 2,330 2,197 2,097 2,042 357 254 18,312 1.3 1.4
HI 206 256 343 451 491 541 504 415 434 397 461 4,499 2.9 2.8
IA 998 1,654 4,282 10,215 10,449 9,948 10,064 10,720 10,774 8,293 8,312 85,709 21.1 28.7
ID 0 1 71 2,755 2,803 2,716 2,584 2,461 2,722 0 0 16,113 6.8 0.8
IL 3,262 8,599 30,381 39,527 40,142 39,667 43,624 44,637 44,649 16,460 10,101 321,049 17.6 20.9
IN 7,274 12,551 21,804 21,208 20,747 20,365 20,043 18,996 19,069 16,383 8,084 186,524 20.8 16.7KS 3,712 6,594 13,227 22,653 23,031 22,260 21,988 21,618 22,472 20,993 14,023 192,571 47.6 31.6
KY 7,017 10,727 13,557 14,520 14,671 14,552 14,422 13,600 13,982 11,586 8,753 137,387 23.7 12.6
LA 0 1 291 285 293 280 236 312 340 0 0 2,038 0.3 0.1
MA 188 1,740 4,680 4,936 5,098 5,051 4,771 4,535 4,442 3,516 2,685 41,642 5.1 11.1
MD 0 66 87 9,867 10,086 9,878 9,993 10,146 10,495 2,184 1,524 64,326 8.9 6.8
ME 94 906 3,603 7,912 8,064 8,810 7,799 7,945 7,572 6,888 3,990 63,583 40.1 9.1
MI 670 3,186 8,241 8,975 9,147 9,403 9,527 9,396 9,376 6,319 4,302 78,542 5.7 3.6
MN 5,908 14,481 44,099 47,483 47,177 46,874 46,157 44,530 40,231 23,871 13,383 374,194 54.3 30.7
MO 122 761 2,469 2,007 1,817 1,702 1,812 1,433 1,279 1,011 817 15,230 1.9 4.3
MS 2,603 2,852 3,879 5,726 6,981 6,839 6,217 5,909 5,819 4,273 3,126 54,224 12.5 2.6
MT 1,237 1,912 3,293 6,339 6,099 6,383 6,510 5,615 5,175 3,722 2,774 49,059 41.0 15.0
NC 1,094 1,495 1,996 2,130 2,163 2,072 3,055 2,988 2,835 198 82 20,108 1.6 2.5
ND 1,442 2,603 5,597 5,921 5,664 5,911 5,161 5,447 5,338 6,204 5,461 54,749 68.9 23.5
NE 581 771 2,485 3,758 3,768 3,598 3,441 3,418 3,328 1,973 1,649 28,770 11.6 19.1
NH 563 2,818 4,850 6,564 6,361 5,856 6,538 6,220 5,560 3,243 2,240 50,813 30.5 5.1
NJ 2,601 4,282 6,873 8,555 8,574 9,155 8,836 7,002 6,610 1,615 1,531 65,634 5.5 12.3
NM 3,133 5,350 8,843 11,765 11,763 11,772 12,511 12,011 12,054 11,737 10,004 110,943 38.7 4.2
NV 1,818 3,086 3,507 3,677 3,693 3,605 3,594 3,475 3,587 3,147 1,995 35,184 9.2 2.8
NY 93 563 1,382 1,741 1,946 2,172 3,926 2,593 2,569 1,278 593 18,856 0.8 7.0
OH 1,170 2,480 6,002 3,831 3,417 4,231 5,952 5,929 5,681 7,350 5,194 51,237 3.3 3.8
OK 628 568 755 1,205 1,209 1,164 1,170 1,157 411 64 189 8,520 1.5 1.0
OR 141 308 435 1,343 1,316 1,310 1,328 1,397 1,312 962 293 10,145 2.2 2.5
PA 1,581 3,285 4,013 3,859 4,013 4,307 4,355 5,239 4,284 4,323 4,171 43,430 2.9 1.4
RI 0 1 1,102 1,019 1,260 1,449 1,938 1,782 2,041 2,278 826 13,696 11.2 7.7
SC 8,139 24,045 51,181 53,445 53,547 51,874 51,444 50,562 49,503 33,837 13,288 440,865 70.2 43.2
SD 0 31 18 20 26 31 24 13 6 0 0 169 0.2 0.5
TN 127 141 118 184 251 231 238 246 255 311 173 2,275 0.3 0.4
TX 4,124 4,781 8,693 8,760 8,656 9,200 7,870 7,214 6,976 1,898 1,386 69,558 1.7 1.1
UT 866 1,867 1,923 1,957 1,834 1,880 1,869 1,914 1,867 1,270 792 18,039 3.7 3.4
VA 121 238 346 1,031 776 686 1,572 1,557 1,519 798 5 8,649 0.8 3.2
VT 44 218 281 426 362 495 657 548 444 443 437 4,355 5.8 0.9
WA 3,069 6,057 12,618 21,518 22,946 23,304 23,922 24,101 23,324 18,798 8,951 188,608 21.5 13.8
WI 2,754 8,177 17,496 21,052 21,087 21,719 23,189 22,975 21,661 15,866 6,936 182,912 25.0 50.1
WV 101 162 186 142 166 116 127 143 163 0 0 1,306 0.5 0.2
WY 2,486 3,612 5,448 5,630 5,568 5,825 6,036 5,875 5,804 4,892 4,360 55,536 74.5 34.9
Total 78,230 160,230 345,875 425,930 428,155 426,983 431,057 418,064 405,666 272,817 172,679 3,565,686 8.5 6.4

8/10/2019 n We a 2011 Norms Report
http://slidepdf.com/reader/full/n-we-a-2011-norms-report 57/268
N W E A 2 0 1 1 R I T S c a l e N o r m s | 41
Table A.2. Spring 2010 READING Events Pool by State by Grade
Student Test Events% K-10State
Enrlmt
% ofStateSchls
Grade
State K 1 2 3 4 5 6 7 8 9 10 Total
AK 776 1,349 1,558 1,715 1,736 1,660 1,695 1,739 1,750 1,549 1,029 16,556 15.1 3.4
AL 84 79 0 0 0 0 0 0 0 0 0 163 0.0 0.2
AR 141 567 2,656 2,826 2,657 2,533 2,502 2,102 1,413 1,100 1,246 19,743 4.8 1.9
AZ 309 1,535 2,187 3,604 3,508 3,337 2,943 2,845 2,856 1,198 679 25,001 2.7 4.0
CA 2,787 4,256 10,454 12,602 13,350 13,467 10,589 8,872 9,389 3,767 2,538 92,071 1.7 1.6
CO 3,961 8,169 19,418 22,624 22,365 21,550 19,207 17,394 17,047 11,998 10,789 174,522 24.8 21.8
CT 323 594 306 550 422 468 291 144 123 699 321 4,241 0.9 0.8
DC 38 37 0 0 0 84 124 101 81 0 0 465 0.8 0.5
DE 835 1,374 4,185 4,458 4,511 4,357 4,285 4,023 3,990 2,496 1,930 36,444 34.0 21.4
FL 169 162 161 178 183 184 41 129 55 44 30 1,336 0.1 0.1
GA 1,180 1,367 1,197 2,189 2,062 2,190 2,605 2,665 2,680 208 163 18,506 1.3 0.8
HI 370 396 373 446 469 524 191 140 152 334 29 3,424 2.2 2.4
IA 1,367 1,865 4,589 10,593 10,860 10,513 10,414 11,180 11,203 8,423 8,241 89,248 21.9 37.2
ID 20 52 45 204 182 150 40 218 94 64 41 1,110 0.5 0.3
IL 6,285 10,807 30,528 41,679 43,434 43,589 46,214 47,203 44,447 15,759 9,754 339,699 18.6 25.9
IN 10,125 14,521 19,847 22,345 21,569 21,500 20,638 19,649 19,825 15,057 6,554 191,630 21.4 21.1
KS 5,846 7,005 11,046 19,186 19,526 18,502 18,611 18,167 18,710 13,447 8,901 158,947 39.2 26.2
KY 10,654 11,661 12,382 15,040 14,883 14,929 14,646 13,869 13,896 11,272 7,662 140,894 24.3 13.2
LA 258 268 277 278 291 261 255 277 308 0 0 2,473 0.4 0.6
MA 1,577 1,906 4,414 5,196 5,396 5,414 4,998 4,793 3,928 2,281 1,006 40,909 5.0 11.1
MD 0 71 83 9,941 10,110 9,939 10,060 10,130 10,336 807 543 62,020 8.6 6.1
ME 563 1,216 3,350 9,162 9,884 10,576 11,021 11,392 11,252 7,788 4,908 81,112 51.2 11.9
MI 4,342 6,211 9,576 12,445 12,790 13,073 13,204 12,724 12,106 6,335 4,076 106,882 7.8 6.5
MN 10,698 16,396 41,634 48,334 48,550 48,210 47,023 44,958 38,571 21,008 11,288 376,670 54.6 28.3
MO 666 1,154 2,294 1,793 1,447 1,412 1,490 885 769 757 587 13,254 1.7 3.1
MS 2,906 2,970 3,442 6,048 7,449 7,281 6,625 6,424 6,184 4,101 3,193 56,623 13.1 3.6
MT 1,902 2,298 3,180 6,376 6,199 6,797 6,994 6,990 6,290 3,815 2,824 53,665 44.9 19.2
NC 1,411 1,513 1,674 2,001 1,997 1,844 2,181 2,050 1,196 164 77 16,108 1.3 2.6
ND 3,034 3,532 5,604 6,756 6,574 6,921 6,959 7,161 7,195 7,195 6,838 67,769 85.3 33.2
NE 769 1,113 2,185 4,133 4,201 4,031 3,833 3,634 3,442 2,017 1,776 31,134 12.6 23.6NH 1,041 3,146 6,107 9,000 9,286 9,648 10,968 10,724 9,438 6,003 4,511 79,872 48.0 7.7
NJ 3,298 5,116 5,475 8,913 8,987 9,706 9,150 6,816 5,793 1,728 1,712 66,694 5.6 13.2
NM 4,562 6,084 8,569 12,415 12,153 12,272 12,612 12,197 11,968 11,065 9,074 112,971 39.4 5.1
NV 2,711 3,439 3,303 3,724 3,854 3,661 3,397 3,130 2,873 2,778 1,477 34,347 8.9 1.9
NY 467 694 1,060 1,863 2,596 3,032 3,335 2,195 2,188 1,280 553 19,263 0.8 12.8
OH 1,863 2,388 2,561 3,658 3,308 3,423 4,110 4,185 3,717 6,721 2,368 38,302 2.5 2.7
OK 882 928 543 1,388 1,451 1,375 1,174 952 378 68 165 9,304 1.7 1.1
OR 135 309 686 786 733 729 434 577 458 387 172 5,406 1.2 2.5
PA 2,532 3,300 2,426 3,913 4,081 4,487 4,366 5,047 4,428 4,162 3,588 42,330 2.8 2.2
RI 10 77 1,069 1,108 1,384 1,588 2,033 1,808 2,023 2,097 619 13,816 11.3 7.4
SC 13,223 29,624 48,792 52,166 52,170 50,285 49,399 48,192 45,424 28,598 8,488 426,361 67.9 48.0
SD 31 44 20 22 36 28 0 0 0 32 30 243 0.2 0.3
TN 130 259 240 242 273 292 144 172 157 72 54 2,035 0.2 0.2
TX 4,814 5,318 3,913 8,375 8,269 8,756 10,633 10,926 10,219 1,601 960 73,784 1.8 1.2
UT 1,304 1,960 146 257 277 288 191 0 0 0 1 4,424 0.9 1.6
VA 444 497 1,170 1,030 762 659 1,443 1,432 1,403 469 37 9,346 0.9 5.4
VT 103 271 225 475 422 471 723 800 757 547 594 5,388 7.2 1.2
WA 5,820 7,032 13,910 22,418 23,802 24,413 25,262 25,503 24,304 19,127 8,195 199,786 22.8 17.0
WI 7,084 9,833 17,545 23,881 24,426 25,412 27,808 27,474 26,960 17,462 7,238 215,123 29.4 59.2
WV 164 150 41 146 168 79 59 67 16 0 0 890 0.4 0.1
WY 3,880 4,004 5,260 6,280 6,261 6,362 6,460 6,256 6,237 5,210 4,459 60,669 81.40 51.2
Total 127,894 188,917 321,706 434,762 441,304 442,262 443,380 430,311 408,029 253,090 151,318 3,581,414 8.5 7.2

8/10/2019 n We a 2011 Norms Report
http://slidepdf.com/reader/full/n-we-a-2011-norms-report 58/268
42 | N W E A 2 0 1 1 R I T S c a l e N o r m s
Table A.3. Fall 2009 LANGUAGE USAGE Test Events Poo l by State by Grade
Student Test Events % K-10
StateEnrlmt
% ofStateSchls
Grade
State 2 3 4 5 6 7 8 9 10 Total
AK 1,290 1,498 1,485 1,449 1,537 1,594 1,685 1,438 1,010 12,986 11.8 2.8
AL 0 61 82 59 71 0 0 0 0 273 0.0 0.2
AR 1,684 2,055 1,957 1,861 1,669 1,494 921 312 317 12,270 3.0 0.7
AZ 703 1,505 1,380 1,555 2,459 2,330 2,340 354 311 12,937 1.4 3.3
CA 10,375 12,282 13,155 12,691 10,087 8,788 8,431 1,352 969 78,130 1.5 1.4
CO 10,048 13,659 13,029 12,813 11,518 10,816 10,610 8,153 7,191 97,837 13.9 13.7
CT 115 531 519 566 430 409 365 260 426 3,621 0.8 0.9
DC 0 0 0 0 104 127 60 0 0 291 0.5 0.5
DE 77 75 75 79 255 242 248 343 325 1,719 1.6 2.8
FL 26 59 175 97 46 54 103 1 0 561 0.0 0.1
GA 1,316 2,336 2,151 2,284 1,941 1,738 1,822 341 247 14,176 1.0 0.9
HI 35 144 163 151 104 11 3 4 0 615 0.4 0.7
IA 717 5,538 5,658 5,640 6,358 5,849 6,260 6,087 5,639 47,746 11.7 19.9
ID 85 932 1,021 1,129 25 15 49 0 0 3,256 1.4 0.5
IL 7,359 14,284 14,020 14,338 15,401 16,322 17,290 6,215 4,488 109,717 6.0 10.8
IN 15,304 18,259 17,825 17,260 17,052 17,533 17,624 13,556 6,497 140,910 15.7 15.2
KS 2,724 4,864 5,007 5,170 5,262 5,601 6,156 4,962 4,642 44,388 11.0 14.1
KY 6,054 9,021 9,511 10,275 9,631 8,931 9,003 5,581 4,077 72,084 12.4 10.7
LA 0 0 0 0 0 0 0 0 0 0 0.0 0.0
MA 1,016 1,218 964 1,097 629 1,003 896 600 645 8,068 1.0 4.8
MD 0 40 61 46 44 39 35 0 0 265 0.0 0.1
ME 1,182 2,123 2,352 2,752 2,679 2,922 2,787 2,356 1,353 20,506 12.9 4.7
MI 4,513 5,279 5,251 5,365 6,804 6,489 6,230 4,741 3,432 48,104 3.5 2.8
MN 7,268 10,420 10,014 10,882 10,788 10,469 8,427 6,193 2,645 77,106 11.2 10.2
MO 896 1,650 1,441 1,335 1,679 1,371 1,201 829 676 11,078 1.4 2.6
MS 3,147 5,703 6,850 6,750 6,178 5,914 5,897 3,973 2,646 47,058 10.9 2.1
MT 988 4,667 4,602 4,890 4,610 3,117 2,960 2,069 1,526 29,429 24.6 14.0
NC 665 891 849 814 931 953 781 194 81 6,159 0.5 1.5
ND 2,344 3,846 3,867 4,271 3,905 3,947 3,919 4,225 4,196 34,520 43.5 19.2
NE 1,072 3,223 3,232 3,034 2,916 2,814 2,732 1,590 1,262 21,875 8.8 17.9NH 1,548 3,226 3,237 3,202 2,357 2,778 2,731 2,165 1,575 22,819 13.7 2.6
NJ 1,386 3,383 3,291 3,607 3,451 2,809 2,642 972 872 22,413 1.9 6.4
NM 3,564 7,159 6,936 6,997 6,408 6,103 6,390 7,301 6,411 57,269 20.0 3.1
NV 1,254 1,965 2,170 2,040 1,904 1,958 1,965 1,482 598 15,336 4.0 2.4
NY 565 786 960 953 1,163 1,102 985 474 131 7,119 0.3 3.0
OH 266 1,147 982 1,320 1,040 909 1,232 2,223 1,493 10,612 0.7 1.2
OK 220 287 316 285 253 252 261 62 188 2,124 0.4 0.3
OR 83 233 237 236 203 164 179 432 179 1,946 0.4 1.3
PA 18 62 112 231 70 452 594 409 394 2,342 0.2 0.6
RI 365 325 677 572 635 613 683 799 438 5,107 4.2 3.5
SC 27,627 31,022 30,606 29,814 32,043 31,964 31,524 16,373 6,134 237,107 37.8 34.4
SD 0 0 0 0 0 0 0 0 0 0 0.0 0.0
TN 110 214 246 241 236 245 244 193 150 1,879 0.2 0.3
TX 581 5,158 5,299 5,526 1,846 1,439 879 560 483 21,771 0.5 0.8
UT 1,753 1,920 1,786 1,850 1,794 1,856 1,739 1,211 803 14,712 3.0 4.3
VA 187 688 689 658 1,276 1,513 1,290 625 3 6,929 0.7 1.6
VT 202 375 355 481 644 576 447 461 421 3,962 5.3 0.9
WA 564 1,510 1,654 1,668 1,748 2,531 2,571 2,970 1,248 16,464 1.9 3.7
WI 6,253 9,824 9,995 10,111 13,160 13,471 12,742 7,624 4,769 87,949 12.0 28.6
WV 53 123 122 81 69 85 85 0 0 618 0.3 0.2
WY 2,628 4,121 4,291 4,629 4,755 4,661 4,626 4,110 3,323 37,144 49.8 28.6
Total 130,230 199,691 200,657 203,155 200,168 196,373 192,644 126,175 84,214 1,533,307 3.6 3.9

8/10/2019 n We a 2011 Norms Report
http://slidepdf.com/reader/full/n-we-a-2011-norms-report 59/268
N W E A 2 0 1 1 R I T S c a l e N o r m s | 43
Table A.4. Spring 2010 LANGUAGE USAGE Test Events Pool by State by Grade
Student Test Events% K-10State
Enrlmt
% ofStateSchls
Grade
State 2 3 4 5 6 7 8 9 10 Total
AK 1,419 1,593 1,630 1,531 1,707 1,650 1,734 1,426 993 13,683 12.5 2.5
AR 1,669 2,051 1,963 1,835 1,620 1,252 681 504 535 12,110 1.9 5.1
AZ 721 1,329 1,139 1,318 1,031 923 850 493 424 8,228 2.0 0.9
CA 8,798 10,569 11,312 10,738 7,559 7,019 6,581 1,555 1,232 65,363 7.0 10.5
CO 11,412 14,357 14,147 13,785 11,987 11,129 11,006 7,538 6,972 102,333 1.9 3.0
CT 130 346 349 259 146 99 93 480 225 2,127 0.3 0.4
DC 0 0 0 11 106 102 80 0 0 299 0.1 0.1
DE 82 75 74 80 251 233 244 344 342 1,725 2.8 3.3
FL 23 1 50 3 0 2 43 1 22 145 0.1 1.4
GA 1,130 2,124 2,000 2,126 1,914 1,755 1,757 304 230 13,340 0.6 0.5
HI 42 109 123 116 76 11 37 36 27 577 0.0 0.2
IA 1,717 5,540 5,751 5,602 6,382 6,050 6,352 6,066 5,469 48,929 31.4 59.7
ID 23 42 1 0 10 125 8 0 0 209 0.1 0.1
IL 7,909 13,688 14,672 14,280 14,769 15,691 15,482 6,352 4,335 107,178 45.5 5.0
IN 16,529 18,884 18,293 17,910 17,224 17,571 17,638 11,685 5,465 141,199 7.7 13.9
KS 2,634 3,510 3,507 3,386 3,623 3,530 3,827 3,108 2,446 29,571 3.3 7.8
KY 5,533 7,503 7,818 7,991 6,094 5,373 6,093 5,054 3,676 55,135 13.6 8.3
MA 1,009 1,138 890 1,019 477 406 422 103 10 5,474 0.9 1.5
MD 15 35 32 7 47 39 34 0 0 209 0.0 0.1
ME 1,606 2,862 3,189 3,580 4,370 4,746 4,403 2,768 1,746 29,270 3.6 17.0
MI 5,435 7,563 7,516 7,930 9,173 8,715 8,174 4,166 2,915 61,587 8.6 11.0
MN 6,905 8,909 8,510 9,465 7,479 7,916 6,155 4,487 2,329 62,155 39.2 11.2
MO 1,978 1,538 1,237 1,202 1,346 827 683 641 530 9,982 0.7 0.8
MS 3,461 5,881 7,401 7,224 6,629 6,366 6,202 4,307 3,063 50,534 7.3 4.3
MT 1,286 4,658 4,478 4,927 4,626 4,304 4,184 2,413 1,689 32,565 4.2 12.3
NC 555 733 684 662 647 629 553 162 77 4,702 1.1 0.4
ND 3,509 4,593 4,658 5,048 4,452 4,457 4,607 4,555 4,742 40,621 34.0 20.5
NE 1,616 3,595 3,611 3,476 3,225 3,042 2,906 1,729 1,492 24,692 1.9 10.6
NH 2,858 4,614 4,842 5,617 6,401 6,268 6,177 3,933 3,077 43,787 55.1 23.3
NJ 1,497 3,174 3,295 3,416 3,305 2,670 1,938 814 788 20,897 8.4 11.3NM 4,158 7,299 7,006 7,057 6,624 6,216 5,920 6,789 5,882 56,951 34.2 6.0
NV 1,287 1,986 2,111 1,990 1,878 1,663 1,603 1,320 637 14,475 1.2 4.4
NY 550 725 785 863 695 720 594 521 107 5,560 1.9 0.4
OH 220 831 688 1,038 594 460 394 1,698 1,126 7,049 1.8 1.5
OK 340 498 522 460 373 260 259 58 60 2,830 0.1 1.9
OR 81 162 132 98 102 59 76 331 101 1,142 0.1 0.4
PA 35 97 154 285 85 311 435 275 41 1,718 0.3 1.1
RI 364 383 727 624 640 632 592 537 218 4,717 1.0 1.0
SC 25,099 27,186 26,113 26,072 28,295 28,058 25,752 15,058 4,120 205,753 13.8 10.5
SD 0 0 0 1 0 0 0 32 30 63 0.1 0.6
TN 109 127 152 153 134 161 157 75 51 1,119 0.2 0.3
TX 843 5,116 5,245 5,349 3,042 2,424 1,515 1,323 1,065 25,922 24.0 9.9
UT 26 82 172 144 9 0 0 0 0 433 0.1 0.2
VA 996 696 666 661 1,129 1,074 873 509 55 6,659 0.2 0.2
VT 225 454 414 462 710 683 629 470 495 4,542 0.9 1.9
WA 565 1,238 1,374 1,188 1,779 1,736 1,527 2,390 1,571 13,368 1.3 25.3
WI 8,583 11,877 12,467 13,380 17,059 17,622 16,674 8,573 5,088 111,323 148.3 15.4
WV 0 103 94 12 11 11 14 0 0 245 0.0 0.0
WY 3,650 4,121 4,263 4,744 5,038 4,802 4,743 4,084 3,352 38,797 5.3 15.5
Total 138,632 193,995 196,257 199,125 194,873 189,792 180,701 119,067 78,850 1,491,292 3.6 4.2

8/10/2019 n We a 2011 Norms Report
http://slidepdf.com/reader/full/n-we-a-2011-norms-report 60/268
44 | N W E A 2 0 1 1 R I T S c a l e N o r m s
Table A.5. Fall 2009 MATHEMATICS Test Events Poo l by State by Grade
Student Test Events % K-10
StateEnrlmt
% ofStateSchls
Grade
State K 1 2 3 4 5 6 7 8 9 10 Total
AK 506 1,114 1,414 1,577 1,579 1,503 1,530 1,585 1,683 1,413 775 14,679 13.4 2.4
AL 0 167 152 135 151 149 173 0 0 0 0 927 0.1 0.4
AR 132 397 2,214 2,289 2,199 2,087 1,898 1,774 1,214 604 486 15,294 3.7 1.3
AZ 122 1,896 3,225 3,493 3,367 3,393 3,183 2,968 3,023 1,148 665 26,483 2.8 3.8
CA 2,501 3,881 9,769 11,728 12,520 12,014 11,325 8,459 7,317 3,029 2,429 84,972 1.6 1.5
CO 2,619 7,158 17,922 21,665 20,651 20,161 18,461 17,167 15,588 12,276 10,279 163,947 23.3 18.8
CT 99 448 286 552 550 585 539 529 485 331 493 4,897 1.0 1.2
DC 158 112 104 60 0 0 104 127 62 0 0 727 1.2 0.5
DE 690 1,383 4,828 4,873 4,774 4,681 5,002 4,874 4,779 4,379 3,438 43,701 40.8 27.9
FL 155 159 217 336 392 283 160 130 115 95 250 2,292 0.1 0.2
GA 1,342 1,547 1,591 2,359 2,197 2,337 2,182 2,016 2,038 350 253 18,212 1.3 1.2
HI 214 294 385 501 485 547 492 405 447 367 418 4,555 2.9 3.1
IA 991 1,541 4,183 10,009 10,221 9,926 10,040 10,587 10,525 7,897 8,036 83,956 20.6 28.6
ID 0 0 0 0 0 0 0 0 0 0 0 0 0.0 0.0
IL 3,037 8,252 30,436 39,959 40,780 40,243 43,236 43,749 42,790 14,240 9,216 315,938 17.3 22.4
IN 7,305 13,664 21,208 20,999 20,687 20,213 19,812 18,673 18,678 13,338 5,443 180,020 20.1 16.6
KS 3,897 6,823 13,328 22,474 23,062 22,348 21,958 21,394 22,263 20,533 13,211 191,291 47.2 31.8
KY 7,089 10,814 13,593 14,622 14,570 14,465 14,346 13,461 13,723 10,991 8,342 136,016 23.5 12.7
LA 0 2 290 280 295 285 235 304 332 0 0 2,023 0.3 0.1
MA 15 1,498 4,355 4,887 5,072 4,941 4,794 4,442 4,377 3,394 2,509 40,284 4.9 11.5
MD 0 55 66 66 67 55 193 191 103 0 0 796 0.1 0.1
ME 97 924 3,826 7,871 8,093 8,685 7,826 7,672 7,358 6,271 3,923 62,546 39.5 9.2
MI 652 3,134 7,837 8,788 9,011 9,220 9,133 9,082 8,898 5,854 3,966 75,575 5.5 3.2
MN 5,973 14,801 43,441 46,989 47,033 46,678 46,033 44,097 39,777 23,219 12,715 370,756 53.8 29.3
MO 106 783 2,287 2,036 1,823 1,677 1,863 1,434 1,246 822 606 14,683 1.9 4.0
MS 2,456 2,773 3,819 5,632 6,896 6,701 6,191 5,817 5,708 3,806 2,234 52,033 12.0 2.5
MT 1,249 1,918 3,219 5,441 6,158 6,442 6,571 5,638 5,312 3,973 3,190 49,111 41.1 13.1
NC 1,088 1,511 1,987 2,196 2,128 2,115 3,085 2,942 2,748 152 4 19,956 1.6 2.4
ND 1,411 2,673 5,468 5,885 5,597 5,902 5,363 5,361 5,325 5,679 4,900 53,564 67.4 23.8
NE 540 765 2,471 3,751 3,765 3,574 3,404 3,406 3,281 1,955 1,594 28,506 11.5 18.9NH 579 2,689 4,806 6,655 6,541 6,015 6,601 6,178 5,572 3,113 2,429 51,178 30.7 4.7
NJ 2,610 4,240 6,868 8,391 8,531 9,199 8,834 6,964 6,593 1,897 1,756 65,883 5.6 13.9
NM 4,390 5,383 8,882 11,714 11,685 11,749 12,413 12,152 11,924 11,522 9,958 111,772 39.0 4.5
NV 1,793 3,096 3,340 3,673 3,684 3,587 3,618 3,509 3,616 3,325 2,090 35,331 9.2 2.4
NY 95 1,055 1,879 2,150 2,338 3,052 4,191 3,132 2,944 1,395 497 22,728 1.0 8.5
OH 1,088 2,474 5,848 3,829 3,432 4,205 5,852 5,633 5,568 6,602 4,454 48,985 3.2 4.2
OK 623 568 740 1,193 1,210 1,164 1,182 1,139 411 61 77 8,368 1.5 0.9
OR 145 272 416 1,240 1,257 1,297 1,319 1,280 1,275 885 277 9,663 2.1 3.0
PA 1,566 3,631 4,389 3,904 4,074 4,367 4,350 5,222 4,209 4,490 4,207 44,409 3.0 2.0
RI 0 1 1,058 1,004 1,253 1,423 1,934 1,407 1,667 1,974 585 12,306 10.1 5.8
SC 8,118 23,579 50,226 53,182 53,253 51,747 51,289 50,198 48,933 30,720 12,323 433,568 69.1 43.4
SD 23 50 56 47 50 53 26 11 9 0 0 325 0.3 0.5
TN 140 139 115 214 242 234 236 245 248 216 22 2,051 0.2 0.4
TX 4,040 4,764 8,788 8,697 8,600 9,070 7,224 6,729 6,447 2,693 1,287 68,339 1.6 1.2
UT 870 1,856 1,880 1,934 1,852 1,876 1,862 1,927 1,845 1,272 741 17,915 3.7 2.9
VA 123 186 458 987 737 682 1,567 1,530 1,296 669 6 8,241 0.8 4.5
VT 43 213 279 462 403 539 693 570 460 360 350 4,372 5.8 1.0
WA 3,154 6,185 12,805 22,450 23,881 24,391 25,968 25,222 23,945 18,367 8,454 194,822 22.3 14.6
WI 2,787 8,378 17,134 21,145 21,381 21,729 23,293 22,533 21,368 14,228 6,465 180,441 24.7 48.3
WV 101 164 194 137 166 107 114 146 152 0 0 1,281 0.5 0.2
WY 2,405 3,545 5,317 5,582 5,541 5,793 5,973 5,710 5,309 3,996 2,937 52,108 69.9 36.1
Total 79,137 162,955 339,399 410,043 414,234 413,489 417,671 399,721 382,986 253,901 158,290 3,431,826 8.1 6.3

8/10/2019 n We a 2011 Norms Report
http://slidepdf.com/reader/full/n-we-a-2011-norms-report 61/268
N W E A 2 0 1 1 R I T S c a l e N o r m s | 45
Table A.6. Spring 2010 MATHEMATICS Test Events Pool by State by Grade
Student Test Events % K-10
StateEnrlmt
% ofStateSchls
Grade
State K 1 2 3 4 5 6 7 8 9 10 Total
AK 894 1,322 1,531 1,708 1,708 1,626 1,648 1,660 1,683 1,334 737 15,851 14.5 3.0
AL 84 79 0 0 0 0 0 0 0 0 0 163 0.0 0.2
AR 139 523 2,611 2,764 2,629 2,498 2,476 2,128 1,439 1,061 520 18,788 4.5 1.6
AZ 235 1,835 2,052 3,509 3,327 3,287 2,910 2,832 2,845 1,001 641 24,474 2.6 3.5
CA 2,759 4,019 7,688 9,929 10,591 10,735 8,586 6,969 6,953 3,259 2,501 73,989 1.4 1.4
CO 4,089 8,022 18,634 22,125 21,906 21,105 19,333 17,896 17,191 11,853 10,125 172,279 24.5 20.8
CT 272 565 265 505 363 442 278 124 126 554 334 3,828 0.8 0.8
DC 144 104 0 56 0 86 120 100 82 0 0 692 1.1 1.9
DE 878 1,396 4,061 4,400 4,535 4,281 4,218 4,017 4,072 2,485 1,933 36,276 33.8 20.9
FL 167 159 192 267 287 214 53 67 50 134 221 1,811 0.1 0.2
GA 1,174 1,342 1,189 2,170 2,030 2,157 2,567 2,660 2,625 308 234 18,456 1.3 0.9
HI 404 396 356 450 426 516 191 147 154 161 67 3,268 2.1 2.1
IA 1,410 1,911 4,555 10,133 10,490 10,191 10,470 11,249 11,196 8,187 7,935 87,727 21.5 37.0
ID 0 36 0 0 0 0 0 0 0 0 0 36 0.0 0.1
IL 5,426 10,241 30,038 41,779 43,308 42,782 45,415 46,297 42,789 13,640 8,917 330,632 18.1 24.5
IN 10,094 15,477 19,385 21,944 21,253 21,260 20,493 19,489 19,254 11,978 4,813 185,440 20.7 21.3
KS 6,146 7,309 10,796 19,017 19,585 18,583 18,424 18,421 19,032 13,013 8,611 158,937 39.2 26.3
KY 10,559 11,451 12,124 14,742 14,553 14,695 14,556 13,684 13,774 11,099 8,124 139,361 24.0 13.0
LA 257 264 274 273 291 259 259 270 317 0 0 2,464 0.4 0.6
MA 1,303 1,551 4,261 5,020 5,282 5,440 4,991 4,546 3,681 2,138 1,149 39,362 4.8 10.7
MD 0 57 67 58 69 43 190 196 105 0 0 785 0.1 0.1
ME 555 1,226 3,656 9,185 9,753 10,238 10,720 11,185 11,272 7,287 4,378 79,455 50.2 11.9
MI 4,350 6,276 9,271 12,191 12,527 12,838 13,100 12,544 11,973 6,148 4,086 105,304 7.7 6.8
MN 10,879 16,220 40,796 47,712 47,814 47,764 46,011 44,004 37,348 20,962 11,815 371,325 53.8 29.3
MO 661 1,149 2,190 1,680 1,408 1,349 1,446 899 868 771 602 13,023 1.7 3.2
MS 2,843 2,957 3,419 5,903 7,376 7,151 6,529 6,225 6,057 4,376 3,012 55,848 12.9 3.8
MT 1,889 2,175 3,182 5,868 6,084 6,711 6,892 6,968 6,429 4,224 3,292 53,714 44.9 21.3
NC 1,411 1,490 1,591 1,928 1,899 1,815 2,165 2,055 1,300 133 34 15,821 1.2 2.6
ND 2,985 3,544 5,526 6,667 6,486 6,823 6,873 7,080 7,236 7,184 6,831 67,235 84.7 32.9
NE 765 1,151 2,168 4,069 4,117 3,930 3,501 3,923 3,437 2,026 1,748 30,835 12.4 24.0NH 855 3,067 6,200 9,046 9,337 9,440 10,819 10,619 9,424 6,046 4,427 79,280 47.6 8.1
NJ 3,244 4,996 5,673 9,091 9,866 9,873 9,805 7,205 5,337 1,975 1,981 69,046 5.8 11.4
NM 5,800 6,223 8,497 12,151 12,011 12,051 12,502 12,006 11,829 11,266 9,081 113,417 39.5 4.8
NV 2,584 3,391 3,250 3,701 3,760 3,729 3,447 3,134 3,007 2,830 1,589 34,422 9.0 2.4
NY 937 1,190 1,043 2,058 2,891 3,737 3,776 2,797 2,618 1,135 252 22,434 1.0 12.2
OH 1,727 2,346 2,416 3,647 3,282 3,532 4,070 4,217 3,697 6,591 2,080 37,605 2.4 2.3
OK 870 918 538 1,377 1,427 1,354 1,160 955 363 156 84 9,202 1.6 1.1
OR 137 315 710 784 720 710 483 539 552 362 203 5,515 1.2 1.9
PA 2,901 3,691 2,872 3,965 4,120 4,578 4,096 4,859 4,402 4,635 3,756 43,875 2.9 1.9
RI 52 72 1,059 1,073 1,352 1,535 1,997 1,505 1,808 2,008 696 13,157 10.7 9.0
SC 12,134 28,745 48,285 51,471 51,535 49,659 49,156 47,938 45,381 27,319 8,424 420,047 66.9 48.0
SD 57 61 19 45 58 53 0 0 0 32 31 356 0.3 0.5
TN 130 260 239 239 250 286 136 168 146 60 39 1,953 0.2 0.2
TX 4,847 5,348 4,395 8,879 8,803 8,598 10,544 10,705 9,899 4,471 1,320 77,809 1.9 1.2
UT 1,283 1,938 0 104 79 89 22 23 26 28 14 3,606 0.7 2.1
VA 442 450 1,072 994 744 936 1,466 1,369 1,084 414 37 9,008 0.9 4.5
VT 83 241 319 518 470 513 753 955 857 497 546 5,752 7.7 1.2
WA 6,110 7,203 14,078 23,321 24,716 25,524 26,580 26,853 24,795 18,401 7,377 204,958 23.4 17.3
WI 5,802 9,920 17,180 23,843 24,394 25,257 27,741 27,271 26,629 15,939 6,546 210,522 28.8 60.9
WV 167 177 34 141 170 80 57 64 14 0 0 904 0.4 0.1
WY 3,831 4,036 5,161 6,158 6,206 6,280 6,368 6,164 6,077 5,009 3,943 59,233 79.4 50.3
Total 126,765 188,835 314,918 418,658 426,288 426,633 429,393 416,981 391,233 244,490 145,086 3,529,280 8.4 7.1

8/10/2019 n We a 2011 Norms Report
http://slidepdf.com/reader/full/n-we-a-2011-norms-report 62/268
46 | N W E A 2 0 1 1 R I T S c a l e N o r m s
Table A.7. Fall 2009 GENERAL SCIENCE Test Events Pool by State by Grade
Student Test Events % K-10
StateEnrlmt
% ofStateSchls
Grade
State 3 4 5 6 7 8 9 10 Total
AK 140 235 214 49 84 108 284 136 1,250 1.1 0.8
AL 0 0 0 0 0 0 0 0 0 0.0 0.0
AR 39 41 73 64 59 80 0 0 356 0.1 0.1
AZ 219 1,597 216 238 229 1,478 82 51 4,110 0.4 3.2
CA 53 124 256 70 27 61 0 0 591 0.0 0.0
CO 2,606 3,025 5,012 4,981 5,356 5,655 3,118 3,361 33,114 4.7 7.7
CT 0 0 39 149 160 153 68 83 652 0.1 0.1
DC 0 0 0 107 125 59 0 0 291 0.5 0.5
DE 0 0 0 28 28 25 287 318 686 0.6 0.9
FL 2 305 303 81 138 164 1 0 994 0.0 0.2
GA 731 685 701 1,063 996 978 0 0 5,154 0.4 0.4
HI 1 18 5 124 141 135 39 28 491 0.3 1.0
IA 2,833 3,371 3,572 3,775 4,698 5,507 4,681 3,922 32,359 7.9 20.2
ID 0 0 0 0 0 0 0 0 0 0.0 0.0
IL 404 741 603 2,116 2,978 2,060 300 268 9,470 0.5 1.0
IN 435 808 580 788 1,767 1,765 569 265 6,977 0.8 1.0
KS 1,032 1,733 791 1,159 2,172 1,420 2,491 2,539 13,337 3.3 5.8
KY 2,209 5,618 2,250 3,182 4,197 2,816 1,850 1,712 23,834 4.1 4.2
LA 0 0 0 0 0 0 0 0 0 0.0 0.0
MA 0 0 0 0 0 0 0 0 0 0.0 0.0
MD 0 0 0 0 38 36 0 0 74 0.0 0.1
ME 268 387 531 560 1,232 1,274 1,199 895 6,346 4.0 1.4
MI 202 944 391 709 1,687 1,262 1,166 928 7,289 0.5 0.7
MN 3,800 4,636 5,228 2,149 2,369 3,130 1,226 1,123 23,661 3.4 4.1
MO 286 377 317 302 261 287 115 196 2,141 0.3 0.9
MS 114 126 531 281 311 304 344 196 2,207 0.5 0.4
MT 549 728 709 982 865 1,219 534 643 6,229 5.2 4.4
NC 21 58 518 91 168 476 0 0 1,332 0.1 0.9
ND 616 587 673 916 1,005 865 1,164 1,241 7,067 8.9 6.3
NE 376 414 539 858 1,092 1,130 662 771 5,842 2.4 6.6NH 165 166 325 450 403 462 484 295 2,750 1.7 0.4
NJ 83 68 95 88 901 860 484 50 2,629 0.2 0.8
NM 2,115 2,100 2,208 2,432 2,620 2,526 2,775 2,657 19,433 6.8 1.8
NV 366 521 511 1,685 1,901 1,959 1,568 963 9,474 2.5 0.9
NY 0 0 0 102 343 114 82 0 641 0.0 0.4
OH 958 687 1,716 2,219 2,457 2,404 4,584 3,342 18,367 1.2 1.7
OK 0 71 44 59 69 71 62 74 450 0.1 0.1
OR 0 26 26 0 25 21 140 0 238 0.1 0.1
PA 0 0 0 109 370 129 113 392 1,113 0.1 0.1
RI 0 0 0 0 0 0 0 0 0 0.0 0.0
SC 6,885 6,759 6,813 8,148 7,594 7,756 891 589 45,435 7.2 9.8
SD 0 0 0 0 0 0 0 0 0 0.0 0.0
TN 12 18 115 136 143 131 27 138 720 0.1 0.3
TX 6,900 7,662 8,301 5,619 5,263 6,088 1,105 1,859 42,797 1.0 1.0
UT 175 566 577 928 877 862 783 700 5,468 1.1 2.2
VA 0 0 0 0 0 0 0 0 0 0.0 0.0
VT 0 0 0 80 29 101 102 0 312 0.4 0.1
WA 132 467 1,759 2,064 2,418 2,692 1,942 1,598 13,072 1.5 1.6
WI 1,254 1,372 1,487 1,925 2,617 2,480 1,873 1,285 14,293 2.0 7.2
WV 17 18 12 10 10 14 0 0 81 0.0 0.0
WY 530 658 600 1,069 1,494 1,310 1,438 1,385 8,484 11.4 11.4
Total 36,528 47,717 48,641 51,945 61,717 62,427 38,633 34,003 381,611 0.9 1.4

8/10/2019 n We a 2011 Norms Report
http://slidepdf.com/reader/full/n-we-a-2011-norms-report 63/268
N W E A 2 0 1 1 R I T S c a l e N o r m s | 47
Table A.8. Spring 2010 GENERAL SCIENCE Test Events Poo l by State by Grade
Student Test Events % K-10
StateEnrlmt
% ofStateSchls
Grade
ST 3 4 5 6 7 8 9 10 Total
AK 216 244 180 41 72 122 152 85 3991 3.6 1.2
AR 38 43 67 56 63 81 0 0 941 0.2 0.1
AZ 114 164 108 194 170 135 77 41 587 0.1 0.3
CA 0 0 234 0 29 0 0 0 1136 0.0 0.0
CO 2635 3387 4829 4641 4800 5216 2944 2993 36874 5.2 6.7
CT 0 43 31 149 117 179 66 74 1310 0.3 0.3
DC 0 0 83 122 101 81 0 0 294 0.5 0.5
DE 0 0 0 0 10 20 448 437 1871 1.7 1.4
FL 1 5 235 0 1 101 1 0 266 0.0 0.0
GA 739 690 704 1180 1351 1292 0 0 2596 0.2 0.2
HI 2 1 3 121 134 140 41 29 0 0.0 0.3
IA 3522 3975 4603 4252 5523 6658 4827 4391 34709 8.5 23.2
IL 359 730 539 2198 2979 2242 219 121 10640 4.5 1.3
IN 1790 1791 1914 1751 1558 1850 281 137 16423 0.9 2.0
KS 611 629 578 732 1097 877 1260 921 7310 0.8 3.3
KY 1963 5329 1748 2626 4488 2493 1648 1579 36889 9.1 5.9
MD 0 0 0 0 20 0 0 0 526 0.1 0.1
ME 503 694 724 1294 1678 1751 947 964 11465 7.2 2.4
MI 552 2300 840 1332 2946 1853 1102 1034 21858 1.6 1.9
MN 1010 2113 2127 2690 2323 2292 1153 775 13857 2.0 2.0
MO 310 216 205 283 251 178 71 60 2807 0.4 0.8
MS 0 0 0 173 287 285 241 123 973 0.2 0.1
MT 618 709 633 992 1034 1432 764 863 5672 4.7 5.0
NC 0 0 417 63 11 318 0 0 1718 0.1 0.5
ND 722 707 779 1009 1378 1297 1213 1078 4784 6.0 7.8
NE 632 684 861 958 1163 1220 1013 1104 5404 2.2 8.6
NH 140 211 834 861 658 548 681 322 7037 4.2 0.9
NJ 160 141 235 97 894 51 507 10 6030 0.5 1.4
NM 1778 1734 1715 2056 2238 2155 2339 2186 11130 3.9 1.3
NV 320 469 441 1471 1642 1595 1357 964 7897 2.1 1.1NY 0 0 0 99 335 111 72 0 1048 0.0 0.2
OH 538 269 1331 1629 1771 1568 5257 1040 14338 0.9 0.9
OK 0 69 43 57 67 69 58 66 640 0.1 0.1
OR 0 0 0 0 0 0 101 0 271 0.1 0.1
PA 0 0 0 112 343 116 105 389 1616 0.1 0.1
RI 52 46 42 0 0 0 0 0 253 0.2 0.3
SC 5516 5508 5575 7289 6789 6807 580 354 34212 5.5 6.5
TN 18 21 24 33 57 21 63 36 0 0.0 0.0
TX 7031 7197 7676 9210 8777 8403 777 3008 39512 0.9 0.8
UT 100 141 102 52 31 11 0 0 293 0.1 0.1
VT 0 0 14 41 222 166 76 22 723 1.0 0.2
WA 94 352 2025 2046 3036 2921 2134 1162 19790 2.3 1.5
WI 1484 1625 2233 2349 2874 3303 1994 1351 19947 2.7 7.6
WV 20 18 12 10 9 14 0 0 158 0.1 0.0
WY 662 794 741 1015 1409 1503 1119 1144 10196 13.7 14.5
Total 34,250 43,049 45,485 55,284 64,736 61,475 35,688 28,863 399,992 1.1 1.4
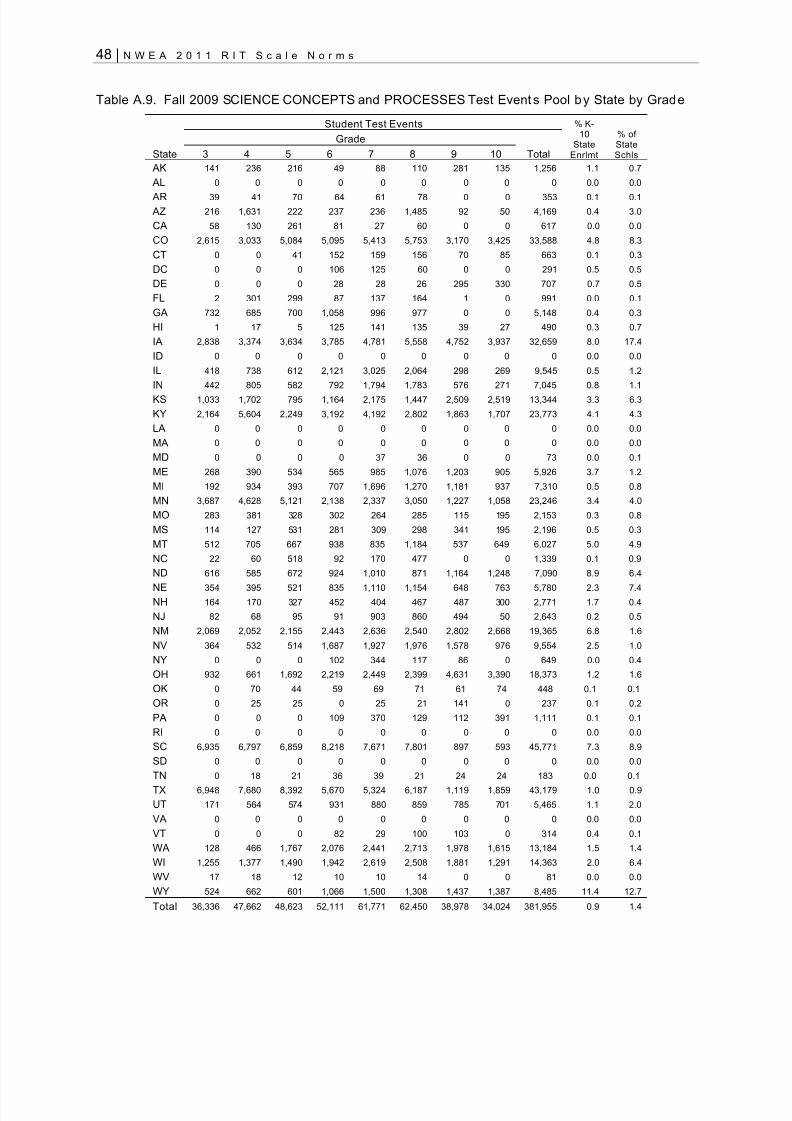
8/10/2019 n We a 2011 Norms Report
http://slidepdf.com/reader/full/n-we-a-2011-norms-report 64/268
48 | N W E A 2 0 1 1 R I T S c a l e N o r m s
Table A.9. Fall 2009 SCIENCE CONCEPTS and PROCESSES Test Events Pool by State by Grade
Student Test Events % K-10
StateEnrlmt
% ofStateSchls
Grade
State 3 4 5 6 7 8 9 10 Total
AK 141 236 216 49 88 110 281 135 1,256 1.1 0.7
AL 0 0 0 0 0 0 0 0 0 0.0 0.0
AR 39 41 70 64 61 78 0 0 353 0.1 0.1
AZ 216 1,631 222 237 236 1,485 92 50 4,169 0.4 3.0
CA 58 130 261 81 27 60 0 0 617 0.0 0.0
CO 2,615 3,033 5,084 5,095 5,413 5,753 3,170 3,425 33,588 4.8 8.3
CT 0 0 41 152 159 156 70 85 663 0.1 0.3
DC 0 0 0 106 125 60 0 0 291 0.5 0.5
DE 0 0 0 28 28 26 295 330 707 0.7 0.5
FL 2 301 299 87 137 164 1 0 991 0.0 0.1
GA 732 685 700 1,058 996 977 0 0 5,148 0.4 0.3
HI 1 17 5 125 141 135 39 27 490 0.3 0.7
IA 2,838 3,374 3,634 3,785 4,781 5,558 4,752 3,937 32,659 8.0 17.4
ID 0 0 0 0 0 0 0 0 0 0.0 0.0
IL 418 738 612 2,121 3,025 2,064 298 269 9,545 0.5 1.2
IN 442 805 582 792 1,794 1,783 576 271 7,045 0.8 1.1
KS 1,033 1,702 795 1,164 2,175 1,447 2,509 2,519 13,344 3.3 6.3
KY 2,164 5,604 2,249 3,192 4,192 2,802 1,863 1,707 23,773 4.1 4.3
LA 0 0 0 0 0 0 0 0 0 0.0 0.0
MA 0 0 0 0 0 0 0 0 0 0.0 0.0
MD 0 0 0 0 37 36 0 0 73 0.0 0.1
ME 268 390 534 565 985 1,076 1,203 905 5,926 3.7 1.2
MI 192 934 393 707 1,696 1,270 1,181 937 7,310 0.5 0.8
MN 3,687 4,628 5,121 2,138 2,337 3,050 1,227 1,058 23,246 3.4 4.0
MO 283 381 328 302 264 285 115 195 2,153 0.3 0.8
MS 114 127 531 281 309 298 341 195 2,196 0.5 0.3
MT 512 705 667 938 835 1,184 537 649 6,027 5.0 4.9
NC 22 60 518 92 170 477 0 0 1,339 0.1 0.9
ND 616 585 672 924 1,010 871 1,164 1,248 7,090 8.9 6.4
NE 354 395 521 835 1,110 1,154 648 763 5,780 2.3 7.4NH 164 170 327 452 404 467 487 300 2,771 1.7 0.4
NJ 82 68 95 91 903 860 494 50 2,643 0.2 0.5
NM 2,069 2,052 2,155 2,443 2,636 2,540 2,802 2,668 19,365 6.8 1.6
NV 364 532 514 1,687 1,927 1,976 1,578 976 9,554 2.5 1.0
NY 0 0 0 102 344 117 86 0 649 0.0 0.4
OH 932 661 1,692 2,219 2,449 2,399 4,631 3,390 18,373 1.2 1.6
OK 0 70 44 59 69 71 61 74 448 0.1 0.1
OR 0 25 25 0 25 21 141 0 237 0.1 0.2
PA 0 0 0 109 370 129 112 391 1,111 0.1 0.1
RI 0 0 0 0 0 0 0 0 0 0.0 0.0
SC 6,935 6,797 6,859 8,218 7,671 7,801 897 593 45,771 7.3 8.9
SD 0 0 0 0 0 0 0 0 0 0.0 0.0
TN 0 18 21 36 39 21 24 24 183 0.0 0.1
TX 6,948 7,680 8,392 5,670 5,324 6,187 1,119 1,859 43,179 1.0 0.9
UT 171 564 574 931 880 859 785 701 5,465 1.1 2.0
VA 0 0 0 0 0 0 0 0 0 0.0 0.0
VT 0 0 0 82 29 100 103 0 314 0.4 0.1
WA 128 466 1,767 2,076 2,441 2,713 1,978 1,615 13,184 1.5 1.4
WI 1,255 1,377 1,490 1,942 2,619 2,508 1,881 1,291 14,363 2.0 6.4
WV 17 18 12 10 10 14 0 0 81 0.0 0.0
WY 524 662 601 1,066 1,500 1,308 1,437 1,387 8,485 11.4 12.7
Total 36,336 47,662 48,623 52,111 61,771 62,450 38,978 34,024 381,955 0.9 1.4

8/10/2019 n We a 2011 Norms Report
http://slidepdf.com/reader/full/n-we-a-2011-norms-report 65/268
N W E A 2 0 1 1 R I T S c a l e N o r m s | 49
Table A.10. Spring 2010 SCIENCE CONCEPTS and PROCESSES Test Events Pool by State byGrade
Student Test Events % K-10
StateEnrlmt
% ofStateSchls
Grade
State 3 4 5 6 7 8 9 10 Total
AK 217 245 182 41 72 123 149 86 1,115 1.0 1.3
AR 37 43 64 56 66 81 0 0 347 0.1 0.4
AZ 117 167 112 205 172 137 78 42 1,030 0.1 0.3
CA 0 0 243 0 29 1 0 0 273 0.0 0.3
CO 2,670 3,425 4,893 4,687 4,851 5,240 2,984 3,032 31,782 4.5 1.2
CT 0 44 31 150 117 178 67 76 663 0.1 0.1
DC 0 0 83 128 101 81 0 0 393 0.6 0.1
DE 0 0 0 0 10 21 455 432 918 0.9 1.9
FL 1 5 233 0 1 101 1 0 342 0.0 0.9
GA 737 691 702 1,188 1,356 1,287 0 0 5,961 0.4 0.2
HI 2 1 3 121 134 142 45 29 477 0.3 0.0
IA 3,470 3,896 4,579 4,336 5,575 6,692 5,023 4,562 38,133 9.4 61.5
IL 360 728 544 2,201 2,982 2,249 223 121 9,408 0.5 3.2
IN 1,800 1,795 1,915 1,756 1,564 1,855 281 143 11,109 1.2 0.7
KS 611 632 578 728 1,113 828 1,253 920 6,663 1.6 1.9
KY 1,973 5,332 1,751 2,659 4,492 2,468 1,641 1,534 21,850 3.8 5.5
MD 0 0 0 0 22 0 0 0 22 0.0 0.1
ME 504 691 731 1,318 1,698 1,766 950 972 8,630 5.4 3.5
MI 542 2,270 846 1,337 2,955 1,849 1,105 1,045 11,949 0.9 4.7
MN 941 2,002 2,041 2,572 2,233 2,220 1,080 686 13,775 2.0 6.8
MO 316 230 207 284 250 178 71 60 1,596 0.2 0.6
MS 0 0 0 172 285 287 240 120 1,104 0.3 0.2
MT 534 688 590 948 1,005 1,402 764 868 6,799 5.7 0.8
NC 0 0 417 63 11 318 0 0 809 0.1 0.2
ND 726 706 780 1,011 1,384 1,307 1,213 1,085 8,212 10.3 5.1
NE 611 666 840 932 1,137 1,195 983 1,069 7,433 3.0 1.6
NH 141 212 845 869 659 549 686 327 4,288 2.6 2.9
NJ 160 141 234 97 896 51 507 8 2,094 0.2 1.5
NM 1,788 1,732 1,719 2,083 2,263 2,193 2,368 2,217 16,363 5.7 11.6NV 322 472 471 1,487 1,651 1,622 1,354 976 8,355 2.2 4.9
NY 0 0 0 98 340 112 74 0 624 0.0 0.0
OH 510 251 1,343 1,631 1,769 1,563 5,232 1,040 13,339 0.9 4.6
OK 0 69 43 57 67 69 58 64 427 0.1 0.0
OR 0 0 0 0 0 0 102 0 102 0.0 0.0
PA 0 0 0 112 345 116 105 393 1,071 0.1 0.6
RI 52 45 44 0 0 0 0 0 141 0.1 0.0
SC 5,594 5,518 5,600 7,369 6,885 6,869 586 364 38,785 6.2 4.8
TN 18 21 27 39 51 24 63 30 273 0.0 0.2
TX 7,055 7,207 7,716 9,296 8,866 8,575 781 3,086 52,582 1.3 2.0
UT 100 138 105 55 32 12 0 0 442 0.1 1.0
VT 0 0 18 45 220 160 76 22 541 0.7 0.3
WA 93 355 2,025 2,052 2,874 2,786 1,896 1,172 13,253 1.5 5.5
WI 1,530 1,626 2,231 2,351 2,881 3,330 1,995 1,349 17,293 2.4 3.6
WV 20 18 12 10 9 14 0 0 83 0.0 0.0
WY 666 813 740 1,015 1,414 1,505 1,128 1,152 8,433 11.3 4.7
Total 34,218 42,875 45,538 55,559 64,837 61,556 35,617 29,082 369,282 1.0 1.5

8/10/2019 n We a 2011 Norms Report
http://slidepdf.com/reader/full/n-we-a-2011-norms-report 66/268
50 | N W E A 2 0 1 1 R I T S c a l e N o r m s
This page is intentionally blank.
8/10/2019 n We a 2011 Norms Report
http://slidepdf.com/reader/full/n-we-a-2011-norms-report 67/268
N W E A 2 0 1 1 R I T S c a l e N o r m s | 51
Appendix B - Percentile Ranks of Achievement Statusin Reading, Language Usage,Mathematics, General Science, and
Science Concepts & Processes
It should be understood that the estimation of status takes into account the number of instructional weeks
preceding a test administration. This number varies between grade levels, schools, and school districts.
Each grade level in each content area and in each term have slightly different averages of instructional
weeks. These average numbers of instructional weeks were used to compute status norms and
percentiles. For reporting purposes, the numbers of instructional weeks in the following tables are cited
as approximately 4, 18, and 28 for the fall, winter, and spring terms, respectively. The observed average
numbers of instructional weeks was within two weeks of these values.
Appendix B – Achievement Status Percentile Ranks

8/10/2019 n We a 2011 Norms Report
http://slidepdf.com/reader/full/n-we-a-2011-norms-report 68/268
52 | N W E A 2 0 1 1 R I T S c a l e N o r m s
Table B.1. Fall READING
Northwest Evaluation Association
Fall Reading RIT Score to Percentile Rank Conversion
(At approximately 4 Instructional weeks)
%ile Kdg G 1 G 2 G 3 G 4 G 5 G 6 G 7 G 8 G 9 G 10 G 11 %ile
1 120 132 142 157 168 176 181 185 187 188 189 190 1
2 122 135 145 160 171 179 184 188 190 191 193 193 23 123 137 147 162 173 181 186 190 192 193 195 195 3
4 124 138 149 164 175 183 187 192 194 195 197 197 4
5 125 139 151 165 176 184 189 193 195 197 198 198 5
6 126 140 152 167 178 185 190 194 196 198 200 200 6
7 127 141 153 168 179 186 191 195 197 199 201 201 7
8 128 142 154 169 180 187 192 196 198 200 202 202 8
9 128 143 155 170 181 188 193 197 199 201 203 203 9
10 129 144 156 171 181 189 194 198 200 202 204 204 10
11 129 144 157 171 182 190 195 199 201 203 204 205 11
12 130 145 158 172 183 190 195 199 202 203 205 205 12
13 130 146 158 173 184 191 196 200 202 204 206 206 13
14 131 146 159 174 184 192 197 201 203 205 207 207 14
15 131 147 160 174 185 192 197 201 204 206 207 208 1516 132 147 160 175 185 193 198 202 204 206 208 208 16
17 132 148 161 175 186 193 198 202 205 207 208 209 17
18 133 148 162 176 186 194 199 203 205 207 209 209 18
19 133 149 162 177 187 194 199 204 206 208 210 210 19
20 133 149 163 177 188 195 200 204 207 208 210 210 20
21 134 150 163 178 188 195 200 205 207 209 211 211 21
22 134 150 164 178 188 196 201 205 208 209 211 212 22
23 134 151 164 179 189 196 201 206 208 210 212 212 23
24 135 151 165 179 189 197 202 206 209 210 212 212 24
25 135 151 165 180 190 197 202 206 209 211 213 213 25
26 135 152 166 180 190 198 203 207 209 211 213 214 26
27 136 152 166 180 191 198 203 207 210 212 214 214 27
28 136 153 167 181 191 199 204 208 210 212 214 214 28
29 136 153 167 181 192 199 204 208 211 213 214 214 29
30 137 153 168 182 192 199 204 209 211 213 215 215 30
31 137 154 168 182 192 200 205 209 212 214 215 216 31
32 137 154 168 183 193 200 205 209 212 214 216 216 32
33 138 154 169 183 193 201 206 210 212 214 216 216 33
34 138 155 169 183 194 201 206 210 213 215 217 217 34
35 138 155 170 184 194 201 206 211 213 215 217 217 35
36 138 155 170 184 194 202 207 211 214 216 217 217 36
37 139 156 170 185 195 202 207 211 214 216 218 218 37
38 139 156 171 185 195 202 208 212 214 216 218 218 38
39 139 156 171 185 195 203 208 212 215 217 219 219 39
40 140 157 172 186 196 203 208 212 215 217 219 219 40
41 140 157 172 186 196 204 209 213 216 218 219 219 41
42 140 157 172 187 197 204 209 213 216 218 220 220 42
43 140 158 173 187 197 204 209 213 216 218 220 220 43
44 141 158 173 187 197 205 210 214 217 219 221 221 44
45 141 158 174 188 198 205 210 214 217 219 221 221 45
46 141 159 174 188 198 205 211 215 217 220 221 222 46
47 141 159 174 188 198 206 211 215 218 220 222 222 47
48 142 159 175 189 199 206 211 215 218 220 222 222 48
49 142 160 175 189 199 206 212 216 219 221 223 223 49
50 142 160 176 190 199 207 212 216 219 221 223 223 50

8/10/2019 n We a 2011 Norms Report
http://slidepdf.com/reader/full/n-we-a-2011-norms-report 69/268
N W E A 2 0 1 1 R I T S c a l e N o r m s | 53
Northwest Evaluation Association
Fall Reading RIT Score to Percentile Rank Conversion
(At approximately 4 Instructional weeks)
%ile Kdg G 1 G 2 G 3 G 4 G 5 G 6 G 7 G 8 G 9 G 10 G 11 %ile
51 142 160 176 190 200 207 212 216 219 221 223 224 51
52 143 161 176 190 200 207 213 217 220 222 224 224 52
53 143 161 177 191 201 208 213 217 220 222 224 225 53
54 143 161 177 191 201 208 213 217 220 223 224 225 54
55 144 162 178 191 201 209 214 218 221 223 225 225 55
56 144 162 178 192 202 209 214 218 221 223 225 226 56
57 144 162 178 192 202 209 215 218 222 224 226 226 57
58 144 163 179 193 202 210 215 219 222 224 226 227 58
59 145 163 179 193 203 210 215 219 222 225 226 227 59
60 145 163 180 193 203 210 216 220 223 225 227 228 60
61 145 164 180 194 203 211 216 220 223 225 227 228 61
62 146 164 180 194 204 211 216 220 224 226 228 228 62
63 146 164 181 195 204 212 217 221 224 226 228 229 63
64 146 165 181 195 205 212 217 221 224 227 228 229 64
65 146 165 182 195 205 212 218 221 225 227 229 230 65
66 147 165 182 196 205 213 218 222 225 227 229 230 66
67 147 166 182 196 206 213 218 222 226 228 230 231 67
68 147 166 183 197 206 213 219 223 226 228 230 231 68
69 148 166 183 197 207 214 219 223 226 229 231 232 69
70 148 167 184 197 207 214 220 223 227 229 231 232 70
71 148 167 184 198 207 215 220 224 227 230 231 233 71
72 149 167 185 198 208 215 220 224 228 230 232 233 72
73 149 168 185 199 208 216 221 225 228 230 232 234 73
74 149 168 186 199 209 216 221 225 229 231 233 234 74
75 150 169 186 200 209 216 222 226 229 231 233 235 75
76 150 169 187 200 210 217 222 226 230 232 234 235 76
77 150 169 187 201 210 217 223 227 230 232 234 236 77
78 151 170 188 201 211 218 223 227 231 233 235 236 78
79 151 170 188 202 211 218 224 228 231 233 235 237 79
80 151 171 189 202 212 219 224 228 232 234 236 238 8081 152 171 189 203 212 219 225 229 232 234 236 238 81
82 152 172 190 203 213 220 225 229 233 235 237 239 82
83 153 172 190 204 213 220 226 230 233 236 238 240 83
84 153 173 191 205 214 221 226 230 234 236 238 240 84
85 154 173 192 205 214 222 227 231 235 237 239 241 85
86 154 174 192 206 215 222 228 231 235 238 240 242 86
87 155 174 193 207 216 223 228 232 236 238 240 243 87
88 155 175 194 207 216 224 229 233 237 239 241 244 88
89 156 176 195 208 217 224 230 234 237 240 242 245 89
90 156 177 196 209 218 225 231 234 238 241 243 246 90
91 157 177 197 210 219 226 232 235 239 242 244 247 91
92 158 178 198 211 220 227 233 236 240 243 245 248 92
93 159 179 199 212 221 228 234 237 241 244 246 249 9394 160 180 200 213 222 229 235 239 243 245 247 251 94
95 161 181 202 215 224 231 236 240 244 247 249 252 95
96 162 183 203 217 225 232 238 242 246 248 250 255 96
97 164 185 206 219 227 234 240 244 248 251 253 257 97
98 167 187 209 222 230 237 243 247 251 254 256 262 98
99 177 193 215 228 236 243 249 252 257 260 262 264 99
Note: Shaded cell values were generated assuming a normal distribution from the mean and SD of the SCI-weighted RIT scores.

8/10/2019 n We a 2011 Norms Report
http://slidepdf.com/reader/full/n-we-a-2011-norms-report 70/268
54 | N W E A 2 0 1 1 R I T S c a l e N o r m s
Table B.2. Winter READING
Northwest Evaluation Association
Winter Reading RIT Score to Percentile Rank Conversion
(At approximately 18 Instructional weeks)
%ile Kdg G 1 G 2 G 3 G 4 G 5 G 6 G 7 G 8 G 9 G 10 G 11 %ile
1 127 141 151 163 172 179 183 187 189 188 189 190 1
2 129 144 154 166 175 182 186 190 192 191 192 193 23 131 146 156 168 177 184 188 192 194 194 195 195 3
4 132 148 158 170 179 185 190 194 196 195 196 197 4
5 133 149 159 171 180 187 191 195 197 197 198 198 5
6 134 150 161 172 181 188 192 196 199 198 199 200 6
7 135 151 162 173 183 189 193 197 200 199 200 201 7
8 136 152 163 174 183 190 194 198 201 200 202 202 8
9 136 153 164 175 184 191 195 199 202 201 202 203 9
10 137 153 165 176 185 192 196 200 202 202 203 205 10
11 137 154 165 177 186 192 197 201 203 203 204 205 11
12 138 155 166 177 187 193 197 201 204 204 205 206 12
13 138 155 167 178 187 194 198 202 205 205 206 206 13
14 139 156 167 179 188 194 199 203 205 205 206 207 14
15 139 157 168 179 188 195 199 203 206 206 207 208 1516 140 157 169 180 189 196 200 204 206 207 208 208 16
17 140 158 169 181 190 196 200 205 207 207 208 209 17
18 141 158 170 181 190 197 201 205 208 208 209 210 18
19 141 159 170 182 191 197 201 206 208 208 210 211 19
20 142 159 171 182 191 198 202 206 209 209 210 211 20
21 142 160 171 183 192 198 203 207 209 209 211 211 21
22 142 160 172 183 192 199 203 207 210 210 211 212 22
23 143 161 172 184 193 199 203 208 210 210 212 212 23
24 143 161 173 184 193 200 204 208 211 211 212 212 24
25 143 161 173 185 193 200 204 208 211 211 213 213 25
26 144 162 174 185 194 200 205 209 212 212 213 214 26
27 144 162 174 185 194 201 205 209 212 212 214 214 27
28 144 163 175 186 195 201 206 210 212 213 214 214 28
29 145 163 175 186 195 202 206 210 213 213 215 215 29
30 145 163 176 187 196 202 206 211 213 214 215 215 30
31 145 164 176 187 196 203 207 211 214 214 215 216 31
32 146 164 176 188 196 203 207 211 214 214 216 216 32
33 146 165 177 188 197 203 208 212 214 215 216 217 33
34 146 165 177 188 197 204 208 212 215 215 217 217 34
35 146 165 178 189 197 204 208 212 215 216 217 218 35
36 147 166 178 189 198 204 209 213 216 216 218 218 36
37 147 166 178 189 198 205 209 213 216 217 218 218 37
38 147 166 179 190 199 205 210 214 216 217 218 219 38
39 148 167 179 190 199 206 210 214 217 217 219 219 39
40 148 167 180 191 199 206 210 214 217 218 219 220 40
41 148 167 180 191 200 206 211 215 218 218 220 220 41
42 148 168 180 191 200 207 211 215 218 219 220 221 42
43 149 168 181 192 200 207 211 215 218 219 220 221 43
44 149 168 181 192 201 207 212 216 219 219 221 221 44
45 149 169 181 192 201 208 212 216 219 220 221 222 45
46 150 169 182 193 201 208 213 216 219 220 222 222 46
47 150 169 182 193 202 208 213 217 220 220 222 222 47
48 150 170 183 194 202 209 213 217 220 221 222 222 48
49 150 170 183 194 203 209 214 218 221 221 223 223 49
50 151 171 184 195 203 210 214 218 221 222 223 223 50

8/10/2019 n We a 2011 Norms Report
http://slidepdf.com/reader/full/n-we-a-2011-norms-report 71/268
N W E A 2 0 1 1 R I T S c a l e N o r m s | 55
Northwest Evaluation Association
Winter Reading RIT Score to Percentile Rank Conversion
(At approximately 18 Instructional weeks)
%ile Kdg G 1 G 2 G 3 G 4 G 5 G 6 G 7 G 8 G 9 G 10 G 11 %ile
51 151 171 184 195 203 210 214 218 221 222 223 224 51
52 151 171 184 195 204 210 215 219 222 222 224 224 52
53 151 171 184 195 204 211 215 219 222 223 224 225 53
54 152 172 185 196 204 211 215 219 222 223 225 225 54
55 152 172 185 196 205 211 216 220 223 224 225 225 55
56 152 172 186 196 205 212 216 220 223 224 225 226 56
57 153 173 186 197 205 212 217 220 223 224 226 226 57
58 153 173 186 197 206 212 217 221 224 225 226 227 58
59 153 173 187 198 206 213 217 221 224 225 227 227 59
60 153 174 187 198 206 213 218 221 225 225 227 228 60
61 154 174 187 198 207 213 218 222 225 226 227 228 61
62 154 174 188 199 207 214 218 222 225 226 228 228 62
63 154 175 188 199 208 214 219 223 226 227 228 229 63
64 155 175 189 199 208 215 219 223 226 227 229 229 64
65 155 176 189 200 208 215 220 223 227 227 229 230 65
66 155 176 189 200 209 215 220 224 227 228 230 230 66
67 155 176 190 201 209 216 220 224 227 228 230 231 67
68 156 177 190 201 209 216 221 224 228 229 230 231 68
69 156 177 191 201 210 216 221 225 228 229 231 232 69
70 156 177 191 202 210 217 222 225 229 230 231 232 70
71 157 178 191 202 211 217 222 226 229 230 232 233 71
72 157 178 192 203 211 218 222 226 229 231 232 233 72
73 157 179 192 203 212 218 223 227 230 231 233 234 73
74 158 179 193 204 212 219 223 227 230 231 233 234 74
75 158 179 193 204 212 219 224 227 231 232 234 235 75
76 158 180 194 205 213 219 224 228 231 232 234 235 76
77 159 180 194 205 213 220 225 228 232 233 235 236 77
78 159 181 195 206 214 220 225 229 232 233 235 236 78
79 159 181 195 206 214 221 226 229 233 234 236 237 79
80 160 182 196 207 215 221 226 230 233 235 236 238 8081 160 182 196 207 215 222 227 230 234 235 237 238 81
82 161 183 197 208 216 222 227 231 234 236 237 239 82
83 161 183 197 208 216 223 228 231 235 236 238 240 83
84 162 184 198 209 217 224 228 232 236 237 239 240 84
85 162 184 199 209 218 224 229 233 236 238 239 241 85
86 163 185 199 210 218 225 230 233 237 238 240 242 86
87 163 186 200 211 219 225 230 234 238 239 241 243 87
88 164 186 201 212 220 226 231 235 238 240 242 244 88
89 164 187 202 212 220 227 232 235 239 241 242 245 89
90 165 188 202 213 221 228 233 236 240 241 243 246 90
91 165 189 203 214 222 229 233 237 241 242 244 247 91
92 166 189 204 215 223 230 234 238 242 243 245 248 92
93 167 190 205 216 224 231 235 239 243 245 246 250 9394 168 192 207 217 225 232 237 240 244 246 248 252 94
95 169 193 208 219 226 233 238 242 245 247 249 253 95
96 170 194 210 220 228 235 240 243 247 249 251 256 96
97 172 196 212 223 230 237 242 245 249 251 253 258 97
98 174 199 215 226 233 240 245 248 252 255 257 263 98
99 179 205 221 231 239 245 251 254 258 261 263 265 99
Notes: Shaded italicized values were interpolated from RIT scores at the corresponding percentiles from falland spring.

8/10/2019 n We a 2011 Norms Report
http://slidepdf.com/reader/full/n-we-a-2011-norms-report 72/268
56 | N W E A 2 0 1 1 R I T S c a l e N o r m s
Table B.3. Spring READING
Northwest Evaluation Association
Spring Reading RIT Score to Percentile Rank Conversion
(At approximately 28 Instructional weeks)
%ile Kdg G 1 G 2 G 3 G 4 G 5 G 6 G 7 G 8 G 9 G 10 G 11 %ile
1 132 145 157 167 176 181 184 188 190 188 187 190 12 134 148 160 170 179 184 187 191 193 191 191 193 2
3 136 150 162 173 181 186 189 193 195 193 193 195 3
4 137 152 164 174 182 188 191 195 197 195 195 197 4
5 138 153 165 176 184 189 193 196 198 197 197 198 5
6 139 154 167 177 185 190 194 197 199 198 198 200 6
7 140 155 168 178 186 191 195 199 201 199 199 201 7
8 141 156 169 179 187 192 196 200 202 200 200 202 8
9 142 157 170 180 188 193 197 200 202 201 201 203 9
10 142 158 170 181 189 194 198 201 203 202 202 204 10
11 143 159 171 181 189 195 198 202 204 203 203 205 11
12 144 160 172 182 190 195 199 203 205 204 204 206 12
13 144 160 173 183 191 196 200 203 206 205 205 206 13
14 145 161 173 183 191 197 200 204 206 206 206 207 14
15 145 162 174 184 192 197 201 205 207 206 206 208 15
16 146 162 175 185 192 198 202 205 207 207 207 208 16
17 146 163 175 185 193 198 202 206 208 207 208 209 17
18 147 163 176 186 194 199 203 206 209 208 208 210 18
19 147 164 176 186 194 200 203 207 209 209 209 211 19
20 148 164 177 187 195 200 204 207 210 209 210 211 20
21 148 165 177 187 195 201 204 208 210 210 210 211 21
22 148 165 178 188 196 201 205 208 211 210 211 212 22
23 149 166 178 188 196 202 205 209 211 211 211 212 23
24 149 166 179 189 196 202 206 209 212 211 212 212 24
25 149 167 179 189 197 202 206 210 212 212 212 213 25
26 150 167 180 190 197 203 207 210 213 212 213 214 26
27 150 168 180 190 198 203 207 211 213 213 213 214 27
28 151 168 181 191 198 204 208 211 213 213 214 214 28
29 151 169 181 191 199 204 208 211 214 214 214 215 29
30 151 169 182 191 199 205 208 212 214 214 215 215 30
31 152 169 182 192 199 205 209 212 215 215 215 216 31
32 152 170 182 192 200 205 209 213 215 215 216 216 32
33 152 170 183 193 200 206 210 213 216 216 216 217 33
34 153 171 183 193 201 206 210 213 216 216 217 217 34
35 153 171 184 193 201 207 210 214 216 216 217 218 35
36 153 171 184 194 201 207 211 214 217 217 218 218 36
37 153 172 184 194 202 207 211 215 217 217 218 218 37
38 154 172 185 194 202 208 212 215 218 218 218 219 38
39 154 173 185 195 202 208 212 215 218 218 219 219 39
40 154 173 186 195 203 208 212 216 218 219 219 220 40
41 155 173 186 196 203 209 213 216 219 219 220 220 41
42 155 174 186 196 204 209 213 216 219 219 220 221 42
43 155 174 187 196 204 209 214 217 219 220 221 221 43
44 156 174 187 197 204 210 214 217 220 220 221 222 44
45 156 175 187 197 205 210 214 218 220 221 221 222 45
46 156 175 188 197 205 211 215 218 221 221 222 222 46
47 156 175 188 198 205 211 215 218 221 221 222 222 47
48 157 176 189 198 206 211 215 219 221 222 223 223 48
49 157 176 189 199 206 212 216 219 222 222 223 223 49
50 157 177 190 199 207 212 216 220 222 223 224 224 50

8/10/2019 n We a 2011 Norms Report
http://slidepdf.com/reader/full/n-we-a-2011-norms-report 73/268
N W E A 2 0 1 1 R I T S c a l e N o r m s | 57
Northwest Evaluation Association
Spring Reading RIT Score to Percentile Rank Conversion
(At approximately 28 Instructional weeks)
%ile Kdg G 1 G 2 G 3 G 4 G 5 G 6 G 7 G 8 G 9 G 10 G 11 %ile
51 158 177 190 199 207 212 216 220 222 223 224 225 51
52 158 177 190 200 207 213 217 220 223 223 224 225 52
53 158 178 190 200 207 213 217 220 223 224 225 225 53
54 159 178 191 200 208 213 218 221 224 224 225 225 54
55 159 178 191 201 208 214 218 221 224 225 226 226 55
56 159 179 192 201 209 214 218 222 224 225 226 226 56
57 159 179 192 201 209 214 219 222 225 225 226 227 57
58 160 180 192 202 209 215 219 222 225 226 227 227 58
59 160 180 193 202 210 215 219 223 225 226 227 228 59
60 160 180 193 203 210 216 220 223 226 227 228 228 60
61 161 181 193 203 210 216 220 223 226 227 228 228 61
62 161 181 194 203 211 216 221 224 227 227 229 229 62
63 161 181 194 204 211 217 221 224 227 228 229 229 63
64 162 182 195 204 211 217 221 225 227 228 230 230 64
65 162 182 195 204 212 217 222 225 228 229 230 230 65
66 162 183 195 205 212 218 222 225 228 229 230 231 66
67 163 183 196 205 213 218 223 226 229 230 231 231 67
68 163 183 196 206 213 219 223 226 229 230 231 232 68
69 163 184 197 206 213 219 223 227 229 231 232 232 69
70 164 184 197 206 214 219 224 227 230 231 232 233 70
71 164 185 198 207 214 220 224 227 230 231 233 233 71
72 164 185 198 207 215 220 225 228 231 232 233 234 72
73 165 186 198 208 215 221 225 228 231 232 234 234 73
74 165 186 199 208 215 221 226 229 232 233 234 235 74
75 165 187 199 209 216 222 226 229 232 233 235 235 75
76 166 187 200 209 216 222 226 230 233 234 235 236 76
77 166 187 200 210 217 223 227 230 233 234 236 237 77
78 166 188 201 210 217 223 227 231 234 235 236 237 78
79 167 188 201 211 218 224 228 231 234 236 237 238 79
80 167 189 202 211 218 224 228 232 235 236 238 238 8081 168 190 202 212 219 225 229 232 235 237 238 239 81
82 168 190 203 212 219 225 230 233 236 237 239 240 82
83 169 191 204 213 220 226 230 233 236 238 240 240 83
84 169 191 204 213 220 226 231 234 237 239 240 241 84
85 170 192 205 214 221 227 231 234 238 239 241 242 85
86 170 193 206 215 222 228 232 235 238 240 242 243 86
87 171 193 206 215 222 228 233 236 239 241 243 244 87
88 171 194 207 216 223 229 233 236 240 242 243 244 88
89 172 195 208 217 224 230 234 237 241 242 244 245 89
90 173 196 209 218 225 230 235 238 241 243 245 246 90
91 173 196 210 218 226 231 236 239 242 244 246 248 91
92 174 197 211 219 226 232 237 240 243 245 247 249 92
93 175 199 212 221 228 233 238 241 244 247 249 250 9394 176 200 213 222 229 235 239 242 246 248 250 252 94
95 177 201 214 223 230 236 241 244 247 249 252 254 95
96 179 203 216 225 232 238 242 245 249 251 254 256 96
97 180 205 218 227 234 240 245 247 251 254 256 259 97
98 183 208 221 230 237 243 248 250 254 257 260 263 98
99 188 214 227 236 242 249 253 256 260 264 266 266 99
Note: Shaded cell values were generated assuming a normal distribution from the mean and SD of the SCI-weighted RIT scores.

8/10/2019 n We a 2011 Norms Report
http://slidepdf.com/reader/full/n-we-a-2011-norms-report 74/268
58 | N W E A 2 0 1 1 R I T S c a l e N o r m s
Table B.4. Fall LANGUAGE USAGE
Northwest Evaluation Association
Fall Language Usage RIT Score to Percentile Rank Conversion
(At approximately 4 Instructional weeks)
%ile G 2 G 3 G 4 G 5 G 6 G 7 G 8 G 9 G 10 G 11 %ile
1 142 159 170 178 183 187 190 191 192 193 1
2 145 162 173 181 186 190 193 194 195 195 23 147 164 175 183 188 191 194 196 197 197 3
4 149 166 177 185 189 193 196 198 198 198 4
5 150 167 178 186 191 194 197 199 200 200 5
6 152 168 179 187 192 195 198 200 201 201 6
7 153 170 180 188 193 196 199 201 202 202 7
8 154 171 181 189 194 197 200 202 203 203 8
9 155 171 182 190 195 198 201 203 204 204 9
10 156 172 183 191 195 199 202 204 204 204 10
11 157 173 184 191 196 200 202 204 205 205 11
12 157 174 184 192 197 200 203 205 206 206 12
13 158 174 185 193 197 201 204 206 206 207 13
14 159 175 186 193 198 201 204 206 207 207 14
15 159 176 186 194 198 202 205 207 208 208 1516 160 176 187 194 199 202 205 207 208 209 16
17 161 177 187 195 199 203 206 208 209 209 17
18 161 177 188 195 200 204 206 208 209 210 18
19 162 178 188 196 200 204 207 209 210 210 19
20 162 179 189 196 201 204 207 209 210 211 20
21 163 179 189 197 201 205 208 210 211 212 21
22 163 180 190 197 202 205 208 210 211 212 22
23 164 180 190 198 202 206 209 211 212 212 23
24 164 181 191 198 203 206 209 211 212 212 24
25 165 181 191 199 203 207 210 211 212 212 25
26 165 181 192 199 204 207 210 212 213 213 26
27 166 182 192 199 204 207 210 212 213 214 27
28 166 182 192 200 204 208 211 213 214 214 28
29 167 183 193 200 205 208 211 213 214 215 29
30 167 183 193 201 205 209 212 213 214 215 30
31 168 184 194 201 205 209 212 214 215 216 31
32 168 184 194 201 206 209 212 214 215 215 32
33 168 184 194 202 206 210 213 214 216 216 33
34 169 185 195 202 207 210 213 215 216 216 34
35 169 185 195 203 207 210 213 215 216 216 35
36 170 186 196 203 207 211 214 216 217 217 36
37 170 186 196 203 208 211 214 216 217 217 37
38 170 186 196 204 208 211 214 216 217 217 38
39 171 187 197 204 208 212 215 217 218 218 39
40 171 187 197 204 209 212 215 217 218 218 40
41 172 187 197 205 209 212 215 217 218 219 41
42 172 188 198 205 209 213 216 218 219 219 42
43 172 188 198 205 210 213 216 218 219 219 43
44 173 189 198 206 210 213 216 218 220 220 44
45 173 189 199 206 210 214 217 219 220 220 45
46 174 189 199 206 211 214 217 219 220 221 46
47 174 190 200 207 211 214 217 219 221 221 47
48 174 190 200 207 211 215 218 220 221 221 48
49 175 190 200 207 212 215 218 220 221 222 49
50 175 191 201 208 212 215 219 221 222 222 50

8/10/2019 n We a 2011 Norms Report
http://slidepdf.com/reader/full/n-we-a-2011-norms-report 75/268
N W E A 2 0 1 1 R I T S c a l e N o r m s | 59
Northwest Evaluation Association
Fall Language Usage RIT Score to Percentile Rank Conversion
(At approximately 4 Instructional weeks)
%ile G 2 G 3 G 4 G 5 G 6 G 7 G 8 G 9 G 10 G 11 %ile
51 175 191 201 208 212 216 219 221 222 222 51
52 176 192 201 208 213 216 219 221 222 223 52
53 176 192 202 209 213 216 219 221 223 223 53
54 177 192 202 209 213 217 220 222 223 223 54
55 177 193 202 209 214 217 220 222 223 224 55
56 177 193 203 210 214 217 220 222 224 224 56
57 178 193 203 210 214 218 221 223 224 225 57
58 178 194 203 210 215 218 221 223 224 225 58
59 179 194 204 211 215 218 221 223 225 225 59
60 179 194 204 211 215 219 222 224 225 226 60
61 179 195 204 211 216 219 222 224 225 226 61
62 180 195 205 212 216 219 222 224 226 227 62
63 180 196 205 212 216 220 223 225 226 227 63
64 181 196 206 212 217 220 223 225 226 227 64
65 181 196 206 213 217 221 223 225 227 228 65
66 181 197 206 213 217 221 224 226 227 228 66
67 182 197 207 214 218 221 224 226 228 229 67
68 182 198 207 214 218 222 225 226 228 229 68
69 183 198 208 214 219 222 225 227 228 229 69
70 183 198 208 215 219 222 225 227 229 230 70
71 184 199 208 215 219 223 226 228 229 230 71
72 184 199 209 216 220 223 226 228 230 231 72
73 185 200 209 216 220 224 226 228 230 231 73
74 185 200 210 216 220 224 227 229 230 232 74
75 185 201 210 217 221 224 227 229 231 232 75
76 186 201 211 217 221 225 228 230 231 233 76
77 186 202 211 218 222 225 228 230 232 233 77
78 187 202 211 218 222 226 229 231 232 234 78
79 188 203 212 219 223 226 229 231 233 234 79
80 188 203 212 219 223 227 229 231 233 235 8081 189 204 213 220 224 227 230 232 234 235 81
82 189 204 214 220 224 228 230 232 234 236 82
83 190 205 214 221 225 228 231 233 235 236 83
84 190 205 215 221 225 229 231 234 235 237 84
85 191 206 215 222 226 229 232 234 236 238 85
86 192 207 216 222 226 230 233 235 236 238 86
87 193 207 217 223 227 230 233 235 237 239 87
88 193 208 217 224 228 231 234 236 238 240 88
89 194 209 218 224 228 232 235 237 239 241 89
90 195 210 219 225 229 233 235 237 239 241 90
91 196 211 220 226 230 233 236 238 240 242 91
92 197 212 221 227 231 234 237 239 241 243 92
93 198 213 222 228 232 235 238 240 242 245 9394 199 214 223 229 233 236 239 241 243 246 94
95 201 215 224 230 234 238 240 243 245 247 95
96 203 217 226 232 236 239 242 244 246 249 96
97 205 219 228 234 238 241 244 246 248 252 97
98 208 222 231 237 240 244 247 249 251 256 98
99 214 228 237 242 246 249 252 254 257 261 99
Note: Shaded cell values were generated assuming a normal distribution from the mean and SD of theSCI-weighted RIT scores.

8/10/2019 n We a 2011 Norms Report
http://slidepdf.com/reader/full/n-we-a-2011-norms-report 76/268
60 | N W E A 2 0 1 1 R I T S c a l e N o r m s
Table B.5. Winter LANGUAGE USAGE
Northwest Evaluation Association
Winter Language Usage RIT Score to Percentile Rank Conversion
(At approximately 18 Instructional weeks)
%ile G 2 G 3 G 4 G 5 G 6 G 7 G 8 G 9 G 10 G 11 %ile
1 154 166 175 182 186 188 192 192 191 193 1
2 157 169 177 185 188 191 194 195 194 195 23 159 171 179 187 190 193 196 196 196 197 3
4 160 172 181 188 192 195 198 198 198 198 4
5 162 174 182 190 193 196 199 199 199 200 5
6 163 175 183 191 194 197 200 200 200 201 6
7 164 176 184 192 195 198 201 201 201 202 7
8 165 177 185 193 196 199 202 202 202 204 8
9 166 178 186 193 197 200 203 203 203 205 9
10 167 179 187 194 198 200 203 204 204 205 10
11 168 179 188 195 198 201 204 205 205 205 11
12 168 180 188 196 199 202 205 205 206 206 12
13 169 181 189 196 200 202 205 206 206 207 13
14 170 181 190 197 200 203 206 206 207 207 14
15 170 182 190 197 201 204 207 207 207 208 1516 171 182 191 198 201 204 207 208 208 209 16
17 171 183 191 198 202 205 208 208 209 209 17
18 172 183 192 199 202 205 208 209 209 210 18
19 172 184 192 199 203 206 209 209 210 210 19
20 173 185 193 200 203 206 209 210 210 211 20
21 173 185 193 200 204 207 209 210 211 212 21
22 174 185 194 201 204 207 210 210 211 212 22
23 174 186 194 201 205 207 210 211 212 212 23
24 175 186 195 202 205 208 211 211 212 213 24
25 175 187 195 202 205 208 211 212 212 213 25
26 176 187 195 202 206 209 212 212 213 213 26
27 176 188 196 203 206 209 212 213 213 214 27
28 177 188 196 203 207 209 212 213 214 214 28
29 177 188 197 203 207 210 213 213 214 215 29
30 177 189 197 204 207 210 213 214 215 215 30
31 178 189 197 204 208 211 213 214 215 216 31
32 178 190 198 205 208 211 214 214 215 216 32
33 179 190 198 205 208 211 214 215 216 216 33
34 179 190 198 205 209 212 215 215 216 216 34
35 179 191 199 206 209 212 215 216 216 216 35
36 180 191 199 206 209 212 215 216 217 217 36
37 180 192 200 206 210 213 216 216 217 217 37
38 181 192 200 207 210 213 216 217 218 218 38
39 181 192 200 207 210 213 216 217 218 218 39
40 181 193 201 207 211 214 217 217 218 218 40
41 182 193 201 208 211 214 217 218 219 219 41
42 182 193 201 208 211 214 217 218 219 219 42
43 182 194 202 208 212 215 218 218 219 220 43
44 183 194 202 209 212 215 218 219 220 220 44
45 183 194 202 209 212 215 218 219 220 220 45
46 184 195 203 209 213 216 219 219 220 221 46
47 184 195 203 210 213 216 219 220 221 221 47
48 184 195 203 210 213 216 219 220 221 221 48
49 185 196 204 210 214 217 220 220 222 222 49
50 185 196 204 211 214 217 220 221 222 223 50

8/10/2019 n We a 2011 Norms Report
http://slidepdf.com/reader/full/n-we-a-2011-norms-report 77/268
N W E A 2 0 1 1 R I T S c a l e N o r m s | 61
Northwest Evaluation Association
Winter Language Usage RIT Score to Percentile Rank Conversion
(At approximately 18 Instructional weeks)
%ile G 2 G 3 G 4 G 5 G 6 G 7 G 8 G 9 G 10 G 11 %ile
51 185 197 204 211 214 217 220 221 222 223 51
52 186 197 205 211 215 218 221 221 223 224 52
53 186 197 205 212 215 218 221 222 223 224 53
54 186 198 205 212 215 218 221 222 223 224 54
55 187 198 206 212 216 219 221 222 224 224 55
56 187 198 206 213 216 219 222 223 224 224 56
57 188 199 206 213 216 219 222 223 224 225 57
58 188 199 207 213 217 220 222 223 225 225 58
59 188 199 207 214 217 220 223 224 225 226 59
60 189 200 208 214 217 220 223 224 225 226 60
61 189 200 208 214 218 221 223 224 226 226 61
62 189 200 208 215 218 221 224 225 226 227 62
63 190 201 209 215 218 221 224 225 227 227 63
64 190 201 209 215 219 222 225 225 227 228 64
65 191 202 209 216 219 222 225 226 227 228 65
66 191 202 210 216 219 222 225 226 228 228 66
67 191 202 210 216 220 223 226 227 228 229 67
68 192 203 210 217 220 223 226 227 228 229 68
69 192 203 211 217 221 223 226 227 229 230 69
70 193 204 211 218 221 224 227 228 229 230 70
71 193 204 212 218 221 224 227 228 230 231 71
72 193 204 212 218 222 225 227 228 230 231 72
73 194 205 212 219 222 225 228 229 231 231 73
74 194 205 213 219 222 225 228 229 231 232 74
75 195 206 213 219 223 226 229 230 231 232 75
76 195 206 214 220 223 226 229 230 232 233 76
77 196 207 214 220 224 227 229 231 232 233 77
78 196 207 215 221 224 227 230 231 233 234 78
79 197 207 215 221 225 228 230 231 233 234 79
80 197 208 216 222 225 228 231 232 234 235 8081 198 209 216 222 226 228 231 232 234 236 81
82 198 209 217 223 226 229 232 233 235 236 82
83 199 210 217 223 227 230 232 233 235 237 83
84 199 210 218 224 227 230 233 234 236 238 84
85 200 211 218 224 228 231 233 235 237 238 85
86 201 211 219 225 228 231 234 235 237 239 86
87 201 212 219 225 229 232 235 236 238 240 87
88 202 213 220 226 229 232 235 236 239 241 88
89 203 213 221 227 230 233 236 237 239 241 89
90 204 214 222 228 231 234 237 238 240 242 90
91 204 215 222 228 232 235 237 239 241 243 91
92 205 216 223 229 233 236 238 240 242 244 92
93 207 217 224 230 234 237 239 241 243 246 9394 208 218 226 231 235 238 240 242 244 247 94
95 209 220 227 233 236 239 242 243 246 248 95
96 211 221 228 234 237 240 243 245 247 250 96
97 213 223 230 236 239 242 245 246 249 253 97
98 216 226 233 239 242 245 248 249 252 257 98
99 222 232 239 244 247 250 253 255 258 261 99
Note: Shaded italicized values were interpolated from RIT scores at the correspondingpercentiles from fall and spring.

8/10/2019 n We a 2011 Norms Report
http://slidepdf.com/reader/full/n-we-a-2011-norms-report 78/268
62 | N W E A 2 0 1 1 R I T S c a l e N o r m s
Table B.6. Spring LANGUAGE USAGE
Northwest Evaluation Association
Spring Language Usage RIT Score to Percentile Rank Conversion
(At approximately 28 Instructional weeks)
%ile G 2 G 3 G 4 G 5 G 6 G 7 G 8 G 9 G 10 G 11 %ile
1 159 170 177 184 187 189 192 191 189 193 1
2 162 173 180 187 190 192 195 194 193 195 23 164 175 182 189 192 194 197 196 195 197 3
4 165 176 184 190 193 196 198 198 197 198 4
5 167 178 185 191 195 197 200 199 198 200 5
6 168 179 186 193 196 198 201 201 199 201 6
7 169 180 187 194 197 199 202 202 200 202 7
8 170 181 188 194 198 200 203 202 202 204 8
9 171 182 189 195 198 201 204 203 202 205 9
10 172 182 190 196 199 202 204 204 203 205 10
11 172 183 190 197 200 202 205 205 204 206 11
12 173 184 191 197 201 203 206 205 205 207 12
13 174 185 192 198 201 204 206 206 206 208 13
14 174 185 192 199 202 204 207 207 206 208 14
15 175 186 193 199 202 205 207 207 207 208 1516 176 186 193 200 203 205 208 208 208 209 16
17 176 187 194 200 203 206 208 208 208 209 17
18 177 187 194 201 204 206 209 209 209 210 18
19 177 188 195 201 204 207 209 209 209 210 19
20 178 188 195 202 205 207 210 210 210 211 20
21 178 189 196 202 205 208 210 210 210 212 21
22 179 189 196 203 206 208 211 211 211 212 22
23 179 190 197 203 206 209 211 211 211 212 23
24 180 190 197 203 207 209 212 212 212 213 24
25 180 191 198 204 207 209 212 212 212 213 25
26 181 191 198 204 207 210 213 213 213 214 26
27 181 192 198 205 208 210 213 213 213 214 27
28 181 192 199 205 208 211 213 213 214 214 28
29 182 192 199 205 209 211 214 214 214 215 29
30 182 193 200 206 209 211 214 214 215 215 30
31 183 193 200 206 209 212 214 215 215 216 31
32 183 194 200 206 210 212 215 215 215 216 32
33 183 194 201 207 210 213 215 215 216 217 33
34 184 194 201 207 210 213 216 216 216 217 34
35 184 195 201 208 211 213 216 216 217 217 35
36 185 195 202 208 211 214 216 217 217 218 36
37 185 195 202 208 212 214 217 217 217 218 37
38 185 196 203 209 212 214 217 217 218 219 38
39 186 196 203 209 212 215 217 218 218 219 39
40 186 196 203 209 213 215 218 218 219 219 40
41 186 197 204 210 213 215 218 218 219 220 41
42 187 197 204 210 213 216 218 219 219 220 42
43 187 198 204 210 214 216 219 219 220 221 43
44 188 198 205 211 214 216 219 219 220 221 44
45 188 198 205 211 214 217 219 220 220 221 45
46 188 199 205 211 215 217 220 220 221 222 46
47 189 199 206 212 215 217 220 220 221 222 47
48 189 199 206 212 215 218 220 221 222 222 48
49 189 200 206 212 216 218 221 221 222 223 49
50 190 200 207 213 216 219 221 222 223 223 50

8/10/2019 n We a 2011 Norms Report
http://slidepdf.com/reader/full/n-we-a-2011-norms-report 79/268
N W E A 2 0 1 1 R I T S c a l e N o r m s | 63
Northwest Evaluation Association
Spring Language Usage RIT Score to Percentile Rank Conversion
(At approximately 28 Instructional weeks)
%ile G 2 G 3 G 4 G 5 G 6 G 7 G 8 G 9 G 10 G 11 %ile
51 190 200 207 213 216 219 221 222 223 223 51
52 190 201 207 213 217 219 222 222 223 224 52
53 191 201 208 214 217 219 222 223 224 224 53
54 191 201 208 214 217 220 222 223 224 225 54
55 191 202 208 214 218 220 223 223 224 225 55
56 192 202 209 215 218 220 223 224 225 225 56
57 192 202 209 215 218 221 223 224 225 226 57
58 193 203 209 215 219 221 224 224 225 226 58
59 193 203 210 216 219 221 224 225 226 227 59
60 193 203 210 216 219 222 224 225 226 227 60
61 194 204 210 216 220 222 225 225 227 227 61
62 194 204 211 217 220 222 225 226 227 228 62
63 194 205 211 217 220 223 225 226 227 228 63
64 195 205 212 217 221 223 226 226 228 229 64
65 195 205 212 218 221 223 226 227 228 229 65
66 196 206 212 218 221 224 226 227 229 229 66
67 196 206 213 218 222 224 227 228 229 230 67
68 196 206 213 219 222 225 227 228 229 230 68
69 197 207 213 219 222 225 228 228 230 231 69
70 197 207 214 219 223 225 228 229 230 231 70
71 198 208 214 220 223 226 228 229 231 232 71
72 198 208 215 220 224 226 229 230 231 232 72
73 198 208 215 221 224 227 229 230 232 232 73
74 199 209 215 221 224 227 229 230 232 233 74
75 199 209 216 221 225 227 230 231 233 233 75
76 200 210 216 222 225 228 230 231 233 234 76
77 200 210 217 222 226 228 231 232 234 234 77
78 201 211 217 223 226 229 231 232 234 235 78
79 201 211 218 223 227 229 232 233 235 235 79
80 202 212 218 224 227 230 232 233 235 236 8081 202 212 219 224 227 230 233 234 236 237 81
82 203 213 219 225 228 231 233 234 236 237 82
83 203 213 220 225 228 231 234 235 237 238 83
84 204 214 220 226 229 232 234 235 238 238 84
85 205 214 221 226 230 232 235 236 238 239 85
86 205 215 221 227 230 233 235 236 239 240 86
87 206 216 222 227 231 233 236 237 240 240 87
88 207 216 223 228 231 234 237 238 240 241 88
89 207 217 223 229 232 235 237 239 241 242 89
90 208 218 224 230 233 236 238 239 242 243 90
91 209 219 225 230 234 236 239 240 243 244 91
92 210 220 226 231 235 237 240 241 244 245 92
93 211 221 227 232 236 238 241 242 245 246 9394 212 222 228 233 237 239 242 243 246 248 94
95 214 223 229 235 238 241 243 245 248 249 95
96 215 225 231 236 239 242 245 246 250 251 96
97 217 227 233 238 241 244 247 248 252 254 97
98 220 230 236 241 244 247 249 251 255 258 98
99 226 235 241 246 250 252 255 257 261 262 99
Note: Shaded cell values were generated assuming a normal distribution from the mean andSD of the SCI-weighted RIT scores.

8/10/2019 n We a 2011 Norms Report
http://slidepdf.com/reader/full/n-we-a-2011-norms-report 80/268
64 | N W E A 2 0 1 1 R I T S c a l e N o r m s
Table B.7. Fall MATHEMATICS
Northwest Evaluation Association
Fall Mathematics RIT Score to Percentile Rank Conversion
(At approximately 4 Instructional weeks)
%ile Kdg G 1 G 2 G 3 G 4 G 5 G 6 G 7 G 8 G 9 G 10 G 11 %ile
1 119 133 150 164 175 182 186 189 193 195 193 195 1
2 121 136 152 167 178 185 189 192 196 199 197 198 23 122 138 154 169 180 187 191 195 199 201 200 201 3
4 124 139 156 170 181 188 193 197 201 203 202 203 4
5 125 141 157 171 182 190 195 198 202 205 204 205 5
6 126 142 158 173 183 191 196 200 204 207 205 206 6
7 126 143 159 173 184 192 197 201 205 208 207 208 7
8 127 144 160 174 185 193 198 202 206 209 208 209 8
9 128 145 161 175 186 194 199 203 207 210 209 210 9
10 129 145 161 176 187 195 200 204 208 211 210 211 10
11 129 146 162 177 188 195 201 205 209 212 211 212 11
12 130 147 163 177 188 196 201 206 210 213 212 213 12
13 130 147 163 178 189 197 202 207 211 214 213 214 13
14 131 148 164 178 189 197 203 207 212 215 214 215 14
15 131 149 165 179 190 198 203 208 212 215 215 216 1516 132 149 165 179 191 199 204 209 213 216 216 217 16
17 132 150 166 180 191 199 205 209 214 217 216 218 17
18 133 150 166 180 192 200 205 210 214 217 217 218 18
19 133 151 167 181 192 200 206 211 215 218 218 219 19
20 134 151 167 181 192 201 206 211 216 219 218 220 20
21 134 152 167 182 193 201 207 212 216 219 219 220 21
22 134 152 168 182 193 202 207 212 217 220 220 221 22
23 135 152 168 183 194 202 208 213 217 221 220 222 23
24 135 153 169 183 194 203 208 214 218 221 221 222 24
25 136 153 169 183 195 203 209 214 218 222 221 223 25
26 136 154 170 184 195 203 209 215 219 222 222 223 26
27 136 154 170 184 195 204 210 215 220 223 223 224 27
28 137 155 170 184 196 204 210 216 220 223 223 225 28
29 137 155 171 185 196 205 211 216 221 224 224 225 29
30 137 155 171 185 197 205 211 217 221 224 224 226 30
31 138 156 171 186 197 206 212 217 221 225 225 226 31
32 138 156 172 186 197 206 212 217 222 225 225 227 32
33 138 157 172 186 198 206 213 218 222 226 226 227 33
34 139 157 173 187 198 207 213 218 223 226 226 228 34
35 139 157 173 187 198 207 213 219 223 227 227 228 35
36 139 158 173 187 199 208 214 219 224 227 227 229 36
37 140 158 174 188 199 208 214 220 224 228 228 230 37
38 140 158 174 188 199 208 215 220 225 228 228 230 38
39 140 159 174 188 200 209 215 221 225 229 229 231 39
40 140 159 175 189 200 209 215 221 226 229 229 231 40
41 141 159 175 189 200 209 216 221 226 230 230 232 41
42 141 160 175 189 201 210 216 222 226 230 230 232 42
43 141 160 176 190 201 210 217 222 227 230 231 233 43
44 142 160 176 190 201 210 217 223 227 231 231 233 44
45 142 161 176 190 202 211 217 223 228 231 232 234 45
46 142 161 177 190 202 211 218 224 228 232 232 234 46
47 143 161 177 191 202 212 218 224 229 232 233 235 47
48 143 162 177 191 203 212 219 224 229 233 233 235 48
49 143 162 178 191 203 212 219 225 229 233 233 236 49
50 144 163 178 192 204 213 220 226 230 234 234 236 50

8/10/2019 n We a 2011 Norms Report
http://slidepdf.com/reader/full/n-we-a-2011-norms-report 81/268
N W E A 2 0 1 1 R I T S c a l e N o r m s | 65
Northwest Evaluation Association
Fall Mathematics RIT Score to Percentile Rank Conversion
(At approximately 4 Instructional weeks)
%ile Kdg G 1 G 2 G 3 G 4 G 5 G 6 G 7 G 8 G 9 G 10 G 11 %ile
51 144 163 178 192 204 213 220 226 230 234 234 237 51
52 144 163 179 192 204 213 220 226 231 234 235 237 52
53 144 163 179 193 204 214 220 227 231 235 235 237 53
54 145 164 179 193 205 214 221 227 232 235 236 238 54
55 145 164 179 193 205 214 221 227 232 236 236 238 55
56 145 165 180 194 205 215 222 228 232 236 237 239 56
57 146 165 180 194 206 215 222 228 233 237 237 239 57
58 146 165 180 194 206 215 222 229 233 237 238 240 58
59 146 166 181 195 206 216 223 229 234 238 238 240 59
60 146 166 181 195 207 216 223 230 234 238 239 241 60
61 147 166 181 195 207 217 224 230 235 238 239 242 61
62 147 167 182 196 207 217 224 230 235 239 240 242 62
63 147 167 182 196 208 217 224 231 236 239 240 243 63
64 148 167 183 196 208 218 225 231 236 240 241 243 64
65 148 168 183 197 209 218 225 232 236 240 241 244 65
66 148 168 183 197 209 218 226 232 237 241 242 244 66
67 149 168 184 197 209 219 226 233 237 241 242 245 67
68 149 169 184 198 210 219 227 233 238 242 243 245 68
69 149 169 184 198 210 220 227 234 238 242 243 246 69
70 150 170 185 198 210 220 227 234 239 243 244 246 70
71 150 170 185 199 211 220 228 235 239 243 244 247 71
72 150 170 185 199 211 221 228 235 240 244 245 248 72
73 151 171 186 199 212 221 229 236 240 244 245 248 73
74 151 171 186 200 212 222 229 236 241 245 246 249 74
75 152 172 187 200 212 222 230 237 241 245 247 249 75
76 152 172 187 201 213 223 230 237 242 246 247 250 76
77 152 173 187 201 213 223 231 238 243 247 248 251 77
78 153 173 188 202 214 224 231 238 243 247 248 251 78
79 153 173 188 202 214 224 232 239 244 248 249 252 79
80 154 174 189 202 215 225 232 240 244 248 250 253 8081 154 174 189 203 215 225 233 240 245 249 250 253 81
82 155 175 190 203 216 226 233 241 246 250 251 254 82
83 155 176 190 204 216 226 234 241 246 250 252 255 83
84 155 176 191 204 217 227 235 242 247 251 253 256 84
85 156 177 191 205 217 227 235 243 248 252 253 257 85
86 157 177 192 205 218 228 236 244 248 253 254 258 86
87 157 178 193 206 218 229 237 244 249 254 255 259 87
88 158 179 193 207 219 229 238 245 250 254 256 260 88
89 158 179 194 207 220 230 238 246 251 255 257 261 89
90 159 180 195 208 220 231 239 247 252 256 258 262 90
91 160 181 195 209 221 232 240 248 253 258 259 263 91
92 161 182 196 210 222 233 241 249 254 259 261 264 92
93 162 183 197 211 223 234 242 251 255 260 262 266 9394 163 184 198 212 224 235 244 252 257 262 263 268 94
95 164 185 200 213 226 236 245 254 259 263 265 270 95
96 165 187 201 214 227 238 247 256 261 265 267 272 96
97 167 189 203 216 229 240 249 258 263 268 270 276 97
98 171 192 206 219 232 243 252 262 267 272 274 281 98
99 182 197 211 224 237 249 259 268 274 279 282 283 99
Note: Shaded cell values were generated assuming a normal distribution from the mean and SD of the SCI-weighted RIT scores.

8/10/2019 n We a 2011 Norms Report
http://slidepdf.com/reader/full/n-we-a-2011-norms-report 82/268
66 | N W E A 2 0 1 1 R I T S c a l e N o r m s
Table B.8. Winter MATHEMATICS
Northwest Evaluation Association
Winter Mathematics RIT Score to Percentile Rank Conversion
(At approximately 18 Instructional weeks)
%ile Kdg G 1 G 2 G 3 G 4 G 5 G 6 G 7 G 8 G 9 G 10 G 11 %ile
1 123 144 158 171 179 186 188 191 195 195 194 196 1
2 126 147 161 173 182 189 192 194 199 199 198 199 23 128 149 162 175 184 191 194 197 201 202 201 202 3
4 129 150 164 177 185 193 196 199 203 204 203 204 4
5 130 151 165 178 187 194 197 200 205 206 205 206 5
6 131 152 166 179 188 196 199 202 206 207 207 207 6
7 132 153 167 180 189 197 200 203 208 208 208 209 7
8 133 154 168 181 190 198 201 204 209 210 209 210 8
9 134 155 169 181 191 198 202 205 210 211 210 211 9
10 135 156 169 182 191 199 203 206 211 212 212 212 10
11 135 156 170 183 192 200 204 207 212 213 213 213 11
12 136 157 171 183 193 201 204 208 213 214 213 214 12
13 136 158 171 184 193 201 205 209 213 215 214 215 13
14 137 158 172 185 194 202 206 210 214 215 215 216 14
15 138 159 172 185 195 203 206 210 215 216 216 217 1516 138 159 173 186 195 203 207 211 216 217 217 218 16
17 139 160 173 186 196 204 208 212 216 218 217 218 17
18 139 160 174 187 196 204 208 212 217 218 218 219 18
19 139 161 174 187 197 205 209 213 218 219 219 220 19
20 140 161 175 188 197 205 209 214 218 220 220 221 20
21 140 162 175 188 198 206 210 214 219 220 220 221 21
22 141 162 176 188 198 206 211 215 219 221 221 222 22
23 141 163 176 189 198 207 211 215 220 221 221 223 23
24 142 163 176 189 199 207 212 216 220 222 222 223 24
25 142 163 177 190 199 208 212 216 221 223 223 224 25
26 142 164 177 190 200 208 213 217 221 223 223 224 26
27 143 164 178 190 200 209 213 218 222 224 224 225 27
28 143 165 178 191 201 209 213 218 223 224 224 226 28
29 143 165 178 191 201 210 214 219 223 225 225 226 29
30 144 165 179 192 201 210 214 219 224 225 225 227 30
31 144 166 179 192 202 210 215 219 224 226 226 227 31
32 145 166 179 192 202 211 215 220 224 226 226 228 32
33 145 166 180 193 202 211 216 220 225 227 227 228 33
34 145 167 180 193 203 212 216 221 225 227 228 229 34
35 146 167 180 193 203 212 217 221 226 228 228 229 35
36 146 167 181 194 204 212 217 222 226 228 229 230 36
37 146 168 181 194 204 213 217 222 227 229 229 230 37
38 147 168 181 194 204 213 218 223 227 229 230 231 38
39 147 168 182 195 205 213 218 223 228 230 230 231 39
40 147 169 182 195 205 214 219 224 228 230 230 232 40
41 148 169 182 195 205 214 219 224 229 231 231 232 41
42 148 169 183 196 206 215 219 224 229 231 231 233 42
43 148 170 183 196 206 215 220 225 229 231 232 233 43
44 148 170 183 196 206 215 220 225 230 232 232 234 44
45 149 170 184 197 207 216 221 226 230 232 233 234 45
46 149 171 184 197 207 216 221 226 231 233 233 235 46
47 149 171 184 197 207 216 221 227 231 233 234 235 47
48 150 171 185 198 208 217 222 227 232 234 234 236 48
49 150 172 185 198 208 217 222 227 232 234 235 236 49
50 150 172 185 198 209 218 223 228 233 235 235 236 50

8/10/2019 n We a 2011 Norms Report
http://slidepdf.com/reader/full/n-we-a-2011-norms-report 83/268
N W E A 2 0 1 1 R I T S c a l e N o r m s | 67
Northwest Evaluation Association
Winter Mathematics RIT Score to Percentile Rank Conversion
(At approximately 18 Instructional weeks)
%ile Kdg G 1 G 2 G 3 G 4 G 5 G 6 G 7 G 8 G 9 G 10 G 11 %ile
51 151 172 185 198 209 218 223 228 233 235 236 237 51
52 151 173 186 199 209 218 223 229 233 236 236 238 52
53 151 173 186 199 209 219 224 229 234 236 237 238 53
54 152 173 186 199 210 219 224 230 234 236 237 239 54
55 152 174 187 200 210 219 224 230 235 237 238 239 55
56 152 174 187 200 210 220 225 230 235 237 238 240 56
57 153 174 187 200 211 220 225 231 236 238 239 240 57
58 153 175 188 201 211 220 226 231 236 238 239 241 58
59 153 175 188 201 211 221 226 232 236 239 240 241 59
60 154 175 188 201 212 221 226 232 237 239 240 242 60
61 154 176 189 202 212 222 227 233 237 240 240 242 61
62 154 176 189 202 212 222 227 233 238 240 241 243 62
63 154 176 189 202 213 222 228 234 238 241 241 243 63
64 155 177 190 203 213 223 228 234 239 241 242 244 64
65 155 177 190 203 214 223 229 235 239 242 242 244 65
66 156 177 190 203 214 223 229 235 240 242 243 245 66
67 156 178 191 204 214 224 229 235 240 243 244 246 67
68 156 178 191 204 215 224 230 236 241 243 244 246 68
69 157 178 191 204 215 225 230 236 241 244 245 247 69
70 157 179 192 205 215 225 231 237 242 244 245 247 70
71 157 179 192 205 216 225 231 237 242 245 246 248 71
72 158 180 192 206 216 226 232 238 243 245 246 248 72
73 158 180 193 206 217 226 232 238 243 246 247 249 73
74 158 180 193 206 217 227 233 239 244 246 247 250 74
75 159 181 194 207 217 227 233 239 244 247 248 250 75
76 159 181 194 207 218 228 234 240 245 247 249 251 76
77 160 182 194 208 218 228 234 241 245 248 249 252 77
78 160 182 195 208 219 229 235 241 246 249 250 252 78
79 160 182 195 208 219 229 235 242 246 249 250 253 79
80 161 183 196 209 220 230 236 242 247 250 251 254 8081 161 183 196 209 220 230 236 243 248 251 252 254 81
82 162 184 197 210 221 231 237 244 248 251 253 255 82
83 162 184 197 210 221 231 237 244 249 252 253 256 83
84 163 185 198 211 222 232 238 245 250 253 254 257 84
85 163 185 198 211 222 233 239 246 251 253 255 258 85
86 164 186 199 212 223 233 239 247 251 254 256 258 86
87 165 187 199 213 224 234 240 247 252 255 257 259 87
88 165 187 200 213 224 235 241 248 253 256 257 260 88
89 166 188 201 214 225 235 242 249 254 257 258 261 89
90 167 189 201 215 226 236 243 250 255 258 260 263 90
91 167 190 202 215 227 237 244 251 256 259 261 264 91
92 168 190 203 216 228 238 245 252 257 260 262 265 92
93 169 191 204 217 229 239 246 254 258 262 263 267 9394 170 192 205 218 230 240 247 255 260 263 265 269 94
95 171 194 206 219 231 242 249 257 261 265 267 271 95
96 173 195 208 221 233 243 251 259 263 267 269 273 96
97 175 197 209 223 235 245 253 261 266 270 272 277 97
98 177 200 212 225 237 248 256 265 270 273 276 282 98
99 182 205 217 230 243 254 262 272 277 281 283 284 99
Notes: Shaded italicized values were interpolated from RIT scores at the corresponding percentiles from falland spring.

8/10/2019 n We a 2011 Norms Report
http://slidepdf.com/reader/full/n-we-a-2011-norms-report 84/268
68 | N W E A 2 0 1 1 R I T S c a l e N o r m s
Table B.9. Spring MATHEMATICS
Northwest Evaluation Association
Spring Mathematics RIT Score to Percentile Rank Conversion
(At approximately 28 Instructional weeks)
%ile Kdg G 1 G 2 G 3 G 4 G 5 G 6 G 7 G 8 G 9 G 10 G 11 %ile
1 130 151 164 174 181 188 190 192 196 195 194 197 1
2 133 154 166 177 184 191 194 196 199 199 198 200 23 135 155 168 179 187 194 196 198 202 202 201 203 3
4 136 157 170 181 188 195 198 200 204 204 203 205 4
5 137 158 171 182 190 197 199 202 206 206 205 207 5
6 139 159 172 183 191 198 201 203 207 207 207 208 6
7 140 160 173 184 192 199 202 205 209 208 208 210 7
8 140 161 174 185 193 200 203 206 210 210 210 211 8
9 141 162 174 186 194 201 204 207 211 211 211 212 9
10 142 163 175 186 194 202 205 208 212 212 212 213 10
11 143 163 176 187 195 203 206 209 213 213 213 214 11
12 143 164 176 188 196 203 207 210 214 214 214 215 12
13 144 164 177 188 196 204 207 211 215 215 215 216 13
14 145 165 178 189 197 205 208 211 215 216 216 217 14
15 145 166 178 189 198 205 209 212 216 216 216 218 1516 146 166 179 190 198 206 209 213 217 217 217 219 16
17 146 167 179 190 199 207 210 214 217 218 218 219 17
18 147 167 180 191 199 207 211 214 218 219 219 220 18
19 147 168 180 191 200 208 211 215 219 219 219 221 19
20 148 168 180 192 200 208 212 216 219 220 220 222 20
21 148 168 181 192 201 209 212 216 220 221 221 222 21
22 149 169 181 193 201 209 213 217 221 221 221 223 22
23 149 169 182 193 202 210 214 217 221 222 222 224 23
24 149 170 182 194 202 210 214 218 222 223 223 224 24
25 150 170 183 194 203 211 215 218 222 223 223 225 25
26 150 171 183 194 203 211 215 219 223 224 224 226 26
27 151 171 183 195 204 212 216 220 223 224 225 226 27
28 151 171 184 195 204 212 216 220 224 225 225 227 28
29 151 172 184 196 204 213 216 221 224 225 226 227 29
30 152 172 184 196 205 213 217 221 225 226 226 228 30
31 152 172 185 196 205 213 217 222 225 226 227 228 31
32 153 173 185 197 206 214 218 222 226 227 227 229 32
33 153 173 185 197 206 214 218 223 226 228 228 230 33
34 153 173 186 197 206 215 219 223 227 228 228 230 34
35 154 174 186 198 207 215 219 223 227 229 229 231 35
36 154 174 186 198 207 215 220 224 228 229 229 231 36
37 154 174 187 198 208 216 220 224 228 230 230 232 37
38 155 175 187 199 208 216 220 225 229 230 230 232 38
39 155 175 187 199 208 217 221 225 229 231 231 233 39
40 155 175 188 199 209 217 221 226 230 231 231 233 40
41 156 176 188 200 209 217 222 226 230 231 232 234 41
42 156 176 188 200 209 218 222 227 231 232 232 234 42
43 156 176 189 200 210 218 222 227 231 232 233 235 43
44 157 177 189 201 210 218 223 228 232 233 233 235 44
45 157 177 189 201 210 219 223 228 232 233 234 236 45
46 157 177 190 201 211 219 224 228 232 234 234 236 46
47 158 178 190 202 211 220 224 229 233 234 235 237 47
48 158 178 190 202 211 220 224 229 233 235 235 237 48
49 158 178 191 202 212 220 225 230 234 235 236 238 49
50 159 179 191 203 212 221 226 230 234 236 237 238 50

8/10/2019 n We a 2011 Norms Report
http://slidepdf.com/reader/full/n-we-a-2011-norms-report 85/268
N W E A 2 0 1 1 R I T S c a l e N o r m s | 69
Northwest Evaluation Association
Spring Mathematics RIT Score to Percentile Rank Conversion
(At approximately 28 Instructional weeks)
%ile Kdg G 1 G 2 G 3 G 4 G 5 G 6 G 7 G 8 G 9 G 10 G 11 %ile
51 159 179 191 203 213 221 226 231 235 236 237 239 51
52 159 179 192 203 213 221 226 231 235 237 237 239 52
53 160 180 192 204 213 222 227 232 236 237 238 240 53
54 160 180 192 204 214 222 227 232 236 238 238 240 54
55 160 180 193 204 214 223 227 232 236 238 239 241 55
56 161 181 193 205 214 223 228 233 237 239 239 241 56
57 161 181 193 205 215 223 228 233 237 239 240 242 57
58 161 181 193 205 215 224 229 234 238 240 240 242 58
59 162 182 194 206 215 224 229 234 238 240 241 243 59
60 162 182 194 206 216 224 229 235 239 240 241 243 60
61 162 182 194 206 216 225 230 235 239 241 242 244 61
62 163 183 195 207 216 225 230 236 240 241 242 244 62
63 163 183 195 207 217 226 231 236 240 242 243 245 63
64 164 183 195 207 217 226 231 237 241 242 243 245 64
65 164 184 196 208 218 226 231 237 241 243 244 246 65
66 164 184 196 208 218 227 232 237 242 243 244 247 66
67 165 184 196 208 218 227 232 238 242 244 245 247 67
68 165 185 197 209 219 228 233 238 243 245 245 248 68
69 165 185 197 209 219 228 233 239 243 245 246 248 69
70 166 185 198 210 220 228 234 239 244 246 247 249 70
71 166 186 198 210 220 229 234 240 244 246 247 249 71
72 167 186 198 210 220 229 235 240 245 247 248 250 72
73 167 186 199 211 221 230 235 241 245 247 248 251 73
74 167 187 199 211 221 230 236 242 246 248 249 251 74
75 168 187 199 212 222 231 236 242 246 248 249 252 75
76 168 188 200 212 222 231 237 243 247 249 250 253 76
77 169 188 200 212 223 232 237 243 247 250 251 253 77
78 169 189 201 213 223 232 238 244 248 250 251 254 78
79 170 189 201 213 224 233 238 244 249 251 252 255 79
80 170 189 202 214 224 233 239 245 249 252 253 255 8081 170 190 202 214 225 234 239 246 250 252 253 256 81
82 171 190 203 215 225 234 240 246 251 253 254 257 82
83 171 191 203 215 226 235 241 247 251 254 255 258 83
84 172 191 204 216 226 236 241 248 252 255 256 258 84
85 173 192 204 216 227 236 242 249 253 255 257 259 85
86 173 193 205 217 228 237 243 249 253 256 257 260 86
87 174 193 205 218 228 238 244 250 254 257 258 261 87
88 174 194 206 218 229 238 244 251 255 258 259 262 88
89 175 194 207 219 230 239 245 252 256 259 260 263 89
90 176 195 207 220 230 240 246 253 257 260 261 265 90
91 177 196 208 220 231 241 247 254 258 261 263 266 91
92 178 197 209 221 232 242 248 255 259 263 264 267 92
93 179 198 210 222 233 243 249 257 261 264 265 269 9394 180 199 211 223 234 244 251 258 262 265 267 271 94
95 181 200 212 225 236 246 252 260 264 267 269 273 95
96 183 202 214 226 237 247 254 262 266 269 271 275 96
97 185 203 215 228 240 250 257 264 269 272 274 279 97
98 187 206 218 231 243 253 260 268 272 276 278 284 98
99 193 211 223 236 248 259 266 275 279 284 286 286 99
Note: Shaded cell values were generated assuming a normal distribution from the mean and SD of the SCI-weighted RIT scores.

8/10/2019 n We a 2011 Norms Report
http://slidepdf.com/reader/full/n-we-a-2011-norms-report 86/268
70 | N W E A 2 0 1 1 R I T S c a l e N o r m s
Table B.10. End-of-Course MATHEMATICS
Northwest Evaluation Association
End-of-Course Upper Level Mathematics RIT Score toPercentile Rank Conversion
%ile Algebra 1 Geometry Algebra 2 %ile
1 200 209 213 1
2 205 214 217 2
3 208 217 220 3
4 210 219 222 4
5 212 221 223 5
6 213 223 225 6
7 215 224 226 7
8 216 225 227 8
9 217 226 228 9
10 218 227 229 10
11219 228 230
11
12 220 229 231 12
13 221 230 232 13
14 222 231 232 14
15 222 232 233 15
16 223 232 234 16
17 224 233 234 17
18 224 234 235 18
19 225 234 236 19
20 226 235 236 20
21 226 236 237 21
22 227 236 237 22
23 228 237 238 23
24 228 237 238 24
25 229 238 239 2526 229 238 239 26
27 230 239 240 27
28 230 239 240 28
29 231 240 241 29
30 231 240 241 30
31 232 241 242 31
32 232 241 242 32
33 233 242 243 33
34 233 242 243 34
35 234 243 244 35
36 234 243 244 36
37 235 244 244 37
38 235 244 245 38
39 235 245 245 3940 236 245 246 40
41 236 246 246 41
42 237 246 246 42
43 237 246 247 43
44 238 247 247 44
45 238 247 248 45
46 239 248 248 46
47 239 248 248 47
48 239 249 249 48
49 240 249 249 49

8/10/2019 n We a 2011 Norms Report
http://slidepdf.com/reader/full/n-we-a-2011-norms-report 87/268
N W E A 2 0 1 1 R I T S c a l e N o r m s | 71
Northwest Evaluation AssociationEnd-of-Course Upper Level Mathematics RIT Score to
Percentile Rank Conversion
%ile Algebra 1 Geometry Algebra 2 %ile
50 240 249 250 50
51 241 250 250 51
52 241 250 251 52
53 242 251 251 53
54 242 251 251 54
55 242 252 252 55
56 243 252 252 56
57 243 253 253 57
58 244 253 253 58
59 244 253 253 59
60 245 254 254 60
61 245 254 254 61
62 246 255 255 62
63 246 255 255 63
64 246 256 255 6465 247 256 256 65
66 247 257 256 66
67 248 257 257 67
68 248 258 257 68
69 249 258 258 69
70 249 259 258 70
71 250 259 259 71
72 250 260 259 72
73 251 260 259 73
74 251 261 260 74
75 252 261 260 75
76 252 262 261 76
77 253 262 262 77
78 254 263 262 7879 254 263 263 79
80 255 264 263 80
81 255 265 264 81
82 256 265 264 82
83 257 266 265 83
84 257 267 266 84
85 258 267 266 85
86 259 268 267 86
87 260 269 268 87
88 261 270 268 88
89 261 271 269 89
90 262 272 270 90
91 263 273 271 91
92 264 274 272 9293 266 275 273 93
94 267 276 275 94
95 269 278 276 95
96 270 280 278 96
97 273 282 280 97
98 276 285 283 98
99 280 290 287 99

8/10/2019 n We a 2011 Norms Report
http://slidepdf.com/reader/full/n-we-a-2011-norms-report 88/268
72 | N W E A 2 0 1 1 R I T S c a l e N o r m s
Table B.11. Fall GENERAL SCIENCE
Northwest Evaluation Association
Fall General Science RIT Score to Percentile Rank Conversion
(At approximately 4 Instructional weeks)
%ile G 3 G 4 G 5 G 6 G 7 G 8 G 9 G 10 %ile
1 165 173 178 181 183 185 187 187 1
2 168 175 180 183 185 188 189 190 23 169 177 181 185 187 190 191 192 3
4 171 178 183 186 188 191 192 193 4
5 172 179 184 187 189 192 193 194 5
6 172 180 185 188 190 193 194 195 6
7 173 181 185 189 191 194 195 196 7
8 174 182 186 190 192 195 196 197 8
9 175 182 187 190 193 195 197 198 9
10 175 183 187 191 193 196 198 199 10
11 176 183 188 192 194 197 198 199 11
12 176 184 189 192 195 197 199 200 12
13 177 184 189 193 195 198 199 201 13
14 177 185 189 193 196 198 200 201 14
15 178 185 190 194 196 199 200 202 1516 178 186 190 194 197 199 201 202 16
17 179 186 191 195 197 200 201 203 17
18 179 187 191 195 197 200 202 203 18
19 179 187 192 195 198 201 202 204 19
20 180 187 192 196 198 201 203 204 20
21 180 188 192 196 199 202 203 204 21
22 180 188 193 197 199 202 204 205 22
23 181 188 193 197 199 202 204 205 23
24 181 189 193 197 200 203 204 206 24
25 182 189 194 198 200 203 205 206 25
26 182 189 194 198 201 203 205 207 26
27 182 190 194 198 201 204 206 207 27
28 182 190 195 199 201 204 206 207 28
29 183 190 195 199 202 204 206 208 29
30 183 191 195 199 202 205 207 208 30
31 183 191 196 200 202 205 207 208 31
32 184 191 196 200 203 205 207 209 32
33 184 191 196 200 203 206 208 209 33
34 184 192 197 200 203 206 208 209 34
35 185 192 197 201 203 206 208 210 35
36 185 192 197 201 204 207 209 210 36
37 185 193 197 201 204 207 209 210 37
38 185 193 198 202 204 207 209 211 38
39 186 193 198 202 205 208 209 211 39
40 186 193 198 202 205 208 210 211 40
41 186 194 199 203 205 208 210 212 41
42 186 194 199 203 206 208 210 212 42
43 187 194 199 203 206 209 211 212 43
44 187 194 199 203 206 209 211 213 44
45 187 195 200 204 206 209 211 213 45
46 188 195 200 204 207 210 212 213 46
47 188 195 200 204 207 210 212 214 47
48 188 196 200 204 207 210 212 214 48
49 188 196 201 205 208 211 213 214 49
50 189 196 201 205 208 211 213 215 50

8/10/2019 n We a 2011 Norms Report
http://slidepdf.com/reader/full/n-we-a-2011-norms-report 89/268
N W E A 2 0 1 1 R I T S c a l e N o r m s | 73
Northwest Evaluation Association
Fall General Science RIT Score to Percentile Rank Conversion
(At approximately 4 Instructional weeks)
%ile G 3 G 4 G 5 G 6 G 7 G 8 G 9 G 10 %ile
51 189 196 201 205 208 211 213 215 51
52 189 197 201 206 208 211 213 215 52
53 189 197 202 206 209 212 214 216 53
54 190 197 202 206 209 212 214 216 54
55 190 197 202 206 209 212 214 216 55
56 190 198 203 207 210 213 215 216 56
57 191 198 203 207 210 213 215 217 57
58 191 198 203 207 210 213 215 217 58
59 191 198 203 208 210 213 216 217 59
60 191 199 204 208 211 214 216 218 60
61 192 199 204 208 211 214 216 218 61
62 192 199 204 208 211 214 217 218 62
63 192 200 204 209 212 215 217 219 63
64 192 200 205 209 212 215 217 219 64
65 193 200 205 209 212 215 217 219 65
66 193 200 205 210 213 216 218 220 66
67 193 201 206 210 213 216 218 220 67
68 194 201 206 210 213 216 218 220 68
69 194 201 206 211 214 217 219 221 69
70 194 202 207 211 214 217 219 221 70
71 195 202 207 211 214 217 220 222 71
72 195 202 207 211 215 218 220 222 72
73 195 202 208 212 215 218 220 222 73
74 195 203 208 212 215 218 221 223 74
75 196 203 208 213 216 219 221 223 75
76 196 203 209 213 216 219 221 223 76
77 197 204 209 213 216 219 222 224 77
78 197 204 209 214 217 220 222 224 78
79 197 204 210 214 217 220 223 225 79
80 198 205 210 214 218 221 223 225 8081 198 205 210 215 218 221 223 226 81
82 198 206 211 215 218 222 224 226 82
83 199 206 211 216 219 222 224 227 83
84 199 206 212 216 219 223 225 227 84
85 200 207 212 217 220 223 225 228 85
86 200 207 213 217 220 224 226 228 86
87 201 208 213 218 221 224 227 229 87
88 201 208 214 218 221 225 227 229 88
89 202 209 214 219 222 225 228 230 89
90 202 210 215 219 223 226 228 231 90
91 203 210 215 220 223 227 229 232 91
92 204 211 216 221 224 227 230 232 92
93 205 212 217 222 225 228 231 233 9394 205 213 218 223 226 229 232 234 94
95 206 214 219 224 227 230 233 236 95
96 208 215 220 225 228 232 235 237 96
97 209 216 222 227 230 234 236 239 97
98 212 219 224 229 232 236 239 242 98
99 216 223 228 233 237 241 244 247 99

8/10/2019 n We a 2011 Norms Report
http://slidepdf.com/reader/full/n-we-a-2011-norms-report 90/268
74 | N W E A 2 0 1 1 R I T S c a l e N o r m s
Table B.12. Winter GENERAL SCIENCE
Northwest Evaluation Association
Winter General Science RIT Score to Percentile Rank Conversion
(At approximately 18 Instructional weeks)
%ile G 3 G 4 G 5 G 6 G 7 G 8 G 9 G 10 %ile
1 170 176 180 183 185 186 187 188 1
2 172 178 182 185 187 189 189 190 23 173 180 184 187 189 191 191 192 3
4 175 181 185 188 190 192 192 194 4
5 176 182 186 189 191 193 194 195 5
6 176 183 187 190 192 194 195 196 6
7 177 183 188 191 193 195 196 197 7
8 178 184 189 191 194 196 196 198 8
9 179 185 189 192 194 197 197 199 9
10 179 185 190 193 195 197 198 199 10
11 180 186 190 193 195 198 198 200 11
12 180 186 191 194 196 198 199 201 12
13 181 187 191 194 197 199 200 201 13
14 181 187 192 195 197 199 200 202 14
15 182 188 192 195 198 200 201 202 1516 182 188 193 196 198 200 201 203 16
17 182 189 193 196 198 201 202 203 17
18 183 189 194 197 199 201 202 204 18
19 183 189 194 197 199 202 203 204 19
20 184 190 194 197 200 202 203 205 20
21 184 190 195 198 200 203 203 205 21
22 184 190 195 198 200 203 204 206 22
23 185 191 196 198 201 203 204 206 23
24 185 191 196 199 201 204 205 206 24
25 185 191 196 199 202 204 205 207 25
26 186 192 197 199 202 205 205 207 26
27 186 192 197 200 202 205 206 208 27
28 186 192 197 200 203 205 206 208 28
29 186 193 197 200 203 206 207 208 29
30 187 193 198 201 203 206 207 209 30
31 187 193 198 201 204 206 207 209 31
32 187 194 198 201 204 207 208 209 32
33 188 194 199 202 204 207 208 210 33
34 188 194 199 202 205 207 208 210 34
35 188 194 199 202 205 208 209 210 35
36 188 195 200 203 205 208 209 211 36
37 189 195 200 203 205 208 209 211 37
38 189 195 200 203 206 208 210 211 38
39 189 195 200 203 206 209 210 212 39
40 190 196 201 204 206 209 210 212 40
41 190 196 201 204 207 209 210 212 41
42 190 196 201 204 207 210 211 213 42
43 190 197 201 205 207 210 211 213 43
44 191 197 202 205 207 210 211 213 44
45 191 197 202 205 208 211 212 214 45
46 191 197 202 205 208 211 212 214 46
47 191 198 203 206 208 211 212 214 47
48 192 198 203 206 209 211 213 215 48
49 192 198 203 206 209 212 213 215 49
50 192 199 204 207 209 212 214 216 50

8/10/2019 n We a 2011 Norms Report
http://slidepdf.com/reader/full/n-we-a-2011-norms-report 91/268
N W E A 2 0 1 1 R I T S c a l e N o r m s | 75
Northwest Evaluation Association
Winter General Science RIT Score to Percentile Rank Conversion
(At approximately 18 Instructional weeks)
%ile G 3 G 4 G 5 G 6 G 7 G 8 G 9 G 10 %ile
51 192 199 204 207 209 212 214 216 51
52 193 199 204 207 210 213 214 216 52
53 193 199 204 207 210 213 214 216 53
54 193 199 204 208 210 213 214 217 54
55 193 200 205 208 211 214 215 217 55
56 194 200 205 208 211 214 215 217 56
57 194 200 205 208 211 214 215 217 57
58 194 200 205 209 211 214 216 218 58
59 194 201 206 209 212 215 216 218 59
60 195 201 206 209 212 215 216 218 60
61 195 201 206 209 212 215 217 219 61
62 195 201 207 210 213 216 217 219 62
63 196 202 207 210 213 216 217 219 63
64 196 202 207 210 213 216 218 220 64
65 196 202 207 211 213 217 218 220 65
66 196 203 208 211 214 217 218 220 66
67 197 203 208 211 214 217 219 221 67
68 197 203 208 212 214 218 219 221 68
69 197 203 209 212 215 218 219 222 69
70 198 204 209 212 215 218 220 222 70
71 198 204 209 212 215 219 220 222 71
72 198 204 210 213 216 219 220 223 72
73 198 205 210 213 216 219 221 223 73
74 199 205 210 213 216 220 221 223 74
75 199 205 211 214 217 220 222 224 75
76 199 206 211 214 217 220 222 224 76
77 200 206 211 214 218 221 222 225 77
78 200 206 212 215 218 221 223 225 78
79 200 207 212 215 218 222 223 225 79
80 201 207 212 216 219 222 224 226 8081 201 207 213 216 219 222 224 226 81
82 202 208 213 216 220 223 224 227 82
83 202 208 214 217 220 223 225 227 83
84 202 209 214 217 220 224 225 228 84
85 203 209 214 218 221 224 226 228 85
86 203 210 215 218 221 225 227 229 86
87 204 210 215 219 222 225 227 230 87
88 204 211 216 219 223 226 228 230 88
89 205 211 217 220 223 227 228 231 89
90 205 212 217 221 224 227 229 232 90
91 206 212 218 221 224 228 230 232 91
92 207 213 219 222 225 229 231 233 92
93 208 214 219 223 226 230 232 234 9394 208 215 220 224 227 231 233 235 94
95 209 216 221 225 228 232 234 236 95
96 211 217 223 226 229 233 235 238 96
97 212 218 224 228 231 235 237 240 97
98 214 220 226 230 233 237 240 242 98
99 218 225 231 234 238 242 244 248 99

8/10/2019 n We a 2011 Norms Report
http://slidepdf.com/reader/full/n-we-a-2011-norms-report 92/268
76 | N W E A 2 0 1 1 R I T S c a l e N o r m s
Table B.13. Spring GENERAL SCIENCE
Northwest Evaluation Association
Spring General Science RIT Score to Percentile Rank Conversion
(At approximately 28 Instructional weeks)
%ile G 3 G 4 G 5 G 6 G 7 G 8 G 9 G 10 %ile
1 173 178 181 184 185 186 186 187 1
2 175 180 183 186 188 189 189 190 23 176 181 185 188 190 191 191 192 3
4 177 183 186 189 191 192 192 193 4
5 178 184 187 190 192 193 193 195 5
6 179 185 188 191 193 194 195 196 6
7 180 185 189 192 194 195 195 197 7
8 181 186 190 192 195 196 196 198 8
9 181 187 190 193 195 197 197 198 9
10 182 187 191 194 196 198 198 199 10
11 183 188 192 194 197 198 199 200 11
12 183 188 192 195 197 199 199 201 12
13 184 189 193 195 198 199 200 201 13
14 184 189 193 196 198 200 200 202 14
15 184 190 194 196 199 201 201 202 1516 185 190 194 197 199 201 201 203 16
17 185 191 194 197 200 202 202 203 17
18 186 191 195 198 200 202 202 204 18
19 186 191 195 198 201 202 203 204 19
20 186 192 196 199 201 203 203 205 20
21 187 192 196 199 201 203 204 205 21
22 187 192 196 199 202 204 204 206 22
23 188 193 197 200 202 204 205 206 23
24 188 193 197 200 202 205 205 207 24
25 188 193 198 200 203 205 205 207 25
26 188 194 198 201 203 205 206 207 26
27 189 194 198 201 204 206 206 208 27
28 189 194 199 201 204 206 207 208 28
29 189 195 199 202 204 206 207 209 29
30 190 195 199 202 205 207 207 209 30
31 190 195 199 202 205 207 208 209 31
32 190 196 200 203 205 207 208 210 32
33 191 196 200 203 205 208 208 210 33
34 191 196 200 203 206 208 209 210 34
35 191 196 201 204 206 208 209 211 35
36 191 197 201 204 206 209 209 211 36
37 192 197 201 204 207 209 210 212 37
38 192 197 202 204 207 209 210 212 38
39 192 198 202 205 207 210 210 212 39
40 193 198 202 205 208 210 211 213 40
41 193 198 202 205 208 210 211 213 41
42 193 198 203 206 208 211 211 213 42
43 193 199 203 206 209 211 212 214 43
44 194 199 203 206 209 211 212 214 44
45 194 199 204 206 209 212 212 214 45
46 194 199 204 207 209 212 213 215 46
47 194 200 204 207 210 212 213 215 47
48 195 200 204 207 210 213 213 215 48
49 195 200 205 207 210 213 214 216 49
50 195 201 205 208 211 213 214 216 50
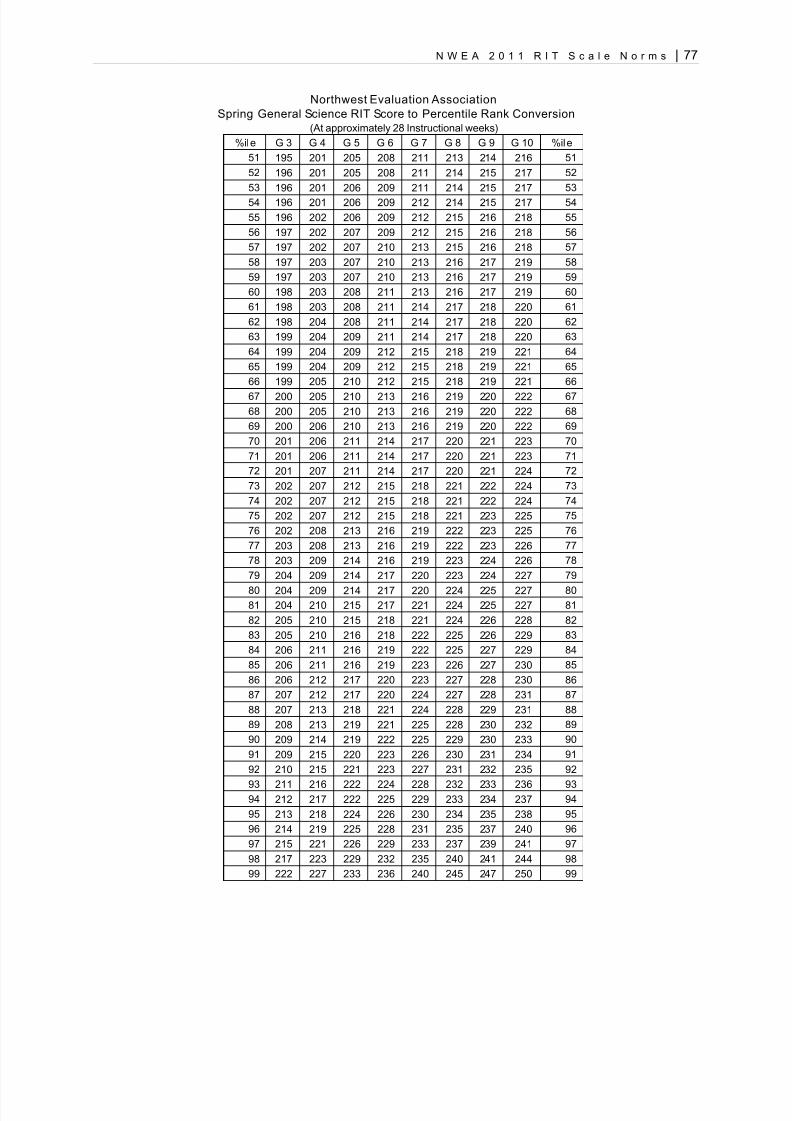
8/10/2019 n We a 2011 Norms Report
http://slidepdf.com/reader/full/n-we-a-2011-norms-report 93/268
N W E A 2 0 1 1 R I T S c a l e N o r m s | 77
Northwest Evaluation Association
Spring General Science RIT Score to Percentile Rank Conversion
(At approximately 28 Instructional weeks)
%ile G 3 G 4 G 5 G 6 G 7 G 8 G 9 G 10 %ile
51 195 201 205 208 211 213 214 216 51
52 196 201 205 208 211 214 215 217 52
53 196 201 206 209 211 214 215 217 53
54 196 201 206 209 212 214 215 217 54
55 196 202 206 209 212 215 216 218 55
56 197 202 207 209 212 215 216 218 56
57 197 202 207 210 213 215 216 218 57
58 197 203 207 210 213 216 217 219 58
59 197 203 207 210 213 216 217 219 59
60 198 203 208 211 213 216 217 219 60
61 198 203 208 211 214 217 218 220 61
62 198 204 208 211 214 217 218 220 62
63 199 204 209 211 214 217 218 220 63
64 199 204 209 212 215 218 219 221 64
65 199 204 209 212 215 218 219 221 65
66 199 205 210 212 215 218 219 221 66
67 200 205 210 213 216 219 220 222 67
68 200 205 210 213 216 219 220 222 68
69 200 206 210 213 216 219 220 222 69
70 201 206 211 214 217 220 221 223 70
71 201 206 211 214 217 220 221 223 71
72 201 207 211 214 217 220 221 224 72
73 202 207 212 215 218 221 222 224 73
74 202 207 212 215 218 221 222 224 74
75 202 207 212 215 218 221 223 225 75
76 202 208 213 216 219 222 223 225 76
77 203 208 213 216 219 222 223 226 77
78 203 209 214 216 219 223 224 226 78
79 204 209 214 217 220 223 224 227 79
80 204 209 214 217 220 224 225 227 8081 204 210 215 217 221 224 225 227 81
82 205 210 215 218 221 224 226 228 82
83 205 210 216 218 222 225 226 229 83
84 206 211 216 219 222 225 227 229 84
85 206 211 216 219 223 226 227 230 85
86 206 212 217 220 223 227 228 230 86
87 207 212 217 220 224 227 228 231 87
88 207 213 218 221 224 228 229 231 88
89 208 213 219 221 225 228 230 232 89
90 209 214 219 222 225 229 230 233 90
91 209 215 220 223 226 230 231 234 91
92 210 215 221 223 227 231 232 235 92
93 211 216 222 224 228 232 233 236 9394 212 217 222 225 229 233 234 237 94
95 213 218 224 226 230 234 235 238 95
96 214 219 225 228 231 235 237 240 96
97 215 221 226 229 233 237 239 241 97
98 217 223 229 232 235 240 241 244 98
99 222 227 233 236 240 245 247 250 99

8/10/2019 n We a 2011 Norms Report
http://slidepdf.com/reader/full/n-we-a-2011-norms-report 94/268
78 | N W E A 2 0 1 1 R I T S c a l e N o r m s
Table B.14.Fall CONCEPTS & PROCESSES
Northwest Evaluation Association
Fall Science Concepts & Processes RIT Score to Percentile Rank Conversion
(At approximately 4 Instructional weeks)
%ile G 3 G 4 G 5 G 6 G 7 G 8 G 9 G 10 %ile
1 165 174 179 182 184 187 187 189 1
2 167 176 181 184 186 189 189 191 23 169 177 183 186 188 190 191 193 3
4 170 178 184 187 189 192 192 194 4
5 171 179 185 188 190 193 193 195 5
6 172 180 185 189 191 194 194 196 6
7 173 181 186 189 192 194 195 197 7
8 173 182 187 190 192 195 196 198 8
9 174 182 187 191 193 196 197 199 9
10 175 183 188 191 194 196 198 199 10
11 175 183 188 192 194 197 198 200 11
12 176 184 189 192 195 198 199 200 12
13 176 184 189 193 195 198 199 201 13
14 177 185 190 193 196 199 200 201 14
15 177 185 190 194 196 199 200 202 1516 178 185 191 194 197 199 201 202 16
17 178 186 191 195 197 200 201 203 17
18 178 186 191 195 197 200 202 203 18
19 179 187 192 195 198 201 202 204 19
20 179 187 192 196 198 201 203 204 20
21 179 187 192 196 199 201 203 205 21
22 180 188 193 196 199 202 204 205 22
23 180 188 193 197 199 202 204 205 23
24 180 188 193 197 200 202 204 206 24
25 181 188 194 197 200 203 205 206 25
26 181 189 194 198 200 203 205 206 26
27 181 189 194 198 201 203 206 207 27
28 182 189 195 198 201 204 206 207 28
29 182 190 195 199 201 204 206 207 29
30 182 190 195 199 202 204 207 208 30
31 183 190 195 199 202 205 207 208 31
32 183 190 196 199 202 205 207 208 32
33 183 191 196 200 202 205 208 209 33
34 183 191 196 200 203 206 208 209 34
35 184 191 196 200 203 206 208 209 35
36 184 192 197 201 203 206 209 210 36
37 184 192 197 201 204 206 209 210 37
38 185 192 197 201 204 207 209 210 38
39 185 192 198 201 204 207 209 210 39
40 185 193 198 202 204 207 210 211 40
41 185 193 198 202 205 208 210 211 41
42 186 193 198 202 205 208 210 211 42
43 186 193 199 202 205 208 211 212 43
44 186 194 199 203 206 208 211 212 44
45 186 194 199 203 206 209 211 212 45
46 187 194 199 203 206 209 212 212 46
47 187 194 199 203 206 209 212 213 47
48 187 195 200 204 207 209 212 213 48
49 187 195 200 204 207 210 213 213 49
50 188 195 201 205 207 210 213 214 50

8/10/2019 n We a 2011 Norms Report
http://slidepdf.com/reader/full/n-we-a-2011-norms-report 95/268
N W E A 2 0 1 1 R I T S c a l e N o r m s | 79
Northwest Evaluation Association
Fall Science Concepts & Processes RIT Score to Percentile Rank Conversion
(At approximately 4 Instructional weeks)
%ile G 3 G 4 G 5 G 6 G 7 G 8 G 9 G 10 %ile
51 188 195 201 205 207 210 213 214 51
52 188 196 201 205 208 211 213 214 52
53 188 196 201 205 208 211 214 214 53
54 189 196 201 205 208 211 214 215 54
55 189 196 201 206 208 211 214 215 55
56 189 196 202 206 209 212 215 215 56
57 189 197 202 206 209 212 215 216 57
58 190 197 202 206 209 212 215 216 58
59 190 197 202 207 210 212 216 216 59
60 190 197 203 207 210 213 216 216 60
61 190 198 203 207 210 213 216 217 61
62 191 198 203 207 210 213 217 217 62
63 191 198 203 208 211 214 217 217 63
64 191 199 204 208 211 214 217 218 64
65 192 199 204 208 211 214 217 218 65
66 192 199 204 208 212 214 218 218 66
67 192 199 204 209 212 215 218 219 67
68 192 200 205 209 212 215 218 219 68
69 193 200 205 209 212 215 219 219 69
70 193 200 205 210 213 216 219 219 70
71 193 200 206 210 213 216 220 220 71
72 194 201 206 210 213 216 220 220 72
73 194 201 206 211 214 217 220 220 73
74 194 201 206 211 214 217 221 221 74
75 195 202 207 211 214 217 221 221 75
76 195 202 207 212 215 218 221 222 76
77 195 202 207 212 215 218 222 222 77
78 196 203 208 212 215 218 222 222 78
79 196 203 208 213 216 219 223 223 79
80 196 203 208 213 216 219 223 223 8081 197 204 209 213 217 220 223 224 81
82 197 204 209 214 217 220 224 224 82
83 197 204 210 214 217 220 224 224 83
84 198 205 210 215 218 221 225 225 84
85 198 205 210 215 218 221 225 225 85
86 199 206 211 215 219 222 226 226 86
87 199 206 211 216 219 222 227 226 87
88 200 207 212 216 220 223 227 227 88
89 200 207 212 217 220 223 228 228 89
90 201 208 213 218 221 224 228 228 90
91 202 208 213 218 222 225 229 229 91
92 202 209 214 219 222 225 230 230 92
93 203 210 215 220 223 226 231 230 9394 204 210 216 221 224 227 232 231 94
95 205 211 217 222 225 228 233 233 95
96 206 213 218 223 226 229 235 234 96
97 208 214 219 224 228 231 236 236 97
98 210 216 221 226 230 233 239 238 98
99 214 220 225 231 234 238 244 242 99

8/10/2019 n We a 2011 Norms Report
http://slidepdf.com/reader/full/n-we-a-2011-norms-report 96/268
80 | N W E A 2 0 1 1 R I T S c a l e N o r m s
Table B.15. Winter CONCEPTS & PROCESSES
Northwest Evaluation Association
Winter Science Concepts & Processes RIT Score to Percentile Rank Conversion
(At approximately 18 Instructional weeks)
%ile G 3 G 4 G 5 G 6 G 7 G 8 G 9 G 10 %ile
1 170 176 181 183 185 188 187 189 1
2 172 178 183 185 188 190 189 191 23 174 180 185 187 189 192 191 193 3
4 175 181 186 188 190 193 192 194 4
5 176 182 187 189 191 194 194 196 5
6 176 182 188 190 192 195 195 196 6
7 177 183 188 191 193 196 196 197 7
8 178 184 189 191 194 196 196 198 8
9 178 184 190 192 194 197 197 199 9
10 179 185 190 193 195 198 198 199 10
11 180 185 191 193 196 198 198 200 11
12 180 186 191 194 196 199 199 201 12
13 180 186 192 194 197 199 200 201 13
14 181 187 192 195 197 200 200 202 14
15 181 187 192 195 198 200 201 202 1516 182 188 193 195 198 201 201 203 16
17 182 188 193 196 198 201 202 203 17
18 182 188 194 196 199 201 202 204 18
19 183 189 194 197 199 202 203 204 19
20 183 189 194 197 200 202 203 204 20
21 184 189 195 197 200 203 203 205 21
22 184 190 195 198 200 203 204 205 22
23 184 190 195 198 201 203 204 206 23
24 184 190 196 198 201 204 205 206 24
25 185 191 196 199 201 204 205 206 25
26 185 191 196 199 202 204 205 207 26
27 185 191 196 199 202 205 206 207 27
28 186 192 197 200 202 205 206 207 28
29 186 192 197 200 203 205 207 208 29
30 186 192 197 200 203 206 207 208 30
31 187 192 198 200 203 206 207 208 31
32 187 193 198 201 203 206 208 209 32
33 187 193 198 201 204 206 208 209 33
34 187 193 198 201 204 207 208 209 34
35 188 193 199 202 204 207 209 210 35
36 188 194 199 202 205 207 209 210 36
37 188 194 199 202 205 208 209 210 37
38 188 194 199 202 205 208 210 210 38
39 189 194 200 203 205 208 210 211 39
40 189 195 200 203 206 208 210 211 40
41 189 195 200 203 206 209 210 211 41
42 189 195 200 203 206 209 211 212 42
43 190 195 201 204 206 209 211 212 43
44 190 196 201 204 207 210 211 212 44
45 190 196 201 204 207 210 212 213 45
46 190 196 201 205 207 210 212 213 46
47 191 196 202 205 208 210 212 213 47
48 191 197 202 205 208 211 213 213 48
49 191 197 202 205 208 211 213 214 49
50 192 197 203 206 209 211 214 215 50
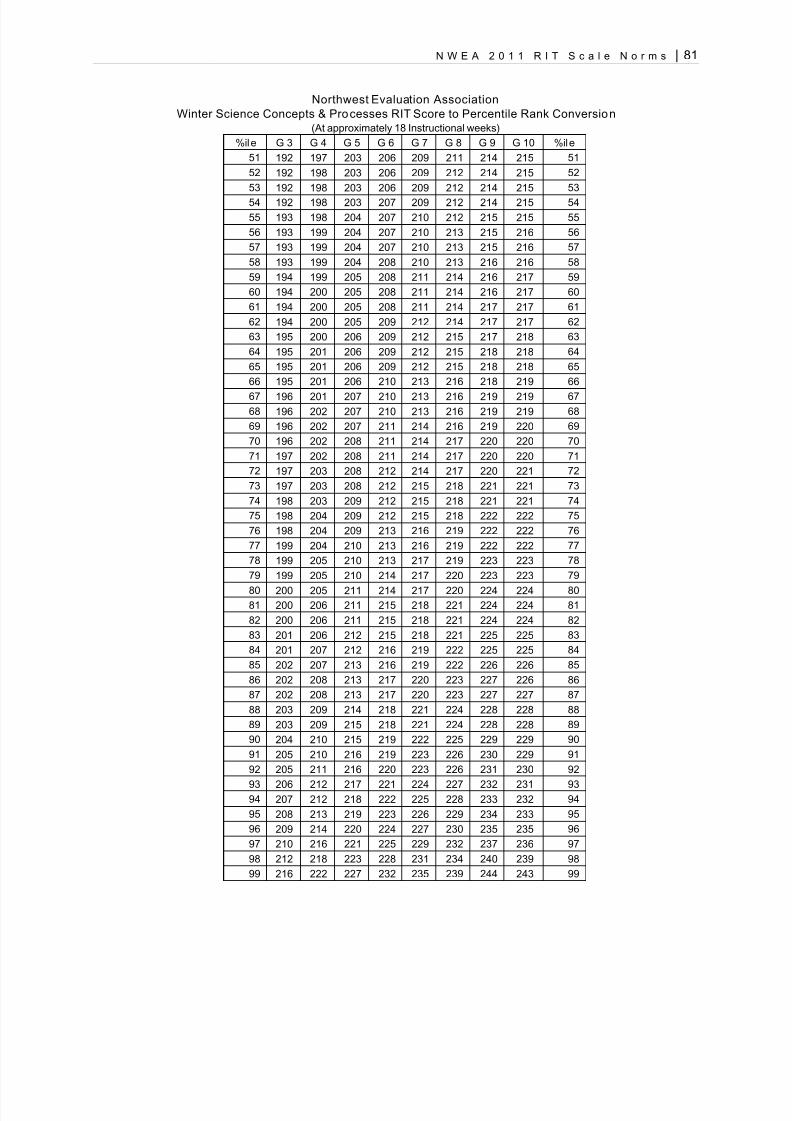
8/10/2019 n We a 2011 Norms Report
http://slidepdf.com/reader/full/n-we-a-2011-norms-report 97/268
N W E A 2 0 1 1 R I T S c a l e N o r m s | 81
Northwest Evaluation Association
Winter Science Concepts & Processes RIT Score to Percentile Rank Conversion
(At approximately 18 Instructional weeks)
%ile G 3 G 4 G 5 G 6 G 7 G 8 G 9 G 10 %ile
51 192 197 203 206 209 211 214 215 51
52 192 198 203 206 209 212 214 215 52
53 192 198 203 206 209 212 214 215 53
54 192 198 203 207 209 212 214 215 54
55 193 198 204 207 210 212 215 215 55
56 193 199 204 207 210 213 215 216 56
57 193 199 204 207 210 213 215 216 57
58 193 199 204 208 210 213 216 216 58
59 194 199 205 208 211 214 216 217 59
60 194 200 205 208 211 214 216 217 60
61 194 200 205 208 211 214 217 217 61
62 194 200 205 209 212 214 217 217 62
63 195 200 206 209 212 215 217 218 63
64 195 201 206 209 212 215 218 218 64
65 195 201 206 209 212 215 218 218 65
66 195 201 206 210 213 216 218 219 66
67 196 201 207 210 213 216 219 219 67
68 196 202 207 210 213 216 219 219 68
69 196 202 207 211 214 216 219 220 69
70 196 202 208 211 214 217 220 220 70
71 197 202 208 211 214 217 220 220 71
72 197 203 208 212 214 217 220 221 72
73 197 203 208 212 215 218 221 221 73
74 198 203 209 212 215 218 221 221 74
75 198 204 209 212 215 218 222 222 75
76 198 204 209 213 216 219 222 222 76
77 199 204 210 213 216 219 222 222 77
78 199 205 210 213 217 219 223 223 78
79 199 205 210 214 217 220 223 223 79
80 200 205 211 214 217 220 224 224 8081 200 206 211 215 218 221 224 224 81
82 200 206 211 215 218 221 224 224 82
83 201 206 212 215 218 221 225 225 83
84 201 207 212 216 219 222 225 225 84
85 202 207 213 216 219 222 226 226 85
86 202 208 213 217 220 223 227 226 86
87 202 208 213 217 220 223 227 227 87
88 203 209 214 218 221 224 228 228 88
89 203 209 215 218 221 224 228 228 89
90 204 210 215 219 222 225 229 229 90
91 205 210 216 219 223 226 230 229 91
92 205 211 216 220 223 226 231 230 92
93 206 212 217 221 224 227 232 231 9394 207 212 218 222 225 228 233 232 94
95 208 213 219 223 226 229 234 233 95
96 209 214 220 224 227 230 235 235 96
97 210 216 221 225 229 232 237 236 97
98 212 218 223 228 231 234 240 239 98
99 216 222 227 232 235 239 244 243 99

8/10/2019 n We a 2011 Norms Report
http://slidepdf.com/reader/full/n-we-a-2011-norms-report 98/268
82 | N W E A 2 0 1 1 R I T S c a l e N o r m s
Table B.16. Spring CONCEPTS & PROCESSES
Northwest Evaluation Association
Spring Science Concepts & Processes RIT Score to Percentile Rank Conversi on
(At approximately 28 Instructional weeks)
%ile G 3 G 4 G 5 G 6 G 7 G 8 G 9 G 10 %ile
1 173 178 182 184 186 188 186 188 1
2 175 180 184 186 188 190 189 190 23 176 181 186 188 190 192 191 192 3
4 178 182 187 189 191 193 192 194 4
5 179 183 188 190 192 194 193 195 5
6 179 184 189 191 193 195 195 196 6
7 180 185 189 191 194 196 195 197 7
8 181 186 190 192 195 197 196 198 8
9 181 186 191 193 195 197 197 198 9
10 182 187 191 193 196 198 198 199 10
11 182 187 192 194 197 199 199 200 11
12 183 188 192 195 197 199 199 200 12
13 183 188 193 195 198 200 200 201 13
14 184 189 193 195 198 200 200 201 14
15 184 189 194 196 199 201 201 202 1516 185 189 194 196 199 201 201 202 16
17 185 190 194 197 199 201 202 203 17
18 185 190 195 197 200 202 202 203 18
19 186 191 195 198 200 202 203 204 19
20 186 191 195 198 201 203 203 204 20
21 186 191 196 198 201 203 204 205 21
22 187 192 196 199 201 203 204 205 22
23 187 192 197 199 202 204 205 205 23
24 187 192 197 199 202 204 205 206 24
25 188 193 197 200 202 205 205 206 25
26 188 193 197 200 203 205 206 207 26
27 188 193 198 200 203 205 206 207 27
28 188 193 198 201 203 206 207 207 28
29 189 194 198 201 204 206 207 208 29
30 189 194 199 201 204 206 207 208 30
31 189 194 199 202 204 207 208 208 31
32 190 195 199 202 205 207 208 209 32
33 190 195 199 202 205 207 208 209 33
34 190 195 200 202 205 207 209 209 34
35 190 195 200 203 205 208 209 210 35
36 191 196 200 203 206 208 209 210 36
37 191 196 201 203 206 208 210 210 37
38 191 196 201 204 206 209 210 211 38
39 191 196 201 204 207 209 210 211 39
40 192 197 201 204 207 209 211 211 40
41 192 197 202 204 207 210 211 212 41
42 192 197 202 205 207 210 211 212 42
43 192 197 202 205 208 210 212 212 43
44 193 198 202 205 208 210 212 212 44
45 193 198 203 205 208 211 212 213 45
46 193 198 203 206 208 211 213 213 46
47 193 198 203 206 209 211 213 213 47
48 194 199 203 206 209 211 213 214 48
49 194 199 204 206 209 212 214 214 49
50 194 199 204 207 210 212 214 214 50

8/10/2019 n We a 2011 Norms Report
http://slidepdf.com/reader/full/n-we-a-2011-norms-report 99/268
N W E A 2 0 1 1 R I T S c a l e N o r m s | 83
Northwest Evaluation Association
Spring Science Concepts & Processes RIT Score to Percentile Rank Conversi on
(At approximately 28 Instructional weeks)
%ile G 3 G 4 G 5 G 6 G 7 G 8 G 9 G 10 %ile
51 194 199 204 207 210 212 214 215 51
52 195 200 204 207 210 213 215 215 52
53 195 200 205 208 210 213 215 215 53
54 195 200 205 208 211 213 215 215 54
55 195 200 205 208 211 213 216 216 55
56 196 201 205 208 211 214 216 216 56
57 196 201 206 209 211 214 216 216 57
58 196 201 206 209 212 214 217 217 58
59 196 201 206 209 212 215 217 217 59
60 197 202 206 209 212 215 217 217 60
61 197 202 207 210 213 215 218 218 61
62 197 202 207 210 213 215 218 218 62
63 197 202 207 210 213 216 218 218 63
64 198 203 208 211 213 216 219 219 64
65 198 203 208 211 214 216 219 219 65
66 198 203 208 211 214 217 219 219 66
67 198 203 208 211 214 217 220 220 67
68 199 204 209 212 215 217 220 220 68
69 199 204 209 212 215 218 220 220 69
70 199 204 209 212 215 218 221 221 70
71 200 205 210 213 215 218 221 221 71
72 200 205 210 213 216 219 221 221 72
73 200 205 210 213 216 219 222 222 73
74 200 205 210 214 216 219 222 222 74
75 201 206 211 214 217 220 223 222 75
76 201 206 211 214 217 220 223 223 76
77 201 206 211 215 218 220 223 223 77
78 202 207 212 215 218 221 224 224 78
79 202 207 212 215 218 221 224 224 79
80 202 207 212 216 219 221 225 224 8081 203 208 213 216 219 222 225 225 81
82 203 208 213 216 219 222 226 225 82
83 203 209 214 217 220 223 226 226 83
84 204 209 214 217 220 223 227 226 84
85 204 209 214 218 221 224 227 227 85
86 205 210 215 218 221 224 228 227 86
87 205 210 215 219 222 225 228 228 87
88 206 211 216 219 222 225 229 229 88
89 206 211 216 220 223 226 230 229 89
90 207 212 217 220 223 226 230 230 90
91 207 212 218 221 224 227 231 231 91
92 208 213 218 222 225 228 232 231 92
93 209 214 219 222 226 229 233 232 9394 209 215 220 223 227 230 234 233 94
95 210 216 221 224 228 231 235 235 95
96 212 217 222 226 229 232 237 236 96
97 213 218 224 227 230 234 239 238 97
98 215 220 226 229 233 236 241 240 98
99 219 224 230 234 237 241 247 245 99

8/10/2019 n We a 2011 Norms Report
http://slidepdf.com/reader/full/n-we-a-2011-norms-report 100/268
84 | N W E A 2 0 1 1 R I T S c a l e N o r m s
This page is intentionally blank.

8/10/2019 n We a 2011 Norms Report
http://slidepdf.com/reader/full/n-we-a-2011-norms-report 101/268
N W E A 2 0 1 1 R I T S c a l e N o r m s | 85
Appendix C - RIT Point Growth Norms in Reading,Language Usage, Mathematics, GeneralScience, and Science Concepts &
Processes by Grade, by StartingInstructional Week, by Starting RITScore, and by Length of InstructionalInterval
The tables below provide sets of growth estimates for each grade-content area combination. Each
estimate and its standard deviation is at the intersection of three factors: 1) the instructional week (Start
Inst. Wk.) at which an initial MAP test was administered, 2) the RIT score of that test (Start RIT), and 3)
the instructional week marking the end of the instructional interval and the administration of the second
MAP test (Ending Instructional Week). Due to the wide range of values for each factor each table isnecessarily partitioned into more manageable segments. For instructional time, the chosen segment size
is four week intervals. Starting RIT scores are in five-RIT segments. Even though the model used to
compute these growth estimates accounts for the standard errors of measurement in each test event (see
Appendix D), for purposes of presentation in these tables, all growth estimates are assumed to come
from test events with the commonly observed standard error measurement in their content area.
These tables may be used to obtain reasonable approximations of predicted growth, or to evaluate
observed growth. The Achievement Status and Growth Calculator serves these purposes with greater
precision, but for quick reference, these tables may be a useful alternative. To use the tables, start from
the far left column to:
1. Identify the “Starting Instructional Week” (the week the pre-test was administered) that is closest
to one of the tabled values as well as to identify the tabled RIT score that is closest to the
observed starting score.
2. Identify the “Ending Instructional Week” when the second or ending test was administered (to
evaluate observed growth) or when the ending test will be administered (to predict growth).
The values in the cell defined by the intersection of these three factors are the estimated growth and
standard deviation, respectively. For example, if we consider a grade 1 student who was tested in the fallin reading in the 4th instructional week obtaining a RIT score of 164 and will be tested again in the spring
in the 32nd instructional week of the grade 1, Table C.1 (page 87) tells us that the predicted growth for
this student is about 17.0, with a standard deviation of approximately 8.77. Note that if a particular set of
factors is not explicitly represented in a table, interpolation may be necessary.
Appendix C – RIT Point Growth Norms

8/10/2019 n We a 2011 Norms Report
http://slidepdf.com/reader/full/n-we-a-2011-norms-report 102/268
N W E A 2 0 1 1 R I T S c a l e N o r m s | 86
Table C.1. Means (M) and Standard Deviations (sd) of Academic Growth by Starting RIT Score and Starting Instructi onal Week forVarious Ending Instructional Weeks - READING, KINDERGARTENTable C.1. Means (M) and Standard Deviation s (sd) of Academic Growth by Starti ng RIT Score and Starti ng Instruc tional Week for Various
Ending Instru ctional Weeks - READING, KINDERGARTEN
Ending Instruction al Weeks
StartPriorGrd Focal Grade
Inst. Start 36 4 8 12 16 20 24 28 32 36
Wk RIT M sd M sd M sd M sd M sd M sd M sd M sd M sd M sd
4 120 3.2 4.70 6.4 4.99 9.5 5.45 12.5 6.03 15.2 6.70 17.6 7 .44 19.6 8.23 21.3 9.05
125 3.2 4.70 6.3 4.99 9.3 5.45 12.2 6.03 14.8 6.70 17.1 7 .44 19.1 8.23 20.7 9.05
130 3.1 4.70 6.1 4.99 9.1 5.45 11.9 6.03 14.4 6.70 16.7 7.44 18.6 8.23 20.1 9.05
135 3.0 4.70 6.0 4.99 8.9 5.45 11.6 6.03 14.0 6.70 16.2 7 .44 18.1 8.23 19.5 9.05
140 2.9 4.70 5.8 4.99 8.6 5.45 11.3 6.03 13.7 6.70 15.8 7 .44 17.5 8.23 18.9 9.05
145 2.9 4.70 5.7 4.99 8.4 5.45 11.0 6.03 13.3 6.70 15.3 7 .44 17.0 8.23 18.3 9.05
150 2.8 4.70 5.5 4.99 8.2 5.45 10.7 6.03 12.9 6.70 14.9 7.44 16.5 8.23 17.7 9.05
155 2.7 4.70 5.4 4.99 8.0 5.45 10.4 6.03 12.5 6.70 14.4 7 .44 16.0 8.23 17.1 9.05
160 2.6 4.70 5.2 4.99 7.7 5.45 10.1 6.03 12.2 6.70 14.0 7 .44 15.4 8.23 16.5 9.05
165 2.6 4.70 5.1 4.99 7.5 5.45 9.8 6.03 11.8 6.70 13.5 7.44 14.9 8.23 15.9 9.05
170 2.5 4.70 4.9 4.99 7.3 5.45 9.5 6.03 11.4 6.70 13.1 7.44 14.4 8.23 15.3 9.05
175 2.4 4.70 4.8 4.99 7.0 5.45 9.2 6.03 11.0 6.70 12.6 7.44 13.9 8.23 14.7 9.05
180 2.3 4.70 4.6 4.99 6.8 5.45 8.9 6.03 10.7 6.70 12.2 7.44 13.3 8.23 14.0 9.05
185 2.3 4.70 4.5 4.99 6.6 5.45 8.6 6.03 10.3 6.70 11.7 7.44 12.8 8.23 13.4 9.05
190 2.2 4.70 4.3 4.99 6.4 5.45 8.3 6.03 9.9 6.70 11.3 7.44 12.3 8.23 12.8 9.05
195 2.1 4.70 4.2 4.99 6.1 5.45 8.0 6.03 9.5 6.70 10.8 7.44 11.8 8.23 12.2 9.05
200 2.0 4.70 4.0 4.99 5.9 5.45 7.7 6.03 9.2 6.70 10.4 7.44 11.2 8.23 11.6 9.058 120 3.2 4.70 6.3 4.99 9.2 5.45 12.0 6.03 14.4 6.70 16.4 7.44 18.0 8.23
125 3.1 4.70 6.2 4.99 9.0 5.45 11.7 6.03 14.0 6.70 16.0 7.44 17.5 8.23
130 3.1 4.70 6.0 4.99 8.8 5.45 11.3 6.03 13.6 6.70 15.5 7.44 17.0 8.23
135 3.0 4.70 5.9 4.99 8.6 5.45 11.0 6.03 13.2 6.70 15.1 7.44 16.5 8.23
140 2.9 4.70 5.7 4.99 8.3 5.45 10.7 6.03 12.9 6.70 14.6 7.44 15.9 8.23
145 2.8 4.70 5.6 4.99 8.1 5.45 10.4 6.03 12.5 6.70 14.2 7.44 15.4 8.23
150 2.8 4.70 5.4 4.99 7.9 5.45 10.1 6.03 12.1 6.70 13.7 7.44 14.9 8.23
155 2.7 4.70 5.3 4.99 7.7 5.45 9.8 6.03 11.7 6.70 13.3 7.44 14.4 8.23
160 2.6 4.70 5.1 4.99 7.4 5.45 9.5 6.03 11.4 6.70 12.8 7.44 13.8 8.23
165 2.5 4.70 5.0 4.99 7.2 5.45 9.2 6.03 11.0 6.70 12.4 7.44 13.3 8.23
170 2.5 4.70 4.8 4.99 7.0 5.45 8.9 6.03 10.6 6.70 11.9 7.44 12.8 8.23

8/10/2019 n We a 2011 Norms Report
http://slidepdf.com/reader/full/n-we-a-2011-norms-report 103/268
N W E A 2 0 1 1 R I T S c a l e N o r m s | 87
Table C.1. Means (M) and Standard Deviation s (sd) of Academic Growth by Starti ng RIT Score and Starti ng Instruc tional Week for VariousEnding Instru ctional Weeks - READING, KINDERGARTEN
Ending Instruction al Weeks
StartPriorGrd Focal Grade
Inst. Start 36 4 8 12 16 20 24 28 32 36
Wk RIT M sd M sd M sd M sd M sd M sd M sd M sd M sd M sd
175 2.4 4.70 4.7 4.99 6.8 5.45 8.6 6.03 10.2 6.70 11.5 7.44 12.3 8.23
180 2.3 4.70 4.5 4.99 6.5 5.45 8.3 6.03 9.9 6.70 11.0 7.44 11.7 8.23
1852.2 4.70 4.3 4.99 6.3 5.45 8.0 6.03 9.5 6.70 10.6 7.44 11.2 8.23
190 2.2 4.70 4.2 4.99 6.1 5.45 7.7 6.03 9.1 6.70 10.1 7.44 10.7 8.23
195 2.1 4.70 4.0 4.99 5.9 5.45 7.4 6.03 8.7 6.70 9.7 7.44 10.1 8.23
200 2.0 4.70 3.9 4.99 5.6 5.45 7.1 6.03 8.4 6.70 9.2 7.44 9.6 8.23
12 120 3.1 4.70 6.0 4.99 8.8 5.45 11.2 6.03 13.2 6.70 14.8 7.44
125 3.0 4.70 5.9 4.99 8.5 5.45 10.9 6.03 12.8 6.70 14.4 7.44
130 3.0 4.70 5.7 4.99 8.3 5.45 10.6 6.03 12.5 6.70 13.9 7.44
135 2.9 4.70 5.6 4.99 8.1 5.45 10.3 6.03 12.1 6.70 13.5 7.44
140 2.8 4.70 5.4 4.99 7.9 5.45 10.0 6.03 11.7 6.70 13.0 7.44
145 2.7 4.70 5.3 4.99 7.6 5.45 9.7 6.03 11.3 6.70 12.6 7.44
150 2.7 4.70 5.1 4.99 7.4 5.45 9.4 6.03 11.0 6.70 12.1 7.44
155 2.6 4.70 5.0 4.99 7.2 5.45 9.1 6.03 10.6 6.70 11.7 7.44
160 2.5 4.70 4.8 4.99 7.0 5.45 8.8 6.03 10.2 6.70 11.2 7.44
165 2.4 4.70 4.7 4.99 6.7 5.45 8.5 6.03 9.8 6.70 10.8 7.44
170 2.4 4.70 4.5 4.99 6.5 5.45 8.2 6.03 9.5 6.70 10.3 7.44
175 2.3 4.70 4.4 4.99 6.3 5.45 7.9 6.03 9.1 6.70 9.9 7.44
180 2.2 4.70 4.2 4.99 6.0 5.45 7.6 6.03 8.7 6.70 9.4 7.44
185 2.1 4.70 4.1 4.99 5.8 5.45 7.3 6.03 8.3 6.70 9.0 7.44
190 2.1 4.70 3.9 4.99 5.6 5.45 7.0 6.03 8.0 6.70 8.5 7.44
195 2.0 4.70 3.8 4.99 5.4 5.45 6.7 6.03 7.6 6.70 8.1 7.44
200 1.9 4.70 3.6 4.99 5.1 5.45 6.4 6.03 7.2 6.70 7.6 7.44
16 120 2.9 4.70 5.7 4.99 8.1 5.45 10.1 6.03 11.7 6.70
125 2.9 4.70 5.5 4.99 7.8 5.45 9.8 6.03 11.4 6.70
130 2.8 4.70 5.4 4.99 7.6 5.45 9.5 6.03 11.0 6.70
135 2.7 4.70 5.2 4.99 7.4 5.45 9.2 6.03 10.6 6.70
140 2.6 4.70 5.1 4.99 7.2 5.45 8.9 6.03 10.2 6.70
145 2.6 4.70 4.9 4.99 6.9 5.45 8.6 6.03 9.9 6.70

8/10/2019 n We a 2011 Norms Report
http://slidepdf.com/reader/full/n-we-a-2011-norms-report 104/268
88 | N W E A 2 0 1 1 R I T S c a l e N o r m s
Table C.1. Means (M) and Standard Deviation s (sd) of Academic Growth by Starti ng RIT Score and Starti ng Instruc tional Week for VariousEnding Instru ctional Weeks - READING, KINDERGARTEN
Ending Instruction al Weeks
StartPriorGrd Focal Grade
Inst. Start 36 4 8 12 16 20 24 28 32 36
Wk RIT M sd M sd M sd M sd M sd M sd M sd M sd M sd M sd
150 2.5 4.70 4.8 4.99 6.7 5.45 8.3 6.03 9.5 6.70
155 2.4 4.70 4.6 4.99 6.5 5.45 8.0 6.03 9.1 6.70
1602.3 4.70 4.5 4.99 6.3 5.45 7.7 6.03 8.7 6.70
165 2.3 4.70 4.3 4.99 6.0 5.45 7.4 6.03 8.4 6.70
170 2.2 4.70 4.2 4.99 5.8 5.45 7.1 6.03 8.0 6.70
175 2.1 4.70 4.0 4.99 5.6 5.45 6.8 6.03 7.6 6.70
180 2.0 4.70 3.9 4.99 5.4 5.45 6.5 6.03 7.2 6.70
185 2.0 4.70 3.7 4.99 5.1 5.45 6.2 6.03 6.9 6.70
190 1.9 4.70 3.5 4.99 4.9 5.45 5.9 6.03 6.5 6.70
195 1.8 4.70 3.4 4.99 4.7 5.45 5.6 6.03 6.1 6.70
200 1.7 4.70 3.2 4.99 4.5 5.45 5.3 6.03 5.7 6.70
20 120 2.7 4.70 5.1 4.99 7.2 5.45 8.8 6.03
125 2.6 4.70 5.0 4.99 7.0 5.45 8.5 6.03
130 2.6 4.70 4.8 4.99 6.7 5.45 8.2 6.03
135 2.5 4.70 4.7 4.99 6.5 5.45 7.9 6.03
140 2.4 4.70 4.5 4.99 6.3 5.45 7.6 6.03
145 2.3 4.70 4.4 4.99 6.1 5.45 7.3 6.03
150 2.3 4.70 4.2 4.99 5.8 5.45 7.0 6.03
155 2.2 4.70 4.1 4.99 5.6 5.45 6.7 6.03
160 2.1 4.70 3.9 4.99 5.4 5.45 6.4 6.03
165 2.0 4.70 3.8 4.99 5.1 5.45 6.1 6.03
170 2.0 4.70 3.6 4.99 4.9 5.45 5.8 6.03
175 1.9 4.70 3.5 4.99 4.7 5.45 5.5 6.03
180 1.8 4.70 3.3 4.99 4.5 5.45 5.2 6.03
185 1.7 4.70 3.2 4.99 4.2 5.45 4.9 6.03
190 1.7 4.70 3.0 4.99 4.0 5.45 4.6 6.03
195 1.6 4.70 2.9 4.99 3.8 5.45 4.3 6.03
200 1.5 4.70 2.7 4.99 3.6 5.45 4.0 6.03

8/10/2019 n We a 2011 Norms Report
http://slidepdf.com/reader/full/n-we-a-2011-norms-report 105/268
N W E A 2 0 1 1 R I T S c a l e N o r m s | 89
Table C.2. Means (M) and Standard Deviations (sd) of Academic Growth by Starting RIT Score and Starting Instructi onal Week forVarious Ending Instructional Weeks - READING, GRADE 1
Table C.2. Means (M) and Standard Deviations (sd) of Academic Growt h by Starting RIT Score and Starting Ins truc tional Week for VariousEnding Instru ctional Weeks - READING, GRADE 1
Ending Instructio nal Weeks
Start Prior Grd Focal Grade
Inst. Start 36 4 8 12 16 20 24 28 32 36
Wk RIT M sd M sd M sd M sd M sd M sd M sd M sd M sd M sd
32(Gd K)
120 1.5 4.72 3.8 5.07 6.5 5.60 9.5 6.27 12.5 7.04 15.3 7.88 17.6 8.77 19.4 9.70 20.3 10.65 20.0 11.62
1251.6 4.72 3.8 5.07 6.5 5.60 9.5 6.27 12.5 7.04 15.3 7.88 17.7 8.77 19.4 9.70 20.3 10.65 20.1 11.62130 1.6 4.72 3.8 5.07 6.5 5.60 9.5 6.27 12.5 7.04 15.4 7.88 17.8 8.77 19.5 9.70 20.4 10.65 20.2 11.62
135 1.6 4.72 3.8 5.07 6.6 5.60 9.6 6.27 12.6 7.04 15.4 7.88 17.8 8.77 19.6 9.70 20.5 10.65 20.3 11.62
140 1.6 4.72 3.8 5.07 6.6 5.60 9.6 6.27 12.6 7.04 15.5 7.88 17.9 8.77 19.6 9.70 20.6 10.65 20.4 11.62
145 1.6 4.72 3.9 5.07 6.6 5.60 9.6 6.27 12.7 7.04 15.5 7.88 17.9 8.77 19.7 9.70 20.6 10.65 20.4 11.62
150 1.6 4.72 3.9 5.07 6.6 5.60 9.7 6.27 12.7 7.04 15.6 7.88 18.0 8.77 19.8 9.70 20.7 10.65 20.5 11.62
155 1.6 4.72 3.9 5.07 6.7 5.60 9.7 6.27 12.8 7.04 15.6 7.88 18.1 8.77 19.8 9.70 20.8 10.65 20.6 11.62
160 1.6 4.72 3.9 5.07 6.7 5.60 9.7 6.27 12.8 7.04 15.7 7.88 18.1 8.77 19.9 9.70 20.9 10.65 20.7 11.62
165 1.6 4.72 3.9 5.07 6.7 5.60 9.8 6.27 12.8 7.04 15.7 7.88 18.2 8.77 20.0 9.70 20.9 10.65 20.8 11.62
170 1.6 4.72 3.9 5.07 6.7 5.60 9.8 6.27 12.9 7.04 15.8 7.88 18.2 8.77 20.1 9.70 21.0 10.65 20.9 11.62
175 1.6 4.72 4.0 5.07 6.8 5.60 9.8 6.27 12.9 7.04 15.8 7.88 18.3 8.77 20.1 9.70 21.1 10.65 20.9 11.62
180 1.6 4.72 4.0 5.07 6.8 5.60 9.9 6.27 13.0 7.04 15.9 7.88 18.3 8.77 20.2 9.70 21.2 10.65 21.0 11.62
185 1.7 4.72 4.0 5.07 6.8 5.60 9.9 6.27 13.0 7.04 15.9 7.88 18.4 8.77 20.3 9.70 21.2 10.65 21.1 11.62
190 1.7 4.72 4.0 5.07 6.8 5.60 9.9 6.27 13.0 7.04 16.0 7.88 18.5 8.77 20.3 9.70 21.3 10.65 21.2 11.62
36(Gd K)
125 2.3 4.72 5.0 5.07 8.0 5.60 11.0 6.27 13.8 7.04 16.2 7.88 17.9 8.77 18.8 9.70 18.6 10.65
130 2.3 4.72 5.0 5.07 8.0 5.60 11.0 6.27 13.8 7.04 16.2 7.88 18.0 8.77 18.8 9.70 18.6 10.65
135 2.3 4.72 5.0 5.07 8.0 5.60 11.0 6.27 13.9 7.04 16.3 7.88 18.0 8.77 18.9 9.70 18.7 10.65
140 2.3 4.72 5.0 5.07 8.0 5.60 11.1 6.27 13.9 7.04 16.3 7.88 18.1 8.77 19.0 9.70 18.8 10.65
145 2.3 4.72 5.0 5.07 8.1 5.60 11.1 6.27 13.9 7.04 16.4 7.88 18.1 8.77 19.0 9.70 18.9 10.65150 2.3 4.72 5.1 5.07 8.1 5.60 11.1 6.27 14.0 7.04 16.4 7.88 18.2 8.77 19.1 9.70 18.9 10.65
155 2.3 4.72 5.1 5.07 8.1 5.60 11.2 6.27 14.0 7.04 16.5 7.88 18.3 8.77 19.2 9.70 19.0 10.65
160 2.3 4.72 5.1 5.07 8.1 5.60 11.2 6.27 14.1 7.04 16.5 7.88 18.3 8.77 19.2 9.70 19.1 10.65
165 2.3 4.72 5.1 5.07 8.2 5.60 11.2 6.27 14.1 7.04 16.6 7.88 18.4 8.77 19.3 9.70 19.2 10.65
170 2.3 4.72 5.1 5.07 8.2 5.60 11.3 6.27 14.1 7.04 16.6 7.88 18.4 8.77 19.4 9.70 19.2 10.65
175 2.3 4.72 5.1 5.07 8.2 5.60 11.3 6.27 14.2 7.04 16.7 7.88 18.5 8.77 19.4 9.70 19.3 10.65
180 2.3 4.72 5.2 5.07 8.2 5.60 11.3 6.27 14.2 7.04 16.7 7.88 18.5 8.77 19.5 9.70 19.4 10.65
185 2.4 4.72 5.2 5.07 8.3 5.60 11.4 6.27 14.3 7.04 16.8 7.88 18.6 8.77 19.6 9.70 19.5 10.65
190 2.4 4.72 5.2 5.07 8.3 5.60 11.4 6.27 14.3 7.04 16.8 7.88 18.7 8.77 19.6 9.70 19.5 10.65
195 2.4 4.72 5.2 5.07 8.3 5.60 11.4 6.27 14.4 7.04 16.9 7.88 18.7 8.77 19.7 9.70 19.6 10.65
4 125 2.7 4.72 5.7 5.07 8.7 5.60 11.5 6.27 13.9 7.04 15.7 7.88 16.5 8.77 16.3 9.70
130 2.7 4.72 5.7 5.07 8.7 5.60 11.6 6.27 14.0 7.04 15.7 7.88 16.6 8.77 16.4 9.70

8/10/2019 n We a 2011 Norms Report
http://slidepdf.com/reader/full/n-we-a-2011-norms-report 106/268
90 | N W E A 2 0 1 1 R I T S c a l e N o r m s
Table C.2. Means (M) and Standard Deviations (sd) of Academic Growt h by Starting RIT Score and Starting Ins truc tional Week for VariousEnding Instru ctional Weeks - READING, GRADE 1
Ending Instructio nal Weeks
Start Prior Grd Focal Grade
Inst. Start 36 4 8 12 16 20 24 28 32 36
Wk RIT M sd M sd M sd M sd M sd M sd M sd M sd M sd M sd
135 2.7 4.72 5.7 5.07 8.8 5.60 11.6 6.27 14.0 7.04 15.8 7.88 16.6 8.77 16.5 9.70
140 2.8 4.72 5.8 5.07 8.8 5.60 11.6 6.27 14.0 7.04 15.8 7.88 16.7 8.77 16.5 9.70
145 2.8 4.72 5.8 5.07 8.8 5.60 11.7 6.27 14.1 7.04 15.9 7.88 16.8 8.77 16.6 9.70
150 2.8 4.72 5.8 5.07 8.8 5.60 11.7 6.27 14.1 7.04 15.9 7.88 16.8 8.77 16.7 9.70
155 2.8 4.72 5.8 5.07 8.9 5.60 11.7 6.27 14.2 7.04 16.0 7.88 16.9 8.77 16.7 9.70
160 2.8 4.72 5.8 5.07 8.9 5.60 11.8 6.27 14.2 7.04 16.0 7.88 16.9 8.77 16.8 9.70
165 2.8 4.72 5.8 5.07 8.9 5.60 11.8 6.27 14.2 7.04 16.1 7.88 17.0 8.77 16.9 9.70
170 2.8 4.72 5.9 5.07 8.9 5.60 11.8 6.27 14.3 7.04 16.1 7.88 17.1 8.77 16.9 9.70
175 2.8 4.72 5.9 5.07 9.0 5.60 11.9 6.27 14.3 7.04 16.2 7.88 17.1 8.77 17.0 9.70
180 2.8 4.72 5.9 5.07 9.0 5.60 11.9 6.27 14.4 7.04 16.2 7.88 17.2 8.77 17.1 9.70
185 2.8 4.72 5.9 5.07 9.0 5.60 11.9 6.27 14.4 7.04 16.3 7.88 17.2 8.77 17.1 9.70
190 2.8 4.72 5.9 5.07 9.0 5.60 12.0 6.27 14.5 7.04 16.3 7.88 17.3 8.77 17.2 9.70
195 2.8 4.72 5.9 5.07 9.1 5.60 12.0 6.27 14.5 7.04 16.4 7.88 17.4 8.77 17.3 9.70
8 125 3.0 4.72 6.0 5.07 8.8 5.60 11.2 6.27 12.9 7.04 13.8 7.88 13.6 8.77
130 3.0 4.72 6.0 5.07 8.8 5.60 11.2 6.27 13.0 7.04 13.9 7.88 13.7 8.77
135 3.0 4.72 6.0 5.07 8.8 5.60 11.3 6.27 13.0 7.04 13.9 7.88 13.7 8.77
140 3.0 4.72 6.0 5.07 8.9 5.60 11.3 6.27 13.1 7.04 14.0 7.88 13.8 8.77
145 3.0 4.72 6.1 5.07 8.9 5.60 11.3 6.27 13.1 7.04 14.0 7.88 13.8 8.77
150 3.0 4.72 6.1 5.07 8.9 5.60 11.4 6.27 13.1 7.04 14.1 7.88 13.9 8.77
155 3.0 4.72 6.1 5.07 8.9 5.60 11.4 6.27 13.2 7.04 14.1 7.88 13.9 8.77
160 3.0 4.72 6.1 5.07 9.0 5.60 11.4 6.27 13.2 7.04 14.2 7.88 14.0 8.77
165 3.0 4.72 6.1 5.07 9.0 5.60 11.5 6.27 13.3 7.04 14.2 7.88 14.1 8.77170 3.1 4.72 6.1 5.07 9.0 5.60 11.5 6.27 13.3 7.04 14.3 7.88 14.1 8.77
175 3.1 4.72 6.2 5.07 9.0 5.60 11.5 6.27 13.3 7.04 14.3 7.88 14.2 8.77
180 3.1 4.72 6.2 5.07 9.1 5.60 11.6 6.27 13.4 7.04 14.4 7.88 14.2 8.77
185 3.1 4.72 6.2 5.07 9.1 5.60 11.6 6.27 13.4 7.04 14.4 7.88 14.3 8.77
190 3.1 4.72 6.2 5.07 9.1 5.60 11.6 6.27 13.5 7.04 14.5 7.88 14.4 8.77
195 3.1 4.72 6.2 5.07 9.1 5.60 11.7 6.27 13.5 7.04 14.5 7.88 14.4 8.77
200 3.1 4.72 6.2 5.07 9.2 5.60 11.7 6.27 13.6 7.04 14.6 7.88 14.5 8.77
12 130 3.0 4.72 5.8 5.07 8.2 5.60 10.0 6.27 10.9 7.04 10.7 7.88
135 3.0 4.72 5.9 5.07 8.3 5.60 10.0 6.27 10.9 7.04 10.7 7.88
140 3.0 4.72 5.9 5.07 8.3 5.60 10.1 6.27 11.0 7.04 10.8 7.88
145 3.0 4.72 5.9 5.07 8.3 5.60 10.1 6.27 11.0 7.04 10.8 7.88
150 3.1 4.72 5.9 5.07 8.3 5.60 10.1 6.27 11.0 7.04 10.9 7.88
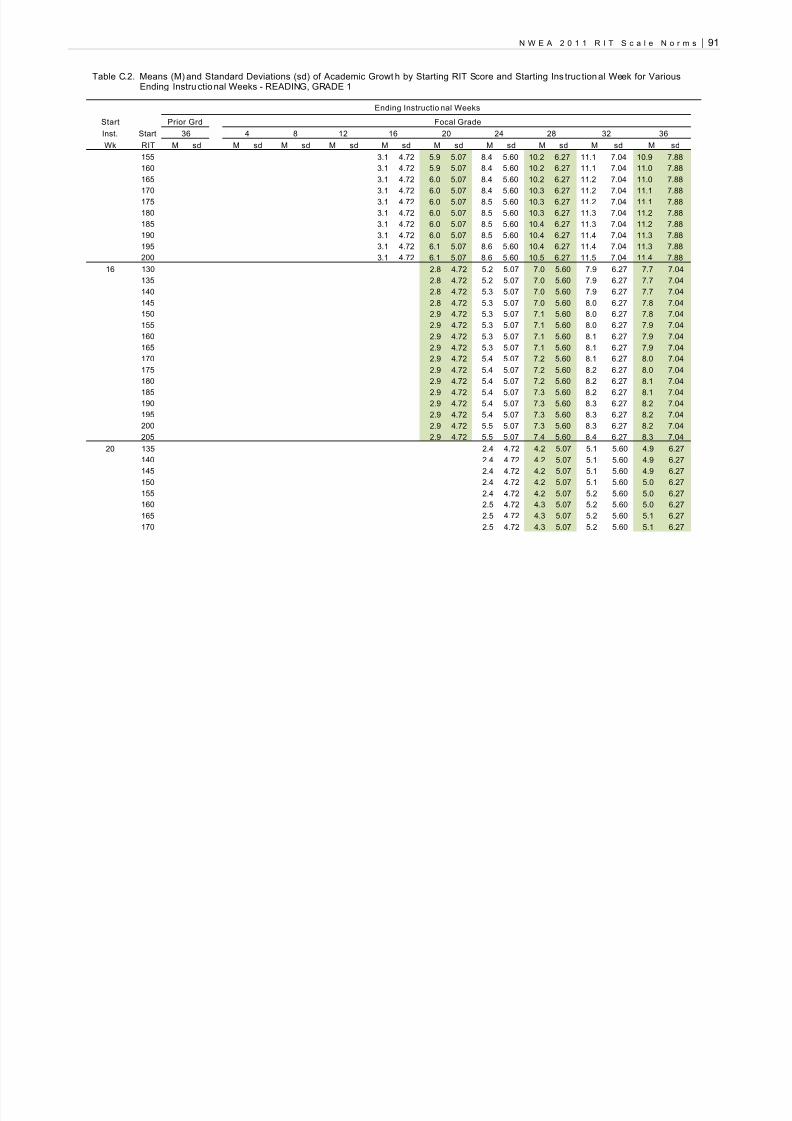
8/10/2019 n We a 2011 Norms Report
http://slidepdf.com/reader/full/n-we-a-2011-norms-report 107/268
N W E A 2 0 1 1 R I T S c a l e N o r m s | 91
Table C.2. Means (M) and Standard Deviations (sd) of Academic Growt h by Starting RIT Score and Starting Ins truc tional Week for VariousEnding Instru ctional Weeks - READING, GRADE 1
Ending Instructio nal Weeks
Start Prior Grd Focal Grade
Inst. Start 36 4 8 12 16 20 24 28 32 36
Wk RIT M sd M sd M sd M sd M sd M sd M sd M sd M sd M sd
155 3.1 4.72 5.9 5.07 8.4 5.60 10.2 6.27 11.1 7.04 10.9 7.88
160 3.1 4.72 5.9 5.07 8.4 5.60 10.2 6.27 11.1 7.04 11.0 7.88
165 3.1 4.72 6.0 5.07 8.4 5.60 10.2 6.27 11.2 7.04 11.0 7.88
170 3.1 4.72 6.0 5.07 8.4 5.60 10.3 6.27 11.2 7.04 11.1 7.88
175 3.1 4.72 6.0 5.07 8.5 5.60 10.3 6.27 11.2 7.04 11.1 7.88
180 3.1 4.72 6.0 5.07 8.5 5.60 10.3 6.27 11.3 7.04 11.2 7.88
185 3.1 4.72 6.0 5.07 8.5 5.60 10.4 6.27 11.3 7.04 11.2 7.88
190 3.1 4.72 6.0 5.07 8.5 5.60 10.4 6.27 11.4 7.04 11.3 7.88
195 3.1 4.72 6.1 5.07 8.6 5.60 10.4 6.27 11.4 7.04 11.3 7.88
200 3.1 4.72 6.1 5.07 8.6 5.60 10.5 6.27 11.5 7.04 11.4 7.88
16 130 2.8 4.72 5.2 5.07 7.0 5.60 7.9 6.27 7.7 7.04
135 2.8 4.72 5.2 5.07 7.0 5.60 7.9 6.27 7.7 7.04
140 2.8 4.72 5.3 5.07 7.0 5.60 7.9 6.27 7.7 7.04
145 2.8 4.72 5.3 5.07 7.0 5.60 8.0 6.27 7.8 7.04
150 2.9 4.72 5.3 5.07 7.1 5.60 8.0 6.27 7.8 7.04
155 2.9 4.72 5.3 5.07 7.1 5.60 8.0 6.27 7.9 7.04
160 2.9 4.72 5.3 5.07 7.1 5.60 8.1 6.27 7.9 7.04
165 2.9 4.72 5.3 5.07 7.1 5.60 8.1 6.27 7.9 7.04
170 2.9 4.72 5.4 5.07 7.2 5.60 8.1 6.27 8.0 7.04
175 2.9 4.72 5.4 5.07 7.2 5.60 8.2 6.27 8.0 7.04
180 2.9 4.72 5.4 5.07 7.2 5.60 8.2 6.27 8.1 7.04
185 2.9 4.72 5.4 5.07 7.3 5.60 8.2 6.27 8.1 7.04190 2.9 4.72 5.4 5.07 7.3 5.60 8.3 6.27 8.2 7.04
195 2.9 4.72 5.4 5.07 7.3 5.60 8.3 6.27 8.2 7.04
200 2.9 4.72 5.5 5.07 7.3 5.60 8.3 6.27 8.2 7.04
205 2.9 4.72 5.5 5.07 7.4 5.60 8.4 6.27 8.3 7.04
20 135 2.4 4.72 4.2 5.07 5.1 5.60 4.9 6.27
140 2.4 4.72 4.2 5.07 5.1 5.60 4.9 6.27
145 2.4 4.72 4.2 5.07 5.1 5.60 4.9 6.27
150 2.4 4.72 4.2 5.07 5.1 5.60 5.0 6.27
155 2.4 4.72 4.2 5.07 5.2 5.60 5.0 6.27
160 2.5 4.72 4.3 5.07 5.2 5.60 5.0 6.27
165 2.5 4.72 4.3 5.07 5.2 5.60 5.1 6.27
170 2.5 4.72 4.3 5.07 5.2 5.60 5.1 6.27

8/10/2019 n We a 2011 Norms Report
http://slidepdf.com/reader/full/n-we-a-2011-norms-report 108/268
92 | N W E A 2 0 1 1 R I T S c a l e N o r m s
Table C.2. Means (M) and Standard Deviations (sd) of Academic Growt h by Starting RIT Score and Starting Ins truc tional Week for VariousEnding Instru ctional Weeks - READING, GRADE 1
Ending Instructio nal Weeks
Start Prior Grd Focal Grade
Inst. Start 36 4 8 12 16 20 24 28 32 36
Wk RIT M sd M sd M sd M sd M sd M sd M sd M sd M sd M sd
175 2.5 4.72 4.3 5.07 5.3 5.60 5.1 6.27
180 2.5 4.72 4.3 5.07 5.3 5.60 5.2 6.27
185 2.5 4.72 4.3 5.07 5.3 5.60 5.2 6.27
190 2.5 4.72 4.4 5.07 5.3 5.60 5.2 6.27
195 2.5 4.72 4.4 5.07 5.4 5.60 5.3 6.27
200 2.5 4.72 4.4 5.07 5.4 5.60 5.3 6.27
205 2.5 4.72 4.4 5.07 5.4 5.60 5.3 6.27
210 2.5 4.72 4.4 5.07 5.4 5.60 5.4 6.27

8/10/2019 n We a 2011 Norms Report
http://slidepdf.com/reader/full/n-we-a-2011-norms-report 109/268
N W E A 2 0 1 1 R I T S c a l e N o r m s | 93
Table C.3. Means (M) and Standard Deviations (sd) of Academic Growth by Starting RIT Score and Starting Instructi onal Week forVarious Ending Instructional Weeks - READING, GRADE 2
Table C.3. Means (M) and Standard Deviations (sd) of Academic Growth by Startin g RIT Score and Starting Instruct ional Week for VariousEnding Instructi onal Weeks - READING, GRADE 2
Ending Instructio nal Weeks
Start Prior Grd Focal Grade
Inst. Start 36 4 8 12 16 20 24 28 32 36
Wk RIT M sd M sd M sd M sd M sd M sd M sd M sd M sd M sd
32(Gd 1)
130 1.5 4.70 3.7 5.00 6.5 5.47 9.7 6.06 13.1 6.75 16.5 7.50 19.6 8.31 22.4 9.15 24.6 10.01 26.0 10.90
1351.4 4.70 3.5 5.00 6.2 5.47 9.3 6.06 12.6 6.75 15.9 7.50 18.9 8.31 21.6 9.15 23.7 10.01 24.9 10.90140 1.3 4.70 3.3 5.00 5.9 5.47 8.9 6.06 12.1 6.75 15.2 7.50 18.2 8.31 20.8 9.15 22.7 10.01 23.9 10.90
145 1.2 4.70 3.1 5.00 5.6 5.47 8.5 6.06 11.5 6.75 14.6 7.50 17.5 8.31 19.9 9.15 21.8 10.01 22.8 10.90
150 1.1 4.70 2.9 5.00 5.3 5.47 8.1 6.06 11.0 6.75 14.0 7.50 16.7 8.31 19.1 9.15 20.8 10.01 21.8 10.90
155 1.0 4.70 2.7 5.00 5.0 5.47 7.6 6.06 10.5 6.75 13.4 7.50 16.0 8.31 18.3 9.15 19.9 10.01 20.8 10.90
160 0.8 4.70 2.5 5.00 4.7 5.47 7.2 6.06 10.0 6.75 12.7 7.50 15.3 8.31 17.4 9.15 19.0 10.01 19.7 10.90
165 0.7 4.70 2.3 5.00 4.3 5.47 6.8 6.06 9.5 6.75 12.1 7.50 14.6 8.31 16.6 9.15 18.0 10.01 18.7 10.90
170 0.6 4.70 2.0 5.00 4.0 5.47 6.4 6.06 9.0 6.75 11.5 7.50 13.8 8.31 15.8 9.15 17.1 10.01 17.7 10.90
175 0.5 4.70 1.8 5.00 3.7 5.47 6.0 6.06 8.4 6.75 10.9 7.50 13.1 8.31 14.9 9.15 16.2 10.01 16.6 10.90
180 0.4 4.70 1.6 5.00 3.4 5.47 5.6 6.06 7.9 6.75 10.3 7.50 12.4 8.31 14.1 9.15 15.2 10.01 15.6 10.90
185 0.3 4.70 1.4 5.00 3.1 5.47 5.2 6.06 7.4 6.75 9.6 7.50 11.7 8.31 13.3 9.15 14.3 10.01 14.5 10.90
190 0.2 4.70 1.2 5.00 2.8 5.47 4.7 6.06 6.9 6.75 9.0 7.50 10.9 8.31 12.4 9.15 13.4 10.01 13.5 10.90
195 0.1 4.70 1.0 5.00 2.5 5.47 4.3 6.06 6.4 6.75 8.4 7.50 10.2 8.31 11.6 9.15 12.4 10.01 12.5 10.90
200 0.0 4.70 0.8 5.00 2.2 5.47 3.9 6.06 5.8 6.75 7.8 7.50 9.5 8.31 10.8 9.15 11.5 10.01 11.4 10.90
205 -0.1 4.70 0.6 5.00 1.9 5.47 3.5 6.06 5.3 6.75 7.1 7.50 8.7 8.31 10.0 9.15 10.6 10.01 10.4 10.90
210 -0.2 4.70 0.4 5.00 1.5 5.47 3.1 6.06 4.8 6.75 6.5 7.50 8.0 8.31 9.1 9.15 9.6 10.01 9.3 10.90
215 -0.3 4.70 0.2 5.00 1.2 5.47 2.7 6.06 4.3 6.75 5.9 7.50 7.3 8.31 8.3 9.15 8.7 10.01 8.3 10.90
220 -0.4 4.70 0.0 5.00 0.9 5.47 2.2 6.06 3.8 6.75 5.3 7.50 6.6 8.31 7.5 9.15 7.8 10.01 7.3 10.90
36(Gd 1)
130 2.2 4.70 5.1 5.00 8.3 5.47 11.6 6.06 15.0 6.75 18.2 7.50 21.0 8.31 23.1 9.15 24.5 10.01135 2.1 4.70 4.9 5.00 7.9 5.47 11.2 6.06 14.5 6.75 17.6 7.50 20.2 8.31 22.3 9.15 23.6 10.01
140 2.0 4.70 4.6 5.00 7.6 5.47 10.8 6.06 14.0 6.75 16.9 7.50 19.5 8.31 21.5 9.15 22.6 10.01
145 1.9 4.70 4.4 5.00 7.3 5.47 10.4 6.06 13.5 6.75 16.3 7.50 18.8 8.31 20.6 9.15 21.7 10.01
150 1.8 4.70 4.2 5.00 7.0 5.47 10.0 6.06 12.9 6.75 15.7 7.50 18.0 8.31 19.8 9.15 20.8 10.01
155 1.7 4.70 4.0 5.00 6.7 5.47 9.6 6.06 12.4 6.75 15.1 7.50 17.3 8.31 19.0 9.15 19.8 10.01
160 1.6 4.70 3.8 5.00 6.4 5.47 9.1 6.06 11.9 6.75 14.4 7.50 16.6 8.31 18.1 9.15 18.9 10.01
165 1.5 4.70 3.6 5.00 6.1 5.47 8.7 6.06 11.4 6.75 13.8 7.50 15.9 8.31 17.3 9.15 18.0 10.01
170 1.4 4.70 3.4 5.00 5.8 5.47 8.3 6.06 10.9 6.75 13.2 7.50 15.1 8.31 16.5 9.15 17.0 10.01
175 1.3 4.70 3.2 5.00 5.5 5.47 7.9 6.06 10.3 6.75 12.6 7.50 14.4 8.31 15.6 9.15 16.1 10.01
180 1.2 4.70 3.0 5.00 5.1 5.47 7.5 6.06 9.8 6.75 12.0 7.50 13.7 8.31 14.8 9.15 15.2 10.01
185 1.1 4.70 2.8 5.00 4.8 5.47 7.1 6.06 9.3 6.75 11.3 7.50 13.0 8.31 14.0 9.15 14.2 10.01
190 1.0 4.70 2.6 5.00 4.5 5.47 6.7 6.06 8.8 6.75 10.7 7.50 12.2 8.31 13.2 9.15 13.3 10.01
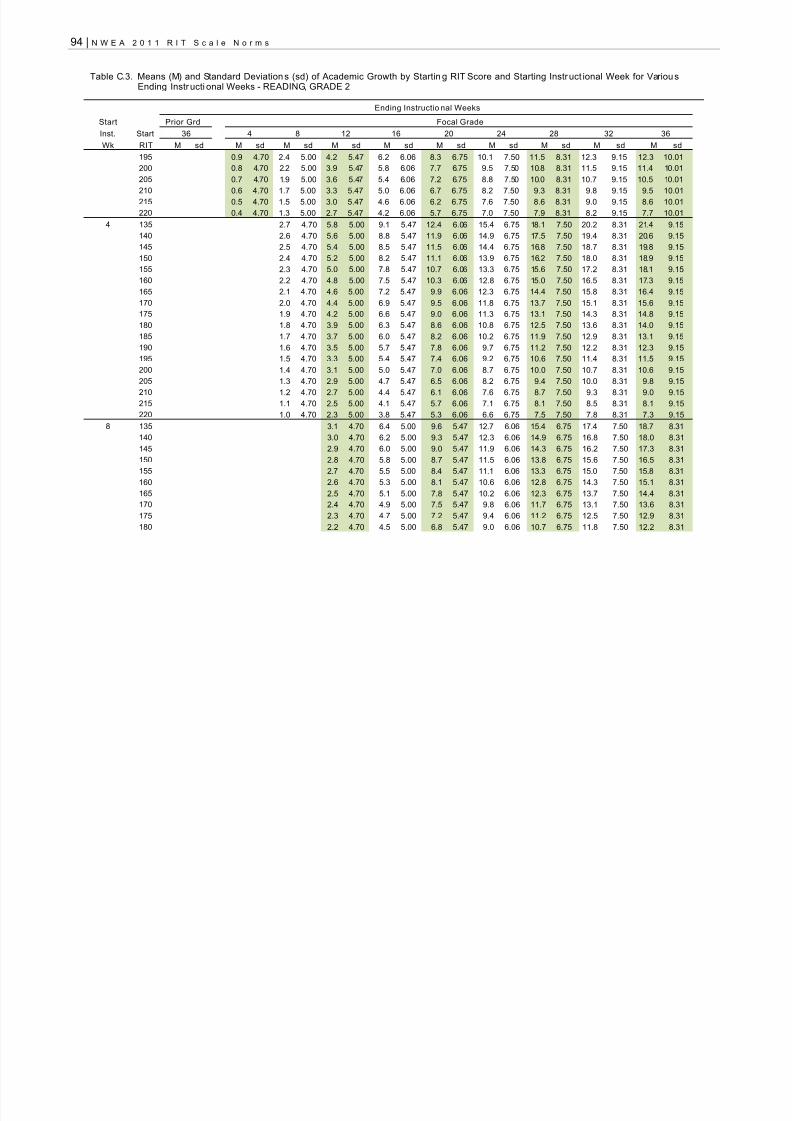
8/10/2019 n We a 2011 Norms Report
http://slidepdf.com/reader/full/n-we-a-2011-norms-report 110/268
94 | N W E A 2 0 1 1 R I T S c a l e N o r m s
Table C.3. Means (M) and Standard Deviations (sd) of Academic Growth by Startin g RIT Score and Starting Instruct ional Week for VariousEnding Instructi onal Weeks - READING, GRADE 2
Ending Instructio nal Weeks
Start Prior Grd Focal Grade
Inst. Start 36 4 8 12 16 20 24 28 32 36
Wk RIT M sd M sd M sd M sd M sd M sd M sd M sd M sd M sd
195 0.9 4.70 2.4 5.00 4.2 5.47 6.2 6.06 8.3 6.75 10.1 7.50 11.5 8.31 12.3 9.15 12.3 10.01
200 0.8 4.70 2.2 5.00 3.9 5.47 5.8 6.06 7.7 6.75 9.5 7.50 10.8 8.31 11.5 9.15 11.4 10.01
205 0.7 4.70 1.9 5.00 3.6 5.47 5.4 6.06 7.2 6.75 8.8 7.50 10.0 8.31 10.7 9.15 10.5 10.01
210 0.6 4.70 1.7 5.00 3.3 5.47 5.0 6.06 6.7 6.75 8.2 7.50 9.3 8.31 9.8 9.15 9.5 10.01
215 0.5 4.70 1.5 5.00 3.0 5.47 4.6 6.06 6.2 6.75 7.6 7.50 8.6 8.31 9.0 9.15 8.6 10.01
220 0.4 4.70 1.3 5.00 2.7 5.47 4.2 6.06 5.7 6.75 7.0 7.50 7.9 8.31 8.2 9.15 7.7 10.01
4 135 2.7 4.70 5.8 5.00 9.1 5.47 12.4 6.06 15.4 6.75 18.1 7.50 20.2 8.31 21.4 9.15
140 2.6 4.70 5.6 5.00 8.8 5.47 11.9 6.06 14.9 6.75 17.5 7.50 19.4 8.31 20.6 9.15
145 2.5 4.70 5.4 5.00 8.5 5.47 11.5 6.06 14.4 6.75 16.8 7.50 18.7 8.31 19.8 9.15
150 2.4 4.70 5.2 5.00 8.2 5.47 11.1 6.06 13.9 6.75 16.2 7.50 18.0 8.31 18.9 9.15
155 2.3 4.70 5.0 5.00 7.8 5.47 10.7 6.06 13.3 6.75 15.6 7.50 17.2 8.31 18.1 9.15
160 2.2 4.70 4.8 5.00 7.5 5.47 10.3 6.06 12.8 6.75 15.0 7.50 16.5 8.31 17.3 9.15
165 2.1 4.70 4.6 5.00 7.2 5.47 9.9 6.06 12.3 6.75 14.4 7.50 15.8 8.31 16.4 9.15
170 2.0 4.70 4.4 5.00 6.9 5.47 9.5 6.06 11.8 6.75 13.7 7.50 15.1 8.31 15.6 9.15
175 1.9 4.70 4.2 5.00 6.6 5.47 9.0 6.06 11.3 6.75 13.1 7.50 14.3 8.31 14.8 9.15
180 1.8 4.70 3.9 5.00 6.3 5.47 8.6 6.06 10.8 6.75 12.5 7.50 13.6 8.31 14.0 9.15
185 1.7 4.70 3.7 5.00 6.0 5.47 8.2 6.06 10.2 6.75 11.9 7.50 12.9 8.31 13.1 9.15
190 1.6 4.70 3.5 5.00 5.7 5.47 7.8 6.06 9.7 6.75 11.2 7.50 12.2 8.31 12.3 9.15
195 1.5 4.70 3.3 5.00 5.4 5.47 7.4 6.06 9.2 6.75 10.6 7.50 11.4 8.31 11.5 9.15
200 1.4 4.70 3.1 5.00 5.0 5.47 7.0 6.06 8.7 6.75 10.0 7.50 10.7 8.31 10.6 9.15
205 1.3 4.70 2.9 5.00 4.7 5.47 6.5 6.06 8.2 6.75 9.4 7.50 10.0 8.31 9.8 9.15
210 1.2 4.70 2.7 5.00 4.4 5.47 6.1 6.06 7.6 6.75 8.7 7.50 9.3 8.31 9.0 9.15215 1.1 4.70 2.5 5.00 4.1 5.47 5.7 6.06 7.1 6.75 8.1 7.50 8.5 8.31 8.1 9.15
220 1.0 4.70 2.3 5.00 3.8 5.47 5.3 6.06 6.6 6.75 7.5 7.50 7.8 8.31 7.3 9.15
8 135 3.1 4.70 6.4 5.00 9.6 5.47 12.7 6.06 15.4 6.75 17.4 7.50 18.7 8.31
140 3.0 4.70 6.2 5.00 9.3 5.47 12.3 6.06 14.9 6.75 16.8 7.50 18.0 8.31
145 2.9 4.70 6.0 5.00 9.0 5.47 11.9 6.06 14.3 6.75 16.2 7.50 17.3 8.31
150 2.8 4.70 5.8 5.00 8.7 5.47 11.5 6.06 13.8 6.75 15.6 7.50 16.5 8.31
155 2.7 4.70 5.5 5.00 8.4 5.47 11.1 6.06 13.3 6.75 15.0 7.50 15.8 8.31
160 2.6 4.70 5.3 5.00 8.1 5.47 10.6 6.06 12.8 6.75 14.3 7.50 15.1 8.31
165 2.5 4.70 5.1 5.00 7.8 5.47 10.2 6.06 12.3 6.75 13.7 7.50 14.4 8.31
170 2.4 4.70 4.9 5.00 7.5 5.47 9.8 6.06 11.7 6.75 13.1 7.50 13.6 8.31
175 2.3 4.70 4.7 5.00 7.2 5.47 9.4 6.06 11.2 6.75 12.5 7.50 12.9 8.31
180 2.2 4.70 4.5 5.00 6.8 5.47 9.0 6.06 10.7 6.75 11.8 7.50 12.2 8.31

8/10/2019 n We a 2011 Norms Report
http://slidepdf.com/reader/full/n-we-a-2011-norms-report 111/268
N W E A 2 0 1 1 R I T S c a l e N o r m s | 95
Table C.3. Means (M) and Standard Deviations (sd) of Academic Growth by Startin g RIT Score and Starting Instruct ional Week for VariousEnding Instructi onal Weeks - READING, GRADE 2
Ending Instructio nal Weeks
Start Prior Grd Focal Grade
Inst. Start 36 4 8 12 16 20 24 28 32 36
Wk RIT M sd M sd M sd M sd M sd M sd M sd M sd M sd M sd
185 2.1 4.70 4.3 5.00 6.5 5.47 8.6 6.06 10.2 6.75 11.2 7.50 11.4 8.31
190 2.0 4.70 4.1 5.00 6.2 5.47 8.1 6.06 9.7 6.75 10.6 7.50 10.7 8.31
195 1.9 4.70 3.9 5.00 5.9 5.47 7.7 6.06 9.1 6.75 10.0 7.50 10.0 8.31
200 1.7 4.70 3.7 5.00 5.6 5.47 7.3 6.06 8.6 6.75 9.3 7.50 9.3 8.31
205 1.6 4.70 3.5 5.00 5.3 5.47 6.9 6.06 8.1 6.75 8.7 7.50 8.5 8.31
210 1.5 4.70 3.3 5.00 5.0 5.47 6.5 6.06 7.6 6.75 8.1 7.50 7.8 8.31
215 1.4 4.70 3.1 5.00 4.7 5.47 6.1 6.06 7.1 6.75 7.5 7.50 7.1 8.31
220 1.3 4.70 2.8 5.00 4.4 5.47 5.7 6.06 6.6 6.75 6.9 7.50 6.4 8.31
12 140 3.2 4.70 6.3 5.00 9.3 5.47 11.9 6.06 13.8 6.75 15.0 7.50
145 3.1 4.70 6.1 5.00 9.0 5.47 11.5 6.06 13.3 6.75 14.4 7.50
150 3.0 4.70 5.9 5.00 8.7 5.47 11.0 6.06 12.8 6.75 13.8 7.50
155 2.9 4.70 5.7 5.00 8.4 5.47 10.6 6.06 12.3 6.75 13.1 7.50
160 2.8 4.70 5.5 5.00 8.1 5.47 10.2 6.06 11.8 6.75 12.5 7.50
165 2.7 4.70 5.3 5.00 7.8 5.47 9.8 6.06 11.2 6.75 11.9 7.50
170 2.6 4.70 5.1 5.00 7.4 5.47 9.4 6.06 10.7 6.75 11.3 7.50
175 2.5 4.70 4.9 5.00 7.1 5.47 9.0 6.06 10.2 6.75 10.6 7.50
180 2.4 4.70 4.7 5.00 6.8 5.47 8.5 6.06 9.7 6.75 10.0 7.50
185 2.2 4.70 4.5 5.00 6.5 5.47 8.1 6.06 9.2 6.75 9.4 7.50
190 2.1 4.70 4.3 5.00 6.2 5.47 7.7 6.06 8.6 6.75 8.8 7.50
195 2.0 4.70 4.1 5.00 5.9 5.47 7.3 6.06 8.1 6.75 8.1 7.50
200 1.9 4.70 3.9 5.00 5.6 5.47 6.9 6.06 7.6 6.75 7.5 7.50
205 1.8 4.70 3.6 5.00 5.3 5.47 6.5 6.06 7.1 6.75 6.9 7.50210 1.7 4.70 3.4 5.00 4.9 5.47 6.1 6.06 6.6 6.75 6.3 7.50
215 1.6 4.70 3.2 5.00 4.6 5.47 5.6 6.06 6.0 6.75 5.7 7.50
220 1.5 4.70 3.0 5.00 4.3 5.47 5.2 6.06 5.5 6.75 5.0 7.50
16 140 3.2 4.70 6.1 5.00 8.7 5.47 10.7 6.06 11.8 6.75
145 3.1 4.70 5.9 5.00 8.4 5.47 10.2 6.06 11.3 6.75
150 3.0 4.70 5.7 5.00 8.1 5.47 9.8 6.06 10.8 6.75
155 2.9 4.70 5.5 5.00 7.8 5.47 9.4 6.06 10.3 6.75
160 2.8 4.70 5.3 5.00 7.4 5.47 9.0 6.06 9.7 6.75
165 2.7 4.70 5.1 5.00 7.1 5.47 8.6 6.06 9.2 6.75
170 2.5 4.70 4.9 5.00 6.8 5.47 8.2 6.06 8.7 6.75
175 2.4 4.70 4.7 5.00 6.5 5.47 7.7 6.06 8.2 6.75
180 2.3 4.70 4.5 5.00 6.2 5.47 7.3 6.06 7.7 6.75

8/10/2019 n We a 2011 Norms Report
http://slidepdf.com/reader/full/n-we-a-2011-norms-report 112/268
96 | N W E A 2 0 1 1 R I T S c a l e N o r m s
Table C.3. Means (M) and Standard Deviations (sd) of Academic Growth by Startin g RIT Score and Starting Instruct ional Week for VariousEnding Instructi onal Weeks - READING, GRADE 2
Ending Instructio nal Weeks
Start Prior Grd Focal Grade
Inst. Start 36 4 8 12 16 20 24 28 32 36
Wk RIT M sd M sd M sd M sd M sd M sd M sd M sd M sd M sd
185 2.2 4.70 4.3 5.00 5.9 5.47 6.9 6.06 7.1 6.75
190 2.1 4.70 4.1 5.00 5.6 5.47 6.5 6.06 6.6 6.75
195 2.0 4.70 3.8 5.00 5.3 5.47 6.1 6.06 6.1 6.75
200 1.9 4.70 3.6 5.00 5.0 5.47 5.7 6.06 5.6 6.75
205 1.8 4.70 3.4 5.00 4.6 5.47 5.3 6.06 5.1 6.75
210 1.7 4.70 3.2 5.00 4.3 5.47 4.8 6.06 4.6 6.75
215 1.6 4.70 3.0 5.00 4.0 5.47 4.4 6.06 4.0 6.75
220 1.5 4.70 2.8 5.00 3.7 5.47 4.0 6.06 3.5 6.75
20 145 2.9 4.70 5.3 5.00 7.2 5.47 8.2 6.06
150 2.8 4.70 5.1 5.00 6.9 5.47 7.8 6.06
155 2.7 4.70 4.9 5.00 6.6 5.47 7.4 6.06
160 2.6 4.70 4.7 5.00 6.2 5.47 7.0 6.06
165 2.4 4.70 4.5 5.00 5.9 5.47 6.6 6.06
170 2.3 4.70 4.3 5.00 5.6 5.47 6.2 6.06
175 2.2 4.70 4.1 5.00 5.3 5.47 5.7 6.06
180 2.1 4.70 3.9 5.00 5.0 5.47 5.3 6.06
185 2.0 4.70 3.7 5.00 4.7 5.47 4.9 6.06
190 1.9 4.70 3.4 5.00 4.4 5.47 4.5 6.06
195 1.8 4.70 3.2 5.00 4.1 5.47 4.1 6.06
200 1.7 4.70 3.0 5.00 3.7 5.47 3.7 6.06
205 1.6 4.70 2.8 5.00 3.4 5.47 3.3 6.06
210 1.5 4.70 2.6 5.00 3.1 5.47 2.8 6.06215 1.4 4.70 2.4 5.00 2.8 5.47 2.4 6.06
220 1.3 4.70 2.2 5.00 2.5 5.47 2.0 6.06

8/10/2019 n We a 2011 Norms Report
http://slidepdf.com/reader/full/n-we-a-2011-norms-report 113/268
N W E A 2 0 1 1 R I T S c a l e N o r m s | 97
Table C.4. Means (M) and Standard Deviations (sd) of Academic Growth by Starting RIT Score and Starting Instructi onal Week forVarious Ending Instructional Weeks - READING, GRADE 3
Table C.4. Means (M) and Standard Deviations (sd) of Academic Growt h by Starting RIT Score and Starting Ins truc tional Week for VariousEnding Instructi onal Weeks - READING, GRADE 3
Ending Instruction al Weeks
Start Prior Grd Focal Grade
Inst. Start 36 4 8 12 16 20 24 28 32 36
Wk RIT M sd M sd M sd M sd M sd M sd M sd M sd M sd M sd
32(Gd 2)
145 1.4 4.66 3.2 4.83 5.3 5.11 7.6 5.48 9.9 5.92 12.2 6.42 14.3 6.96 16.1 7.54 17.6 8.15 18.5 8.78
1501.3 4.66 3.1 4.83 5.1 5.11 7.3 5.48 9.5 5.92 11.7 6.42 13.8 6.96 15.5 7.54 16.9 8.15 17.7 8.78155 1.3 4.66 2.9 4.83 4.9 5.11 7.0 5.48 9.2 5.92 11.3 6.42 13.3 6.96 14.9 7.54 16.2 8.15 17.0 8.78
160 1.2 4.66 2.8 4.83 4.6 5.11 6.7 5.48 8.8 5.92 10.8 6.42 12.7 6.96 14.3 7.54 15.5 8.15 16.2 8.78
165 1.1 4.66 2.6 4.83 4.4 5.11 6.4 5.48 8.4 5.92 10.4 6.42 12.2 6.96 13.7 7.54 14.9 8.15 15.5 8.78
170 1.0 4.66 2.5 4.83 4.2 5.11 6.1 5.48 8.0 5.92 9.9 6.42 11.7 6.96 13.1 7.54 14.2 8.15 14.8 8.78
175 1.0 4.66 2.3 4.83 4.0 5.11 5.8 5.48 7.7 5.92 9.5 6.42 11.2 6.96 12.5 7.54 13.5 8.15 14.0 8.78
180 0.9 4.66 2.2 4.83 3.7 5.11 5.5 5.48 7.3 5.92 9.1 6.42 10.6 6.96 11.9 7.54 12.9 8.15 13.3 8.78
185 0.8 4.66 2.0 4.83 3.5 5.11 5.2 5.48 6.9 5.92 8.6 6.42 10.1 6.96 11.3 7.54 12.2 8.15 12.5 8.78
190 0.7 4.66 1.9 4.83 3.3 5.11 4.9 5.48 6.6 5.92 8.2 6.42 9.6 6.96 10.7 7.54 11.5 8.15 11.8 8.78
195 0.7 4.66 1.7 4.83 3.1 5.11 4.6 5.48 6.2 5.92 7.7 6.42 9.1 6.96 10.1 7.54 10.8 8.15 11.0 8.78
200 0.6 4.66 1.6 4.83 2.9 5.11 4.3 5.48 5.8 5.92 7.3 6.42 8.5 6.96 9.5 7.54 10.2 8.15 10.3 8.78
205 0.5 4.66 1.4 4.83 2.6 5.11 4.0 5.48 5.4 5.92 6.8 6.42 8.0 6.96 8.9 7.54 9.5 8.15 9.5 8.78
210 0.4 4.66 1.3 4.83 2.4 5.11 3.7 5.48 5.1 5.92 6.4 6.42 7.5 6.96 8.4 7.54 8.8 8.15 8.8 8.78
215 0.4 4.66 1.1 4.83 2.2 5.11 3.4 5.48 4.7 5.92 5.9 6.42 7.0 6.96 7.8 7.54 8.1 8.15 8.0 8.78
220 0.3 4.66 1.0 4.83 2.0 5.11 3.1 5.48 4.3 5.92 5.5 6.42 6.4 6.96 7.2 7.54 7.5 8.15 7.3 8.78
225 0.2 4.66 0.8 4.83 1.7 5.11 2.8 5.48 3.9 5.92 5.0 6.42 5.9 6.96 6.6 7.54 6.8 8.15 6.5 8.78
36(Gd 2)
145 1.8 4.66 3.9 4.83 6.2 5.11 8.5 5.48 10.8 5.92 12.9 6.42 14.7 6.96 16.2 7.54 17.1 8.15
150 1.7 4.66 3.8 4.83 6.0 5.11 8.2 5.48 10.4 5.92 12.4 6.42 14.2 6.96 15.6 7.54 16.4 8.15
155 1.7 4.66 3.6 4.83 5.7 5.11 7.9 5.48 10.0 5.92 12.0 6.42 13.7 6.96 15.0 7.54 15.7 8.15160 1.6 4.66 3.5 4.83 5.5 5.11 7.6 5.48 9.7 5.92 11.5 6.42 13.1 6.96 14.4 7.54 15.1 8.15
165 1.5 4.66 3.3 4.83 5.3 5.11 7.3 5.48 9.3 5.92 11.1 6.42 12.6 6.96 13.8 7.54 14.4 8.15
170 1.4 4.66 3.2 4.83 5.1 5.11 7.0 5.48 8.9 5.92 10.6 6.42 12.1 6.96 13.2 7.54 13.7 8.15
175 1.4 4.66 3.0 4.83 4.8 5.11 6.7 5.48 8.5 5.92 10.2 6.42 11.6 6.96 12.6 7.54 13.0 8.15
180 1.3 4.66 2.9 4.83 4.6 5.11 6.4 5.48 8.2 5.92 9.7 6.42 11.1 6.96 12.0 7.54 12.4 8.15
185 1.2 4.66 2.7 4.83 4.4 5.11 6.1 5.48 7.8 5.92 9.3 6.42 10.5 6.96 11.4 7.54 11.7 8.15
190 1.1 4.66 2.6 4.83 4.2 5.11 5.8 5.48 7.4 5.92 8.9 6.42 10.0 6.96 10.8 7.54 11.0 8.15
195 1.1 4.66 2.4 4.83 3.9 5.11 5.5 5.48 7.0 5.92 8.4 6.42 9.5 6.96 10.2 7.54 10.4 8.15
200 1.0 4.66 2.3 4.83 3.7 5.11 5.2 5.48 6.7 5.92 8.0 6.42 9.0 6.96 9.6 7.54 9.7 8.15
205 0.9 4.66 2.1 4.83 3.5 5.11 4.9 5.48 6.3 5.92 7.5 6.42 8.4 6.96 9.0 7.54 9.0 8.15
210 0.8 4.66 2.0 4.83 3.3 5.11 4.6 5.48 5.9 5.92 7.1 6.42 7.9 6.96 8.4 7.54 8.3 8.15
215 0.8 4.66 1.8 4.83 3.0 5.11 4.3 5.48 5.5 5.92 6.6 6.42 7.4 6.96 7.8 7.54 7.7 8.15

8/10/2019 n We a 2011 Norms Report
http://slidepdf.com/reader/full/n-we-a-2011-norms-report 114/268
98 | N W E A 2 0 1 1 R I T S c a l e N o r m s
Table C.4. Means (M) and Standard Deviations (sd) of Academic Growt h by Starting RIT Score and Starting Ins truc tional Week for VariousEnding Instructi onal Weeks - READING, GRADE 3
Ending Instruction al Weeks
Start Prior Grd Focal Grade
Inst. Start 36 4 8 12 16 20 24 28 32 36
Wk RIT M sd M sd M sd M sd M sd M sd M sd M sd M sd M sd
220 0.7 4.66 1.7 4.83 2.8 5.11 4.0 5.48 5.2 5.92 6.2 6.42 6.9 6.96 7.2 7.54 7.0 8.15
225 0.6 4.66 1.5 4.83 2.6 5.11 3.7 5.48 4.8 5.92 5.7 6.42 6.3 6.96 6.6 7.54 6.3 8.15
4 150 2.0 4.66 4.2 4.83 6.5 5.11 8.7 5.48 10.7 5.92 12.5 6.42 13.8 6.96 14.7 7.54
1552.0 4.66 4.1 4.83 6.2 5.11 8.4 5.48 10.3 5.92 12.0 6.42 13.3 6.96 14.1 7.54160 1.9 4.66 3.9 4.83 6.0 5.11 8.1 5.48 10.0 5.92 11.6 6.42 12.8 6.96 13.5 7.54
165 1.8 4.66 3.8 4.83 5.8 5.11 7.8 5.48 9.6 5.92 11.1 6.42 12.3 6.96 12.9 7.54
170 1.7 4.66 3.6 4.83 5.6 5.11 7.5 5.48 9.2 5.92 10.7 6.42 11.7 6.96 12.3 7.54
175 1.7 4.66 3.5 4.83 5.4 5.11 7.2 5.48 8.8 5.92 10.2 6.42 11.2 6.96 11.7 7.54
180 1.6 4.66 3.3 4.83 5.1 5.11 6.9 5.48 8.5 5.92 9.8 6.42 10.7 6.96 11.1 7.54
185 1.5 4.66 3.2 4.83 4.9 5.11 6.6 5.48 8.1 5.92 9.3 6.42 10.2 6.96 10.5 7.54
190 1.4 4.66 3.0 4.83 4.7 5.11 6.3 5.48 7.7 5.92 8.9 6.42 9.6 6.96 9.9 7.54
195 1.4 4.66 2.9 4.83 4.5 5.11 6.0 5.48 7.3 5.92 8.4 6.42 9.1 6.96 9.3 7.54
200 1.3 4.66 2.7 4.83 4.2 5.11 5.7 5.48 7.0 5.92 8.0 6.42 8.6 6.96 8.7 7.54
205 1.2 4.66 2.6 4.83 4.0 5.11 5.4 5.48 6.6 5.92 7.5 6.42 8.1 6.96 8.1 7.54
210 1.1 4.66 2.4 4.83 3.8 5.11 5.1 5.48 6.2 5.92 7.1 6.42 7.5 6.96 7.5 7.54
215 1.1 4.66 2.3 4.83 3.6 5.11 4.8 5.48 5.8 5.92 6.6 6.42 7.0 6.96 6.9 7.54
220 1.0 4.66 2.1 4.83 3.3 5.11 4.5 5.48 5.5 5.92 6.2 6.42 6.5 6.96 6.3 7.54
225 0.9 4.66 2.0 4.83 3.1 5.11 4.2 5.48 5.1 5.92 5.7 6.42 6.0 6.96 5.7 7.54
8 150 2.2 4.66 4.5 4.83 6.7 5.11 8.7 5.48 10.4 5.92 11.8 6.42 12.7 6.96
155 2.1 4.66 4.3 4.83 6.4 5.11 8.4 5.48 10.1 5.92 11.4 6.42 12.1 6.96
160 2.0 4.66 4.2 4.83 6.2 5.11 8.1 5.48 9.7 5.92 10.9 6.42 11.6 6.96
165 2.0 4.66 4.0 4.83 6.0 5.11 7.8 5.48 9.3 5.92 10.5 6.42 11.1 6.96170 1.9 4.66 3.9 4.83 5.8 5.11 7.5 5.48 8.9 5.92 10.0 6.42 10.6 6.96
175 1.8 4.66 3.7 4.83 5.5 5.11 7.2 5.48 8.6 5.92 9.6 6.42 10.0 6.96
180 1.8 4.66 3.6 4.83 5.3 5.11 6.9 5.48 8.2 5.92 9.1 6.42 9.5 6.96
185 1.7 4.66 3.4 4.83 5.1 5.11 6.6 5.48 7.8 5.92 8.7 6.42 9.0 6.96
190 1.6 4.66 3.3 4.83 4.9 5.11 6.3 5.48 7.4 5.92 8.2 6.42 8.5 6.96
195 1.5 4.66 3.1 4.83 4.6 5.11 6.0 5.48 7.1 5.92 7.8 6.42 7.9 6.96
200 1.5 4.66 3.0 4.83 4.4 5.11 5.7 5.48 6.7 5.92 7.3 6.42 7.4 6.96
205 1.4 4.66 2.8 4.83 4.2 5.11 5.4 5.48 6.3 5.92 6.9 6.42 6.9 6.96
210 1.3 4.66 2.7 4.83 4.0 5.11 5.1 5.48 6.0 5.92 6.4 6.42 6.4 6.96
215 1.2 4.66 2.5 4.83 3.7 5.11 4.8 5.48 5.6 5.92 6.0 6.42 5.8 6.96
220 1.2 4.66 2.4 4.83 3.5 5.11 4.5 5.48 5.2 5.92 5.5 6.42 5.3 6.96
225 1.1 4.66 2.2 4.83 3.3 5.11 4.2 5.48 4.8 5.92 5.1 6.42 4.8 6.96

8/10/2019 n We a 2011 Norms Report
http://slidepdf.com/reader/full/n-we-a-2011-norms-report 115/268
N W E A 2 0 1 1 R I T S c a l e N o r m s | 99
Table C.4. Means (M) and Standard Deviations (sd) of Academic Growt h by Starting RIT Score and Starting Ins truc tional Week for VariousEnding Instructi onal Weeks - READING, GRADE 3
Ending Instruction al Weeks
Start Prior Grd Focal Grade
Inst. Start 36 4 8 12 16 20 24 28 32 36
Wk RIT M sd M sd M sd M sd M sd M sd M sd M sd M sd M sd
12 155 2.2 4.66 4.3 4.83 6.3 5.11 7.9 5.48 9.2 5.92 10.0 6.42
160 2.1 4.66 4.2 4.83 6.0 5.11 7.6 5.48 8.9 5.92 9.6 6.42
165 2.0 4.66 4.0 4.83 5.8 5.11 7.3 5.48 8.5 5.92 9.1 6.42
170 2.0 4.66 3.9 4.83 5.6 5.11 7.0 5.48 8.1 5.92 8.7 6.42
175 1.9 4.66 3.7 4.83 5.4 5.11 6.8 5.48 7.7 5.92 8.2 6.42
180 1.8 4.66 3.6 4.83 5.1 5.11 6.5 5.48 7.4 5.92 7.8 6.42
185 1.7 4.66 3.4 4.83 4.9 5.11 6.2 5.48 7.0 5.92 7.3 6.42
190 1.7 4.66 3.3 4.83 4.7 5.11 5.9 5.48 6.6 5.92 6.9 6.42
195 1.6 4.66 3.1 4.83 4.5 5.11 5.6 5.48 6.2 5.92 6.4 6.42
200 1.5 4.66 3.0 4.83 4.2 5.11 5.3 5.48 5.9 5.92 6.0 6.42
205 1.4 4.66 2.8 4.83 4.0 5.11 5.0 5.48 5.5 5.92 5.5 6.42
210 1.4 4.66 2.7 4.83 3.8 5.11 4.7 5.48 5.1 5.92 5.1 6.42
215 1.3 4.66 2.5 4.83 3.6 5.11 4.4 5.48 4.7 5.92 4.6 6.42
220 1.2 4.66 2.4 4.83 3.4 5.11 4.1 5.48 4.4 5.92 4.2 6.42
225 1.1 4.66 2.2 4.83 3.1 5.11 3.8 5.48 4.0 5.92 3.7 6.42
16 155 2.1 4.66 4.1 4.83 5.8 5.11 7.1 5.48 7.8 5.92
160 2.1 4.66 3.9 4.83 5.5 5.11 6.8 5.48 7.5 5.92
165 2.0 4.66 3.8 4.83 5.3 5.11 6.5 5.48 7.1 5.92
170 1.9 4.66 3.6 4.83 5.1 5.11 6.2 5.48 6.7 5.92
175 1.8 4.66 3.5 4.83 4.9 5.11 5.9 5.48 6.3 5.92
180 1.8 4.66 3.3 4.83 4.6 5.11 5.6 5.48 6.0 5.92
185 1.7 4.66 3.2 4.83 4.4 5.11 5.3 5.48 5.6 5.92190 1.6 4.66 3.0 4.83 4.2 5.11 5.0 5.48 5.2 5.92
195 1.5 4.66 2.9 4.83 4.0 5.11 4.7 5.48 4.8 5.92
200 1.5 4.66 2.7 4.83 3.7 5.11 4.4 5.48 4.5 5.92
205 1.4 4.66 2.6 4.83 3.5 5.11 4.1 5.48 4.1 5.92
210 1.3 4.66 2.4 4.83 3.3 5.11 3.8 5.48 3.7 5.92
215 1.2 4.66 2.3 4.83 3.1 5.11 3.5 5.48 3.3 5.92
220 1.2 4.66 2.1 4.83 2.9 5.11 3.2 5.48 3.0 5.92
225 1.1 4.66 2.0 4.83 2.6 5.11 2.9 5.48 2.6 5.92
20 155 2.0 4.66 3.6 4.83 4.9 5.11 5.7 5.48
160 1.9 4.66 3.5 4.83 4.7 5.11 5.4 5.48
165 1.8 4.66 3.3 4.83 4.5 5.11 5.1 5.48
170 1.7 4.66 3.2 4.83 4.3 5.11 4.8 5.48

8/10/2019 n We a 2011 Norms Report
http://slidepdf.com/reader/full/n-we-a-2011-norms-report 116/268
100 | N W E A 2 0 1 1 R I T S c a l e N o r m s
Table C.4. Means (M) and Standard Deviations (sd) of Academic Growt h by Starting RIT Score and Starting Ins truc tional Week for VariousEnding Instructi onal Weeks - READING, GRADE 3
Ending Instruction al Weeks
Start Prior Grd Focal Grade
Inst. Start 36 4 8 12 16 20 24 28 32 36
Wk RIT M sd M sd M sd M sd M sd M sd M sd M sd M sd M sd
175 1.7 4.66 3.0 4.83 4.0 5.11 4.5 5.48
180 1.6 4.66 2.9 4.83 3.8 5.11 4.2 5.48
185 1.5 4.66 2.7 4.83 3.6 5.11 3.9 5.48
190 1.4 4.66 2.6 4.83 3.4 5.11 3.6 5.48
195 1.4 4.66 2.4 4.83 3.1 5.11 3.3 5.48
200 1.3 4.66 2.3 4.83 2.9 5.11 3.0 5.48
205 1.2 4.66 2.1 4.83 2.7 5.11 2.7 5.48
210 1.1 4.66 2.0 4.83 2.5 5.11 2.4 5.48
215 1.1 4.66 1.8 4.83 2.2 5.11 2.1 5.48
220 1.0 4.66 1.7 4.83 2.0 5.11 1.8 5.48
225 0.9 4.66 1.5 4.83 1.8 5.11 1.5 5.48

8/10/2019 n We a 2011 Norms Report
http://slidepdf.com/reader/full/n-we-a-2011-norms-report 117/268
N W E A 2 0 1 1 R I T S c a l e N o r m s | 101
Table C.5. Means (M) and Standard Deviations (sd) of Academic Growth by Starting RIT Score and Starting Instructi onal Week forVarious Ending Instructional Weeks - READING, GRADE 4
Table C.5. Means (M) and Standard Deviations (sd) of Academic Growt h by Starting RIT Score and Starting Ins truc tional Week for VariousEnding Instru ctional Weeks - READING, GRADE 4
Ending Instruction al Weeks
Start Prior Grd Focal Grade
Inst. Start 36 4 8 12 16 20 24 28 32 36
Wk RIT M sd M sd M sd M sd M sd M sd M sd M sd M sd M sd
32(Gd 3)
160 0.9 4.65 2.1 4.79 3.6 5.03 5.2 5.34 6.8 5.72 8.4 6.15 9.9 6.62 11.2 7.13 12.1 7.67 12.7 8.22
1650.9 4.65 2.0 4.79 3.4 5.03 4.9 5.34 6.5 5.72 8.1 6.15 9.5 6.62 10.7 7.13 11.7 7.67 12.2 8.22170 0.8 4.65 1.9 4.79 3.3 5.03 4.7 5.34 6.3 5.72 7.8 6.15 9.2 6.62 10.3 7.13 11.2 7.67 11.7 8.22
175 0.7 4.65 1.8 4.79 3.1 5.03 4.5 5.34 6.0 5.72 7.5 6.15 8.8 6.62 9.9 7.13 10.7 7.67 11.1 8.22
180 0.7 4.65 1.7 4.79 2.9 5.03 4.3 5.34 5.8 5.72 7.1 6.15 8.4 6.62 9.5 7.13 10.2 7.67 10.6 8.22
185 0.6 4.65 1.6 4.79 2.8 5.03 4.1 5.34 5.5 5.72 6.8 6.15 8.1 6.62 9.1 7.13 9.8 7.67 10.1 8.22
190 0.6 4.65 1.5 4.79 2.6 5.03 3.9 5.34 5.2 5.72 6.5 6.15 7.7 6.62 8.6 7.13 9.3 7.67 9.6 8.22
195 0.5 4.65 1.4 4.79 2.5 5.03 3.7 5.34 5.0 5.72 6.2 6.15 7.3 6.62 8.2 7.13 8.8 7.67 9.0 8.22
200 0.5 4.65 1.3 4.79 2.3 5.03 3.5 5.34 4.7 5.72 5.9 6.15 6.9 6.62 7.8 7.13 8.3 7.67 8.5 8.22
205 0.4 4.65 1.2 4.79 2.1 5.03 3.3 5.34 4.4 5.72 5.6 6.15 6.6 6.62 7.4 7.13 7.9 7.67 8.0 8.22
210 0.4 4.65 1.1 4.79 2.0 5.03 3.1 5.34 4.2 5.72 5.3 6.15 6.2 6.62 7.0 7.13 7.4 7.67 7.5 8.22
215 0.3 4.65 1.0 4.79 1.8 5.03 2.8 5.34 3.9 5.72 4.9 6.15 5.8 6.62 6.5 7.13 6.9 7.67 6.9 8.22
220 0.3 4.65 0.9 4.79 1.7 5.03 2.6 5.34 3.6 5.72 4.6 6.15 5.5 6.62 6.1 7.13 6.5 7.67 6.4 8.22
225 0.2 4.65 0.8 4.79 1.5 5.03 2.4 5.34 3.4 5.72 4.3 6.15 5.1 6.62 5.7 7.13 6.0 7.67 5.9 8.22
230 0.2 4.65 0.6 4.79 1.4 5.03 2.2 5.34 3.1 5.72 4.0 6.15 4.7 6.62 5.3 7.13 5.5 7.67 5.3 8.22
36(Gd 3)
160 1.2 4.65 2.7 4.79 4.3 5.03 5.9 5.34 7.5 5.72 9.0 6.15 10.3 6.62 11.2 7.13 11.8 7.67
165 1.2 4.65 2.6 4.79 4.1 5.03 5.7 5.34 7.3 5.72 8.7 6.15 9.9 6.62 10.8 7.13 11.3 7.67
170 1.1 4.65 2.5 4.79 3.9 5.03 5.5 5.34 7.0 5.72 8.4 6.15 9.5 6.62 10.4 7.13 10.9 7.67
175 1.1 4.65 2.4 4.79 3.8 5.03 5.3 5.34 6.7 5.72 8.1 6.15 9.2 6.62 10.0 7.13 10.4 7.67
180 1.0 4.65 2.3 4.79 3.6 5.03 5.1 5.34 6.5 5.72 7.7 6.15 8.8 6.62 9.6 7.13 9.9 7.67185 1.0 4.65 2.1 4.79 3.5 5.03 4.9 5.34 6.2 5.72 7.4 6.15 8.4 6.62 9.1 7.13 9.4 7.67
190 0.9 4.65 2.0 4.79 3.3 5.03 4.6 5.34 5.9 5.72 7.1 6.15 8.1 6.62 8.7 7.13 9.0 7.67
195 0.9 4.65 1.9 4.79 3.2 5.03 4.4 5.34 5.7 5.72 6.8 6.15 7.7 6.62 8.3 7.13 8.5 7.67
200 0.8 4.65 1.8 4.79 3.0 5.03 4.2 5.34 5.4 5.72 6.5 6.15 7.3 6.62 7.9 7.13 8.0 7.67
205 0.7 4.65 1.7 4.79 2.8 5.03 4.0 5.34 5.1 5.72 6.2 6.15 7.0 6.62 7.4 7.13 7.6 7.67
210 0.7 4.65 1.6 4.79 2.7 5.03 3.8 5.34 4.9 5.72 5.8 6.15 6.6 6.62 7.0 7.13 7.1 7.67
215 0.6 4.65 1.5 4.79 2.5 5.03 3.6 5.34 4.6 5.72 5.5 6.15 6.2 6.62 6.6 7.13 6.6 7.67
220 0.6 4.65 1.4 4.79 2.4 5.03 3.4 5.34 4.4 5.72 5.2 6.15 5.8 6.62 6.2 7.13 6.1 7.67
225 0.5 4.65 1.3 4.79 2.2 5.03 3.2 5.34 4.1 5.72 4.9 6.15 5.5 6.62 5.8 7.13 5.7 7.67
230 0.5 4.65 1.2 4.79 2.1 5.03 3.0 5.34 3.8 5.72 4.6 6.15 5.1 6.62 5.3 7.13 5.2 7.67
4 160 1.5 4.65 3.0 4.79 4.7 5.03 6.3 5.34 7.8 5.72 9.1 6.15 10.0 6.62 10.6 7.13
165 1.4 4.65 2.9 4.79 4.5 5.03 6.1 5.34 7.5 5.72 8.7 6.15 9.7 6.62 10.2 7.13

8/10/2019 n We a 2011 Norms Report
http://slidepdf.com/reader/full/n-we-a-2011-norms-report 118/268
102 | N W E A 2 0 1 1 R I T S c a l e N o r m s
Table C.5. Means (M) and Standard Deviations (sd) of Academic Growt h by Starting RIT Score and Starting Ins truc tional Week for VariousEnding Instru ctional Weeks - READING, GRADE 4
Ending Instruction al Weeks
Start Prior Grd Focal Grade
Inst. Start 36 4 8 12 16 20 24 28 32 36
Wk RIT M sd M sd M sd M sd M sd M sd M sd M sd M sd M sd
170 1.3 4.65 2.8 4.79 4.4 5.03 5.9 5.34 7.3 5.72 8.4 6.15 9.3 6.62 9.8 7.13
175 1.3 4.65 2.7 4.79 4.2 5.03 5.7 5.34 7.0 5.72 8.1 6.15 8.9 6.62 9.3 7.13
180 1.2 4.65 2.6 4.79 4.1 5.03 5.5 5.34 6.7 5.72 7.8 6.15 8.5 6.62 8.9 7.13
185 1.2 4.65 2.5 4.79 3.9 5.03 5.2 5.34 6.5 5.72 7.5 6.15 8.2 6.62 8.5 7.13
190 1.1 4.65 2.4 4.79 3.7 5.03 5.0 5.34 6.2 5.72 7.2 6.15 7.8 6.62 8.1 7.13
195 1.1 4.65 2.3 4.79 3.6 5.03 4.8 5.34 5.9 5.72 6.8 6.15 7.4 6.62 7.7 7.13
200 1.0 4.65 2.2 4.79 3.4 5.03 4.6 5.34 5.7 5.72 6.5 6.15 7.1 6.62 7.2 7.13
205 1.0 4.65 2.1 4.79 3.3 5.03 4.4 5.34 5.4 5.72 6.2 6.15 6.7 6.62 6.8 7.13
210 0.9 4.65 2.0 4.79 3.1 5.03 4.2 5.34 5.1 5.72 5.9 6.15 6.3 6.62 6.4 7.13
215 0.9 4.65 1.9 4.79 3.0 5.03 4.0 5.34 4.9 5.72 5.6 6.15 6.0 6.62 6.0 7.13
220 0.8 4.65 1.8 4.79 2.8 5.03 3.8 5.34 4.6 5.72 5.3 6.15 5.6 6.62 5.5 7.13
225 0.8 4.65 1.7 4.79 2.6 5.03 3.6 5.34 4.4 5.72 4.9 6.15 5.2 6.62 5.1 7.13
230 0.7 4.65 1.6 4.79 2.5 5.03 3.3 5.34 4.1 5.72 4.6 6.15 4.9 6.62 4.7 7.13
8 160 1.6 4.65 3.2 4.79 4.8 5.03 6.3 5.34 7.6 5.72 8.6 6.15 9.1 6.62
165 1.5 4.65 3.1 4.79 4.7 5.03 6.1 5.34 7.3 5.72 8.3 6.15 8.8 6.62
170 1.5 4.65 3.0 4.79 4.5 5.03 5.9 5.34 7.1 5.72 7.9 6.15 8.4 6.62
175 1.4 4.65 2.9 4.79 4.4 5.03 5.7 5.34 6.8 5.72 7.6 6.15 8.0 6.62
180 1.4 4.65 2.8 4.79 4.2 5.03 5.5 5.34 6.5 5.72 7.3 6.15 7.7 6.62
185 1.3 4.65 2.7 4.79 4.1 5.03 5.3 5.34 6.3 5.72 7.0 6.15 7.3 6.62
190 1.3 4.65 2.6 4.79 3.9 5.03 5.1 5.34 6.0 5.72 6.7 6.15 6.9 6.62
195 1.2 4.65 2.5 4.79 3.7 5.03 4.9 5.34 5.8 5.72 6.4 6.15 6.6 6.62
200 1.2 4.65 2.4 4.79 3.6 5.03 4.6 5.34 5.5 5.72 6.0 6.15 6.2 6.62205 1.1 4.65 2.3 4.79 3.4 5.03 4.4 5.34 5.2 5.72 5.7 6.15 5.8 6.62
210 1.1 4.65 2.2 4.79 3.3 5.03 4.2 5.34 5.0 5.72 5.4 6.15 5.5 6.62
215 1.0 4.65 2.1 4.79 3.1 5.03 4.0 5.34 4.7 5.72 5.1 6.15 5.1 6.62
220 1.0 4.65 2.0 4.79 3.0 5.03 3.8 5.34 4.4 5.72 4.8 6.15 4.7 6.62
225 0.9 4.65 1.9 4.79 2.8 5.03 3.6 5.34 4.2 5.72 4.5 6.15 4.4 6.62
230 0.9 4.65 1.8 4.79 2.6 5.03 3.4 5.34 3.9 5.72 4.2 6.15 4.0 6.62
12 165 1.6 4.65 3.2 4.79 4.6 5.03 5.8 5.34 6.7 5.72 7.2 6.15
170 1.5 4.65 3.0 4.79 4.4 5.03 5.6 5.34 6.5 5.72 6.9 6.15
175 1.5 4.65 2.9 4.79 4.3 5.03 5.4 5.34 6.2 5.72 6.6 6.15
180 1.4 4.65 2.8 4.79 4.1 5.03 5.2 5.34 5.9 5.72 6.3 6.15
185 1.4 4.65 2.7 4.79 4.0 5.03 5.0 5.34 5.7 5.72 6.0 6.15
190 1.3 4.65 2.6 4.79 3.8 5.03 4.7 5.34 5.4 5.72 5.7 6.15
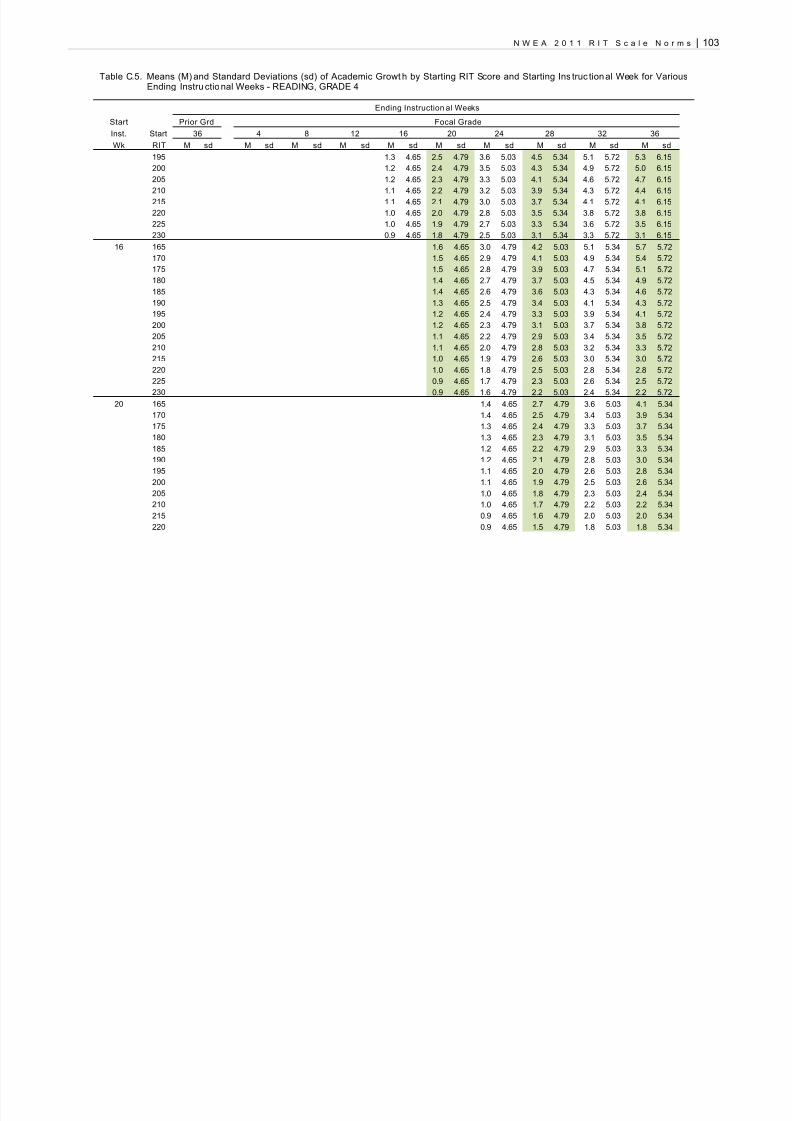
8/10/2019 n We a 2011 Norms Report
http://slidepdf.com/reader/full/n-we-a-2011-norms-report 119/268
N W E A 2 0 1 1 R I T S c a l e N o r m s | 103
Table C.5. Means (M) and Standard Deviations (sd) of Academic Growt h by Starting RIT Score and Starting Ins truc tional Week for VariousEnding Instru ctional Weeks - READING, GRADE 4
Ending Instruction al Weeks
Start Prior Grd Focal Grade
Inst. Start 36 4 8 12 16 20 24 28 32 36
Wk RIT M sd M sd M sd M sd M sd M sd M sd M sd M sd M sd
195 1.3 4.65 2.5 4.79 3.6 5.03 4.5 5.34 5.1 5.72 5.3 6.15
200 1.2 4.65 2.4 4.79 3.5 5.03 4.3 5.34 4.9 5.72 5.0 6.15
205 1.2 4.65 2.3 4.79 3.3 5.03 4.1 5.34 4.6 5.72 4.7 6.15
210 1.1 4.65 2.2 4.79 3.2 5.03 3.9 5.34 4.3 5.72 4.4 6.15
215 1.1 4.65 2.1 4.79 3.0 5.03 3.7 5.34 4.1 5.72 4.1 6.15
220 1.0 4.65 2.0 4.79 2.8 5.03 3.5 5.34 3.8 5.72 3.8 6.15
225 1.0 4.65 1.9 4.79 2.7 5.03 3.3 5.34 3.6 5.72 3.5 6.15
230 0.9 4.65 1.8 4.79 2.5 5.03 3.1 5.34 3.3 5.72 3.1 6.15
16 165 1.6 4.65 3.0 4.79 4.2 5.03 5.1 5.34 5.7 5.72
170 1.5 4.65 2.9 4.79 4.1 5.03 4.9 5.34 5.4 5.72
175 1.5 4.65 2.8 4.79 3.9 5.03 4.7 5.34 5.1 5.72
180 1.4 4.65 2.7 4.79 3.7 5.03 4.5 5.34 4.9 5.72
185 1.4 4.65 2.6 4.79 3.6 5.03 4.3 5.34 4.6 5.72
190 1.3 4.65 2.5 4.79 3.4 5.03 4.1 5.34 4.3 5.72
195 1.2 4.65 2.4 4.79 3.3 5.03 3.9 5.34 4.1 5.72
200 1.2 4.65 2.3 4.79 3.1 5.03 3.7 5.34 3.8 5.72
205 1.1 4.65 2.2 4.79 2.9 5.03 3.4 5.34 3.5 5.72
210 1.1 4.65 2.0 4.79 2.8 5.03 3.2 5.34 3.3 5.72
215 1.0 4.65 1.9 4.79 2.6 5.03 3.0 5.34 3.0 5.72
220 1.0 4.65 1.8 4.79 2.5 5.03 2.8 5.34 2.8 5.72
225 0.9 4.65 1.7 4.79 2.3 5.03 2.6 5.34 2.5 5.72
230 0.9 4.65 1.6 4.79 2.2 5.03 2.4 5.34 2.2 5.7220 165 1.4 4.65 2.7 4.79 3.6 5.03 4.1 5.34
170 1.4 4.65 2.5 4.79 3.4 5.03 3.9 5.34
175 1.3 4.65 2.4 4.79 3.3 5.03 3.7 5.34
180 1.3 4.65 2.3 4.79 3.1 5.03 3.5 5.34
185 1.2 4.65 2.2 4.79 2.9 5.03 3.3 5.34
190 1.2 4.65 2.1 4.79 2.8 5.03 3.0 5.34
195 1.1 4.65 2.0 4.79 2.6 5.03 2.8 5.34
200 1.1 4.65 1.9 4.79 2.5 5.03 2.6 5.34
205 1.0 4.65 1.8 4.79 2.3 5.03 2.4 5.34
210 1.0 4.65 1.7 4.79 2.2 5.03 2.2 5.34
215 0.9 4.65 1.6 4.79 2.0 5.03 2.0 5.34
220 0.9 4.65 1.5 4.79 1.8 5.03 1.8 5.34
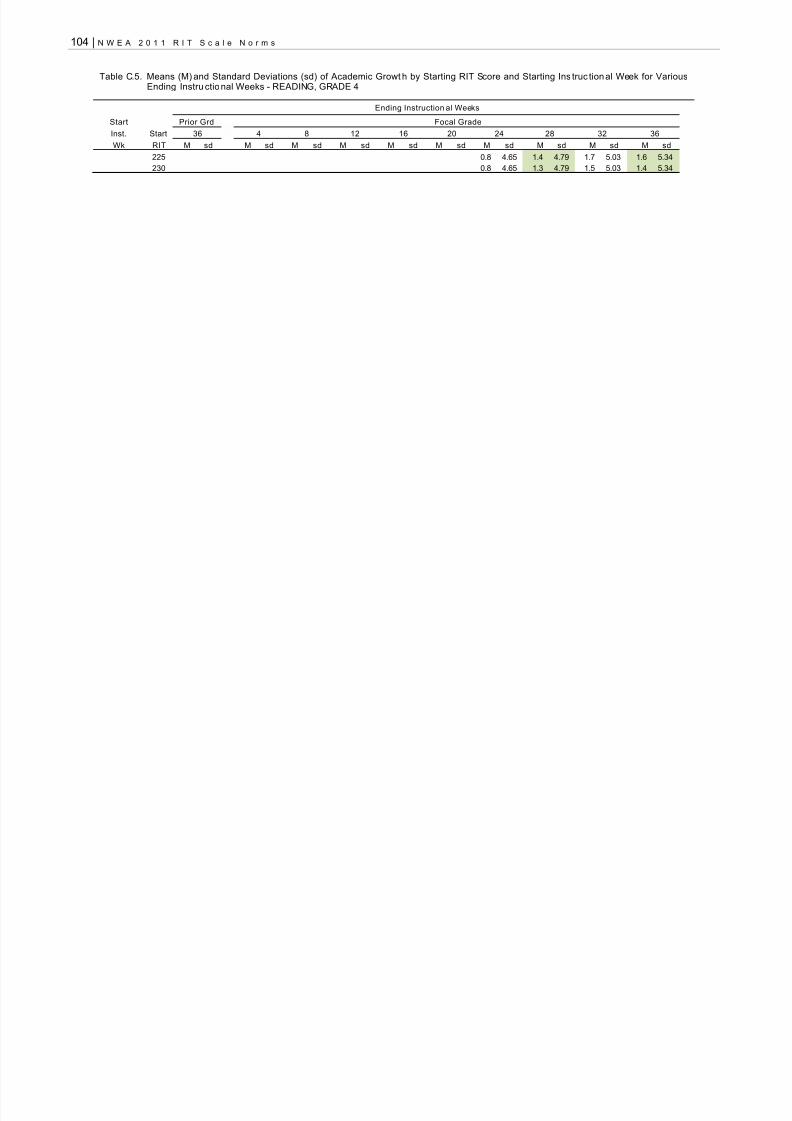
8/10/2019 n We a 2011 Norms Report
http://slidepdf.com/reader/full/n-we-a-2011-norms-report 120/268
104 | N W E A 2 0 1 1 R I T S c a l e N o r m s
Table C.5. Means (M) and Standard Deviations (sd) of Academic Growt h by Starting RIT Score and Starting Ins truc tional Week for VariousEnding Instru ctional Weeks - READING, GRADE 4
Ending Instruction al Weeks
Start Prior Grd Focal Grade
Inst. Start 36 4 8 12 16 20 24 28 32 36
Wk RIT M sd M sd M sd M sd M sd M sd M sd M sd M sd M sd
225 0.8 4.65 1.4 4.79 1.7 5.03 1.6 5.34
230 0.8 4.65 1.3 4.79 1.5 5.03 1.4 5.34

8/10/2019 n We a 2011 Norms Report
http://slidepdf.com/reader/full/n-we-a-2011-norms-report 121/268
N W E A 2 0 1 1 R I T S c a l e N o r m s | 105
Table C.6. Means (M) and Standard Deviations (sd) of Academic Growth by Starting RIT Score and Starting Instructi onal Week forVarious Ending Instructional Weeks - READING, GRADE 5
Table C.6. Means (M) and Standard Deviations (sd) of Academic Growth by Starti ng RIT Score and Starting Inst ruct ional Week for VariousEnding Instructi onal Weeks - READING, GRADE 5
Ending Instruction al Weeks
Start Prior Grd Focal Grade
Inst. Start 36 4 8 12 16 20 24 28 32 36
Wk RIT M sd M sd M sd M sd M sd M sd M sd M sd M sd M sd
32(Gd 4)
165 0.7 4.65 1.7 4.79 2.8 5.03 4.1 5.34 5.4 5.72 6.6 6.15 7.7 6.62 8.6 7.12 9.2 7.66 9.5 8.21
1700.7 4.65 1.6 4.79 2.7 5.03 3.9 5.34 5.2 5.72 6.4 6.15 7.4 6.62 8.3 7.12 8.9 7.66 9.2 8.21175 0.6 4.65 1.5 4.79 2.6 5.03 3.8 5.34 5.0 5.72 6.1 6.15 7.2 6.62 8.0 7.12 8.6 7.66 8.8 8.21
180 0.6 4.65 1.5 4.79 2.5 5.03 3.6 5.34 4.8 5.72 5.9 6.15 6.9 6.62 7.7 7.12 8.2 7.66 8.4 8.21
185 0.6 4.65 1.4 4.79 2.4 5.03 3.5 5.34 4.6 5.72 5.7 6.15 6.6 6.62 7.4 7.12 7.9 7.66 8.0 8.21
190 0.5 4.65 1.3 4.79 2.3 5.03 3.3 5.34 4.4 5.72 5.5 6.15 6.4 6.62 7.1 7.12 7.5 7.66 7.7 8.21
195 0.5 4.65 1.2 4.79 2.2 5.03 3.2 5.34 4.2 5.72 5.2 6.15 6.1 6.62 6.8 7.12 7.2 7.66 7.3 8.21
200 0.5 4.65 1.2 4.79 2.0 5.03 3.0 5.34 4.0 5.72 5.0 6.15 5.8 6.62 6.5 7.12 6.9 7.66 6.9 8.21
205 0.4 4.65 1.1 4.79 1.9 5.03 2.9 5.34 3.8 5.72 4.8 6.15 5.6 6.62 6.2 7.12 6.5 7.66 6.5 8.21
210 0.4 4.65 1.0 4.79 1.8 5.03 2.7 5.34 3.7 5.72 4.5 6.15 5.3 6.62 5.9 7.12 6.2 7.66 6.1 8.21
215 0.3 4.65 0.9 4.79 1.7 5.03 2.6 5.34 3.5 5.72 4.3 6.15 5.0 6.62 5.6 7.12 5.8 7.66 5.8 8.21
220 0.3 4.65 0.9 4.79 1.6 5.03 2.4 5.34 3.3 5.72 4.1 6.15 4.8 6.62 5.3 7.12 5.5 7.66 5.4 8.21
225 0.3 4.65 0.8 4.79 1.5 5.03 2.3 5.34 3.1 5.72 3.9 6.15 4.5 6.62 5.0 7.12 5.2 7.66 5.0 8.21
230 0.2 4.65 0.7 4.79 1.4 5.03 2.1 5.34 2.9 5.72 3.6 6.15 4.3 6.62 4.7 7.12 4.8 7.66 4.6 8.21
235 0.2 4.65 0.6 4.79 1.3 5.03 2.0 5.34 2.7 5.72 3.4 6.15 4.0 6.62 4.4 7.12 4.5 7.66 4.3 8.21
36(Gd 4)
165 1.0 4.65 2.1 4.79 3.4 5.03 4.6 5.34 5.9 5.72 7.0 6.15 7.9 6.62 8.5 7.12 8.8 7.66
170 0.9 4.65 2.0 4.79 3.3 5.03 4.5 5.34 5.7 5.72 6.7 6.15 7.6 6.62 8.2 7.12 8.5 7.66
175 0.9 4.65 2.0 4.79 3.1 5.03 4.3 5.34 5.5 5.72 6.5 6.15 7.4 6.62 7.9 7.12 8.1 7.66
180 0.9 4.65 1.9 4.79 3.0 5.03 4.2 5.34 5.3 5.72 6.3 6.15 7.1 6.62 7.6 7.12 7.8 7.66
185 0.8 4.65 1.8 4.79 2.9 5.03 4.0 5.34 5.1 5.72 6.1 6.15 6.8 6.62 7.3 7.12 7.5 7.66190 0.8 4.65 1.7 4.79 2.8 5.03 3.9 5.34 4.9 5.72 5.8 6.15 6.6 6.62 7.0 7.12 7.1 7.66
195 0.7 4.65 1.7 4.79 2.7 5.03 3.7 5.34 4.7 5.72 5.6 6.15 6.3 6.62 6.7 7.12 6.8 7.66
200 0.7 4.65 1.6 4.79 2.6 5.03 3.6 5.34 4.5 5.72 5.4 6.15 6.0 6.62 6.4 7.12 6.4 7.66
205 0.7 4.65 1.5 4.79 2.5 5.03 3.4 5.34 4.4 5.72 5.2 6.15 5.8 6.62 6.1 7.12 6.1 7.66
210 0.6 4.65 1.4 4.79 2.3 5.03 3.3 5.34 4.2 5.72 4.9 6.15 5.5 6.62 5.8 7.12 5.8 7.66
215 0.6 4.65 1.4 4.79 2.2 5.03 3.1 5.34 4.0 5.72 4.7 6.15 5.2 6.62 5.5 7.12 5.4 7.66
220 0.6 4.65 1.3 4.79 2.1 5.03 3.0 5.34 3.8 5.72 4.5 6.15 5.0 6.62 5.2 7.12 5.1 7.66
225 0.5 4.65 1.2 4.79 2.0 5.03 2.8 5.34 3.6 5.72 4.3 6.15 4.7 6.62 4.9 7.12 4.8 7.66
230 0.5 4.65 1.1 4.79 1.9 5.03 2.7 5.34 3.4 5.72 4.0 6.15 4.5 6.62 4.6 7.12 4.4 7.66
235 0.4 4.65 1.1 4.79 1.8 5.03 2.5 5.34 3.2 5.72 3.8 6.15 4.2 6.62 4.3 7.12 4.1 7.66
4 170 1.1 4.65 2.3 4.79 3.6 5.03 4.7 5.34 5.8 5.72 6.7 6.15 7.3 6.62 7.6 7.12
175 1.1 4.65 2.2 4.79 3.4 5.03 4.6 5.34 5.6 5.72 6.5 6.15 7.0 6.62 7.3 7.12

8/10/2019 n We a 2011 Norms Report
http://slidepdf.com/reader/full/n-we-a-2011-norms-report 122/268
106 | N W E A 2 0 1 1 R I T S c a l e N o r m s
Table C.6. Means (M) and Standard Deviations (sd) of Academic Growth by Starti ng RIT Score and Starting Inst ruct ional Week for VariousEnding Instructi onal Weeks - READING, GRADE 5
Ending Instruction al Weeks
Start Prior Grd Focal Grade
Inst. Start 36 4 8 12 16 20 24 28 32 36
Wk RIT M sd M sd M sd M sd M sd M sd M sd M sd M sd M sd
180 1.0 4.65 2.2 4.79 3.3 5.03 4.4 5.34 5.4 5.72 6.2 6.15 6.8 6.62 6.9 7.12
185 1.0 4.65 2.1 4.79 3.2 5.03 4.3 5.34 5.2 5.72 6.0 6.15 6.5 6.62 6.6 7.12
190 1.0 4.65 2.0 4.79 3.1 5.03 4.1 5.34 5.1 5.72 5.8 6.15 6.2 6.62 6.3 7.12
195 0.9 4.65 1.9 4.79 3.0 5.03 4.0 5.34 4.9 5.72 5.6 6.15 6.0 6.62 6.0 7.12
200 0.9 4.65 1.9 4.79 2.9 5.03 3.8 5.34 4.7 5.72 5.3 6.15 5.7 6.62 5.7 7.12
205 0.8 4.65 1.8 4.79 2.8 5.03 3.7 5.34 4.5 5.72 5.1 6.15 5.4 6.62 5.4 7.12
210 0.8 4.65 1.7 4.79 2.7 5.03 3.5 5.34 4.3 5.72 4.9 6.15 5.2 6.62 5.1 7.12
215 0.8 4.65 1.6 4.79 2.5 5.03 3.4 5.34 4.1 5.72 4.7 6.15 4.9 6.62 4.8 7.12
220 0.7 4.65 1.6 4.79 2.4 5.03 3.2 5.34 3.9 5.72 4.4 6.15 4.7 6.62 4.5 7.12
225 0.7 4.65 1.5 4.79 2.3 5.03 3.1 5.34 3.7 5.72 4.2 6.15 4.4 6.62 4.2 7.12
230 0.7 4.65 1.4 4.79 2.2 5.03 2.9 5.34 3.6 5.72 4.0 6.15 4.1 6.62 3.9 7.12
235 0.6 4.65 1.3 4.79 2.1 5.03 2.8 5.34 3.4 5.72 3.7 6.15 3.9 6.62 3.6 7.12
8 170 1.2 4.65 2.4 4.79 3.6 5.03 4.7 5.34 5.6 5.72 6.2 6.15 6.4 6.62
175 1.2 4.65 2.4 4.79 3.5 5.03 4.6 5.34 5.4 5.72 6.0 6.15 6.2 6.62
180 1.1 4.65 2.3 4.79 3.4 5.03 4.4 5.34 5.2 5.72 5.7 6.15 5.9 6.62
185 1.1 4.65 2.2 4.79 3.3 5.03 4.3 5.34 5.0 5.72 5.5 6.15 5.7 6.62
190 1.1 4.65 2.1 4.79 3.2 5.03 4.1 5.34 4.8 5.72 5.3 6.15 5.4 6.62
195 1.0 4.65 2.1 4.79 3.1 5.03 4.0 5.34 4.6 5.72 5.1 6.15 5.1 6.62
200 1.0 4.65 2.0 4.79 3.0 5.03 3.8 5.34 4.4 5.72 4.8 6.15 4.9 6.62
205 0.9 4.65 1.9 4.79 2.8 5.03 3.7 5.34 4.3 5.72 4.6 6.15 4.6 6.62
210 0.9 4.65 1.8 4.79 2.7 5.03 3.5 5.34 4.1 5.72 4.4 6.15 4.3 6.62
215 0.9 4.65 1.8 4.79 2.6 5.03 3.3 5.34 3.9 5.72 4.1 6.15 4.1 6.62220 0.8 4.65 1.7 4.79 2.5 5.03 3.2 5.34 3.7 5.72 3.9 6.15 3.8 6.62
225 0.8 4.65 1.6 4.79 2.4 5.03 3.0 5.34 3.5 5.72 3.7 6.15 3.5 6.62
230 0.8 4.65 1.5 4.79 2.3 5.03 2.9 5.34 3.3 5.72 3.5 6.15 3.3 6.62
235 0.7 4.65 1.5 4.79 2.2 5.03 2.7 5.34 3.1 5.72 3.2 6.15 3.0 6.62
12 170 1.2 4.65 2.4 4.79 3.5 5.03 4.4 5.34 5.0 5.72 5.2 6.15
175 1.2 4.65 2.4 4.79 3.4 5.03 4.2 5.34 4.8 5.72 5.0 6.15
180 1.2 4.65 2.3 4.79 3.3 5.03 4.1 5.34 4.6 5.72 4.8 6.15
185 1.1 4.65 2.2 4.79 3.2 5.03 3.9 5.34 4.4 5.72 4.6 6.15
190 1.1 4.65 2.1 4.79 3.0 5.03 3.8 5.34 4.2 5.72 4.3 6.15
195 1.1 4.65 2.1 4.79 2.9 5.03 3.6 5.34 4.0 5.72 4.1 6.15
200 1.0 4.65 2.0 4.79 2.8 5.03 3.5 5.34 3.8 5.72 3.9 6.15
205 1.0 4.65 1.9 4.79 2.7 5.03 3.3 5.34 3.7 5.72 3.7 6.15

8/10/2019 n We a 2011 Norms Report
http://slidepdf.com/reader/full/n-we-a-2011-norms-report 123/268
N W E A 2 0 1 1 R I T S c a l e N o r m s | 107
Table C.6. Means (M) and Standard Deviations (sd) of Academic Growth by Starti ng RIT Score and Starting Inst ruct ional Week for VariousEnding Instructi onal Weeks - READING, GRADE 5
Ending Instruction al Weeks
Start Prior Grd Focal Grade
Inst. Start 36 4 8 12 16 20 24 28 32 36
Wk RIT M sd M sd M sd M sd M sd M sd M sd M sd M sd M sd
210 0.9 4.65 1.8 4.79 2.6 5.03 3.2 5.34 3.5 5.72 3.4 6.15
215 0.9 4.65 1.8 4.79 2.5 5.03 3.0 5.34 3.3 5.72 3.2 6.15
220 0.9 4.65 1.7 4.79 2.4 5.03 2.9 5.34 3.1 5.72 3.0 6.15
225 0.8 4.65 1.6 4.79 2.3 5.03 2.7 5.34 2.9 5.72 2.8 6.15
230 0.8 4.65 1.5 4.79 2.1 5.03 2.6 5.34 2.7 5.72 2.5 6.15
235 0.8 4.65 1.4 4.79 2.0 5.03 2.4 5.34 2.5 5.72 2.3 6.15
16 170 1.2 4.65 2.3 4.79 3.1 5.03 3.7 5.34 4.0 5.72
175 1.2 4.65 2.2 4.79 3.0 5.03 3.6 5.34 3.8 5.72
180 1.1 4.65 2.1 4.79 2.9 5.03 3.4 5.34 3.6 5.72
185 1.1 4.65 2.0 4.79 2.8 5.03 3.3 5.34 3.4 5.72
190 1.0 4.65 2.0 4.79 2.7 5.03 3.1 5.34 3.2 5.72
195 1.0 4.65 1.9 4.79 2.6 5.03 3.0 5.34 3.1 5.72
200 1.0 4.65 1.8 4.79 2.5 5.03 2.8 5.34 2.9 5.72
205 0.9 4.65 1.7 4.79 2.3 5.03 2.7 5.34 2.7 5.72
210 0.9 4.65 1.7 4.79 2.2 5.03 2.5 5.34 2.5 5.72
215 0.9 4.65 1.6 4.79 2.1 5.03 2.4 5.34 2.3 5.72
220 0.8 4.65 1.5 4.79 2.0 5.03 2.2 5.34 2.1 5.72
225 0.8 4.65 1.4 4.79 1.9 5.03 2.1 5.34 1.9 5.72
230 0.7 4.65 1.4 4.79 1.8 5.03 1.9 5.34 1.7 5.72
235 0.7 4.65 1.3 4.79 1.7 5.03 1.8 5.34 1.6 5.72
20 170 1.1 4.65 1.9 4.79 2.6 5.03 2.8 5.34
175 1.0 4.65 1.9 4.79 2.4 5.03 2.7 5.34180 1.0 4.65 1.8 4.79 2.3 5.03 2.5 5.34
185 1.0 4.65 1.7 4.79 2.2 5.03 2.4 5.34
190 0.9 4.65 1.6 4.79 2.1 5.03 2.2 5.34
195 0.9 4.65 1.6 4.79 2.0 5.03 2.1 5.34
200 0.8 4.65 1.5 4.79 1.9 5.03 1.9 5.34
205 0.8 4.65 1.4 4.79 1.8 5.03 1.8 5.34
210 0.8 4.65 1.3 4.79 1.6 5.03 1.6 5.34
215 0.7 4.65 1.3 4.79 1.5 5.03 1.5 5.34
220 0.7 4.65 1.2 4.79 1.4 5.03 1.3 5.34
225 0.7 4.65 1.1 4.79 1.3 5.03 1.2 5.34
230 0.6 4.65 1.0 4.79 1.2 5.03 1.0 5.34
235 0.6 4.65 1.0 4.79 1.1 5.03 0.9 5.34

8/10/2019 n We a 2011 Norms Report
http://slidepdf.com/reader/full/n-we-a-2011-norms-report 124/268
108 | N W E A 2 0 1 1 R I T S c a l e N o r m s
Table C.7. Means (M) and Standard Deviations (sd) of Academic Growth by Starting RIT Score and Starting Instructi onal Week forVarious Ending Instructional Weeks - READING, GRADE 6
Table C.7. Means (M) and Standard Deviations (sd) of Academic Growth by Starti ng RIT Score and Starting Instr ucti onal Week forVarious Endi ng Inst ruct ional Weeks - READING, GRADE 6
Ending Instruction al Weeks
Start Prior Grd Focal Grade
Inst. Start 36 4 8 12 16 20 24 28 32 36
Wk RIT M sd M sd M sd M sd M sd M sd M sd M sd M sd M sd
32
(Gd 5)
170 0.4 4.65 1.1 4.80 1.9 5.03 2.8 5.35 3.8 5.73 4.7 6.16 5.6 6.64 6.3 7.15 6.9 7.68 7.2 8.24
175 0.4 4.65 1.0 4.80 1.8 5.03 2.7 5.35 3.6 5.73 4.6 6.16 5.4 6.64 6.1 7.15 6.6 7.68 6.9 8.24180 0.4 4.65 1.0 4.80 1.7 5.03 2.6 5.35 3.5 5.73 4.4 6.16 5.2 6.64 5.9 7.15 6.4 7.68 6.7 8.24
185 0.4 4.65 0.9 4.80 1.7 5.03 2.5 5.35 3.4 5.73 4.2 6.16 5.0 6.64 5.7 7.15 6.2 7.68 6.4 8.24
190 0.3 4.65 0.9 4.80 1.6 5.03 2.4 5.35 3.2 5.73 4.1 6.16 4.8 6.64 5.5 7.15 5.9 7.68 6.1 8.24
195 0.3 4.65 0.8 4.80 1.5 5.03 2.3 5.35 3.1 5.73 3.9 6.16 4.6 6.64 5.2 7.15 5.7 7.68 5.8 8.24
200 0.3 4.65 0.8 4.80 1.4 5.03 2.2 5.35 3.0 5.73 3.7 6.16 4.4 6.64 5.0 7.15 5.4 7.68 5.6 8.24
205 0.2 4.65 0.7 4.80 1.3 5.03 2.0 5.35 2.8 5.73 3.6 6.16 4.3 6.64 4.8 7.15 5.2 7.68 5.3 8.24
210 0.2 4.65 0.7 4.80 1.2 5.03 1.9 5.35 2.7 5.73 3.4 6.16 4.1 6.64 4.6 7.15 4.9 7.68 5.0 8.24
215 0.2 4.65 0.6 4.80 1.2 5.03 1.8 5.35 2.5 5.73 3.2 6.16 3.9 6.64 4.4 7.15 4.7 7.68 4.7 8.24
220 0.2 4.65 0.5 4.80 1.1 5.03 1.7 5.35 2.4 5.73 3.1 6.16 3.7 6.64 4.2 7.15 4.4 7.68 4.5 8.24
225 0.1 4.65 0.5 4.80 1.0 5.03 1.6 5.35 2.3 5.73 2.9 6.16 3.5 6.64 3.9 7.15 4.2 7.68 4.2 8.24
230 0.1 4.65 0.4 4.80 0.9 5.03 1.5 5.35 2.1 5.73 2.8 6.16 3.3 6.64 3.7 7.15 4.0 7.68 3.9 8.24
235 0.1 4.65 0.4 4.80 0.8 5.03 1.4 5.35 2.0 5.73 2.6 6.16 3.1 6.64 3.5 7.15 3.7 7.68 3.7 8.24
240 0.1 4.65 0.3 4.80 0.8 5.03 1.3 5.35 1.9 5.73 2.4 6.16 2.9 6.64 3.3 7.15 3.5 7.68 3.4 8.24
36(Gd 5)
170 0.7 4.65 1.5 4.80 2.4 5.03 3.3 5.35 4.3 5.73 5.2 6.16 5.9 6.64 6.5 7.15 6.8 7.68
175 0.6 4.65 1.4 4.80 2.3 5.03 3.2 5.35 4.1 5.73 5.0 6.16 5.7 6.64 6.2 7.15 6.5 7.68
180 0.6 4.65 1.4 4.80 2.2 5.03 3.1 5.35 4.0 5.73 4.8 6.16 5.5 6.64 6.0 7.15 6.3 7.68
185 0.6 4.65 1.3 4.80 2.1 5.03 3.0 5.35 3.9 5.73 4.7 6.16 5.3 6.64 5.8 7.15 6.0 7.68190 0.5 4.65 1.2 4.80 2.1 5.03 2.9 5.35 3.7 5.73 4.5 6.16 5.1 6.64 5.6 7.15 5.8 7.68
195 0.5 4.65 1.2 4.80 2.0 5.03 2.8 5.35 3.6 5.73 4.3 6.16 4.9 6.64 5.4 7.15 5.5 7.68
200 0.5 4.65 1.1 4.80 1.9 5.03 2.7 5.35 3.5 5.73 4.2 6.16 4.8 6.64 5.2 7.15 5.3 7.68
205 0.5 4.65 1.1 4.80 1.8 5.03 2.6 5.35 3.3 5.73 4.0 6.16 4.6 6.64 4.9 7.15 5.1 7.68
210 0.4 4.65 1.0 4.80 1.7 5.03 2.5 5.35 3.2 5.73 3.9 6.16 4.4 6.64 4.7 7.15 4.8 7.68
215 0.4 4.65 1.0 4.80 1.6 5.03 2.4 5.35 3.1 5.73 3.7 6.16 4.2 6.64 4.5 7.15 4.6 7.68
220 0.4 4.65 0.9 4.80 1.6 5.03 2.3 5.35 2.9 5.73 3.5 6.16 4.0 6.64 4.3 7.15 4.3 7.68
225 0.4 4.65 0.9 4.80 1.5 5.03 2.1 5.35 2.8 5.73 3.4 6.16 3.8 6.64 4.1 7.15 4.1 7.68
230 0.3 4.65 0.8 4.80 1.4 5.03 2.0 5.35 2.7 5.73 3.2 6.16 3.6 6.64 3.8 7.15 3.8 7.68
235 0.3 4.65 0.8 4.80 1.3 5.03 1.9 5.35 2.5 5.73 3.0 6.16 3.4 6.64 3.6 7.15 3.6 7.68
240 0.3 4.65 0.7 4.80 1.2 5.03 1.8 5.35 2.4 5.73 2.9 6.16 3.2 6.64 3.4 7.15 3.3 7.68
4 175 0.8 4.65 1.7 4.80 2.6 5.03 3.5 5.35 4.4 5.73 5.1 6.16 5.6 6.64 5.9 7.15

8/10/2019 n We a 2011 Norms Report
http://slidepdf.com/reader/full/n-we-a-2011-norms-report 125/268
N W E A 2 0 1 1 R I T S c a l e N o r m s | 109
Table C.7. Means (M) and Standard Deviations (sd) of Academic Growth by Starti ng RIT Score and Starting Instr ucti onal Week forVarious Endi ng Inst ruct ional Weeks - READING, GRADE 6
Ending Instruction al Weeks
Start Prior Grd Focal Grade
Inst. Start 36 4 8 12 16 20 24 28 32 36
Wk RIT M sd M sd M sd M sd M sd M sd M sd M sd M sd M sd
180 0.8 4.65 1.6 4.80 2.5 5.03 3.4 5.35 4.2 5.73 4.9 6.16 5.4 6.64 5.7 7.15
185 0.7 4.65 1.6 4.80 2.4 5.03 3.3 5.35 4.1 5.73 4.8 6.16 5.2 6.64 5.5 7.15
190 0.7 4.65 1.5 4.80 2.4 5.03 3.2 5.35 4.0 5.73 4.6 6.16 5.0 6.64 5.2 7.15
195 0.7 4.65 1.5 4.80 2.3 5.03 3.1 5.35 3.8 5.73 4.4 6.16 4.9 6.64 5.0 7.15
200 0.7 4.65 1.4 4.80 2.2 5.03 3.0 5.35 3.7 5.73 4.3 6.16 4.7 6.64 4.8 7.15
205 0.6 4.65 1.3 4.80 2.1 5.03 2.9 5.35 3.6 5.73 4.1 6.16 4.5 6.64 4.6 7.15
210 0.6 4.65 1.3 4.80 2.0 5.03 2.8 5.35 3.4 5.73 3.9 6.16 4.3 6.64 4.4 7.15
215 0.6 4.65 1.2 4.80 2.0 5.03 2.7 5.35 3.3 5.73 3.8 6.16 4.1 6.64 4.2 7.15
220 0.5 4.65 1.2 4.80 1.9 5.03 2.5 5.35 3.1 5.73 3.6 6.16 3.9 6.64 3.9 7.15
225 0.5 4.65 1.1 4.80 1.8 5.03 2.4 5.35 3.0 5.73 3.5 6.16 3.7 6.64 3.7 7.15
230 0.5 4.65 1.1 4.80 1.7 5.03 2.3 5.35 2.9 5.73 3.3 6.16 3.5 6.64 3.5 7.15
235 0.5 4.65 1.0 4.80 1.6 5.03 2.2 5.35 2.7 5.73 3.1 6.16 3.3 6.64 3.3 7.15
240 0.4 4.65 1.0 4.80 1.5 5.03 2.1 5.35 2.6 5.73 3.0 6.16 3.1 6.64 3.1 7.15
8 175 0.9 4.65 1.8 4.80 2.7 5.03 3.6 5.35 4.3 5.73 4.8 6.16 5.1 6.64
180 0.9 4.65 1.8 4.80 2.7 5.03 3.5 5.35 4.2 5.73 4.7 6.16 4.9 6.64
185 0.8 4.65 1.7 4.80 2.6 5.03 3.4 5.35 4.0 5.73 4.5 6.16 4.7 6.64
190 0.8 4.65 1.7 4.80 2.5 5.03 3.3 5.35 3.9 5.73 4.3 6.16 4.5 6.64
195 0.8 4.65 1.6 4.80 2.4 5.03 3.2 5.35 3.8 5.73 4.2 6.16 4.4 6.64
200 0.8 4.65 1.6 4.80 2.3 5.03 3.0 5.35 3.6 5.73 4.0 6.16 4.2 6.64
205 0.7 4.65 1.5 4.80 2.3 5.03 2.9 5.35 3.5 5.73 3.9 6.16 4.0 6.64
210 0.7 4.65 1.4 4.80 2.2 5.03 2.8 5.35 3.4 5.73 3.7 6.16 3.8 6.64
215 0.7 4.65 1.4 4.80 2.1 5.03 2.7 5.35 3.2 5.73 3.5 6.16 3.6 6.64220 0.6 4.65 1.3 4.80 2.0 5.03 2.6 5.35 3.1 5.73 3.4 6.16 3.4 6.64
225 0.6 4.65 1.3 4.80 1.9 5.03 2.5 5.35 2.9 5.73 3.2 6.16 3.2 6.64
230 0.6 4.65 1.2 4.80 1.8 5.03 2.4 5.35 2.8 5.73 3.0 6.16 3.0 6.64
235 0.6 4.65 1.2 4.80 1.8 5.03 2.3 5.35 2.7 5.73 2.9 6.16 2.8 6.64
240 0.5 4.65 1.1 4.80 1.7 5.03 2.2 5.35 2.5 5.73 2.7 6.16 2.6 6.64
12 175 0.9 4.65 1.9 4.80 2.7 5.03 3.4 5.35 3.9 5.73 4.2 6.16
180 0.9 4.65 1.8 4.80 2.6 5.03 3.3 5.35 3.8 5.73 4.1 6.16
185 0.9 4.65 1.7 4.80 2.5 5.03 3.2 5.35 3.7 5.73 3.9 6.16
190 0.9 4.65 1.7 4.80 2.5 5.03 3.1 5.35 3.5 5.73 3.7 6.16
195 0.8 4.65 1.6 4.80 2.4 5.03 3.0 5.35 3.4 5.73 3.6 6.16
200 0.8 4.65 1.6 4.80 2.3 5.03 2.9 5.35 3.3 5.73 3.4 6.16
205 0.8 4.65 1.5 4.80 2.2 5.03 2.8 5.35 3.1 5.73 3.2 6.16

8/10/2019 n We a 2011 Norms Report
http://slidepdf.com/reader/full/n-we-a-2011-norms-report 126/268
110 | N W E A 2 0 1 1 R I T S c a l e N o r m s
Table C.7. Means (M) and Standard Deviations (sd) of Academic Growth by Starti ng RIT Score and Starting Instr ucti onal Week forVarious Endi ng Inst ruct ional Weeks - READING, GRADE 6
Ending Instruction al Weeks
Start Prior Grd Focal Grade
Inst. Start 36 4 8 12 16 20 24 28 32 36
Wk RIT M sd M sd M sd M sd M sd M sd M sd M sd M sd M sd
210 0.7 4.65 1.5 4.80 2.1 5.03 2.7 5.35 3.0 5.73 3.1 6.16
215 0.7 4.65 1.4 4.80 2.0 5.03 2.5 5.35 2.9 5.73 2.9 6.16
220 0.7 4.65 1.4 4.80 2.0 5.03 2.4 5.35 2.7 5.73 2.8 6.16
225 0.7 4.65 1.3 4.80 1.9 5.03 2.3 5.35 2.6 5.73 2.6 6.16
230 0.6 4.65 1.3 4.80 1.8 5.03 2.2 5.35 2.5 5.73 2.4 6.16
235 0.6 4.65 1.2 4.80 1.7 5.03 2.1 5.35 2.3 5.73 2.3 6.16
240 0.6 4.65 1.1 4.80 1.6 5.03 2.0 5.35 2.2 5.73 2.1 6.16
16 175 0.9 4.65 1.8 4.80 2.5 5.03 3.0 5.35 3.3 5.73
180 0.9 4.65 1.7 4.80 2.4 5.03 2.9 5.35 3.2 5.73
185 0.9 4.65 1.7 4.80 2.3 5.03 2.8 5.35 3.0 5.73
190 0.8 4.65 1.6 4.80 2.2 5.03 2.7 5.35 2.9 5.73
195 0.8 4.65 1.6 4.80 2.2 5.03 2.6 5.35 2.8 5.73
200 0.8 4.65 1.5 4.80 2.1 5.03 2.5 5.35 2.6 5.73
205 0.8 4.65 1.4 4.80 2.0 5.03 2.4 5.35 2.5 5.73
210 0.7 4.65 1.4 4.80 1.9 5.03 2.3 5.35 2.3 5.73
215 0.7 4.65 1.3 4.80 1.8 5.03 2.1 5.35 2.2 5.73
220 0.7 4.65 1.3 4.80 1.8 5.03 2.0 5.35 2.1 5.73
225 0.7 4.65 1.2 4.80 1.7 5.03 1.9 5.35 1.9 5.73
230 0.6 4.65 1.2 4.80 1.6 5.03 1.8 5.35 1.8 5.73
235 0.6 4.65 1.1 4.80 1.5 5.03 1.7 5.35 1.7 5.73
240 0.6 4.65 1.1 4.80 1.4 5.03 1.6 5.35 1.5 5.73
20 175 0.9 4.65 1.6 4.80 2.1 5.03 2.4 5.35180 0.8 4.65 1.5 4.80 2.0 5.03 2.3 5.35
185 0.8 4.65 1.5 4.80 1.9 5.03 2.2 5.35
190 0.8 4.65 1.4 4.80 1.9 5.03 2.1 5.35
195 0.7 4.65 1.4 4.80 1.8 5.03 1.9 5.35
200 0.7 4.65 1.3 4.80 1.7 5.03 1.8 5.35
205 0.7 4.65 1.2 4.80 1.6 5.03 1.7 5.35
210 0.7 4.65 1.2 4.80 1.5 5.03 1.6 5.35
215 0.6 4.65 1.1 4.80 1.4 5.03 1.5 5.35
220 0.6 4.65 1.1 4.80 1.4 5.03 1.4 5.35
225 0.6 4.65 1.0 4.80 1.3 5.03 1.3 5.35
230 0.6 4.65 1.0 4.80 1.2 5.03 1.2 5.35
235 0.5 4.65 0.9 4.80 1.1 5.03 1.1 5.35

8/10/2019 n We a 2011 Norms Report
http://slidepdf.com/reader/full/n-we-a-2011-norms-report 127/268
N W E A 2 0 1 1 R I T S c a l e N o r m s | 111
Table C.7. Means (M) and Standard Deviations (sd) of Academic Growth by Starti ng RIT Score and Starting Instr ucti onal Week forVarious Endi ng Inst ruct ional Weeks - READING, GRADE 6
Ending Instruction al Weeks
Start Prior Grd Focal Grade
Inst. Start 36 4 8 12 16 20 24 28 32 36
Wk RIT M sd M sd M sd M sd M sd M sd M sd M sd M sd M sd
240 0.5 4.65 0.9 4.80 1.0 5.03 1.0 5.35

8/10/2019 n We a 2011 Norms Report
http://slidepdf.com/reader/full/n-we-a-2011-norms-report 128/268
112 | N W E A 2 0 1 1 R I T S c a l e N o r m s
Table C.8. Means (M) and Standard Deviations (sd) of Academic Growth by Starting RIT Score and Starting Instructi onal Week forVarious Ending Instructional Weeks - READING, GRADE 7
Table C.8. Means (M) and Standard Deviations (sd) of Academic Growt h by Starting RIT Score and Starting Inst ruct ional Week forVarious Endi ng Inst ruct ional Weeks - READING, GRADE 7
Ending Instruction al Weeks
Start Prior Grd Focal Grade
Inst. Start 36 4 8 12 16 20 24 28 32 36
Wk RIT M sd M sd M sd M sd M sd M sd M sd M sd M sd M sd
32(Gd 6)
175 0.4 4.65 0.9 4.80 1.6 5.04 2.4 5.36 3.3 5.75 4.2 6.19 5.0 6.67 5.8 7.18 6.5 7.73 7.0 8.29
1800.3 4.65 0.9 4.80 1.5 5.04 2.3 5.36 3.1 5.75 4.0 6.19 4.8 6.67 5.6 7.18 6.2 7.73 6.7 8.29185 0.3 4.65 0.8 4.80 1.4 5.04 2.2 5.36 3.0 5.75 3.8 6.19 4.6 6.67 5.3 7.18 5.9 7.73 6.3 8.29
190 0.3 4.65 0.7 4.80 1.3 5.04 2.0 5.36 2.8 5.75 3.6 6.19 4.3 6.67 5.0 7.18 5.6 7.73 6.0 8.29
195 0.2 4.65 0.7 4.80 1.2 5.04 1.9 5.36 2.6 5.75 3.4 6.19 4.1 6.67 4.7 7.18 5.3 7.73 5.6 8.29
200 0.2 4.65 0.6 4.80 1.1 5.04 1.7 5.36 2.4 5.75 3.2 6.19 3.8 6.67 4.4 7.18 4.9 7.73 5.3 8.29
205 0.2 4.65 0.5 4.80 1.0 5.04 1.6 5.36 2.3 5.75 2.9 6.19 3.6 6.67 4.2 7.18 4.6 7.73 4.9 8.29
210 0.1 4.65 0.4 4.80 0.9 5.04 1.5 5.36 2.1 5.75 2.7 6.19 3.3 6.67 3.9 7.18 4.3 7.73 4.6 8.29
215 0.1 4.65 0.4 4.80 0.8 5.04 1.3 5.36 1.9 5.75 2.5 6.19 3.1 6.67 3.6 7.18 4.0 7.73 4.3 8.29
220 0.1 4.65 0.3 4.80 0.7 5.04 1.2 5.36 1.7 5.75 2.3 6.19 2.9 6.67 3.3 7.18 3.7 7.73 3.9 8.29
225 0.0 4.65 0.2 4.80 0.6 5.04 1.1 5.36 1.6 5.75 2.1 6.19 2.6 6.67 3.1 7.18 3.4 7.73 3.6 8.29
230 0.0 4.65 0.2 4.80 0.5 5.04 0.9 5.36 1.4 5.75 1.9 6.19 2.4 6.67 2.8 7.18 3.1 7.73 3.2 8.29
235 -0.1 4.65 0.1 4.80 0.4 5.04 0.8 5.36 1.2 5.75 1.7 6.19 2.1 6.67 2.5 7.18 2.8 7.73 2.9 8.29
240 -0.1 4.65 0.0 4.80 0.3 5.04 0.6 5.36 1.1 5.75 1.5 6.19 1.9 6.67 2.2 7.18 2.5 7.73 2.5 8.29
245 -0.1 4.65 0.0 4.80 0.2 5.04 0.5 5.36 0.9 5.75 1.3 6.19 1.7 6.67 2.0 7.18 2.1 7.73 2.2 8.29
36(Gd 6)
175 0.6 4.65 1.3 4.80 2.1 5.04 2.9 5.36 3.8 5.75 4.7 6.19 5.5 6.67 6.1 7.18 6.7 7.73
180 0.5 4.65 1.2 4.80 2.0 5.04 2.8 5.36 3.6 5.75 4.5 6.19 5.2 6.67 5.9 7.18 6.3 7.73
185 0.5 4.65 1.1 4.80 1.9 5.04 2.7 5.36 3.5 5.75 4.3 6.19 5.0 6.67 5.6 7.18 6.0 7.73
190 0.5 4.65 1.1 4.80 1.8 5.04 2.5 5.36 3.3 5.75 4.1 6.19 4.7 6.67 5.3 7.18 5.7 7.73
195 0.4 4.65 1.0 4.80 1.7 5.04 2.4 5.36 3.1 5.75 3.8 6.19 4.5 6.67 5.0 7.18 5.4 7.73200 0.4 4.65 0.9 4.80 1.6 5.04 2.2 5.36 3.0 5.75 3.6 6.19 4.2 6.67 4.7 7.18 5.1 7.73
205 0.4 4.65 0.9 4.80 1.4 5.04 2.1 5.36 2.8 5.75 3.4 6.19 4.0 6.67 4.5 7.18 4.8 7.73
210 0.3 4.65 0.8 4.80 1.3 5.04 2.0 5.36 2.6 5.75 3.2 6.19 3.8 6.67 4.2 7.18 4.5 7.73
215 0.3 4.65 0.7 4.80 1.2 5.04 1.8 5.36 2.4 5.75 3.0 6.19 3.5 6.67 3.9 7.18 4.2 7.73
220 0.3 4.65 0.6 4.80 1.1 5.04 1.7 5.36 2.3 5.75 2.8 6.19 3.3 6.67 3.6 7.18 3.8 7.73
225 0.2 4.65 0.6 4.80 1.0 5.04 1.6 5.36 2.1 5.75 2.6 6.19 3.0 6.67 3.4 7.18 3.5 7.73
230 0.2 4.65 0.5 4.80 0.9 5.04 1.4 5.36 1.9 5.75 2.4 6.19 2.8 6.67 3.1 7.18 3.2 7.73
235 0.1 4.65 0.4 4.80 0.8 5.04 1.3 5.36 1.7 5.75 2.2 6.19 2.6 6.67 2.8 7.18 2.9 7.73
240 0.1 4.65 0.4 4.80 0.7 5.04 1.1 5.36 1.6 5.75 2.0 6.19 2.3 6.67 2.5 7.18 2.6 7.73
245 0.1 4.65 0.3 4.80 0.6 5.04 1.0 5.36 1.4 5.75 1.8 6.19 2.1 6.67 2.3 7.18 2.3 7.73
4 175 0.7 4.65 1.5 4.80 2.4 5.04 3.3 5.36 4.1 5.75 4.9 6.19 5.6 6.67 6.1 7.18
180 0.7 4.65 1.4 4.80 2.3 5.04 3.1 5.36 3.9 5.75 4.7 6.19 5.3 6.67 5.8 7.18

8/10/2019 n We a 2011 Norms Report
http://slidepdf.com/reader/full/n-we-a-2011-norms-report 129/268
N W E A 2 0 1 1 R I T S c a l e N o r m s | 113
Table C.8. Means (M) and Standard Deviations (sd) of Academic Growt h by Starting RIT Score and Starting Inst ruct ional Week forVarious Endi ng Inst ruct ional Weeks - READING, GRADE 7
Ending Instruction al Weeks
Start Prior Grd Focal Grade
Inst. Start 36 4 8 12 16 20 24 28 32 36
Wk RIT M sd M sd M sd M sd M sd M sd M sd M sd M sd M sd
185 0.6 4.65 1.4 4.80 2.2 5.04 3.0 5.36 3.8 5.75 4.5 6.19 5.1 6.67 5.5 7.18
190 0.6 4.65 1.3 4.80 2.1 5.04 2.8 5.36 3.6 5.75 4.3 6.19 4.8 6.67 5.3 7.18
195 0.6 4.65 1.2 4.80 2.0 5.04 2.7 5.36 3.4 5.75 4.1 6.19 4.6 6.67 5.0 7.18
200 0.5 4.65 1.2 4.80 1.9 5.04 2.6 5.36 3.3 5.75 3.9 6.19 4.4 6.67 4.7 7.18
205 0.5 4.65 1.1 4.80 1.8 5.04 2.4 5.36 3.1 5.75 3.7 6.19 4.1 6.67 4.4 7.18
210 0.5 4.65 1.0 4.80 1.7 5.04 2.3 5.36 2.9 5.75 3.4 6.19 3.9 6.67 4.2 7.18
215 0.4 4.65 1.0 4.80 1.5 5.04 2.2 5.36 2.7 5.75 3.2 6.19 3.6 6.67 3.9 7.18
220 0.4 4.65 0.9 4.80 1.4 5.04 2.0 5.36 2.6 5.75 3.0 6.19 3.4 6.67 3.6 7.18
225 0.4 4.65 0.8 4.80 1.3 5.04 1.9 5.36 2.4 5.75 2.8 6.19 3.2 6.67 3.3 7.18
230 0.3 4.65 0.8 4.80 1.2 5.04 1.7 5.36 2.2 5.75 2.6 6.19 2.9 6.67 3.0 7.18
235 0.3 4.65 0.7 4.80 1.1 5.04 1.6 5.36 2.0 5.75 2.4 6.19 2.7 6.67 2.8 7.18
240 0.3 4.65 0.6 4.80 1.0 5.04 1.5 5.36 1.9 5.75 2.2 6.19 2.4 6.67 2.5 7.18
245 0.2 4.65 0.5 4.80 0.9 5.04 1.3 5.36 1.7 5.75 2.0 6.19 2.2 6.67 2.2 7.18
8 180 0.8 4.65 1.6 4.80 2.5 5.04 3.3 5.36 4.0 5.75 4.7 6.19 5.1 6.67
185 0.7 4.65 1.5 4.80 2.4 5.04 3.1 5.36 3.9 5.75 4.5 6.19 4.9 6.67
190 0.7 4.65 1.5 4.80 2.2 5.04 3.0 5.36 3.7 5.75 4.2 6.19 4.7 6.67
195 0.7 4.65 1.4 4.80 2.1 5.04 2.9 5.36 3.5 5.75 4.0 6.19 4.4 6.67
200 0.6 4.65 1.3 4.80 2.0 5.04 2.7 5.36 3.3 5.75 3.8 6.19 4.2 6.67
205 0.6 4.65 1.3 4.80 1.9 5.04 2.6 5.36 3.2 5.75 3.6 6.19 3.9 6.67
210 0.6 4.65 1.2 4.80 1.8 5.04 2.4 5.36 3.0 5.75 3.4 6.19 3.7 6.67
215 0.5 4.65 1.1 4.80 1.7 5.04 2.3 5.36 2.8 5.75 3.2 6.19 3.5 6.67
220 0.5 4.65 1.1 4.80 1.6 5.04 2.2 5.36 2.6 5.75 3.0 6.19 3.2 6.67225 0.5 4.65 1.0 4.80 1.5 5.04 2.0 5.36 2.5 5.75 2.8 6.19 3.0 6.67
230 0.4 4.65 0.9 4.80 1.4 5.04 1.9 5.36 2.3 5.75 2.6 6.19 2.7 6.67
235 0.4 4.65 0.8 4.80 1.3 5.04 1.8 5.36 2.1 5.75 2.4 6.19 2.5 6.67
240 0.4 4.65 0.8 4.80 1.2 5.04 1.6 5.36 2.0 5.75 2.2 6.19 2.2 6.67
245 0.3 4.65 0.7 4.80 1.1 5.04 1.5 5.36 1.8 5.75 2.0 6.19 2.0 6.67
12 180 0.8 4.65 1.7 4.80 2.5 5.04 3.3 5.36 3.9 5.75 4.4 6.19
185 0.8 4.65 1.6 4.80 2.4 5.04 3.1 5.36 3.7 5.75 4.2 6.19
190 0.8 4.65 1.5 4.80 2.3 5.04 3.0 5.36 3.5 5.75 4.0 6.19
195 0.7 4.65 1.5 4.80 2.2 5.04 2.8 5.36 3.4 5.75 3.8 6.19
200 0.7 4.65 1.4 4.80 2.1 5.04 2.7 5.36 3.2 5.75 3.5 6.19
205 0.7 4.65 1.3 4.80 2.0 5.04 2.6 5.36 3.0 5.75 3.3 6.19
210 0.6 4.65 1.3 4.80 1.9 5.04 2.4 5.36 2.9 5.75 3.1 6.19

8/10/2019 n We a 2011 Norms Report
http://slidepdf.com/reader/full/n-we-a-2011-norms-report 130/268
114 | N W E A 2 0 1 1 R I T S c a l e N o r m s
Table C.8. Means (M) and Standard Deviations (sd) of Academic Growt h by Starting RIT Score and Starting Inst ruct ional Week forVarious Endi ng Inst ruct ional Weeks - READING, GRADE 7
Ending Instruction al Weeks
Start Prior Grd Focal Grade
Inst. Start 36 4 8 12 16 20 24 28 32 36
Wk RIT M sd M sd M sd M sd M sd M sd M sd M sd M sd M sd
215 0.6 4.65 1.2 4.80 1.8 5.04 2.3 5.36 2.7 5.75 2.9 6.19
220 0.6 4.65 1.1 4.80 1.7 5.04 2.1 5.36 2.5 5.75 2.7 6.19
225 0.5 4.65 1.1 4.80 1.6 5.04 2.0 5.36 2.3 5.75 2.5 6.19
230 0.5 4.65 1.0 4.80 1.5 5.04 1.9 5.36 2.2 5.75 2.3 6.19
235 0.5 4.65 0.9 4.80 1.4 5.04 1.7 5.36 2.0 5.75 2.1 6.19
240 0.4 4.65 0.9 4.80 1.3 5.04 1.6 5.36 1.8 5.75 1.9 6.19
245 0.4 4.65 0.8 4.80 1.2 5.04 1.5 5.36 1.6 5.75 1.7 6.19
16 180 0.9 4.65 1.7 4.80 2.4 5.04 3.1 5.36 3.5 5.75
185 0.8 4.65 1.6 4.80 2.3 5.04 2.9 5.36 3.4 5.75
190 0.8 4.65 1.5 4.80 2.2 5.04 2.8 5.36 3.2 5.75
195 0.7 4.65 1.5 4.80 2.1 5.04 2.6 5.36 3.0 5.75
200 0.7 4.65 1.4 4.80 2.0 5.04 2.5 5.36 2.9 5.75
205 0.7 4.65 1.3 4.80 1.9 5.04 2.4 5.36 2.7 5.75
210 0.6 4.65 1.3 4.80 1.8 5.04 2.2 5.36 2.5 5.75
215 0.6 4.65 1.2 4.80 1.7 5.04 2.1 5.36 2.3 5.75
220 0.6 4.65 1.1 4.80 1.6 5.04 2.0 5.36 2.2 5.75
225 0.5 4.65 1.1 4.80 1.5 5.04 1.8 5.36 2.0 5.75
230 0.5 4.65 1.0 4.80 1.4 5.04 1.7 5.36 1.8 5.75
235 0.5 4.65 0.9 4.80 1.3 5.04 1.5 5.36 1.6 5.75
240 0.4 4.65 0.8 4.80 1.2 5.04 1.4 5.36 1.5 5.75
245 0.4 4.65 0.8 4.80 1.1 5.04 1.3 5.36 1.3 5.75
20 180 0.8 4.65 1.6 4.80 2.2 5.04 2.7 5.36185 0.8 4.65 1.5 4.80 2.1 5.04 2.6 5.36
190 0.8 4.65 1.4 4.80 2.0 5.04 2.4 5.36
195 0.7 4.65 1.4 4.80 1.9 5.04 2.3 5.36
200 0.7 4.65 1.3 4.80 1.8 5.04 2.1 5.36
205 0.7 4.65 1.2 4.80 1.7 5.04 2.0 5.36
210 0.6 4.65 1.2 4.80 1.6 5.04 1.9 5.36
215 0.6 4.65 1.1 4.80 1.5 5.04 1.7 5.36
220 0.5 4.65 1.0 4.80 1.4 5.04 1.6 5.36
225 0.5 4.65 1.0 4.80 1.3 5.04 1.5 5.36
230 0.5 4.65 0.9 4.80 1.2 5.04 1.3 5.36
235 0.4 4.65 0.8 4.80 1.1 5.04 1.2 5.36
240 0.4 4.65 0.7 4.80 1.0 5.04 1.0 5.36

8/10/2019 n We a 2011 Norms Report
http://slidepdf.com/reader/full/n-we-a-2011-norms-report 131/268
N W E A 2 0 1 1 R I T S c a l e N o r m s | 115
Table C.8. Means (M) and Standard Deviations (sd) of Academic Growt h by Starting RIT Score and Starting Inst ruct ional Week forVarious Endi ng Inst ruct ional Weeks - READING, GRADE 7
Ending Instruction al Weeks
Start Prior Grd Focal Grade
Inst. Start 36 4 8 12 16 20 24 28 32 36
Wk RIT M sd M sd M sd M sd M sd M sd M sd M sd M sd M sd
245 0.4 4.65 0.7 4.80 0.9 5.04 0.9 5.36

8/10/2019 n We a 2011 Norms Report
http://slidepdf.com/reader/full/n-we-a-2011-norms-report 132/268
116 | N W E A 2 0 1 1 R I T S c a l e N o r m s
Table C.9. Means (M) and Standard Deviations (sd) of Academic Growth by Starting RIT Score and Starting Instructi onal Week forVarious Ending Instructional Weeks - READING, GRADE 8
Table C.9. Means (M) and Standard Deviations (sd) of Academic Growt h by Starting RIT Score and Starting Ins truc tional Week forVarious Endi ng Inst ruct ional Weeks - READING, GRADE 8
Ending Instruction al Weeks
Start Prior Grd Focal Grade
Inst. Start 36 4 8 12 16 20 24 28 32 36
Wk RIT M sd M sd M sd M sd M sd M sd M sd M sd M sd M sd
32(Gd 7)
175 0.6 4.66 1.5 4.86 2.4 5.16 3.4 5.57 4.4 6.04 5.4 6.58 6.3 7.16 7.1 7.78 7.7 8.42 8.2 9.09
1800.6 4.66 1.4 4.86 2.2 5.16 3.2 5.57 4.1 6.04 5.1 6.58 6.0 7.16 6.7 7.78 7.3 8.42 7.7 9.09185 0.5 4.66 1.3 4.86 2.1 5.16 3.0 5.57 3.9 6.04 4.8 6.58 5.6 7.16 6.3 7.78 6.9 8.42 7.2 9.09
190 0.5 4.66 1.2 4.86 1.9 5.16 2.8 5.57 3.6 6.04 4.5 6.58 5.3 7.16 5.9 7.78 6.4 8.42 6.7 9.09
195 0.4 4.66 1.1 4.86 1.8 5.16 2.6 5.57 3.4 6.04 4.2 6.58 4.9 7.16 5.5 7.78 6.0 8.42 6.2 9.09
200 0.4 4.66 1.0 4.86 1.6 5.16 2.4 5.57 3.1 6.04 3.9 6.58 4.6 7.16 5.1 7.78 5.5 8.42 5.7 9.09
205 0.3 4.66 0.9 4.86 1.5 5.16 2.2 5.57 2.9 6.04 3.6 6.58 4.2 7.16 4.7 7.78 5.1 8.42 5.2 9.09
210 0.3 4.66 0.8 4.86 1.3 5.16 2.0 5.57 2.7 6.04 3.3 6.58 3.9 7.16 4.3 7.78 4.6 8.42 4.7 9.09
215 0.2 4.66 0.7 4.86 1.2 5.16 1.8 5.57 2.4 6.04 3.0 6.58 3.5 7.16 3.9 7.78 4.2 8.42 4.2 9.09
220 0.2 4.66 0.6 4.86 1.0 5.16 1.6 5.57 2.2 6.04 2.7 6.58 3.2 7.16 3.5 7.78 3.7 8.42 3.7 9.09
225 0.1 4.66 0.5 4.86 0.9 5.16 1.4 5.57 1.9 6.04 2.4 6.58 2.8 7.16 3.1 7.78 3.3 8.42 3.2 9.09
230 0.1 4.66 0.4 4.86 0.7 5.16 1.2 5.57 1.7 6.04 2.1 6.58 2.5 7.16 2.7 7.78 2.8 8.42 2.7 9.09
235 0.1 4.66 0.3 4.86 0.6 5.16 1.0 5.57 1.4 6.04 1.8 6.58 2.1 7.16 2.3 7.78 2.4 8.42 2.2 9.09
240 0.0 4.66 0.2 4.86 0.4 5.16 0.8 5.57 1.2 6.04 1.5 6.58 1.8 7.16 1.9 7.78 1.9 8.42 1.7 9.09
245 -0.1 4.66 0.1 4.86 0.3 5.16 0.6 5.57 0.9 6.04 1.2 6.58 1.4 7.16 1.5 7.78 1.5 8.42 1.2 9.09
250 -0.1 4.66 0.0 4.86 0.1 5.16 0.4 5.57 0.7 6.04 0.9 6.58 1.1 7.16 1.1 7.78 1.0 8.42 0.7 9.09
36(Gd 7)
180 0.8 4.66 1.6 4.86 2.6 5.16 3.5 5.57 4.5 6.04 5.4 6.58 6.1 7.16 6.7 7.78 7.1 8.42
185 0.7 4.66 1.5 4.86 2.4 5.16 3.4 5.57 4.2 6.04 5.1 6.58 5.8 7.16 6.3 7.78 6.6 8.42
190 0.7 4.66 1.4 4.86 2.3 5.16 3.2 5.57 4.0 6.04 4.8 6.58 5.4 7.16 5.9 7.78 6.2 8.42
195 0.6 4.66 1.3 4.86 2.1 5.16 3.0 5.57 3.7 6.04 4.5 6.58 5.1 7.16 5.5 7.78 5.7 8.42200 0.6 4.66 1.2 4.86 2.0 5.16 2.8 5.57 3.5 6.04 4.2 6.58 4.7 7.16 5.1 7.78 5.3 8.42
205 0.5 4.66 1.1 4.86 1.8 5.16 2.6 5.57 3.3 6.04 3.9 6.58 4.4 7.16 4.7 7.78 4.8 8.42
210 0.5 4.66 1.0 4.86 1.7 5.16 2.4 5.57 3.0 6.04 3.6 6.58 4.0 7.16 4.3 7.78 4.4 8.42
215 0.4 4.66 0.9 4.86 1.5 5.16 2.2 5.57 2.8 6.04 3.3 6.58 3.7 7.16 3.9 7.78 4.0 8.42
220 0.4 4.66 0.8 4.86 1.4 5.16 2.0 5.57 2.5 6.04 3.0 6.58 3.3 7.16 3.5 7.78 3.5 8.42
225 0.3 4.66 0.7 4.86 1.2 5.16 1.8 5.57 2.3 6.04 2.7 6.58 3.0 7.16 3.1 7.78 3.1 8.42
230 0.3 4.66 0.6 4.86 1.1 5.16 1.6 5.57 2.0 6.04 2.4 6.58 2.6 7.16 2.7 7.78 2.6 8.42
235 0.2 4.66 0.5 4.86 0.9 5.16 1.4 5.57 1.8 6.04 2.1 6.58 2.3 7.16 2.3 7.78 2.2 8.42
240 0.2 4.66 0.4 4.86 0.8 5.16 1.2 5.57 1.5 6.04 1.8 6.58 1.9 7.16 1.9 7.78 1.7 8.42
245 0.1 4.66 0.3 4.86 0.6 5.16 1.0 5.57 1.3 6.04 1.5 6.58 1.6 7.16 1.5 7.78 1.3 8.42
250 0.1 4.66 0.2 4.86 0.5 5.16 0.8 5.57 1.0 6.04 1.2 6.58 1.3 7.16 1.1 7.78 0.8 8.42
4 180 0.9 4.66 1.8 4.86 2.8 5.16 3.7 5.57 4.6 6.04 5.4 6.58 6.0 7.16 6.3 7.78

8/10/2019 n We a 2011 Norms Report
http://slidepdf.com/reader/full/n-we-a-2011-norms-report 133/268
N W E A 2 0 1 1 R I T S c a l e N o r m s | 117
Table C.9. Means (M) and Standard Deviations (sd) of Academic Growt h by Starting RIT Score and Starting Ins truc tional Week forVarious Endi ng Inst ruct ional Weeks - READING, GRADE 8
Ending Instruction al Weeks
Start Prior Grd Focal Grade
Inst. Start 36 4 8 12 16 20 24 28 32 36
Wk RIT M sd M sd M sd M sd M sd M sd M sd M sd M sd M sd
185 0.8 4.66 1.7 4.86 2.6 5.16 3.5 5.57 4.4 6.04 5.1 6.58 5.6 7.16 5.9 7.78
190 0.8 4.66 1.6 4.86 2.5 5.16 3.3 5.57 4.1 6.04 4.8 6.58 5.3 7.16 5.5 7.78
195 0.7 4.66 1.5 4.86 2.3 5.16 3.1 5.57 3.9 6.04 4.5 6.58 4.9 7.16 5.1 7.78
200 0.7 4.66 1.4 4.86 2.2 5.16 2.9 5.57 3.6 6.04 4.2 6.58 4.6 7.16 4.7 7.78
205 0.6 4.66 1.3 4.86 2.0 5.16 2.7 5.57 3.4 6.04 3.9 6.58 4.2 7.16 4.3 7.78
210 0.6 4.66 1.2 4.86 1.9 5.16 2.5 5.57 3.1 6.04 3.6 6.58 3.9 7.16 3.9 7.78
215 0.5 4.66 1.1 4.86 1.7 5.16 2.3 5.57 2.9 6.04 3.3 6.58 3.5 7.16 3.5 7.78
220 0.5 4.66 1.0 4.86 1.6 5.16 2.1 5.57 2.6 6.04 3.0 6.58 3.2 7.16 3.1 7.78
225 0.4 4.66 0.9 4.86 1.5 5.16 1.9 5.57 2.4 6.04 2.7 6.58 2.8 7.16 2.8 7.78
230 0.4 4.66 0.8 4.86 1.3 5.16 1.7 5.57 2.1 6.04 2.4 6.58 2.5 7.16 2.4 7.78
235 0.3 4.66 0.7 4.86 1.2 5.16 1.6 5.57 1.9 6.04 2.1 6.58 2.1 7.16 2.0 7.78
240 0.3 4.66 0.6 4.86 1.0 5.16 1.4 5.57 1.6 6.04 1.8 6.58 1.8 7.16 1.6 7.78
245 0.2 4.66 0.5 4.86 0.9 5.16 1.2 5.57 1.4 6.04 1.5 6.58 1.4 7.16 1.2 7.78
250 0.2 4.66 0.4 4.86 0.7 5.16 1.0 5.57 1.1 6.04 1.2 6.58 1.1 7.16 0.8 7.78
8 180 1.0 4.66 1.9 4.86 2.9 5.16 3.7 5.57 4.5 6.04 5.1 6.58 5.5 7.16
185 0.9 4.66 1.8 4.86 2.7 5.16 3.5 5.57 4.2 6.04 4.8 6.58 5.1 7.16
190 0.9 4.66 1.7 4.86 2.6 5.16 3.3 5.57 4.0 6.04 4.5 6.58 4.8 7.16
195 0.8 4.66 1.6 4.86 2.4 5.16 3.1 5.57 3.7 6.04 4.2 6.58 4.4 7.16
200 0.8 4.66 1.5 4.86 2.3 5.16 2.9 5.57 3.5 6.04 3.9 6.58 4.1 7.16
205 0.7 4.66 1.4 4.86 2.1 5.16 2.7 5.57 3.2 6.04 3.6 6.58 3.7 7.16
210 0.7 4.66 1.3 4.86 2.0 5.16 2.5 5.57 3.0 6.04 3.3 6.58 3.4 7.16
215 0.6 4.66 1.2 4.86 1.8 5.16 2.3 5.57 2.8 6.04 3.0 6.58 3.0 7.16220 0.6 4.66 1.1 4.86 1.7 5.16 2.1 5.57 2.5 6.04 2.7 6.58 2.7 7.16
225 0.5 4.66 1.0 4.86 1.5 5.16 1.9 5.57 2.3 6.04 2.4 6.58 2.3 7.16
230 0.5 4.66 0.9 4.86 1.4 5.16 1.7 5.57 2.0 6.04 2.1 6.58 2.0 7.16
235 0.4 4.66 0.8 4.86 1.2 5.16 1.5 5.57 1.8 6.04 1.8 6.58 1.6 7.16
240 0.4 4.66 0.7 4.86 1.1 5.16 1.4 5.57 1.5 6.04 1.5 6.58 1.3 7.16
245 0.3 4.66 0.6 4.86 0.9 5.16 1.2 5.57 1.3 6.04 1.2 6.58 0.9 7.16
250 0.3 4.66 0.5 4.86 0.8 5.16 1.0 5.57 1.0 6.04 0.9 6.58 0.6 7.16
12 180 1.0 4.66 1.9 4.86 2.8 5.16 3.5 5.57 4.1 6.04 4.5 6.58
185 0.9 4.66 1.8 4.86 2.6 5.16 3.3 5.57 3.9 6.04 4.2 6.58
190 0.9 4.66 1.7 4.86 2.5 5.16 3.1 5.57 3.6 6.04 3.9 6.58
195 0.8 4.66 1.6 4.86 2.3 5.16 2.9 5.57 3.4 6.04 3.6 6.58
200 0.8 4.66 1.5 4.86 2.2 5.16 2.7 5.57 3.1 6.04 3.3 6.58

8/10/2019 n We a 2011 Norms Report
http://slidepdf.com/reader/full/n-we-a-2011-norms-report 134/268
118 | N W E A 2 0 1 1 R I T S c a l e N o r m s
Table C.9. Means (M) and Standard Deviations (sd) of Academic Growt h by Starting RIT Score and Starting Ins truc tional Week forVarious Endi ng Inst ruct ional Weeks - READING, GRADE 8
Ending Instruction al Weeks
Start Prior Grd Focal Grade
Inst. Start 36 4 8 12 16 20 24 28 32 36
Wk RIT M sd M sd M sd M sd M sd M sd M sd M sd M sd M sd
205 0.7 4.66 1.4 4.86 2.0 5.16 2.6 5.57 2.9 6.04 3.0 6.58
210 0.7 4.66 1.3 4.86 1.9 5.16 2.4 5.57 2.6 6.04 2.7 6.58
215 0.6 4.66 1.2 4.86 1.7 5.16 2.2 5.57 2.4 6.04 2.4 6.58
220 0.6 4.66 1.1 4.86 1.6 5.16 2.0 5.57 2.1 6.04 2.1 6.58
225 0.5 4.66 1.0 4.86 1.4 5.16 1.8 5.57 1.9 6.04 1.8 6.58
230 0.5 4.66 0.9 4.86 1.3 5.16 1.6 5.57 1.6 6.04 1.5 6.58
235 0.4 4.66 0.8 4.86 1.2 5.16 1.4 5.57 1.4 6.04 1.2 6.58
240 0.4 4.66 0.7 4.86 1.0 5.16 1.2 5.57 1.2 6.04 0.9 6.58
245 0.3 4.66 0.6 4.86 0.9 5.16 1.0 5.57 0.9 6.04 0.6 6.58
250 0.3 4.66 0.5 4.86 0.7 5.16 0.8 5.57 0.7 6.04 0.3 6.58
16 180 0.9 4.66 1.8 4.86 2.6 5.16 3.2 5.57 3.5 6.04
185 0.9 4.66 1.7 4.86 2.4 5.16 3.0 5.57 3.3 6.04
190 0.8 4.66 1.6 4.86 2.3 5.16 2.8 5.57 3.0 6.04
195 0.8 4.66 1.5 4.86 2.1 5.16 2.6 5.57 2.8 6.04
200 0.8 4.66 1.4 4.86 2.0 5.16 2.4 5.57 2.5 6.04
205 0.7 4.66 1.3 4.86 1.8 5.16 2.2 5.57 2.3 6.04
210 0.7 4.66 1.2 4.86 1.7 5.16 2.0 5.57 2.0 6.04
215 0.6 4.66 1.1 4.86 1.5 5.16 1.8 5.57 1.8 6.04
220 0.6 4.66 1.0 4.86 1.4 5.16 1.6 5.57 1.6 6.04
225 0.5 4.66 0.9 4.86 1.2 5.16 1.4 5.57 1.3 6.04
230 0.5 4.66 0.8 4.86 1.1 5.16 1.2 5.57 1.1 6.04
235 0.4 4.66 0.7 4.86 0.9 5.16 1.0 5.57 0.8 6.04240 0.4 4.66 0.6 4.86 0.8 5.16 0.8 5.57 0.6 6.04
245 0.3 4.66 0.5 4.86 0.6 5.16 0.6 5.57 0.3 6.04
250 0.3 4.66 0.4 4.86 0.5 5.16 0.4 5.57 0.1 6.04
20 180 0.9 4.66 1.6 4.86 2.2 5.16 2.6 5.57
185 0.8 4.66 1.5 4.86 2.1 5.16 2.4 5.57
190 0.8 4.66 1.4 4.86 1.9 5.16 2.2 5.57
195 0.7 4.66 1.3 4.86 1.8 5.16 2.0 5.57
200 0.7 4.66 1.2 4.86 1.6 5.16 1.8 5.57
205 0.6 4.66 1.1 4.86 1.5 5.16 1.6 5.57
210 0.6 4.66 1.0 4.86 1.3 5.16 1.4 5.57
215 0.5 4.66 0.9 4.86 1.2 5.16 1.2 5.57
220 0.5 4.66 0.8 4.86 1.0 5.16 1.0 5.57

8/10/2019 n We a 2011 Norms Report
http://slidepdf.com/reader/full/n-we-a-2011-norms-report 135/268
N W E A 2 0 1 1 R I T S c a l e N o r m s | 119
Table C.9. Means (M) and Standard Deviations (sd) of Academic Growt h by Starting RIT Score and Starting Ins truc tional Week forVarious Endi ng Inst ruct ional Weeks - READING, GRADE 8
Ending Instruction al Weeks
Start Prior Grd Focal Grade
Inst. Start 36 4 8 12 16 20 24 28 32 36
Wk RIT M sd M sd M sd M sd M sd M sd M sd M sd M sd M sd
225 0.4 4.66 0.7 4.86 0.9 5.16 0.8 5.57
230 0.4 4.66 0.6 4.86 0.7 5.16 0.6 5.57
235 0.3 4.66 0.5 4.86 0.6 5.16 0.4 5.57
240 0.3 4.66 0.4 4.86 0.4 5.16 0.2 5.57
245 0.2 4.66 0.3 4.86 0.3 5.16 0.0 5.57
250 0.2 4.66 0.2 4.86 0.1 5.16-
0.2 5.57
8/10/2019 n We a 2011 Norms Report
http://slidepdf.com/reader/full/n-we-a-2011-norms-report 136/268
120 | N W E A 2 0 1 1 R I T S c a l e N o r m s
Table C.10. Means (M) and Standard Deviations (sd) o f Academic Growth by Starting RIT Score and Starting Instruc tional Week forVarious Ending Instructional Weeks - READING, GRADE 9
Table C.10. Means (M) and Standard Deviations (sd) of Academic Grow th by Starting RIT Score and Starting Inst ruct ional Week for VariousEnding Instructi onal Weeks - READING, GRADE 9
Ending Instruction al Weeks
Start Prior Grd Focal Grade
Inst. Start 36 4 8 12 16 20 24 28 32 36
Wk RIT M sd M sd M sd M sd M sd M sd M sd M sd M sd M sd
32(Gd 8)
180 0.0 4.69 0.2 4.98 0.4 5.42 0.8 5.98 1.2 6.63 1.6 7.35 2.1 8.11 2.7 8.92 3.2 9.75 3.7 10.60
1850.0 4.69 0.1 4.98 0.4 5.42 0.7 5.98 1.1 6.63 1.5 7.35 2.0 8.11 2.5 8.92 3.0 9.75 3.4 10.60190 0.0 4.69 0.1 4.98 0.3 5.42 0.6 5.98 0.9 6.63 1.4 7.35 1.8 8.11 2.3 8.92 2.7 9.75 3.2 10.60
195 0.0 4.69 0.0 4.98 0.2 5.42 0.5 5.98 0.8 6.63 1.2 7.35 1.6 8.11 2.1 8.92 2.5 9.75 3.0 10.60
200 -0.1 4.69 0.0 4.98 0.2 5.42 0.4 5.98 0.7 6.63 1.1 7.35 1.5 8.11 1.9 8.92 2.3 9.75 2.7 10.60
205 -0.1 4.69 -0.1 4.98 0.1 5.42 0.3 5.98 0.6 6.63 0.9 7.35 1.3 8.11 1.7 8.92 2.1 9.75 2.5 10.60
210 -0.1 4.69 -0.1 4.98 0.0 5.42 0.2 5.98 0.5 6.63 0.8 7.35 1.1 8.11 1.5 8.92 1.9 9.75 2.2 10.60
215 -0.1 4.69 -0.2 4.98 -0.1 5.42 0.1 5.98 0.4 6.63 0.6 7.35 1.0 8.11 1.3 8.92 1.7 9.75 2.0 10.60
220 -0.2 4.69 -0.2 4.98 -0.1 5.42 0 .0 5.98 0.2 6.63 0.5 7.35 0.8 8.11 1.1 8.92 1.5 9.75 1.8 10.60
225 -0.2 4.69 -0.3 4.98 -0.2 5.42 -0.1 5.98 0.1 6.63 0.4 7.35 0.6 8.11 0.9 8.92 1.2 9.75 1.5 10.60
230 -0.2 4.69 -0.3 4.98 -0.3 5.42 -0.2 5.98 0.0 6.63 0.2 7.35 0.5 8.11 0.7 8.92 1.0 9.75 1.3 10.60
235 -0.2 4.69 -0.3 4.98 -0.4 5.42 -0.3 5.98 -0.1 6.63 0.1 7.35 0.3 8.11 0.6 8.92 0.8 9.75 1.0 10.60
240 -0.3 4.69 -0.4 4.98 -0.4 5.42 -0.4 5.98 -0.3 6.63 -0.1 7.35 0.1 8.11 0.4 8.92 0.6 9.75 0.8 10.60
245 -0.3 4.69 -0.4 4.98 -0.5 5.42 -0.5 5.98 -0.4 6.63 -0.2 7.35 0.0 8.11 0.2 8.92 0.4 9.75 0.6 10.60
250 -0.3 4.69 -0.5 4.98 -0.6 5.42 -0.6 5.98 -0.5 6.63 -0.4 7.35 -0.2 8.11 0.0 8.92 0.2 9.75 0.3 10.60
255 -0.3 4.69 -0.5 4.98 -0.6 5.42 -0.7 5.98 -0.6 6.63 -0.5 7.35 -0.4 8.11 -0.2 8.92 -0.1 9.75 0.1 10.60
36(Gd 8)
180 0.2 4.69 0.4 4.98 0.7 5.42 1.2 5.98 1.6 6.63 2.1 7.35 2.6 8.11 3.1 8.92 3.6 9.75
185 0.1 4.69 0.4 4.98 0.7 5.42 1.1 5.98 1.5 6.63 2.0 7.35 2.5 8.11 3.0 8.92 3.4 9.75
190 0.1 4.69 0.3 4.98 0.6 5.42 1.0 5.98 1.4 6.63 1.8 7.35 2.3 8.11 2.8 8.92 3.2 9.75
195 0.1 4.69 0.3 4.98 0.5 5.42 0.9 5.98 1.3 6.63 1.7 7.35 2.1 8.11 2.6 8.92 3.0 9.75200 0.1 4.69 0.2 4.98 0.5 5.42 0.8 5.98 1.1 6.63 1.5 7.35 2.0 8.11 2.4 8.92 2.8 9.75
205 0.0 4.69 0.2 4.98 0.4 5.42 0.7 5.98 1.0 6.63 1.4 7.35 1.8 8.11 2.2 8.92 2.6 9.75
210 0.0 4.69 0.1 4.98 0.3 5.42 0.6 5.98 0.9 6.63 1.3 7.35 1.6 8.11 2.0 8.92 2.4 9.75
215 0.0 4.69 0.1 4.98 0.2 5.42 0.5 5.98 0.8 6.63 1.1 7.35 1.5 8.11 1.8 8.92 2.1 9.75
220 0.0 4.69 0.0 4.98 0.2 5.42 0.4 5.98 0.7 6.63 1.0 7.35 1.3 8.11 1.6 8.92 1.9 9.75
225 -0.1 4.69 0.0 4.98 0.1 5.42 0.3 5.98 0.5 6.63 0.8 7.35 1.1 8.11 1.4 8.92 1.7 9.75
230 -0.1 4.69 -0.1 4.98 0.0 5.42 0.2 5.98 0.4 6.63 0.7 7.35 1.0 8.11 1.2 8.92 1.5 9.75
235 -0.1 4.69 -0.1 4.98 -0.1 5.42 0.1 5.98 0.3 6.63 0.5 7.35 0.8 8.11 1.0 8.92 1.3 9.75
240 -0.1 4.69 -0.2 4.98 -0.1 5.42 0.0 5.98 0.2 6.63 0.4 7.35 0.6 8.11 0.8 8.92 1.1 9.75
245 -0.2 4.69 -0.2 4.98 -0.2 5.42 -0.1 5.98 0.1 6.63 0.2 7.35 0.5 8.11 0.7 8.92 0.8 9.75
250 -0.2 4.69 -0.3 4.98 -0.3 5.42 -0.2 5.98 -0.1 6.63 0.1 7.35 0.3 8.11 0.5 8.92 0.6 9.75
255 -0.2 4.69 -0.3 4.98 -0.3 5.42 -0.3 5.98 -0.2 6.63 -0.1 7.35 0.1 8.11 0.3 8.92 0.4 9.75

8/10/2019 n We a 2011 Norms Report
http://slidepdf.com/reader/full/n-we-a-2011-norms-report 137/268
N W E A 2 0 1 1 R I T S c a l e N o r m s | 121
Table C.10. Means (M) and Standard Deviations (sd) of Academic Grow th by Starting RIT Score and Starting Inst ruct ional Week for VariousEnding Instructi onal Weeks - READING, GRADE 9
Ending Instruction al Weeks
Start Prior Grd Focal Grade
Inst. Start 36 4 8 12 16 20 24 28 32 36
Wk RIT M sd M sd M sd M sd M sd M sd M sd M sd M sd M sd
4 180 0.3 4.69 0.6 4.98 1.0 5.42 1.5 5.98 2.0 6.63 2.5 7.35 3.0 8.11 3.5 8.92
185 0.2 4.69 0.5 4.98 0.9 5.42 1.4 5.98 1.8 6.63 2.3 7.35 2.8 8.11 3.3 8.92
190 0.2 4.69 0.5 4.98 0.9 5.42 1.3 5.98 1.7 6.63 2.2 7.35 2.7 8.11 3.1 8.92
195 0.2 4.69 0.5 4.98 0.8 5.42 1.2 5.98 1.6 6.63 2.0 7.35 2.5 8.11 2.9 8.92
200 0.2 4.69 0.4 4.98 0.7 5.42 1.1 5.98 1.5 6.63 1.9 7.35 2.3 8.11 2.7 8.92
205 0.1 4.69 0.4 4.98 0.6 5.42 1.0 5.98 1.4 6.63 1.8 7.35 2.2 8.11 2.5 8.92
210 0.1 4.69 0.3 4.98 0.6 5.42 0.9 5.98 1.2 6.63 1.6 7.35 2.0 8.11 2.3 8.92
215 0.1 4.69 0.3 4.98 0.5 5.42 0.8 5.98 1.1 6.63 1.5 7.35 1.8 8.11 2.2 8.92
220 0.1 4.69 0.2 4.98 0.4 5.42 0.7 5.98 1.0 6.63 1.3 7.35 1.7 8.11 2.0 8.92
225 0.0 4.69 0.2 4.98 0.4 5.42 0.6 5.98 0.9 6.63 1.2 7.35 1.5 8.11 1.8 8.92
230 0.0 4.69 0.1 4.98 0.3 5.42 0.5 5.98 0.8 6.63 1.0 7.35 1.3 8.11 1.6 8.92
235 0.0 4.69 0.1 4.98 0.2 5.42 0.4 5.98 0.6 6.63 0.9 7.35 1.2 8.11 1.4 8.92
240 0.0 4.69 0.0 4.98 0.1 5.42 0.3 5.98 0.5 6.63 0.8 7.35 1.0 8.11 1.2 8.92
245 -0.1 4.69 0 .0 4.98 0.1 5.42 0.2 5.98 0.4 6.63 0.6 7.35 0.8 8.11 1.0 8.92
250 -0.1 4.69 -0.1 4.98 0.0 5.42 0.1 5.98 0.3 6.63 0.5 7.35 0.6 8.11 0.8 8.92
255 -0.1 4.69 -0.1 4.98 -0.1 5.42 0.0 5.98 0.2 6.63 0.3 7.35 0.5 8.11 0.6 8.92
8 180 0.3 4.69 0.8 4.98 1.2 5.42 1.7 5.98 2.2 6.63 2.7 7.35 3.2 8.11
185 0.3 4.69 0.7 4.98 1.1 5.42 1.6 5.98 2.1 6.63 2.6 7.35 3.1 8.11
190 0.3 4.69 0.7 4.98 1.1 5.42 1.5 5.98 2.0 6.63 2.5 7.35 2.9 8.11
195 0.3 4.69 0.6 4.98 1.0 5.42 1.4 5.98 1.9 6.63 2.3 7.35 2.7 8.11
200 0.2 4.69 0.6 4.98 0.9 5.42 1.3 5.98 1.7 6.63 2.2 7.35 2.6 8.11
205 0.2 4.69 0.5 4.98 0.9 5.42 1.2 5.98 1.6 6.63 2.0 7.35 2.4 8.11210 0.2 4.69 0.5 4.98 0.8 5.42 1.1 5.98 1.5 6.63 1.9 7.35 2.2 8.11
215 0.2 4.69 0.4 4.98 0.7 5.42 1.0 5.98 1.4 6.63 1.7 7.35 2.1 8.11
220 0.2 4.69 0.4 4.98 0.6 5.42 0.9 5.98 1.3 6.63 1.6 7.35 1.9 8.11
225 0.1 4.69 0.3 4.98 0.6 5.42 0.8 5.98 1.1 6.63 1.4 7.35 1.7 8.11
230 0.1 4.69 0.3 4.98 0.5 5.42 0.8 5.98 1.0 6.63 1.3 7.35 1.6 8.11
235 0.1 4.69 0.2 4.98 0.4 5.42 0.7 5.98 0.9 6.63 1.2 7.35 1.4 8.11
240 0.1 4.69 0.2 4.98 0.4 5.42 0.6 5.98 0.8 6.63 1.0 7.35 1.2 8.11
245 0.0 4.69 0.1 4.98 0.3 5.42 0.5 5.98 0.7 6.63 0.9 7.35 1.1 8.11
250 0.0 4.69 0.1 4.98 0.2 5.42 0.4 5.98 0.5 6.63 0.7 7.35 0.9 8.11
255 0.0 4.69 0.0 4.98 0.1 5.42 0.3 5.98 0.4 6.63 0.6 7.35 0.7 8.11
12 180 0.4 4.69 0.9 4.98 1.4 5.42 1.9 5.98 2.4 6.63 2.9 7.35
185 0.4 4.69 0.8 4.98 1.3 5.42 1.8 5.98 2.3 6.63 2.8 7.35

8/10/2019 n We a 2011 Norms Report
http://slidepdf.com/reader/full/n-we-a-2011-norms-report 138/268
122 | N W E A 2 0 1 1 R I T S c a l e N o r m s
Table C.10. Means (M) and Standard Deviations (sd) of Academic Grow th by Starting RIT Score and Starting Inst ruct ional Week for VariousEnding Instructi onal Weeks - READING, GRADE 9
Ending Instruction al Weeks
Start Prior Grd Focal Grade
Inst. Start 36 4 8 12 16 20 24 28 32 36
Wk RIT M sd M sd M sd M sd M sd M sd M sd M sd M sd M sd
190 0.4 4.69 0.8 4.98 1.2 5.42 1.7 5.98 2.2 6.63 2.6 7.35
195 0.3 4.69 0.7 4.98 1.2 5.42 1.6 5.98 2.0 6.63 2.5 7.35
200 0.3 4.69 0.7 4.98 1.1 5.42 1.5 5.98 1.9 6.63 2.3 7.35
205 0.3 4.69 0.6 4.98 1.0 5.42 1.4 5.98 1.8 6.63 2.2 7.35
210 0.3 4.69 0.6 4.98 0.9 5.42 1.3 5.98 1.7 6.63 2.0 7.35
215 0.2 4.69 0.5 4.98 0.9 5.42 1.2 5.98 1.6 6.63 1.9 7.35
220 0.2 4.69 0.5 4.98 0.8 5.42 1.1 5.98 1.4 6.63 1.8 7.35
225 0.2 4.69 0.4 4.98 0.7 5.42 1.0 5.98 1.3 6.63 1.6 7.35
230 0.2 4.69 0.4 4.98 0.7 5.42 0.9 5.98 1.2 6.63 1.5 7.35
235 0.1 4.69 0.3 4.98 0.6 5.42 0.8 5.98 1.1 6.63 1.3 7.35
240 0.1 4.69 0.3 4.98 0.5 5.42 0.7 5.98 1.0 6.63 1.2 7.35
245 0.1 4.69 0.3 4.98 0.4 5.42 0.6 5.98 0.8 6.63 1.0 7.35
250 0.1 4.69 0.2 4.98 0.4 5.42 0.5 5.98 0.7 6.63 0.9 7.35
255 0.1 4.69 0.2 4.98 0.3 5.42 0.4 5.98 0.6 6.63 0.8 7.35
16 180 0.5 4.69 1.0 4.98 1.5 5.42 2.0 5.98 2.5 6.63
185 0.4 4.69 0.9 4.98 1.4 5.42 1.9 5.98 2.4 6.63
190 0.4 4.69 0.9 4.98 1.3 5.42 1.8 5.98 2.3 6.63
195 0.4 4.69 0.8 4.98 1.3 5.42 1.7 5.98 2.1 6.63
200 0.4 4.69 0.8 4.98 1.2 5.42 1.6 5.98 2.0 6.63
205 0.3 4.69 0.7 4.98 1.1 5.42 1.5 5.98 1.9 6.63
210 0.3 4.69 0.7 4.98 1.0 5.42 1.4 5.98 1.8 6.63
215 0.3 4.69 0.6 4.98 1.0 5.42 1.3 5.98 1.7 6.63220 0.3 4.69 0.6 4.98 0.9 5.42 1.2 5.98 1.5 6.63
225 0.2 4.69 0.5 4.98 0.8 5.42 1.1 5.98 1.4 6.63
230 0.2 4.69 0.5 4.98 0.8 5.42 1.0 5.98 1.3 6.63
235 0.2 4.69 0.4 4.98 0.7 5.42 0.9 5.98 1.2 6.63
240 0.2 4.69 0.4 4.98 0.6 5.42 0.8 5.98 1.1 6.63
245 0.2 4.69 0.3 4.98 0.5 5.42 0.7 5.98 0.9 6.63
250 0.1 4.69 0.3 4.98 0.5 5.42 0.7 5.98 0.8 6.63
255 0.1 4.69 0.2 4.98 0.4 5.42 0.6 5.98 0.7 6.63
20 180 0.5 4.69 1.0 4.98 1.5 5.42 2.0 5.98
185 0.5 4.69 1.0 4.98 1.5 5.42 1.9 5.98
190 0.5 4.69 0.9 4.98 1.4 5.42 1.8 5.98
195 0.4 4.69 0.9 4.98 1.3 5.42 1.7 5.98

8/10/2019 n We a 2011 Norms Report
http://slidepdf.com/reader/full/n-we-a-2011-norms-report 139/268
N W E A 2 0 1 1 R I T S c a l e N o r m s | 123
Table C.10. Means (M) and Standard Deviations (sd) of Academic Grow th by Starting RIT Score and Starting Inst ruct ional Week for VariousEnding Instructi onal Weeks - READING, GRADE 9
Ending Instruction al Weeks
Start Prior Grd Focal Grade
Inst. Start 36 4 8 12 16 20 24 28 32 36
Wk RIT M sd M sd M sd M sd M sd M sd M sd M sd M sd M sd
200 0.4 4.69 0.8 4.98 1.2 5.42 1.7 5.98
205 0.4 4.69 0.8 4.98 1.2 5.42 1.6 5.98
210 0.4 4.69 0.7 4.98 1.1 5.42 1.5 5.98
215 0.3 4.69 0.7 4.98 1.0 5.42 1.4 5.98
220 0.3 4.69 0.6 4.98 1.0 5.42 1.3 5.98
225 0.3 4.69 0.6 4.98 0.9 5.42 1.2 5.98
230 0.3 4.69 0.5 4.98 0.8 5.42 1.1 5.98
235 0.2 4.69 0.5 4.98 0.7 5.42 1.0 5.98
240 0.2 4.69 0.4 4.98 0.7 5.42 0.9 5.98
245 0.2 4.69 0.4 4.98 0.6 5.42 0.8 5.98
250 0.2 4.69 0.3 4.98 0.5 5.42 0.7 5.98
255 0.1 4.69 0.3 4.98 0.5 5.42 0.6 5.98

8/10/2019 n We a 2011 Norms Report
http://slidepdf.com/reader/full/n-we-a-2011-norms-report 140/268
124 | N W E A 2 0 1 1 R I T S c a l e N o r m s
Table C.11. Means (M) and Standard Deviations (sd) o f Academic Growth by Starting RIT Score and Starting Instru ctional Week forVarious Ending Instructional Weeks - READING, GRADE 10
Table C.11. Means (M) and Standard Deviations (sd ) of Academic Growth by Starting RIT Score and Starting Instr ucti onal Week for Various Endi ngInstructi onal Weeks - READING, GRADE 10
Ending Instruction al Weeks
Start Prior Grd Focal Grade
Inst. Start 36 4 8 12 16 20 24 28 32 36
Wk RIT M sd M sd M sd M sd M sd M sd M sd M sd M sd M sd
32(Gd 9)
180 0.3 4.75 0.6 5.20 0.9 5.87 1.2 6.69 1.6 7.63 1.9 8.63 2.3 9.68 2.7 10.77 3.2 11.88 3.7 13.01
1850.3 4.75 0.6 5.20 0.8 5.87 1.1 6.69 1.4 7.63 1.7 8.63 2.1 9.68 2.5 10.77 2.9 11.88 3.4 13.01190 0.3 4.75 0.5 5.20 0.7 5.87 1.0 6.69 1.3 7.63 1.6 8.63 1.9 9.68 2.3 10.77 2.7 11.88 3.1 13.01
195 0.2 4.75 0.4 5.20 0.7 5.87 0.9 6.69 1.1 7.63 1.4 8.63 1.7 9.68 2.0 10.77 2.4 11.88 2.8 13.01
200 0.2 4.75 0.4 5.20 0.6 5.87 0.8 6.69 1.0 7.63 1.2 8.63 1.5 9.68 1.8 10.77 2.1 11.88 2.5 13.01
205 0.2 4.75 0.3 5.20 0.5 5.87 0.6 6.69 0.8 7.63 1.0 8.63 1.3 9.68 1.5 10.77 1.8 11.88 2.2 13.01
210 0.1 4.75 0.3 5.20 0.4 5.87 0.5 6.69 0.7 7.63 0.8 8.63 1.1 9.68 1.3 10.77 1.6 11.88 1.9 13.01
215 0.1 4.75 0.2 5.20 0.3 5.87 0.4 6.69 0.5 7.63 0.7 8.63 0.8 9.68 1.0 10.77 1.3 11.88 1.6 13.01
220 0.1 4.75 0.1 5.20 0.2 5.87 0.3 6.69 0.4 7.63 0.5 8.63 0.6 9.68 0.8 10.77 1.0 11.88 1.3 13.01
225 0.0 4.75 0.1 5.20 0.1 5.87 0.2 6.69 0.2 7.63 0.3 8.63 0.4 9.68 0.6 10.77 0.8 11.88 1.0 13.01
230 0.0 4.75 0.0 5.20 0.0 5.87 0.0 6.69 0.1 7.63 0.1 8.63 0.2 9.68 0.3 10.77 0.5 11.88 0.7 13.01
235 0.0 4.75 -0.1 5.20 -0.1 5.87 -0.1 6.69 -0.1 7.63 -0.1 8.63 0.0 9.68 0.1 10.77 0.2 11.88 0.4 13.01
240 -0.1 4.75 -0.1 5.20 -0.2 5.87 -0.2 6.69 -0.2 7.63 -0.2 8.63 -0.2 9.68 -0.2 10.77 -0.1 11.88 0.1 13.01
245 -0.1 4.75 -0.2 5.20 -0.3 5.87 -0.3 6.69 -0.4 7.63 -0.4 8.63 -0.4 9.68 -0.4 10.77 -0.3 11.88 -0.2 13.01
250 -0.1 4.75 -0.2 5.20 -0.3 5.87 -0.5 6.69 -0.5 7.63 -0.6 8.63 -0.6 9.68 -0.6 10.77 -0.6 11.88 -0.5 13.01
255 -0.1 4.75 -0.3 5.20 -0.4 5.87 -0.6 6.69 -0.7 7.63 -0.8 8.63 -0.9 9.68 -0.9 10.77 -0.9 11.88 -0.8 13.01
260 -0.2 4.75 -0.4 5.20 -0.5 5.87 -0.7 6.69 -0.8 7.63 -1.0 8.63 -1.1 9.68 -1.1 10.77 -1.1 11.88 -1.1 13.01
36(Gd 9)
180 0.3 4.75 0.6 5.20 0.9 5.87 1.3 6.69 1.6 7.63 2.0 8.63 2.4 9.68 2.9 10.77 3.4 11.88
185 0.3 4.75 0.6 5.20 0.8 5.87 1.1 6.69 1.5 7.63 1.8 8.63 2.2 9.68 2.6 10.77 3.1 11.88
190 0.2 4.75 0.5 5.20 0.8 5.87 1.0 6.69 1.3 7.63 1.6 8.63 2.0 9.68 2.4 10.77 2.9 11.88195 0.2 4.75 0.4 5.20 0.7 5.87 0.9 6.69 1.2 7.63 1.5 8.63 1.8 9.68 2.2 10.77 2.6 11.88
200 0.2 4.75 0.4 5.20 0.6 5.87 0.8 6.69 1.0 7.63 1.3 8.63 1.6 9.68 1.9 10.77 2.3 11.88
205 0.2 4.75 0.3 5.20 0.5 5.87 0.7 6.69 0.9 7.63 1.1 8.63 1.4 9.68 1.7 10.77 2.0 11.88
210 0.1 4.75 0.3 5.20 0.4 5.87 0.5 6.69 0.7 7.63 0.9 8.63 1.2 9.68 1.4 10.77 1.8 11.88
215 0.1 4.75 0.2 5.20 0.3 5.87 0.4 6.69 0.6 7.63 0.7 8.63 1.0 9.68 1.2 10.77 1.5 11.88
220 0.1 4.75 0.1 5.20 0.2 5.87 0.3 6.69 0.4 7.63 0.6 8.63 0.7 9.68 1.0 10.77 1.2 11.88
225 0.0 4.75 0.1 5.20 0.1 5.87 0.2 6.69 0.3 7.63 0.4 8.63 0.5 9.68 0.7 10.77 1.0 11.88
230 0.0 4.75 0.0 5.20 0.0 5.87 0.1 6.69 0.1 7.63 0.2 8.63 0.3 9.68 0.5 10.77 0.7 11.88
235 0.0 4.75 -0.1 5.20 -0.1 5.87 -0.1 6.69 0.0 7.63 0.0 8.63 0.1 9.68 0.2 10.77 0.4 11.88
240 -0.1 4.75 -0.1 5.20 -0.2 5.87 -0.2 6.69 -0.2 7.63 -0.2 8.63 -0.1 9.68 0.0 10.77 0.2 11.88
245 -0.1 4.75 -0.2 5.20 -0.2 5.87 -0.3 6.69 -0.3 7.63 -0.3 8.63 -0.3 9.68 -0.2 10.77 -0.1 11.88
250 -0.1 4.75 -0.2 5.20 -0.3 5.87 -0.4 6.69 -0.5 7.63 -0.5 8.63 -0.5 9.68 -0.5 10.77 -0.4 11.88

8/10/2019 n We a 2011 Norms Report
http://slidepdf.com/reader/full/n-we-a-2011-norms-report 141/268
N W E A 2 0 1 1 R I T S c a l e N o r m s | 125
Table C.11. Means (M) and Standard Deviations (sd ) of Academic Growth by Starting RIT Score and Starting Instr ucti onal Week for Various Endi ngInstructi onal Weeks - READING, GRADE 10
Ending Instruction al Weeks
Start Prior Grd Focal Grade
Inst. Start 36 4 8 12 16 20 24 28 32 36
Wk RIT M sd M sd M sd M sd M sd M sd M sd M sd M sd M sd
255 -0.2 4.75 -0.3 5.20 -0.4 5.87 -0.5 6.69 -0.6 7.63 -0.7 8.63 -0.7 9.68 -0.7 10.77 -0.7 11.88
260 -0.2 4.75 -0.4 5.20 -0.5 5.87 -0.7 6.69 -0.8 7.63 -0.9 8.63 -1.0 9.68 -1.0 10.77 -0.9 11.88
4 180 0.3 4.75 0.6 5.20 1.0 5.87 1.3 6.69 1.7 7.63 2.1 8.63 2.6 9.68 3.1 10.77
1850.3 4.75 0.6 5.20 0.9 5.87 1.2 6.69 1.5 7.63 1.9 8.63 2.4 9.68 2.9 10.77190 0.3 4.75 0.5 5.20 0.8 5.87 1.1 6.69 1.4 7.63 1.8 8.63 2.2 9.68 2.6 10.77
195 0.2 4.75 0.4 5.20 0.7 5.87 1.0 6.69 1.2 7.63 1.6 8.63 2.0 9.68 2.4 10.77
200 0.2 4.75 0.4 5.20 0.6 5.87 0.8 6.69 1.1 7.63 1.4 8.63 1.7 9.68 2.1 10.77
205 0.2 4.75 0.3 5.20 0.5 5.87 0.7 6.69 0.9 7.63 1.2 8.63 1.5 9.68 1.9 10.77
210 0.1 4.75 0.3 5.20 0.4 5.87 0.6 6.69 0.8 7.63 1.0 8.63 1.3 9.68 1.6 10.77
215 0.1 4.75 0.2 5.20 0.3 5.87 0.5 6.69 0.6 7.63 0.9 8.63 1.1 9.68 1.4 10.77
220 0.1 4.75 0.1 5.20 0.2 5.87 0.4 6.69 0.5 7.63 0.7 8.63 0.9 9.68 1.2 10.77
225 0.0 4.75 0.1 5.20 0.1 5.87 0.2 6.69 0.3 7.63 0.5 8.63 0.7 9.68 0.9 10.77
230 0.0 4.75 0.0 5.20 0.1 5.87 0.1 6.69 0.2 7.63 0.3 8.63 0.5 9.68 0.7 10.77
235 0.0 4.75 0.0 5.20 0.0 5.87 0.0 6.69 0.0 7.63 0.1 8.63 0.3 9.68 0.4 10.77
240 -0.1 4.75 -0.1 5.20 -0.1 5.87 -0.1 6.69 -0.1 7.63 -0.1 8.63 0.1 9.68 0.2 10.77
245 -0.1 4.75 -0.2 5.20 -0.2 5.87 -0.3 6.69 -0.3 7.63 -0.2 8.63 -0.2 9.68 0.0 10.77
250 -0.1 4.75 -0.2 5.20 -0.3 5.87 -0.4 6.69 -0.4 7.63 -0.4 8.63 -0.4 9.68 -0.3 10.77
255 -0.1 4.75 -0.3 5.20 -0.4 5.87 -0.5 6.69 -0.6 7.63 -0.6 8.63 -0.6 9.68 -0.5 10.77
260 -0.2 4.75 -0.3 5.20 -0.5 5.87 -0.6 6.69 -0.7 7.63 -0.8 8.63 -0.8 9.68 -0.8 10.77
8 180 0.3 4.75 0.7 5.20 1.0 5.87 1.4 6.69 1.8 7.63 2.3 8.63 2.8 9.68
185 0.3 4.75 0.6 5.20 0.9 5.87 1.3 6.69 1.7 7.63 2.1 8.63 2.6 9.68
190 0.3 4.75 0.5 5.20 0.8 5.87 1.2 6.69 1.5 7.63 1.9 8.63 2.4 9.68195 0.2 4.75 0.5 5.20 0.7 5.87 1.0 6.69 1.4 7.63 1.7 8.63 2.2 9.68
200 0.2 4.75 0.4 5.20 0.6 5.87 0.9 6.69 1.2 7.63 1.6 8.63 1.9 9.68
205 0.2 4.75 0.4 5.20 0.6 5.87 0.8 6.69 1.1 7.63 1.4 8.63 1.7 9.68
210 0.1 4.75 0.3 5.20 0.5 5.87 0.7 6.69 0.9 7.63 1.2 8.63 1.5 9.68
215 0.1 4.75 0.2 5.20 0.4 5.87 0.6 6.69 0.8 7.63 1.0 8.63 1.3 9.68
220 0.1 4.75 0.2 5.20 0.3 5.87 0.4 6.69 0.6 7.63 0.8 8.63 1.1 9.68
225 0.1 4.75 0.1 5.20 0.2 5.87 0.3 6.69 0.5 7.63 0.7 8.63 0.9 9.68
230 0.0 4.75 0.1 5.20 0.1 5.87 0.2 6.69 0.3 7.63 0.5 8.63 0.7 9.68
235 0.0 4.75 0.0 5.20 0.0 5.87 0.1 6.69 0.2 7.63 0.3 8.63 0.5 9.68
240 0.0 4.75 -0.1 5.20 -0.1 5.87 -0.1 6.69 0.0 7.63 0.1 8.63 0.3 9.68
245 -0.1 4.75 -0.1 5.20 -0.2 5.87 -0.2 6.69 -0.2 7.63 -0.1 8.63 0.1 9.68
250 -0.1 4.75 -0.2 5.20 -0.3 5.87 -0.3 6.69 -0.3 7.63 -0.3 8.63 -0.2 9.68

8/10/2019 n We a 2011 Norms Report
http://slidepdf.com/reader/full/n-we-a-2011-norms-report 142/268
126 | N W E A 2 0 1 1 R I T S c a l e N o r m s
Table C.11. Means (M) and Standard Deviations (sd ) of Academic Growth by Starting RIT Score and Starting Instr ucti onal Week for Various Endi ngInstructi onal Weeks - READING, GRADE 10
Ending Instruction al Weeks
Start Prior Grd Focal Grade
Inst. Start 36 4 8 12 16 20 24 28 32 36
Wk RIT M sd M sd M sd M sd M sd M sd M sd M sd M sd M sd
255 -0.1 4.75 -0.3 5.20 -0.4 5.87 -0.4 6.69 -0.5 7.63 -0.4 8.63 -0.4 9.68
260 -0.2 4.75 -0.3 5.20 -0.4 5.87 -0.5 6.69 -0.6 7.63 -0.6 8.63 -0.6 9.68
12 180 0.3 4.75 0.7 5.20 1.1 5.87 1.5 6.69 2.0 7.63 2.5 8.63
1850.3 4.75 0.6 5.20 1.0 5.87 1.4 6.69 1.8 7.63 2.3 8.63190 0.3 4.75 0.6 5.20 0.9 5.87 1.3 6.69 1.7 7 .63 2.1 8.63
195 0.2 4.75 0.5 5.20 0.8 5.87 1.1 6.69 1.5 7 .63 1.9 8.63
200 0.2 4.75 0.5 5.20 0.7 5.87 1.0 6.69 1.4 7.63 1.7 8.63
205 0.2 4.75 0.4 5.20 0.6 5.87 0.9 6.69 1.2 7.63 1.6 8.63
210 0.2 4.75 0.3 5.20 0.5 5.87 0.8 6.69 1.1 7 .63 1.4 8.63
215 0.1 4.75 0.3 5.20 0.4 5.87 0.7 6.69 0.9 7 .63 1.2 8.63
220 0.1 4.75 0.2 5.20 0.4 5.87 0.5 6.69 0.8 7.63 1.0 8.63
225 0.1 4.75 0.2 5.20 0.3 5.87 0.4 6.69 0.6 7.63 0.8 8.63
230 0.0 4.75 0.1 5.20 0.2 5.87 0.3 6.69 0.5 7 .63 0.7 8.63
235 0.0 4.75 0.0 5.20 0.1 5.87 0.2 6.69 0.3 7 .63 0.5 8.63
240 0.0 4.75 0.0 5.20 0.0 5.87 0.1 6.69 0.2 7.63 0.3 8.63
245 -0.1 4.75 -0.1 5.20 -0.1 5.87 -0.1 6.69 0.0 7.63 0.1 8.63
250 -0.1 4.75 -0.2 5.20 -0.2 5.87 -0.2 6.69 -0.2 7.63 -0.1 8.63
255 -0.1 4.75 -0.2 5.20 -0.3 5.87 -0.3 6.69 -0.3 7.63 -0.2 8.63
260 -0.2 4.75 -0.3 5.20 -0.4 5.87 -0.4 6.69 -0.5 7.63 -0.4 8.63
16 180 0.4 4.75 0.7 5.20 1.2 5.87 1.6 6.69 2.1 7.63
185 0.3 4.75 0.7 5.20 1.1 5.87 1.5 6.69 2.0 7.63
190 0.3 4.75 0.6 5.20 1.0 5.87 1.4 6.69 1.8 7.63195 0.3 4.75 0.6 5.20 0.9 5.87 1.3 6.69 1.7 7.63
200 0.2 4.75 0.5 5.20 0.8 5.87 1.1 6.69 1.5 7.63
205 0.2 4.75 0.4 5.20 0.7 5.87 1.0 6.69 1.4 7.63
210 0.2 4.75 0.4 5.20 0.6 5.87 0.9 6.69 1.2 7.63
215 0.1 4.75 0.3 5.20 0.5 5.87 0.8 6.69 1.1 7.63
220 0.1 4.75 0.3 5.20 0.4 5.87 0.7 6.69 0.9 7.63
225 0.1 4.75 0.2 5.20 0.4 5.87 0.5 6.69 0.8 7.63
230 0.1 4.75 0.1 5.20 0.3 5.87 0.4 6.69 0.6 7.63
235 0.0 4.75 0.1 5.20 0.2 5.87 0.3 6.69 0.5 7.63
240 0.0 4.75 0.0 5.20 0.1 5.87 0.2 6.69 0.3 7.63
245 0.0 4.75 0.0 5.20 0.0 5.87 0.1 6.69 0.2 7.63
250 -0.1 4.75 -0.1 5.20 -0.1 5.87 -0.1 6.69 0.0 7.63
8/10/2019 n We a 2011 Norms Report
http://slidepdf.com/reader/full/n-we-a-2011-norms-report 143/268
N W E A 2 0 1 1 R I T S c a l e N o r m s | 127
Table C.11. Means (M) and Standard Deviations (sd ) of Academic Growth by Starting RIT Score and Starting Instr ucti onal Week for Various Endi ngInstructi onal Weeks - READING, GRADE 10
Ending Instruction al Weeks
Start Prior Grd Focal Grade
Inst. Start 36 4 8 12 16 20 24 28 32 36
Wk RIT M sd M sd M sd M sd M sd M sd M sd M sd M sd M sd
255 -0.1 4.75 -0.2 5.20 -0.2 5.87 -0.2 6.69 -0.1 7.63
260 -0.1 4.75 -0.2 5.20 -0.3 5.87 -0.3 6.69 -0.3 7.63
20 180 0.4 4.75 0.8 5.20 1.3 5.87 1.8 6.69
1850.4 4.75 0.7 5.20 1.2 5.87 1.7 6.69190 0.3 4.75 0.7 5.20 1.1 5.87 1.5 6.69
195 0.3 4.75 0.6 5.20 1.0 5.87 1.4 6.69
200 0.3 4.75 0.6 5.20 0.9 5.87 1.3 6.69
205 0.2 4.75 0.5 5.20 0.8 5.87 1.2 6.69
210 0.2 4.75 0.4 5.20 0.7 5.87 1.1 6.69
215 0.2 4.75 0.4 5.20 0.6 5.87 0.9 6.69
220 0.1 4.75 0.3 5.20 0.5 5.87 0.8 6.69
225 0.1 4.75 0.3 5.20 0.5 5.87 0.7 6.69
230 0.1 4.75 0.2 5.20 0.4 5.87 0.6 6.69
235 0.1 4.75 0.1 5.20 0.3 5.87 0.5 6.69
240 0.0 4.75 0.1 5.20 0.2 5.87 0.3 6.69
245 0.0 4.75 0.0 5.20 0.1 5.87 0.2 6.69
250 0.0 4.75 0.0 5.20 0.0 5.87 0.1 6.69
255 -0.1 4.75 -0.1 5.20 -0.1 5.87 0.0 6.69
260 -0.1 4.75 -0.2 5.20 -0.2 5.87 -0.2 6.69

8/10/2019 n We a 2011 Norms Report
http://slidepdf.com/reader/full/n-we-a-2011-norms-report 144/268
128 | N W E A 2 0 1 1 R I T S c a l e N o r m s
Table C.12. Means (M) and Standard Deviations (sd) o f Academic Growth by Starting RIT Score and Starting Instru ctional Week forVarious Ending Instructional Weeks - LANGUAGE USAGE, GRADE 2
Table C.12. Means (M) and Standard Deviations (sd) of Academic Grow th by Starting RIT Score and Starting Inst ruct ional Week for VariousEnding Instru ctional Weeks - LANGUAGE USAGE, GRADE 2
Ending Instruction al Weeks
Start Prior Grd Focal Grade
Inst. Start 36 4 8 12 16 20 24 28 32 36
Wk RIT M sd M sd M sd M sd M sd M sd M sd M sd M sd M sd
4 135 4.4 4.35 8.5 4.67 12.1 5.15 15.3 5.75 18.1 6.45 20.6 7.21 22.7 8.01 24.4 8.85
1404.3 4.35 8.2 4.67 11.7 5.15 14.7 5.75 17.4 6.45 19.7 7.21 21.7 8.01 23.3 8.85145 4.2 4.35 7.9 4.67 11.3 5.15 14.2 5.75 16.8 6.45 18.9 7.21 20.8 8.01 22.3 8.85
150 4.0 4.35 7.7 4.67 10.9 5.15 13.7 5.75 16.1 6.45 18.1 7.21 19.8 8.01 21.2 8.85
155 3.9 4.35 7.4 4.67 10.5 5.15 13.1 5.75 15.4 6.45 17.3 7.21 18.9 8.01 20.1 8.85
160 3.8 4.35 7.1 4.67 10.0 5.15 12.6 5.75 14.7 6.45 16.5 7.21 17.9 8.01 19.0 8.85
165 3.6 4.35 6.8 4.67 9.6 5.15 12.0 5.75 14.1 6.45 15.7 7.21 17.0 8.01 17.9 8.85
170 3.5 4.35 6.6 4.67 9.2 5.15 11.5 5.75 13.4 6.45 14.9 7.21 16.0 8.01 16.9 8.85
175 3.4 4.35 6.3 4.67 8.8 5.15 11.0 5.75 12.7 6.45 14.1 7.21 15.1 8.01 15.8 8.85
180 3.2 4.35 6.0 4.67 8.4 5.15 10.4 5.75 12.0 6.45 13.3 7.21 14.2 8.01 14.7 8.85
185 3.1 4.35 5.8 4.67 8.0 5.15 9.9 5.75 11.4 6.45 12.5 7.21 13.2 8.01 13.6 8.85
190 3.0 4.35 5.5 4.67 7.6 5.15 9.3 5.75 10.7 6.45 11.6 7.21 12.3 8.01 12.5 8.85
195 2.8 4.35 5.2 4.67 7.2 5.15 8.8 5.75 10.0 6.45 10.8 7.21 11.3 8.01 11.5 8.85
200 2.7 4.35 5.0 4.67 6.8 5.15 8.3 5.75 9.3 6.45 10.0 7.21 10.4 8.01 10.4 8.85
205 2.6 4.35 4.7 4.67 6.4 5.15 7.7 5.75 8.7 6.45 9.2 7.21 9.4 8.01 9.3 8.85
210 2.4 4.35 4.4 4.67 6.0 5.15 7.2 5.75 8.0 6.45 8.4 7.21 8.5 8.01 8.2 8.85
215 2.3 4.35 4.1 4.67 5.6 5.15 6.6 5.75 7.3 6.45 7.6 7.21 7.5 8.01 7.1 8.85
8 140 3.9 4.35 7.4 4.67 10.4 5.15 13.1 5.75 15.4 6.45 17.4 7.21 19.0 8.01
145 3.8 4.35 7.1 4.67 10.0 5.15 12.6 5.75 14.8 6.45 16.6 7.21 18.1 8.01
150 3.6 4.35 6.8 4.67 9.6 5.15 12.0 5.75 14.1 6.45 15.8 7.21 17.1 8.01155 3.5 4.35 6.5 4.67 9.2 5.15 11.5 5.75 13.4 6.45 15.0 7.21 16.2 8.01
160 3.3 4.35 6.3 4.67 8.8 5.15 11.0 5.75 12.7 6.45 14.2 7.21 15.2 8.01
165 3.2 4.35 6.0 4.67 8.4 5.15 10.4 5.75 12.1 6.45 13.4 7.21 14.3 8.01
170 3.1 4.35 5.7 4.67 8.0 5.15 9.9 5.75 11.4 6.45 12.5 7.21 13.4 8.01
175 2.9 4.35 5.5 4.67 7.6 5.15 9.3 5.75 10.7 6.45 11.7 7.21 12.4 8.01
180 2.8 4.35 5.2 4.67 7.2 5.15 8.8 5.75 10.0 6.45 10.9 7.21 11.5 8.01
185 2.7 4.35 4.9 4.67 6.8 5.15 8.3 5.75 9.4 6.45 10.1 7.21 10.5 8.01
190 2.5 4.35 4.7 4.67 6.4 5.15 7.7 5.75 8.7 6.45 9.3 7.21 9.6 8.01
195 2.4 4.35 4.4 4.67 6.0 5.15 7.2 5.75 8.0 6.45 8.5 7.21 8.6 8.01
200 2.3 4.35 4.1 4.67 5.6 5.15 6.6 5.75 7.3 6.45 7.7 7.21 7.7 8.01
205 2.1 4.35 3.8 4.67 5.2 5.15 6.1 5.75 6.7 6.45 6.9 7.21 6.7 8.01
210 2.0 4.35 3.6 4.67 4.8 5.15 5.6 5.75 6.0 6.45 6.1 7.21 5.8 8.01
8/10/2019 n We a 2011 Norms Report
http://slidepdf.com/reader/full/n-we-a-2011-norms-report 145/268
N W E A 2 0 1 1 R I T S c a l e N o r m s | 129
Table C.12. Means (M) and Standard Deviations (sd) of Academic Grow th by Starting RIT Score and Starting Inst ruct ional Week for VariousEnding Instru ctional Weeks - LANGUAGE USAGE, GRADE 2
Ending Instruction al Weeks
Start Prior Grd Focal Grade
Inst. Start 36 4 8 12 16 20 24 28 32 36
Wk RIT M sd M sd M sd M sd M sd M sd M sd M sd M sd M sd
215 1.9 4.35 3.3 4.67 4.4 5.15 5.0 5.75 5.3 6.45 5.3 7.21 4.9 8.01
220 1.7 4.35 3.0 4.67 4.0 5.15 4.5 5.75 4.6 6.45 4.4 7.21 3.9 8.01
12 140 3.5 4.35 6.5 4.67 9.2 5.15 11.6 5.75 13.5 6.45 15.1 7.21
1453.3 4.35 6.3 4.67 8.8 5.15 11.0 5.75 12.8 6.45 14.3 7.21150 3.2 4.35 6.0 4.67 8.4 5.15 10.5 5.75 12.2 6.45 13.5 7.21
155 3.1 4.35 5.7 4.67 8.0 5.15 9.9 5.75 11.5 6.45 12.7 7.21
160 2.9 4.35 5.5 4.67 7.6 5.15 9.4 5.75 10.8 6.45 11.9 7.21
165 2.8 4.35 5.2 4.67 7.2 5.15 8.9 5.75 10.1 6.45 11.1 7.21
170 2.7 4.35 4.9 4.67 6.8 5.15 8.3 5.75 9.5 6.45 10.3 7.21
175 2.5 4.35 4.7 4.67 6.4 5.15 7.8 5.75 8.8 6.45 9.5 7.21
180 2.4 4.35 4.4 4.67 6.0 5.15 7.2 5.75 8.1 6.45 8.7 7.21
185 2.3 4.35 4.1 4.67 5.6 5.15 6.7 5.75 7.4 6.45 7.9 7.21
190 2.1 4.35 3.8 4.67 5.2 5.15 6.2 5.75 6.8 6.45 7.0 7.21
195 2.0 4.35 3.6 4.67 4.8 5.15 5.6 5.75 6.1 6.45 6.2 7.21
200 1.9 4.35 3.3 4.67 4.4 5.15 5.1 5.75 5.4 6.45 5.4 7.21
205 1.7 4.35 3.0 4.67 4.0 5.15 4.5 5.75 4.7 6.45 4.6 7.21
210 1.6 4.35 2.8 4.67 3.6 5.15 4.0 5.75 4.1 6.45 3.8 7.21
215 1.5 4.35 2.5 4.67 3.2 5.15 3.5 5.75 3.4 6.45 3.0 7.21
220 1.3 4.35 2.2 4.67 2.8 5.15 2.9 5.75 2.7 6.45 2.2 7.21
16 145 2.9 4.35 5.5 4.67 7.7 5.15 9.5 5.75 11.0 6.45
150 2.8 4.35 5.2 4.67 7.3 5.15 9.0 5.75 10.3 6.45
155 2.7 4.35 5.0 4.67 6.9 5.15 8.4 5.75 9.6 6.45160 2.5 4.35 4.7 4.67 6.5 5.15 7.9 5.75 9.0 6.45
165 2.4 4.35 4.4 4.67 6.1 5.15 7.4 5.75 8.3 6.45
170 2.3 4.35 4.1 4.67 5.7 5.15 6.8 5.75 7.6 6.45
175 2.1 4.35 3.9 4.67 5.3 5.15 6.3 5.75 6.9 6.45
180 2.0 4.35 3.6 4.67 4.8 5.15 5.7 5.75 6.3 6.45
185 1.9 4.35 3.3 4.67 4.4 5.15 5.2 5.75 5.6 6.45
190 1.7 4.35 3.1 4.67 4.0 5.15 4.7 5.75 4.9 6.45
195 1.6 4.35 2.8 4.67 3.6 5.15 4.1 5.75 4.3 6.45
200 1.5 4.35 2.5 4.67 3.2 5.15 3.6 5.75 3.6 6.45
205 1.3 4.35 2.3 4.67 2.8 5.15 3.0 5.75 2.9 6.45
210 1.2 4.35 2.0 4.67 2.4 5.15 2.5 5.75 2.2 6.45
215 1.1 4.35 1.7 4.67 2.0 5.15 2.0 5.75 1.6 6.45

8/10/2019 n We a 2011 Norms Report
http://slidepdf.com/reader/full/n-we-a-2011-norms-report 146/268
130 | N W E A 2 0 1 1 R I T S c a l e N o r m s
Table C.12. Means (M) and Standard Deviations (sd) of Academic Grow th by Starting RIT Score and Starting Inst ruct ional Week for VariousEnding Instru ctional Weeks - LANGUAGE USAGE, GRADE 2
Ending Instruction al Weeks
Start Prior Grd Focal Grade
Inst. Start 36 4 8 12 16 20 24 28 32 36
Wk RIT M sd M sd M sd M sd M sd M sd M sd M sd M sd M sd
220 0.9 4.35 1.4 4.67 1.6 5.15 1.4 5.75 0.9 6.45
20 145 2.6 4.35 4.7 4.67 6.6 5.15 8.1 5.75
150 2.4 4.35 4.5 4.67 6.2 5.15 7.5 5.75
1552.3 4.35 4.2 4.67 5.8 5.15 7.0 5.75160 2.2 4.35 3.9 4.67 5.4 5.15 6.4 5.75
165 2.0 4.35 3.7 4.67 5.0 5.15 5.9 5.75
170 1.9 4.35 3.4 4.67 4.5 5.15 5.4 5.75
175 1.7 4.35 3.1 4.67 4.1 5.15 4.8 5.75
180 1.6 4.35 2.9 4.67 3.7 5.15 4.3 5.75
185 1.5 4.35 2.6 4.67 3.3 5.15 3.7 5.75
190 1.3 4.35 2.3 4.67 2.9 5.15 3.2 5.75
195 1.2 4.35 2.0 4.67 2.5 5.15 2.7 5.75
200 1.1 4.35 1.8 4.67 2.1 5.15 2.1 5.75
205 0.9 4.35 1.5 4.67 1.7 5.15 1.6 5.75
210 0.8 4.35 1.2 4.67 1.3 5.15 1.0 5.75
215 0.7 4.35 1.0 4.67 0.9 5.15 0.5 5.75
220 0.5 4.35 0.7 4.67 0.5 5.15 0.0 5.75

8/10/2019 n We a 2011 Norms Report
http://slidepdf.com/reader/full/n-we-a-2011-norms-report 147/268
N W E A 2 0 1 1 R I T S c a l e N o r m s | 131
Table C.13. Means (M) and Standard Deviations (sd) o f Academic Growth by Starting RIT Score and Starting Instru ctional Week forVarious Ending Instructional Weeks - LANGUAGE USAGE, GRADE 3
Table C.13. Means (M) and Standard Deviations (sd ) of Academic Growth by Starting RIT Score and Starting Instructi onal Week for VariousEnding Instructi onal Weeks - LANGUAGE USAGE, GRADE 3
Ending Instruction al Weeks
Start Prior Grd Focal Grade
Inst. Start 36 4 8 12 16 20 24 28 32 36
Wk RIT M sd M sd M sd M sd M sd M sd M sd M sd M sd M sd
32(Gd 2)
145 1.8 4.31 3.9 4.52 6.3 4.84 8.8 5.27 11.3 5.76 13.7 6.31 16.0 6.91 18.0 7.54 19.7 8.20 20.9 8.88
1501.7 4.31 3.8 4.52 6.0 4.84 8.4 5.27 10.8 5.76 13.1 6.31 15.3 6.91 17.2 7.54 18.8 8.20 19.9 8.88155 1.6 4.31 3.6 4.52 5.7 4.84 8.0 5.27 10.3 5.76 12.6 6.31 14.7 6.91 16.5 7.54 18.0 8.20 19.0 8.88
160 1.5 4.31 3.4 4.52 5.4 4.84 7.6 5.27 9.8 5.76 12.0 6.31 14.0 6.91 15.7 7.54 17.1 8.20 18.0 8.88
165 1.4 4.31 3.2 4.52 5.2 4.84 7.2 5.27 9.4 5.76 11.4 6.31 13.3 6.91 15.0 7.54 16.2 8.20 17.1 8.88
170 1.3 4.31 3.0 4.52 4.9 4.84 6.9 5.27 8.9 5.76 10.9 6.31 12.7 6.91 14.2 7.54 15.4 8.20 16.1 8.88
175 1.2 4.31 2.8 4.52 4.6 4.84 6.5 5.27 8.4 5.76 10.3 6.31 12.0 6.91 13.4 7.54 14.5 8.20 15.2 8.88
180 1.2 4.31 2.6 4.52 4.3 4.84 6.1 5.27 7.9 5.76 9.7 6.31 11.3 6.91 12.7 7.54 13.7 8.20 14.2 8.88
185 1.1 4.31 2.4 4.52 4.0 4.84 5.7 5.27 7.5 5.76 9.1 6.31 10.6 6.91 11.9 7.54 12.8 8.20 13.3 8.88
190 1.0 4.31 2.2 4.52 3.7 4.84 5.3 5.27 7.0 5.76 8.6 6.31 10.0 6.91 11.1 7.54 12.0 8.20 12.3 8.88
195 0.9 4.31 2.0 4.52 3.4 4.84 5.0 5.27 6.5 5.76 8.0 6.31 9.3 6.91 10.4 7.54 11.1 8.20 11.4 8.88
200 0.8 4.31 1.9 4.52 3.2 4.84 4.6 5.27 6.0 5.76 7.4 6.31 8.6 6.91 9.6 7.54 10.2 8.20 10.4 8.88
205 0.7 4.31 1.7 4.52 2.9 4.84 4.2 5.27 5.6 5.76 6.8 6.31 8.0 6.91 8.9 7.54 9.4 8.20 9.5 8.88
210 0.6 4.31 1.5 4.52 2.6 4.84 3.8 5.27 5.1 5.76 6.3 6.31 7.3 6.91 8.1 7.54 8.5 8.20 8.5 8.88
215 0.5 4.31 1.3 4.52 2.3 4.84 3.4 5.27 4.6 5.76 5.7 6.31 6.6 6.91 7.3 7.54 7.7 8.20 7.6 8.88
220 0.4 4.31 1.1 4.52 2.0 4.84 3.1 5.27 4.1 5.76 5.1 6.31 6.0 6.91 6.6 7.54 6.8 8.20 6.6 8.88
225 0.3 4.31 0.9 4.52 1.7 4.84 2.7 5.27 3.6 5.76 4.6 6.31 5.3 6.91 5.8 7.54 6.0 8.20 5.6 8.88
36(Gd 2)
150 2.0 4.31 4.3 4.52 6.7 4.84 9.1 5.27 11.4 5.76 13.6 6.31 15.5 6.91 17.1 7.54 18.2 8.20
155 1.9 4.31 4.1 4.52 6.4 4.84 8.7 5.27 10.9 5.76 13.0 6.31 14.9 6.91 16.3 7.54 17.4 8.20
160 1.8 4.31 3.9 4.52 6.1 4.84 8.3 5.27 10.5 5.76 12.5 6.31 14.2 6.91 15.6 7.54 16.5 8.20165 1.8 4.31 3.7 4.52 5.8 4.84 7.9 5.27 10.0 5.76 11.9 6.31 13.5 6.91 14.8 7.54 15.7 8.20
170 1.7 4.31 3.5 4.52 5.5 4.84 7.6 5.27 9.5 5.76 11.3 6.31 12.9 6.91 14.1 7.54 14.8 8.20
175 1.6 4.31 3.3 4.52 5.2 4.84 7.2 5.27 9.0 5.76 10.7 6.31 12.2 6.91 13.3 7.54 13.9 8.20
180 1.5 4.31 3.1 4.52 5.0 4.84 6.8 5.27 8.6 5.76 10.2 6.31 11.5 6.91 12.5 7.54 13.1 8.20
185 1.4 4.31 3.0 4.52 4.7 4.84 6.4 5.27 8.1 5.76 9.6 6.31 10.9 6.91 11.8 7.54 12.2 8.20
190 1.3 4.31 2.8 4.52 4.4 4.84 6.0 5.27 7.6 5.76 9.0 6.31 10.2 6.91 11.0 7.54 11.4 8.20
195 1.2 4.31 2.6 4.52 4.1 4.84 5.6 5.27 7.1 5.76 8.5 6.31 9.5 6.91 10.2 7.54 10.5 8.20
200 1.1 4.31 2.4 4.52 3.8 4.84 5.3 5.27 6.7 5.76 7.9 6.31 8.9 6.91 9.5 7.54 9.6 8.20
205 1.0 4.31 2.2 4.52 3.5 4.84 4.9 5.27 6.2 5.76 7.3 6.31 8.2 6.91 8.7 7.54 8.8 8.20
210 0.9 4.31 2.0 4.52 3.2 4.84 4.5 5.27 5.7 5.76 6.7 6.31 7.5 6.91 7.9 7.54 7.9 8.20
215 0.8 4.31 1.8 4.52 3.0 4.84 4.1 5.27 5.2 5.76 6.2 6.31 6.9 6.91 7.2 7.54 7.1 8.20
220 0.7 4.31 1.6 4.52 2.7 4.84 3.7 5.27 4.7 5.76 5.6 6.31 6.2 6.91 6.4 7.54 6.2 8.20

8/10/2019 n We a 2011 Norms Report
http://slidepdf.com/reader/full/n-we-a-2011-norms-report 148/268
132 | N W E A 2 0 1 1 R I T S c a l e N o r m s
Table C.13. Means (M) and Standard Deviations (sd ) of Academic Growth by Starting RIT Score and Starting Instructi onal Week for VariousEnding Instructi onal Weeks - LANGUAGE USAGE, GRADE 3
Ending Instruction al Weeks
Start Prior Grd Focal Grade
Inst. Start 36 4 8 12 16 20 24 28 32 36
Wk RIT M sd M sd M sd M sd M sd M sd M sd M sd M sd M sd
225 0.6 4.31 1.4 4.52 2.4 4.84 3.4 5.27 4.3 5.76 5.0 6.31 5.5 6.91 5.7 7.54 5.4 8.20
4 150 2.3 4.31 4.6 4.52 7.0 4.84 9.4 5.27 11.6 5.76 13.5 6.31 15.1 6.91 16.2 7.54
155 2.2 4.31 4.4 4.52 6.8 4.84 9.0 5.27 11.1 5.76 12.9 6.31 14.4 6.91 15.4 7.54
1602.1 4.31 4.3 4.52 6.5 4.84 8.6 5.27 10.6 5.76 12.3 6.31 13.7 6.91 14.7 7.54165 2.0 4.31 4.1 4.52 6.2 4.84 8.2 5.27 10.1 5.76 11.8 6.31 13.1 6.91 13.9 7.54
170 1.9 4.31 3.9 4.52 5.9 4.84 7.9 5.27 9.7 5.76 11.2 6.31 12.4 6.91 13.1 7.54
175 1.8 4.31 3.7 4.52 5.6 4.84 7.5 5.27 9.2 5.76 10.6 6.31 11.7 6.91 12.4 7.54
180 1.7 4.31 3.5 4.52 5.3 4.84 7.1 5.27 8.7 5.76 10.1 6.31 11.1 6.91 11.6 7.54
185 1.6 4.31 3.3 4.52 5.0 4.84 6.7 5.27 8.2 5.76 9.5 6.31 10.4 6.91 10.9 7.54
190 1.5 4.31 3.1 4.52 4.8 4.84 6.3 5.27 7.8 5.76 8.9 6.31 9.7 6.91 10.1 7.54
195 1.4 4.31 2.9 4.52 4.5 4.84 6.0 5.27 7.3 5.76 8.3 6.31 9.1 6.91 9.3 7.54
200 1.3 4.31 2.7 4.52 4.2 4.84 5.6 5.27 6.8 5.76 7.8 6.31 8.4 6.91 8.6 7.54
205 1.2 4.31 2.5 4.52 3.9 4.84 5.2 5.27 6.3 5.76 7.2 6.31 7.7 6.91 7.8 7.54
210 1.1 4.31 2.3 4.52 3.6 4.84 4.8 5.27 5.8 5.76 6.6 6.31 7.1 6.91 7.0 7.54
215 1.0 4.31 2.2 4.52 3.3 4.84 4.4 5.27 5.4 5.76 6.1 6.31 6.4 6.91 6.3 7.54
220 0.9 4.31 2.0 4.52 3.0 4.84 4.0 5.27 4.9 5.76 5.5 6.31 5.7 6.91 5.5 7.54
225 0.8 4.31 1.8 4.52 2.8 4.84 3.7 5.27 4.4 5.76 4.9 6.31 5.1 6.91 4.8 7.54
8 155 2.3 4.31 4.6 4.52 6.8 4.84 8.9 5.27 10.8 5.76 12.2 6.31 13.3 6.91
160 2.2 4.31 4.4 4.52 6.6 4.84 8.6 5.27 10.3 5.76 11.7 6.31 12.6 6.91
165 2.1 4.31 4.2 4.52 6.3 4.84 8.2 5.27 9.8 5.76 11.1 6.31 11.9 6.91
170 2.0 4.31 4.0 4.52 6.0 4.84 7.8 5.27 9.3 5.76 10.5 6.31 11.3 6.91
175 1.9 4.31 3.8 4.52 5.7 4.84 7.4 5.27 8.9 5.76 10.0 6.31 10.6 6.91180 1.8 4.31 3.6 4.52 5.4 4.84 7.0 5.27 8.4 5.76 9.4 6.31 9.9 6.91
185 1.7 4.31 3.5 4.52 5.1 4.84 6.6 5.27 7.9 5.76 8.8 6.31 9.3 6.91
190 1.6 4.31 3.3 4.52 4.8 4.84 6.3 5.27 7.4 5.76 8.2 6.31 8.6 6.91
195 1.5 4.31 3.1 4.52 4.6 4.84 5.9 5.27 6.9 5.76 7.7 6.31 7.9 6.91
200 1.4 4.31 2.9 4.52 4.3 4.84 5.5 5.27 6.5 5.76 7.1 6.31 7.3 6.91
205 1.3 4.31 2.7 4.52 4.0 4.84 5.1 5.27 6.0 5.76 6.5 6.31 6.6 6.91
210 1.2 4.31 2.5 4.52 3.7 4.84 4.7 5.27 5.5 5.76 5.9 6.31 5.9 6.91
215 1.1 4.31 2.3 4.52 3.4 4.84 4.4 5.27 5.0 5.76 5.4 6.31 5.3 6.91
220 1.0 4.31 2.1 4.52 3.1 4.84 4.0 5.27 4.6 5.76 4.8 6.31 4.6 6.91
225 1.0 4.31 1.9 4.52 2.8 4.84 3.6 5.27 4.1 5.76 4.2 6.31 3.9 6.91
12 155 2.3 4.31 4.6 4.52 6.7 4.84 8.5 5.27 10.0 5.76 11.0 6.31
160 2.2 4.31 4.4 4.52 6.4 4.84 8.1 5.27 9.5 5.76 10.4 6.31

8/10/2019 n We a 2011 Norms Report
http://slidepdf.com/reader/full/n-we-a-2011-norms-report 149/268
N W E A 2 0 1 1 R I T S c a l e N o r m s | 133
Table C.13. Means (M) and Standard Deviations (sd ) of Academic Growth by Starting RIT Score and Starting Instructi onal Week for VariousEnding Instructi onal Weeks - LANGUAGE USAGE, GRADE 3
Ending Instruction al Weeks
Start Prior Grd Focal Grade
Inst. Start 36 4 8 12 16 20 24 28 32 36
Wk RIT M sd M sd M sd M sd M sd M sd M sd M sd M sd M sd
165 2.1 4.31 4.2 4.52 6.1 4.84 7.7 5.27 9.0 5.76 9.8 6.31
170 2.0 4.31 4.0 4.52 5.8 4.84 7.3 5.27 8.5 5.76 9.3 6.31
175 1.9 4.31 3.8 4.52 5.5 4.84 7.0 5.27 8.1 5.76 8.7 6.31
180 1.8 4.31 3.6 4.52 5.2 4.84 6.6 5.27 7.6 5.76 8.1 6.31
185 1.7 4.31 3.4 4.52 4.9 4.84 6.2 5.27 7.1 5.76 7.6 6.31
190 1.7 4.31 3.2 4.52 4.6 4.84 5.8 5.27 6.6 5.76 7.0 6.31
195 1.6 4.31 3.0 4.52 4.4 4.84 5.4 5.27 6.1 5.76 6.4 6.31
200 1.5 4.31 2.8 4.52 4.1 4.84 5.0 5.27 5.7 5.76 5.8 6.31
205 1.4 4.31 2.7 4.52 3.8 4.84 4.7 5.27 5.2 5.76 5.3 6.31
210 1.3 4.31 2.5 4.52 3.5 4.84 4.3 5.27 4.7 5.76 4.7 6.31
215 1.2 4.31 2.3 4.52 3.2 4.84 3.9 5.27 4.2 5.76 4.1 6.31
220 1.1 4.31 2.1 4.52 2.9 4.84 3.5 5.27 3.8 5.76 3.6 6.31
225 1.0 4.31 1.9 4.52 2.6 4.84 3.1 5.27 3.3 5.76 3.0 6.31
16 155 2.3 4.31 4.3 4.52 6.2 4.84 7.6 5.27 8.7 5.76
160 2.2 4.31 4.1 4.52 5.9 4.84 7.3 5.27 8.2 5.76
165 2.1 4.31 4.0 4.52 5.6 4.84 6.9 5.27 7.7 5.76
170 2.0 4.31 3.8 4.52 5.3 4.84 6.5 5.27 7.2 5.76
175 1.9 4.31 3.6 4.52 5.0 4.84 6.1 5.27 6.8 5.76
180 1.8 4.31 3.4 4.52 4.7 4.84 5.7 5.27 6.3 5.76
185 1.7 4.31 3.2 4.52 4.5 4.84 5.4 5.27 5.8 5.76
190 1.6 4.31 3.0 4.52 4.2 4.84 5.0 5.27 5.3 5.76
195 1.5 4.31 2.8 4.52 3.9 4.84 4.6 5.27 4.9 5.76200 1.4 4.31 2.6 4.52 3.6 4.84 4.2 5.27 4.4 5.76
205 1.3 4.31 2.4 4.52 3.3 4.84 3.8 5.27 3.9 5.76
210 1.2 4.31 2.2 4.52 3.0 4.84 3.5 5.27 3.4 5.76
215 1.1 4.31 2.0 4.52 2.7 4.84 3.1 5.27 3.0 5.76
220 1.0 4.31 1.9 4.52 2.4 4.84 2.7 5.27 2.5 5.76
225 0.9 4.31 1.7 4.52 2.2 4.84 2.3 5.27 2.0 5.76
20 160 2.0 4.31 3.7 4.52 5.1 4.84 6.0 5.27
165 1.9 4.31 3.5 4.52 4.8 4.84 5.7 5.27
170 1.8 4.31 3.3 4.52 4.5 4.84 5.3 5.27
175 1.7 4.31 3.2 4.52 4.3 4.84 4.9 5.27
180 1.6 4.31 3.0 4.52 4.0 4.84 4.5 5.27
185 1.5 4.31 2.8 4.52 3.7 4.84 4.1 5.27

8/10/2019 n We a 2011 Norms Report
http://slidepdf.com/reader/full/n-we-a-2011-norms-report 150/268
134 | N W E A 2 0 1 1 R I T S c a l e N o r m s
Table C.13. Means (M) and Standard Deviations (sd ) of Academic Growth by Starting RIT Score and Starting Instructi onal Week for VariousEnding Instructi onal Weeks - LANGUAGE USAGE, GRADE 3
Ending Instruction al Weeks
Start Prior Grd Focal Grade
Inst. Start 36 4 8 12 16 20 24 28 32 36
Wk RIT M sd M sd M sd M sd M sd M sd M sd M sd M sd M sd
190 1.4 4.31 2.6 4.52 3.4 4.84 3.8 5.27
195 1.3 4.31 2.4 4.52 3.1 4.84 3.4 5.27
200 1.2 4.31 2.2 4.52 2.8 4.84 3.0 5.27
205 1.1 4.31 2.0 4.52 2.5 4.84 2.6 5.27
210 1.0 4.31 1.8 4.52 2.3 4.84 2.2 5.27
215 0.9 4.31 1.6 4.52 2.0 4.84 1.9 5.27
220 0.9 4.31 1.4 4.52 1.7 4.84 1.5 5.27
225 0.8 4.31 1.3 4.52 1.4 4.84 1.1 5.27

8/10/2019 n We a 2011 Norms Report
http://slidepdf.com/reader/full/n-we-a-2011-norms-report 151/268
N W E A 2 0 1 1 R I T S c a l e N o r m s | 135
Table C.14. Means (M) and Standard Deviations (sd) o f Academic Growth by Starting RIT Score and Starting Instru ctional Week forVarious Ending Instructional Weeks - LANGUAGE USAGE, GRADE 4
Table C.14. Means (M) and Standard Deviations (sd) of Academic Grow th by Starting RIT Score and Starting Inst ruct ional Week forVarious End ing Ins truc tional Weeks - LANGUAGE USAGE, GRADE 4
Ending Instruction al Weeks
Start Prior Grd Focal Grade
Inst. Start 36 4 8 12 16 20 24 28 32 36
Wk RIT M sd M sd M sd M sd M sd M sd M sd M sd M sd M sd
32(Gd 3)
160 1.1 4.30 2.5 4.46 4.0 4.71 5.6 5.04 7.3 5.44 8.9 5.90 10.5 6.39 11.9 6.91 13.1 7.46 14.1 8.04
1651.1 4.30 2.4 4.46 3.8 4.71 5.3 5.04 6.9 5.44 8.5 5.90 9.9 6.39 11.3 6.91 12.5 7.46 13.4 8.04170 1.0 4.30 2.2 4.46 3.6 4.71 5.0 5.04 6.5 5.44 8.0 5.90 9.4 6.39 10.7 6.91 11.8 7.46 12.6 8.04
175 0.9 4.30 2.1 4.46 3.4 4.71 4.7 5.04 6.2 5.44 7.6 5.90 8.9 6.39 10.1 6.91 11.1 7.46 11.9 8.04
180 0.9 4.30 1.9 4.46 3.1 4.71 4.5 5.04 5.8 5.44 7.1 5.90 8.4 6.39 9.5 6.91 10.5 7.46 11.2 8.04
185 0.8 4.30 1.8 4.46 2.9 4.71 4.2 5.04 5.4 5.44 6.7 5.90 7.9 6.39 9.0 6.91 9.8 7.46 10.4 8.04
190 0.7 4.30 1.6 4.46 2.7 4.71 3.9 5.04 5.1 5.44 6.3 5.90 7.4 6.39 8.4 6.91 9.2 7.46 9.7 8.04
195 0.6 4.30 1.5 4.46 2.5 4.71 3.6 5.04 4.7 5.44 5.8 5.90 6.9 6.39 7.8 6.91 8.5 7.46 9.0 8.04
200 0.6 4.30 1.3 4.46 2.3 4.71 3.3 5.04 4.3 5.44 5.4 5.90 6.4 6.39 7.2 6.91 7.8 7.46 8.2 8.04
205 0.5 4.30 1.2 4.46 2.0 4.71 3.0 5.04 4.0 5.44 4.9 5.90 5.8 6.39 6.6 6.91 7.2 7.46 7.5 8.04
210 0.4 4.30 1.0 4.46 1.8 4.71 2.7 5.04 3.6 5.44 4.5 5.90 5.3 6.39 6.0 6.91 6.5 7.46 6.8 8.04
215 0.3 4.30 0.9 4.46 1.6 4.71 2.4 5.04 3.2 5.44 4.1 5.90 4.8 6.39 5.4 6.91 5.9 7.46 6.1 8.04
220 0.3 4.30 0.7 4.46 1.4 4.71 2.1 5.04 2.9 5.44 3.6 5.90 4.3 6.39 4.9 6.91 5.2 7.46 5.3 8.04
225 0.2 4.30 0.6 4.46 1.2 4.71 1.8 5.04 2.5 5.44 3.2 5.90 3.8 6.39 4.3 6.91 4.6 7.46 4.6 8.04
230 0.1 4.30 0.5 4.46 0.9 4.71 1.5 5.04 2.1 5.44 2.8 5.90 3.3 6.39 3.7 6.91 3.9 7.46 3.9 8.04
36(Gd 3)
160 1.4 4.30 2.9 4.46 4.5 4.71 6.1 5.04 7.8 5.44 9.3 5.90 10.7 6.39 12.0 6.91 13.0 7.46
165 1.3 4.30 2.7 4.46 4.3 4.71 5.8 5.04 7.4 5.44 8.9 5.90 10.2 6.39 11.4 6.91 12.3 7.46
170 1.2 4.30 2.6 4.46 4.0 4.71 5.5 5.04 7.0 5.44 8.4 5.90 9.7 6.39 10.8 6.91 11.6 7.46
175 1.1 4.30 2.4 4.46 3.8 4.71 5.2 5.04 6.7 5.44 8.0 5.90 9.2 6.39 10.2 6.91 11.0 7.46
180 1.1 4.30 2.3 4.46 3.6 4.71 5.0 5.04 6.3 5.44 7.6 5.90 8.7 6.39 9.6 6.91 10.3 7.46185 1.0 4.30 2.1 4.46 3.4 4.71 4.7 5.04 5.9 5.44 7.1 5.90 8.2 6.39 9.0 6.91 9.7 7.46
190 0.9 4.30 2.0 4.46 3.2 4.71 4.4 5.04 5.6 5.44 6.7 5.90 7.7 6.39 8.5 6.91 9.0 7.46
195 0.8 4.30 1.8 4.46 2.9 4.71 4.1 5.04 5.2 5.44 6.2 5.90 7.2 6.39 7.9 6.91 8.3 7.46
200 0.8 4.30 1.7 4.46 2.7 4.71 3.8 5.04 4.8 5.44 5.8 5.90 6.6 6.39 7.3 6.91 7.7 7.46
205 0.7 4.30 1.6 4.46 2.5 4.71 3.5 5.04 4.5 5.44 5.4 5.90 6.1 6.39 6.7 6.91 7.0 7.46
210 0.6 4.30 1.4 4.46 2.3 4.71 3.2 5.04 4.1 5.44 4.9 5.90 5.6 6.39 6.1 6.91 6.4 7.46
215 0.6 4.30 1.3 4.46 2.1 4.71 2.9 5.04 3.7 5.44 4.5 5.90 5.1 6.39 5.5 6.91 5.7 7.46
220 0.5 4.30 1.1 4.46 1.8 4.71 2.6 5.04 3.4 5.44 4.0 5.90 4.6 6.39 4.9 6.91 5.1 7.46
225 0.4 4.30 1.0 4.46 1.6 4.71 2.3 5.04 3.0 5.44 3.6 5.90 4.1 6.39 4.4 6.91 4.4 7.46
230 0.3 4.30 0.8 4.46 1.4 4.71 2.0 5.04 2.6 5.44 3.2 5.90 3.6 6.39 3.8 6.91 3.7 7.46
4 160 1.5 4.30 3.1 4.46 4.8 4.71 6.4 5.04 8.0 5.44 9.4 5.90 10.6 6.39 11.6 6.91
165 1.4 4.30 3.0 4.46 4.6 4.71 6.1 5.04 7.6 5.44 8.9 5.90 10.1 6.39 11.0 6.91

8/10/2019 n We a 2011 Norms Report
http://slidepdf.com/reader/full/n-we-a-2011-norms-report 152/268
136 | N W E A 2 0 1 1 R I T S c a l e N o r m s
Table C.14. Means (M) and Standard Deviations (sd) of Academic Grow th by Starting RIT Score and Starting Inst ruct ional Week forVarious End ing Ins truc tional Weeks - LANGUAGE USAGE, GRADE 4
Ending Instruction al Weeks
Start Prior Grd Focal Grade
Inst. Start 36 4 8 12 16 20 24 28 32 36
Wk RIT M sd M sd M sd M sd M sd M sd M sd M sd M sd M sd
170 1.4 4.30 2.8 4.46 4.3 4.71 5.8 5.04 7.2 5.44 8.5 5.90 9.6 6.39 10.4 6.91
175 1.3 4.30 2.7 4.46 4.1 4.71 5.5 5.04 6.9 5.44 8.1 5.90 9.1 6.39 9.8 6.91
180 1.2 4.30 2.5 4.46 3.9 4.71 5.2 5.04 6.5 5.44 7.6 5.90 8.6 6.39 9.3 6.91
185 1.1 4.30 2.4 4.46 3.7 4.71 4.9 5.04 6.1 5.44 7.2 5.90 8.1 6.39 8.7 6.91
190 1.1 4.30 2.2 4.46 3.5 4.71 4.6 5.04 5.8 5.44 6.7 5.90 7.5 6.39 8.1 6.91
195 1.0 4.30 2.1 4.46 3.2 4.71 4.4 5.04 5.4 5.44 6.3 5.90 7.0 6.39 7.5 6.91
200 0.9 4.30 2.0 4.46 3.0 4.71 4.1 5.04 5.0 5.44 5.9 5.90 6.5 6.39 6.9 6.91
205 0.9 4.30 1.8 4.46 2.8 4.71 3.8 5.04 4.7 5.44 5.4 5.90 6.0 6.39 6.3 6.91
210 0.8 4.30 1.7 4.46 2.6 4.71 3.5 5.04 4.3 5.44 5.0 5.90 5.5 6.39 5.7 6.91
215 0.7 4.30 1.5 4.46 2.4 4.71 3.2 5.04 3.9 5.44 4.6 5.90 5.0 6.39 5.2 6.91
220 0.6 4.30 1.4 4.46 2.1 4.71 2.9 5.04 3.6 5.44 4.1 5.90 4.5 6.39 4.6 6.91
225 0.6 4.30 1.2 4.46 1.9 4.71 2.6 5.04 3.2 5.44 3.7 5.90 4.0 6.39 4.0 6.91
230 0.5 4.30 1.1 4.46 1.7 4.71 2.3 5.04 2.8 5.44 3.2 5.90 3.4 6.39 3.4 6.91
8 165 1.5 4.30 3.1 4.46 4.7 4.71 6.2 5.04 7.5 5.44 8.7 5.90 9.6 6.39
170 1.5 4.30 3.0 4.46 4.5 4.71 5.9 5.04 7.1 5.44 8.2 5.90 9.1 6.39
175 1.4 4.30 2.8 4.46 4.2 4.71 5.6 5.04 6.8 5.44 7.8 5.90 8.6 6.39
180 1.3 4.30 2.7 4.46 4.0 4.71 5.3 5.04 6.4 5.44 7.4 5.90 8.0 6.39
185 1.2 4.30 2.5 4.46 3.8 4.71 5.0 5.04 6.0 5.44 6.9 5.90 7.5 6.39
190 1.2 4.30 2.4 4.46 3.6 4.71 4.7 5.04 5.7 5.44 6.5 5.90 7.0 6.39
195 1.1 4.30 2.2 4.46 3.4 4.71 4.4 5.04 5.3 5.44 6.0 5.90 6.5 6.39
200 1.0 4.30 2.1 4.46 3.1 4.71 4.1 5.04 4.9 5.44 5.6 5.90 6.0 6.39
205 1.0 4.30 1.9 4.46 2.9 4.71 3.8 5.04 4.6 5.44 5.2 5.90 5.5 6.39210 0.9 4.30 1.8 4.46 2.7 4.71 3.5 5.04 4.2 5.44 4.7 5.90 5.0 6.39
215 0.8 4.30 1.7 4.46 2.5 4.71 3.2 5.04 3.8 5.44 4.3 5.90 4.5 6.39
220 0.7 4.30 1.5 4.46 2.3 4.71 2.9 5.04 3.5 5.44 3.8 5.90 3.9 6.39
225 0.7 4.30 1.4 4.46 2.0 4.71 2.6 5.04 3.1 5.44 3.4 5.90 3.4 6.39
230 0.6 4.30 1.2 4.46 1.8 4.71 2.4 5.04 2.8 5.44 3.0 5.90 2.9 6.39
12 165 1.6 4.30 3.1 4.46 4.6 4.71 6.0 5.04 7.1 5.44 8.0 5.90
170 1.5 4.30 3.0 4.46 4.4 4.71 5.7 5.04 6.8 5.44 7.6 5.90
175 1.4 4.30 2.8 4.46 4.2 4.71 5.4 5.04 6.4 5.44 7.2 5.90
180 1.4 4.30 2.7 4.46 4.0 4.71 5.1 5.04 6.0 5.44 6.7 5.90
185 1.3 4.30 2.6 4.46 3.7 4.71 4.8 5.04 5.7 5.44 6.3 5.90
190 1.2 4.30 2.4 4.46 3.5 4.71 4.5 5.04 5.3 5.44 5.9 5.90
195 1.1 4.30 2.3 4.46 3.3 4.71 4.2 5.04 4.9 5.44 5.4 5.90

8/10/2019 n We a 2011 Norms Report
http://slidepdf.com/reader/full/n-we-a-2011-norms-report 153/268
N W E A 2 0 1 1 R I T S c a l e N o r m s | 137
Table C.14. Means (M) and Standard Deviations (sd) of Academic Grow th by Starting RIT Score and Starting Inst ruct ional Week forVarious End ing Ins truc tional Weeks - LANGUAGE USAGE, GRADE 4
Ending Instruction al Weeks
Start Prior Grd Focal Grade
Inst. Start 36 4 8 12 16 20 24 28 32 36
Wk RIT M sd M sd M sd M sd M sd M sd M sd M sd M sd M sd
200 1.1 4.30 2.1 4.46 3.1 4.71 3.9 5.04 4.6 5.44 5.0 5.90
205 1.0 4.30 2.0 4.46 2.9 4.71 3.6 5.04 4.2 5.44 4.5 5.90
210 0.9 4.30 1.8 4.46 2.6 4.71 3.3 5.04 3.8 5.44 4.1 5.90
215 0.8 4.30 1.7 4.46 2.4 4.71 3.0 5.04 3.5 5.44 3.7 5.90
220 0.8 4.30 1.5 4.46 2.2 4.71 2.8 5.04 3.1 5.44 3.2 5.90
225 0.7 4.30 1.4 4.46 2.0 4.71 2.5 5.04 2.7 5.44 2.8 5.90
230 0.6 4.30 1.2 4.46 1.8 4.71 2.2 5.04 2.4 5.44 2.3 5.90
16 165 1.6 4.30 3.0 4.46 4.4 4.71 5.6 5.04 6.5 5.44
170 1.5 4.30 2.9 4.46 4.2 4.71 5.3 5.04 6.1 5.44
175 1.4 4.30 2.8 4.46 4.0 4.71 5.0 5.04 5.7 5.44
180 1.3 4.30 2.6 4.46 3.7 4.71 4.7 5.04 5.4 5.44
185 1.3 4.30 2.5 4.46 3.5 4.71 4.4 5.04 5.0 5.44
190 1.2 4.30 2.3 4.46 3.3 4.71 4.1 5.04 4.6 5.44
195 1.1 4.30 2.2 4.46 3.1 4.71 3.8 5.04 4.3 5.44
200 1.1 4.30 2.0 4.46 2.9 4.71 3.5 5.04 3.9 5.44
205 1.0 4.30 1.9 4.46 2.6 4.71 3.2 5.04 3.5 5.44
210 0.9 4.30 1.7 4.46 2.4 4.71 2.9 5.04 3.2 5.44
215 0.8 4.30 1.6 4.46 2.2 4.71 2.6 5.04 2.8 5.44
220 0.8 4.30 1.4 4.46 2.0 4.71 2.3 5.04 2.4 5.44
225 0.7 4.30 1.3 4.46 1.8 4.71 2.0 5.04 2.1 5.44
230 0.6 4.30 1.1 4.46 1.5 4.71 1.8 5.04 1.7 5.44
20 170 1.4 4.30 2.7 4.46 3.8 4.71 4.6 5.04175 1.3 4.30 2.5 4.46 3.6 4.71 4.3 5.04
180 1.3 4.30 2.4 4.46 3.3 4.71 4.0 5.04
185 1.2 4.30 2.3 4.46 3.1 4.71 3.7 5.04
190 1.1 4.30 2.1 4.46 2.9 4.71 3.4 5.04
195 1.0 4.30 2.0 4.46 2.7 4.71 3.2 5.04
200 1.0 4.30 1.8 4.46 2.5 4.71 2.9 5.04
205 0.9 4.30 1.7 4.46 2.2 4.71 2.6 5.04
210 0.8 4.30 1.5 4.46 2.0 4.71 2.3 5.04
215 0.8 4.30 1.4 4.46 1.8 4.71 2.0 5.04
220 0.7 4.30 1.2 4.46 1.6 4.71 1.7 5.04
225 0.6 4.30 1.1 4.46 1.4 4.71 1.4 5.04
230 0.5 4.30 0.9 4.46 1.1 4.71 1.1 5.04

8/10/2019 n We a 2011 Norms Report
http://slidepdf.com/reader/full/n-we-a-2011-norms-report 154/268
138 | N W E A 2 0 1 1 R I T S c a l e N o r m s
Table C.15. Means (M) and Standard Deviations (sd) o f Academic Growth by Starting RIT Score and Starting Instru ctional Week forVarious Ending Instructional Weeks - LANGUAGE USAGE, GRADE 5
Table C.15. Means (M) and Standard Deviations (sd ) of Academic Growth by Starting RIT Score and Starting Instructi onal Week forVarious End ing Ins truc tional Weeks - LANGUAGE USAGE, GRADE 5
Ending Instructio nal Weeks
Start Prior Grd Focal Grade
Inst. Start 36 4 8 12 16 20 24 28 32 36
Wk RIT M sd M sd M sd M sd M sd M sd M sd M sd M sd M sd
32(Gd 4)
170 1.0 4.30 2.1 4.46 3.4 4.71 4.8 5.04 6.2 5.44 7.5 5.89 8.7 6.38 9.8 6.90 10.7 7.45 11.2 8.02
1750.9 4.30 2.0 4.46 3.2 4.71 4.5 5.04 5.8 5.44 7.1 5.89 8.3 6.38 9.3 6.90 10.1 7.45 10.6 8.02180 0.8 4.30 1.9 4.46 3.0 4.71 4.3 5.04 5.5 5.44 6.7 5.89 7.8 6.38 8.8 6.90 9.5 7.45 9.9 8.02
185 0.8 4.30 1.7 4.46 2.8 4.71 4.0 5.04 5.2 5.44 6.3 5.89 7.4 6.38 8.2 6.90 8.9 7.45 9.3 8.02
190 0.7 4.30 1.6 4.46 2.6 4.71 3.7 5.04 4.9 5.44 5.9 5.89 6.9 6.38 7.7 6.90 8.3 7.45 8.6 8.02
195 0.6 4.30 1.5 4.46 2.4 4.71 3.5 5.04 4.5 5.44 5.5 5.89 6.4 6.38 7.2 6.90 7.7 7.45 8.0 8.02
200 0.6 4.30 1.3 4.46 2.2 4.71 3.2 5.04 4.2 5.44 5.1 5.89 6.0 6.38 6.7 6.90 7.1 7.45 7.3 8.02
205 0.5 4.30 1.2 4.46 2.0 4.71 2.9 5.04 3.9 5.44 4.8 5.89 5.5 6.38 6.2 6.90 6.5 7.45 6.7 8.02
210 0.4 4.30 1.1 4.46 1.8 4.71 2.7 5.04 3.5 5.44 4.4 5.89 5.1 6.38 5.6 6.90 6.0 7.45 6.0 8.02
215 0.4 4.30 0.9 4.46 1.6 4.71 2.4 5.04 3.2 5.44 4.0 5.89 4.6 6.38 5.1 6.90 5.4 7.45 5.3 8.02
220 0.3 4.30 0.8 4.46 1.4 4.71 2.2 5.04 2.9 5.44 3.6 5.89 4.2 6.38 4.6 6.90 4.8 7.45 4.7 8.02
225 0.2 4.30 0.7 4.46 1.3 4.71 1.9 5.04 2.6 5.44 3.2 5.89 3.7 6.38 4.1 6.90 4.2 7.45 4.0 8.02
230 0.2 4.30 0.6 4.46 1.1 4.71 1.6 5.04 2.2 5.44 2.8 5.89 3.2 6.38 3.5 6.90 3.6 7.45 3.4 8.02
235 0.1 4.30 0.4 4.46 0.9 4.71 1.4 5.04 1.9 5.44 2.4 5.89 2.8 6.38 3.0 6.90 3.0 7.45 2.7 8.02
36(Gd 4)
170 1.2 4.30 2.4 4.46 3.8 4.71 5.2 5.04 6.5 5.44 7.8 5.89 8.8 6.38 9.7 6.90 10.3 7.45
175 1.1 4.30 2.3 4.46 3.6 4.71 4.9 5.04 6.2 5.44 7.4 5.89 8.4 6.38 9.2 6.90 9.7 7.45
180 1.0 4.30 2.2 4.46 3.4 4.71 4.7 5.04 5.9 5.44 7.0 5.89 7.9 6.38 8.7 6.90 9.1 7.45
185 1.0 4.30 2.1 4.46 3.2 4.71 4.4 5.04 5.6 5.44 6.6 5.89 7.5 6.38 8.1 6.90 8.5 7.45
190 0.9 4.30 1.9 4.46 3.0 4.71 4.2 5.04 5.2 5.44 6.2 5.89 7.0 6.38 7.6 6.90 7.9 7.45
195 0.8 4.30 1.8 4.46 2.8 4.71 3.9 5.04 4.9 5.44 5.8 5.89 6.6 6.38 7.1 6.90 7.3 7.45200 0.8 4.30 1.7 4.46 2.6 4.71 3.6 5.04 4.6 5.44 5.4 5.89 6.1 6.38 6.6 6.90 6.7 7.45
205 0.7 4.30 1.5 4.46 2.4 4.71 3.4 5.04 4.3 5.44 5.0 5.89 5.6 6.38 6.0 6.90 6.2 7.45
210 0.6 4.30 1.4 4.46 2.2 4.71 3.1 5.04 3.9 5.44 4.6 5.89 5.2 6.38 5.5 6.90 5.6 7.45
215 0.6 4.30 1.3 4.46 2.1 4.71 2.8 5.04 3.6 5.44 4.2 5.89 4.7 6.38 5.0 6.90 5.0 7.45
220 0.5 4.30 1.1 4.46 1.9 4.71 2.6 5.04 3.3 5.44 3.9 5.89 4.3 6.38 4.5 6.90 4.4 7.45
225 0.4 4.30 1.0 4.46 1.7 4.71 2.3 5.04 2.9 5.44 3.5 5.89 3.8 6.38 4.0 6.90 3.8 7.45
230 0.4 4.30 0.9 4.46 1.5 4.71 2.1 5.04 2.6 5.44 3.1 5.89 3.4 6.38 3.4 6.90 3.2 7.45
235 0.3 4.30 0.8 4.46 1.3 4.71 1.8 5.04 2.3 5.44 2.7 5.89 2.9 6.38 2.9 6.90 2.6 7.45
4 170 1.3 4.30 2.7 4.46 4.0 4.71 5.4 5.04 6.6 5.44 7.7 5.89 8.5 6.38 9.1 6.90
175 1.2 4.30 2.5 4.46 3.8 4.71 5.1 5.04 6.3 5.44 7.3 5.89 8.1 6.38 8.6 6.90
180 1.2 4.30 2.4 4.46 3.7 4.71 4.9 5.04 6.0 5.44 6.9 5.89 7.6 6.38 8.1 6.90
185 1.1 4.30 2.3 4.46 3.5 4.71 4.6 5.04 5.6 5.44 6.5 5.89 7.2 6.38 7.5 6.90

8/10/2019 n We a 2011 Norms Report
http://slidepdf.com/reader/full/n-we-a-2011-norms-report 155/268
N W E A 2 0 1 1 R I T S c a l e N o r m s | 139
Table C.15. Means (M) and Standard Deviations (sd ) of Academic Growth by Starting RIT Score and Starting Instructi onal Week forVarious End ing Ins truc tional Weeks - LANGUAGE USAGE, GRADE 5
Ending Instructio nal Weeks
Start Prior Grd Focal Grade
Inst. Start 36 4 8 12 16 20 24 28 32 36
Wk RIT M sd M sd M sd M sd M sd M sd M sd M sd M sd M sd
190 1.0 4.30 2.1 4.46 3.3 4.71 4.3 5.04 5.3 5.44 6.1 5.89 6.7 6.38 7.0 6.90
195 1.0 4.30 2.0 4.46 3.1 4.71 4.1 5.04 5.0 5.44 5.7 5.89 6.3 6.38 6.5 6.90
200 0.9 4.30 1.9 4.46 2.9 4.71 3.8 5.04 4.7 5.44 5.3 5.89 5.8 6.38 6.0 6.90
205 0.8 4.30 1.7 4.46 2.7 4.71 3.6 5.04 4.3 5.44 5.0 5.89 5.3 6.38 5.5 6.90
210 0.8 4.30 1.6 4.46 2.5 4.71 3.3 5.04 4.0 5.44 4.6 5.89 4.9 6.38 4.9 6.90
215 0.7 4.30 1.5 4.46 2.3 4.71 3.0 5.04 3.7 5.44 4.2 5.89 4.4 6.38 4.4 6.90
220 0.6 4.30 1.4 4.46 2.1 4.71 2.8 5.04 3.4 5.44 3.8 5.89 4.0 6.38 3.9 6.90
225 0.6 4.30 1.2 4.46 1.9 4.71 2.5 5.04 3.0 5.44 3.4 5.89 3.5 6.38 3.4 6.90
230 0.5 4.30 1.1 4.46 1.7 4.71 2.3 5.04 2.7 5.44 3.0 5.89 3.1 6.38 2.8 6.90
235 0.4 4.30 1.0 4.46 1.5 4.71 2.0 5.04 2.4 5.44 2.6 5.89 2.6 6.38 2.3 6.90
8 170 1.4 4.30 2.8 4.46 4.1 4.71 5.3 5.04 6.4 5.44 7.3 5.89 7.8 6.38
175 1.3 4.30 2.6 4.46 3.9 4.71 5.1 5.04 6.1 5.44 6.9 5.89 7.4 6.38
180 1.2 4.30 2.5 4.46 3.7 4.71 4.8 5.04 5.8 5.44 6.5 5.89 6.9 6.38
185 1.2 4.30 2.4 4.46 3.5 4.71 4.5 5.04 5.4 5.44 6.1 5.89 6.5 6.38
190 1.1 4.30 2.2 4.46 3.3 4.71 4.3 5.04 5.1 5.44 5.7 5.89 6.0 6.38
195 1.0 4.30 2.1 4.46 3.1 4.71 4.0 5.04 4.8 5.44 5.3 5.89 5.5 6.38
200 1.0 4.30 2.0 4.46 2.9 4.71 3.8 5.04 4.4 5.44 4.9 5.89 5.1 6.38
205 0.9 4.30 1.8 4.46 2.7 4.71 3.5 5.04 4.1 5.44 4.5 5.89 4.6 6.38
210 0.8 4.30 1.7 4.46 2.5 4.71 3.2 5.04 3.8 5.44 4.1 5.89 4.2 6.38
215 0.8 4.30 1.6 4.46 2.3 4.71 3.0 5.04 3.5 5.44 3.7 5.89 3.7 6.38
220 0.7 4.30 1.4 4.46 2.1 4.71 2.7 5.04 3.1 5.44 3.3 5.89 3.3 6.38
225 0.7 4.30 1.3 4.46 1.9 4.71 2.5 5.04 2.8 5.44 2.9 5.89 2.8 6.38230 0.6 4.30 1.2 4.46 1.7 4.71 2.2 5.04 2.5 5.44 2.6 5.89 2.3 6.38
235 0.5 4.30 1.1 4.46 1.5 4.71 1.9 5.04 2.2 5.44 2.2 5.89 1.9 6.38
12 175 1.3 4.30 2.6 4.46 3.8 4.71 4.8 5.04 5.6 5.44 6.1 5.89
180 1.3 4.30 2.5 4.46 3.6 4.71 4.5 5.04 5.2 5.44 5.7 5.89
185 1.2 4.30 2.3 4.46 3.4 4.71 4.3 5.04 4.9 5.44 5.3 5.89
190 1.1 4.30 2.2 4.46 3.2 4.71 4.0 5.04 4.6 5.44 4.9 5.89
195 1.1 4.30 2.1 4.46 3.0 4.71 3.7 5.04 4.3 5.44 4.5 5.89
200 1.0 4.30 1.9 4.46 2.8 4.71 3.5 5.04 3.9 5.44 4.1 5.89
205 0.9 4.30 1.8 4.46 2.6 4.71 3.2 5.04 3.6 5.44 3.7 5.89
210 0.9 4.30 1.7 4.46 2.4 4.71 2.9 5.04 3.3 5.44 3.3 5.89
215 0.8 4.30 1.6 4.46 2.2 4.71 2.7 5.04 3.0 5.44 2.9 5.89
220 0.7 4.30 1.4 4.46 2.0 4.71 2.4 5.04 2.6 5.44 2.5 5.89

8/10/2019 n We a 2011 Norms Report
http://slidepdf.com/reader/full/n-we-a-2011-norms-report 156/268
140 | N W E A 2 0 1 1 R I T S c a l e N o r m s
Table C.15. Means (M) and Standard Deviations (sd ) of Academic Growth by Starting RIT Score and Starting Instructi onal Week forVarious End ing Ins truc tional Weeks - LANGUAGE USAGE, GRADE 5
Ending Instructio nal Weeks
Start Prior Grd Focal Grade
Inst. Start 36 4 8 12 16 20 24 28 32 36
Wk RIT M sd M sd M sd M sd M sd M sd M sd M sd M sd M sd
225 0.7 4.30 1.3 4.46 1.8 4.71 2.2 5.04 2.3 5.44 2.1 5.89
230 0.6 4.30 1.2 4.46 1.6 4.71 1.9 5.04 2.0 5.44 1.8 5.89
235 0.5 4.30 1.0 4.46 1.4 4.71 1.6 5.04 1.6 5.44 1.4 5.89
16 1751.3 4.30 2.5 4.46 3.5 4.71 4.2 5.04 4.7 5.44180 1.2 4.30 2.3 4.46 3.3 4.71 4.0 5.04 4.4 5.44
185 1.1 4.30 2.2 4.46 3.1 4.71 3.7 5.04 4.1 5.44
190 1.1 4.30 2.1 4.46 2.9 4.71 3.5 5.04 3.8 5.44
195 1.0 4.30 1.9 4.46 2.7 4.71 3.2 5.04 3.4 5.44
200 1.0 4.30 1.8 4.46 2.5 4.71 2.9 5.04 3.1 5.44
205 0.9 4.30 1.7 4.46 2.3 4.71 2.7 5.04 2.8 5.44
210 0.8 4.30 1.5 4.46 2.1 4.71 2.4 5.04 2.5 5.44
215 0.8 4.30 1.4 4.46 1.9 4.71 2.2 5.04 2.1 5.44
220 0.7 4.30 1.3 4.46 1.7 4.71 1.9 5.04 1.8 5.44
225 0.6 4.30 1.1 4.46 1.5 4.71 1.6 5.04 1.5 5.44
230 0.6 4.30 1.0 4.46 1.3 4.71 1.4 5.04 1.2 5.44
235 0.5 4.30 0.9 4.46 1.1 4.71 1.1 5.04 0.8 5.44
20 175 1.2 4.30 2.2 4.46 3.0 4.71 3.5 5.04
180 1.1 4.30 2.1 4.46 2.8 4.71 3.2 5.04
185 1.0 4.30 1.9 4.46 2.6 4.71 3.0 5.04
190 1.0 4.30 1.8 4.46 2.4 4.71 2.7 5.04
195 0.9 4.30 1.7 4.46 2.2 4.71 2.4 5.04
200 0.8 4.30 1.5 4.46 2.0 4.71 2.2 5.04205 0.8 4.30 1.4 4.46 1.8 4.71 1.9 5.04
210 0.7 4.30 1.3 4.46 1.6 4.71 1.6 5.04
215 0.7 4.30 1.1 4.46 1.4 4.71 1.4 5.04
220 0.6 4.30 1.0 4.46 1.2 4.71 1.1 5.04
225 0.5 4.30 0.9 4.46 1.0 4.71 0.9 5.04
230 0.5 4.30 0.7 4.46 0.8 4.71 0.6 5.04
235 0.4 4.30 0.6 4.46 0.6 4.71 0.3 5.04

8/10/2019 n We a 2011 Norms Report
http://slidepdf.com/reader/full/n-we-a-2011-norms-report 157/268
N W E A 2 0 1 1 R I T S c a l e N o r m s | 141
Table C.16. Means (M) and Standard Deviations (sd) o f Academic Growth by Starting RIT Score and Starting Instru ctional Week forVarious Ending Instructional Weeks - LANGUAGE USAGE, GRADE 6
Table C.16. Means (M) and Standard Deviations (sd ) of Academic Growth by Starting RIT Score and Starting Instr ucti onal Week for VariousEnding Instructi onal Weeks - LANGUAGE USAGE, GRADE 6
Ending Instruction al Weeks
Start Prior Grd Focal Grade
Inst. Start 36 4 8 12 16 20 24 28 32 36
Wk RIT M sd M sd M sd M sd M sd M sd M sd M sd M sd M sd
32(Gd 5)
175 0.4 4.30 1.0 4.45 1.9 4.70 2.8 5.02 3.9 5.41 5.0 5.85 6.0 6.33 6.9 6.84 7.6 7.38 8.1 7.94
1800.3 4.30 0.9 4.45 1.7 4.70 2.6 5.02 3.6 5.41 4.7 5.85 5.6 6.33 6.5 6.84 7.2 7.38 7.6 7.94185 0.3 4.30 0.8 4.45 1.6 4.70 2.4 5.02 3.4 5.41 4.4 5.85 5.3 6.33 6.1 6.84 6.7 7.38 7.2 7.94
190 0.2 4.30 0.7 4.45 1.4 4.70 2.2 5.02 3.2 5.41 4.1 5.85 4.9 6.33 5.7 6.84 6.3 7.38 6.7 7.94
195 0.2 4.30 0.6 4.45 1.3 4.70 2.1 5.02 2.9 5.41 3.8 5.85 4.6 6.33 5.3 6.84 5.9 7.38 6.2 7.94
200 0.1 4.30 0.5 4.45 1.1 4.70 1.9 5.02 2.7 5.41 3.5 5.85 4.2 6.33 4.9 6.84 5.4 7.38 5.7 7.94
205 0.1 4.30 0.4 4.45 1.0 4.70 1.7 5.02 2.4 5.41 3.2 5.85 3.9 6.33 4.5 6.84 5.0 7.38 5.2 7.94
210 0.0 4.30 0.3 4.45 0.8 4.70 1.5 5.02 2.2 5.41 2.9 5.85 3.6 6.33 4.1 6.84 4.5 7.38 4.7 7.94
215 0.0 4.30 0.2 4.45 0.7 4.70 1.3 5.02 1.9 5.41 2.6 5.85 3.2 6.33 3.7 6.84 4.1 7.38 4.2 7.94
220 -0.1 4.30 0.1 4.45 0.5 4.70 1.1 5.02 1.7 5.41 2.3 5.85 2.9 6.33 3.3 6.84 3.6 7.38 3.7 7.94
225 -0.1 4.30 0.0 4.45 0.4 4.70 0.9 5.02 1.4 5.41 2.0 5.85 2.5 6.33 2.9 6.84 3.2 7.38 3.2 7.94
230 -0.2 4.30 -0.1 4.45 0.2 4.70 0.7 5.02 1.2 5.41 1.7 5.85 2.2 6.33 2.6 6.84 2.8 7.38 2.7 7.94
235 -0.2 4.30 -0.2 4.45 0.1 4.70 0.5 5.02 0.9 5.41 1.4 5.85 1.8 6.33 2.2 6.84 2.3 7.38 2.2 7.94
240 -0.3 4.30 -0.3 4.45 -0.1 4.70 0.3 5.02 0.7 5.41 1.1 5.85 1.5 6.33 1.8 6.84 1.9 7.38 1.7 7.94
36(Gd 5)
175 0.6 4.30 1.5 4.45 2.5 4.70 3.5 5.02 4.6 5.41 5.6 5.85 6.5 6.33 7.2 6.84 7.8 7.38
180 0.6 4.30 1.4 4.45 2.3 4.70 3.3 5.02 4.3 5.41 5.3 5.85 6.2 6.33 6.8 6.84 7.3 7.38
185 0.5 4.30 1.3 4.45 2.2 4.70 3.1 5.02 4.1 5.41 5.0 5.85 5.8 6.33 6.5 6.84 6.9 7.38
190 0.5 4.30 1.2 4.45 2.0 4.70 2.9 5.02 3.8 5.41 4.7 5.85 5.5 6.33 6.1 6.84 6.4 7.38
195 0.4 4.30 1.1 4.45 1.9 4.70 2.7 5.02 3.6 5.41 4.4 5.85 5.1 6.33 5.7 6.84 6.0 7.38
200 0.4 4.30 1.0 4.45 1.7 4.70 2.5 5.02 3.3 5.41 4.1 5.85 4.8 6.33 5.3 6.84 5.5 7.38205 0.4 4.30 0.9 4.45 1.6 4.70 2.3 5.02 3.1 5.41 3.8 5.85 4.4 6.33 4.9 6.84 5.1 7.38
210 0.3 4.30 0.8 4.45 1.4 4.70 2.1 5.02 2.8 5.41 3.5 5.85 4.1 6.33 4.5 6.84 4.7 7.38
215 0.3 4.30 0.7 4.45 1.3 4.70 1.9 5.02 2.6 5.41 3.2 5.85 3.7 6.33 4.1 6.84 4.2 7.38
220 0.2 4.30 0.6 4.45 1.1 4.70 1.7 5.02 2.4 5.41 2.9 5.85 3.4 6.33 3.7 6.84 3.8 7.38
225 0.2 4.30 0.5 4.45 1.0 4.70 1.5 5.02 2.1 5.41 2.6 5.85 3.1 6.33 3.3 6.84 3.3 7.38
230 0.1 4.30 0.4 4.45 0.8 4.70 1.3 5.02 1.9 5.41 2.3 5.85 2.7 6.33 2.9 6.84 2.9 7.38
235 0.1 4.30 0.3 4.45 0.7 4.70 1.1 5.02 1.6 5.41 2.0 5.85 2.4 6.33 2.5 6.84 2.4 7.38
240 0.0 4.30 0.2 4.45 0.5 4.70 0.9 5.02 1.4 5.41 1.8 5.85 2.0 6.33 2.1 6.84 2.0 7.38
4 175 0.8 4.30 1.8 4.45 2.9 4.70 3.9 5.02 4.9 5.41 5.9 5.85 6.6 6.33 7.1 6.84
180 0.8 4.30 1.7 4.45 2.7 4.70 3.7 5.02 4.7 5.41 5.6 5.85 6.3 6.33 6.7 6.84
185 0.7 4.30 1.6 4.45 2.6 4.70 3.5 5.02 4.5 5.41 5.3 5.85 5.9 6.33 6.3 6.84
190 0.7 4.30 1.5 4.45 2.4 4.70 3.3 5.02 4.2 5.41 5.0 5.85 5.6 6.33 5.9 6.84

8/10/2019 n We a 2011 Norms Report
http://slidepdf.com/reader/full/n-we-a-2011-norms-report 158/268
142 | N W E A 2 0 1 1 R I T S c a l e N o r m s
Table C.16. Means (M) and Standard Deviations (sd ) of Academic Growth by Starting RIT Score and Starting Instr ucti onal Week for VariousEnding Instructi onal Weeks - LANGUAGE USAGE, GRADE 6
Ending Instruction al Weeks
Start Prior Grd Focal Grade
Inst. Start 36 4 8 12 16 20 24 28 32 36
Wk RIT M sd M sd M sd M sd M sd M sd M sd M sd M sd M sd
195 0.6 4.30 1.4 4.45 2.3 4.70 3.1 5.02 4.0 5.41 4.7 5.85 5.2 6.33 5.5 6.84
200 0.6 4.30 1.3 4.45 2.1 4.70 2.9 5.02 3.7 5.41 4.4 5.85 4.9 6.33 5.1 6.84
205 0.5 4.30 1.2 4.45 2.0 4.70 2.8 5.02 3.5 5.41 4.1 5.85 4.5 6.33 4.8 6.84
210 0.5 4.30 1.1 4.45 1.8 4.70 2.6 5.02 3.2 5.41 3.8 5.85 4.2 6.33 4.4 6.84
215 0.4 4.30 1.0 4.45 1.7 4.70 2.4 5.02 3.0 5.41 3.5 5.85 3.8 6.33 4.0 6.84
220 0.4 4.30 0.9 4.45 1.5 4.70 2.2 5.02 2.7 5.41 3.2 5.85 3.5 6.33 3.6 6.84
225 0.4 4.30 0.8 4.45 1.4 4.70 2.0 5.02 2.5 5.41 2.9 5.85 3.2 6.33 3.2 6.84
230 0.3 4.30 0.7 4.45 1.2 4.70 1.8 5.02 2.2 5.41 2.6 5.85 2.8 6.33 2.8 6.84
235 0.3 4.30 0.6 4.45 1.1 4.70 1.6 5.02 2.0 5.41 2.3 5.85 2.5 6.33 2.4 6.84
240 0.2 4.30 0.5 4.45 0.9 4.70 1.4 5.02 1.8 5.41 2.0 5.85 2.1 6.33 2.0 6.84
8 175 1.0 4.30 2.0 4.45 3.1 4.70 4.1 5.02 5.0 5.41 5.8 5.85 6.3 6.33
180 0.9 4.30 1.9 4.45 2.9 4.70 3.9 5.02 4.8 5.41 5.5 5.85 5.9 6.33
185 0.9 4.30 1.8 4.45 2.8 4.70 3.7 5.02 4.5 5.41 5.2 5.85 5.6 6.33
190 0.8 4.30 1.7 4.45 2.7 4.70 3.5 5.02 4.3 5.41 4.9 5.85 5.2 6.33
195 0.8 4.30 1.6 4.45 2.5 4.70 3.3 5.02 4.0 5.41 4.6 5.85 4.9 6.33
200 0.7 4.30 1.5 4.45 2.4 4.70 3.1 5.02 3.8 5.41 4.3 5.85 4.6 6.33
205 0.7 4.30 1.4 4.45 2.2 4.70 2.9 5.02 3.5 5.41 4.0 5.85 4.2 6.33
210 0.6 4.30 1.3 4.45 2.1 4.70 2.7 5.02 3.3 5.41 3.7 5.85 3.9 6.33
215 0.6 4.30 1.2 4.45 1.9 4.70 2.5 5.02 3.1 5.41 3.4 5.85 3.5 6.33
220 0.5 4.30 1.1 4.45 1.8 4.70 2.3 5.02 2.8 5.41 3.1 5.85 3.2 6.33
225 0.5 4.30 1.0 4.45 1.6 4.70 2.1 5.02 2.6 5.41 2.8 5.85 2.8 6.33
230 0.4 4.30 0.9 4.45 1.5 4.70 1.9 5.02 2.3 5.41 2.5 5.85 2.5 6.33235 0.4 4.30 0.8 4.45 1.3 4.70 1.8 5.02 2.1 5.41 2.2 5.85 2.1 6.33
240 0.3 4.30 0.8 4.45 1.2 4.70 1.6 5.02 1.8 5.41 1.9 5.85 1.8 6.33
12 175 1.1 4.30 2.1 4.45 3.1 4.70 4.0 5.02 4.8 5.41 5.3 5.85
180 1.0 4.30 2.0 4.45 3.0 4.70 3.9 5.02 4.5 5.41 5.0 5.85
185 1.0 4.30 1.9 4.45 2.8 4.70 3.7 5.02 4.3 5.41 4.7 5.85
190 0.9 4.30 1.8 4.45 2.7 4.70 3.5 5.02 4.1 5.41 4.4 5.85
195 0.9 4.30 1.7 4.45 2.5 4.70 3.3 5.02 3.8 5.41 4.1 5.85
200 0.8 4.30 1.6 4.45 2.4 4.70 3.1 5.02 3.6 5.41 3.8 5.85
205 0.8 4.30 1.5 4.45 2.3 4.70 2.9 5.02 3.3 5.41 3.5 5.85
210 0.7 4.30 1.4 4.45 2.1 4.70 2.7 5.02 3.1 5.41 3.2 5.85
215 0.7 4.30 1.3 4.45 2.0 4.70 2.5 5.02 2.8 5.41 2.9 5.85
220 0.6 4.30 1.2 4.45 1.8 4.70 2.3 5.02 2.6 5.41 2.6 5.85

8/10/2019 n We a 2011 Norms Report
http://slidepdf.com/reader/full/n-we-a-2011-norms-report 159/268
N W E A 2 0 1 1 R I T S c a l e N o r m s | 143
Table C.16. Means (M) and Standard Deviations (sd ) of Academic Growth by Starting RIT Score and Starting Instr ucti onal Week for VariousEnding Instructi onal Weeks - LANGUAGE USAGE, GRADE 6
Ending Instruction al Weeks
Start Prior Grd Focal Grade
Inst. Start 36 4 8 12 16 20 24 28 32 36
Wk RIT M sd M sd M sd M sd M sd M sd M sd M sd M sd M sd
225 0.6 4.30 1.1 4.45 1.7 4.70 2.1 5.02 2.3 5.41 2.4 5.85
230 0.5 4.30 1.0 4.45 1.5 4.70 1.9 5.02 2.1 5.41 2.1 5.85
235 0.5 4.30 0.9 4.45 1.4 4.70 1.7 5.02 1.8 5.41 1.8 5.85
240 0.4 4.30 0.8 4.45 1.2 4.70 1.5 5.02 1.6 5.41 1.5 5.85
16 180 1.0 4.30 2.0 4.45 2.9 4.70 3.5 5.02 4.0 5.41
185 1.0 4.30 1.9 4.45 2.7 4.70 3.3 5.02 3.8 5.41
190 0.9 4.30 1.8 4.45 2.6 4.70 3.2 5.02 3.5 5.41
195 0.9 4.30 1.7 4.45 2.4 4.70 3.0 5.02 3.3 5.41
200 0.8 4.30 1.6 4.45 2.3 4.70 2.8 5.02 3.0 5.41
205 0.8 4.30 1.5 4.45 2.1 4.70 2.6 5.02 2.8 5.41
210 0.7 4.30 1.4 4.45 2.0 4.70 2.4 5.02 2.5 5.41
215 0.7 4.30 1.3 4.45 1.8 4.70 2.2 5.02 2.3 5.41
220 0.6 4.30 1.2 4.45 1.7 4.70 2.0 5.02 2.0 5.41
225 0.6 4.30 1.1 4.45 1.5 4.70 1.8 5.02 1.8 5.41
230 0.5 4.30 1.0 4.45 1.4 4.70 1.6 5.02 1.5 5.41
235 0.5 4.30 0.9 4.45 1.2 4.70 1.4 5.02 1.3 5.41
240 0.4 4.30 0.8 4.45 1.1 4.70 1.2 5.02 1.1 5.41
20 180 1.0 4.30 1.8 4.45 2.5 4.70 3.0 5.02
185 0.9 4.30 1.7 4.45 2.4 4.70 2.8 5.02
190 0.9 4.30 1.6 4.45 2.2 4.70 2.6 5.02
195 0.8 4.30 1.5 4.45 2.1 4.70 2.4 5.02
200 0.8 4.30 1.4 4.45 1.9 4.70 2.2 5.02205 0.7 4.30 1.3 4.45 1.8 4.70 2.0 5.02
210 0.7 4.30 1.2 4.45 1.6 4.70 1.8 5.02
215 0.6 4.30 1.1 4.45 1.5 4.70 1.6 5.02
220 0.6 4.30 1.0 4.45 1.3 4.70 1.4 5.02
225 0.5 4.30 1.0 4.45 1.2 4.70 1.2 5.02
230 0.5 4.30 0.9 4.45 1.1 4.70 1.0 5.02
235 0.4 4.30 0.8 4.45 0.9 4.70 0.8 5.02
240 0.4 4.30 0.7 4.45 0.8 4.70 0.6 5.02

8/10/2019 n We a 2011 Norms Report
http://slidepdf.com/reader/full/n-we-a-2011-norms-report 160/268
144 | N W E A 2 0 1 1 R I T S c a l e N o r m s
Table C.17. Means (M) and Standard Deviations (sd) o f Academic Growth by Starting RIT Score and Starting Instru ctional Week forVarious Ending Instructional Weeks - LANGUAGE USAGE, GRADE 7
Table C.17. Means (M) and Standard Deviations (sd) of Academic Grow th by Starting RIT Score and Starting Inst ruct ional Week for VariousEnding Instructi onal Weeks - LANGUAGE USAGE, GRADE 7
Ending Instruction al Weeks
Start Prior Grd Focal Grade
Inst. Start 36 4 8 12 16 20 24 28 32 36
Wk RIT M sd M sd M sd M sd M sd M sd M sd M sd M sd M sd
32(Gd 6)
180 0.2 4.29 0.6 4.43 1.1 4.65 1.8 4.95 2.5 5.31 3.3 5.71 4.0 6.16 4.8 6.63 5.4 7.13 5.9 7.66
1850.2 4.29 0.5 4.43 1.0 4.65 1.7 4.95 2.4 5.31 3.1 5.71 3.8 6.16 4.5 6.63 5.1 7.13 5.5 7.66190 0.1 4.29 0.5 4.43 0.9 4.65 1.5 4.95 2.2 5.31 2.9 5.71 3.6 6.16 4.2 6.63 4.8 7.13 5.2 7.66
195 0.1 4.29 0.4 4.43 0.8 4.65 1.4 4.95 2.0 5.31 2.7 5.71 3.3 6.16 3.9 6.63 4.5 7.13 4.9 7.66
200 0.1 4.29 0.3 4.43 0.7 4.65 1.3 4.95 1.9 5.31 2.5 5.71 3.1 6.16 3.7 6.63 4.2 7.13 4.5 7.66
205 0.0 4.29 0.3 4.43 0.6 4.65 1.1 4.95 1.7 5.31 2.3 5.71 2.9 6.16 3.4 6.63 3.9 7.13 4.2 7.66
210 0.0 4.29 0.2 4.43 0.5 4.65 1.0 4.95 1.5 5.31 2.1 5.71 2.6 6.16 3.1 6.63 3.6 7.13 3.8 7.66
215 0.0 4.29 0.1 4.43 0.4 4.65 0.9 4.95 1.4 5.31 1.9 5.71 2.4 6.16 2.9 6.63 3.3 7.13 3.5 7.66
220 -0.1 4.29 0.1 4.43 0.3 4.65 0.7 4.95 1.2 5.31 1.7 5.71 2.2 6.16 2.6 6.63 3.0 7.13 3.2 7.66
225 -0.1 4.29 0.0 4.43 0.2 4.65 0.6 4.95 1.0 5.31 1.5 5.71 1.9 6.16 2.3 6.63 2.6 7.13 2.8 7.66
230 -0.1 4.29 -0.1 4.43 0.1 4.65 0.5 4.95 0.8 5.31 1.3 5.71 1.7 6.16 2.1 6.63 2.3 7.13 2.5 7.66
235 -0.2 4.29 -0.2 4.43 0.0 4.65 0.3 4.95 0.7 5.31 1.1 5.71 1.5 6.16 1.8 6.63 2.0 7.13 2.2 7.66
240 -0.2 4.29 -0.2 4.43 -0.1 4.65 0.2 4.95 0.5 5.31 0.9 5.71 1.2 6.16 1.5 6.63 1.7 7.13 1.8 7.66
245 -0.2 4.29 -0.3 4.43 -0.2 4.65 0.0 4.95 0.3 5.31 0.7 5.71 1.0 6.16 1.3 6.63 1.4 7.13 1.5 7.66
36(Gd 6)
180 0.4 4.29 0.9 4.43 1.6 4.65 2.3 4.95 3.1 5.31 3.8 5.71 4.6 6.16 5.2 6.63 5.7 7.13
185 0.4 4.29 0.9 4.43 1.5 4.65 2.2 4.95 2.9 5.31 3.6 5.71 4.3 6.16 4.9 6.63 5.4 7.13
190 0.3 4.29 0.8 4.43 1.4 4.65 2.1 4.95 2.8 5.31 3.4 5.71 4.1 6.16 4.6 6.63 5.1 7.13
195 0.3 4.29 0.7 4.43 1.3 4.65 1.9 4.95 2.6 5.31 3.2 5.71 3.8 6.16 4.4 6.63 4.8 7.13
200 0.3 4.29 0.7 4.43 1.2 4.65 1.8 4.95 2.4 5.31 3.0 5.71 3.6 6.16 4.1 6.63 4.5 7.13
205 0.2 4.29 0.6 4.43 1.1 4.65 1.7 4.95 2.3 5.31 2.8 5.71 3.4 6.16 3.8 6.63 4.2 7.13210 0.2 4.29 0.5 4.43 1.0 4.65 1.5 4.95 2.1 5.31 2.6 5.71 3.1 6.16 3.6 6.63 3.8 7.13
215 0.2 4.29 0.5 4.43 0.9 4.65 1.4 4.95 1.9 5.31 2.4 5.71 2.9 6.16 3.3 6.63 3.5 7.13
220 0.1 4.29 0.4 4.43 0.8 4.65 1.3 4.95 1.7 5.31 2.2 5.71 2.7 6.16 3.0 6.63 3.2 7.13
225 0.1 4.29 0.3 4.43 0.7 4.65 1.1 4.95 1.6 5.31 2.0 5.71 2.4 6.16 2.8 6.63 2.9 7.13
230 0.1 4.29 0.3 4.43 0.6 4.65 1.0 4.95 1.4 5.31 1.8 5.71 2.2 6.16 2.5 6.63 2.6 7.13
235 0.0 4.29 0.2 4.43 0.5 4.65 0.9 4.95 1.2 5.31 1.6 5.71 2.0 6.16 2.2 6.63 2.3 7.13
240 0.0 4.29 0.1 4.43 0.4 4.65 0.7 4.95 1.1 5.31 1.4 5.71 1.7 6.16 1.9 6.63 2.0 7.13
245 -0.1 4.29 0.1 4.43 0.3 4.65 0.6 4.95 0.9 5.31 1.2 5.71 1.5 6.16 1.7 6.63 1.7 7.13
4 180 0.5 4.29 1.2 4.43 1.9 4.65 2.7 4.95 3.5 5.31 4.2 5.71 4.8 6.16 5.3 6.63
185 0.5 4.29 1.1 4.43 1.8 4.65 2.6 4.95 3.3 5.31 4.0 5.71 4.5 6.16 5.0 6.63
190 0.5 4.29 1.1 4.43 1.7 4.65 2.4 4.95 3.1 5.31 3.8 5.71 4.3 6.16 4.7 6.63
195 0.4 4.29 1.0 4.43 1.6 4.65 2.3 4.95 3.0 5.31 3.6 5.71 4.1 6.16 4.5 6.63

8/10/2019 n We a 2011 Norms Report
http://slidepdf.com/reader/full/n-we-a-2011-norms-report 161/268
N W E A 2 0 1 1 R I T S c a l e N o r m s | 145
Table C.17. Means (M) and Standard Deviations (sd) of Academic Grow th by Starting RIT Score and Starting Inst ruct ional Week for VariousEnding Instructi onal Weeks - LANGUAGE USAGE, GRADE 7
Ending Instruction al Weeks
Start Prior Grd Focal Grade
Inst. Start 36 4 8 12 16 20 24 28 32 36
Wk RIT M sd M sd M sd M sd M sd M sd M sd M sd M sd M sd
200 0.4 4.29 0.9 4.43 1.5 4.65 2.2 4.95 2.8 5.31 3.4 5.71 3.8 6.16 4.2 6.63
205 0.4 4.29 0.9 4.43 1.4 4.65 2.0 4.95 2.6 5.31 3.2 5.71 3.6 6.16 3.9 6.63
210 0.3 4.29 0.8 4.43 1.3 4.65 1.9 4.95 2.4 5.31 3.0 5.71 3.4 6.16 3.7 6.63
215 0.3 4.29 0.7 4.43 1.2 4.65 1.8 4.95 2.3 5.31 2.8 5.71 3.1 6.16 3.4 6.63
220 0.3 4.29 0.7 4.43 1.1 4.65 1.6 4.95 2.1 5.31 2.5 5.71 2.9 6.16 3.1 6.63
225 0.2 4.29 0.6 4.43 1.0 4.65 1.5 4.95 1.9 5.31 2.3 5.71 2.7 6.16 2.9 6.63
230 0.2 4.29 0.5 4.43 0.9 4.65 1.4 4.95 1.8 5.31 2.1 5.71 2.4 6.16 2.6 6.63
235 0.2 4.29 0.5 4.43 0.8 4.65 1.2 4.95 1.6 5.31 1.9 5.71 2.2 6.16 2.3 6.63
240 0.1 4.29 0.4 4.43 0.7 4.65 1.1 4.95 1.4 5.31 1.7 5.71 2.0 6.16 2.0 6.63
245 0.1 4.29 0.3 4.43 0.6 4.65 1.0 4.95 1.3 5.31 1.5 5.71 1.7 6.16 1.8 6.63
8 180 0.7 4.29 1.4 4.43 2.2 4.65 2.9 4.95 3.6 5.31 4.2 5.71 4.7 6.16
185 0.6 4.29 1.3 4.43 2.1 4.65 2.8 4.95 3.4 5.31 4.0 5.71 4.5 6.16
190 0.6 4.29 1.3 4.43 2.0 4.65 2.6 4.95 3.3 5.31 3.8 5.71 4.3 6.16
195 0.6 4.29 1.2 4.43 1.9 4.65 2.5 4.95 3.1 5.31 3.6 5.71 4.0 6.16
200 0.5 4.29 1.1 4.43 1.8 4.65 2.4 4.95 2.9 5.31 3.4 5.71 3.8 6.16
205 0.5 4.29 1.1 4.43 1.7 4.65 2.2 4.95 2.8 5.31 3.2 5.71 3.6 6.16
210 0.5 4.29 1.0 4.43 1.6 4.65 2.1 4.95 2.6 5.31 3.0 5.71 3.3 6.16
215 0.4 4.29 0.9 4.43 1.5 4.65 2.0 4.95 2.4 5.31 2.8 5.71 3.1 6.16
220 0.4 4.29 0.9 4.43 1.3 4.65 1.8 4.95 2.3 5.31 2.6 5.71 2.8 6.16
225 0.4 4.29 0.8 4.43 1.2 4.65 1.7 4.95 2.1 5.31 2.4 5.71 2.6 6.16
230 0.3 4.29 0.7 4.43 1.1 4.65 1.6 4.95 1.9 5.31 2.2 5.71 2.4 6.16
235 0.3 4.29 0.7 4.43 1.0 4.65 1.4 4.95 1.8 5.31 2.0 5.71 2.1 6.16240 0.3 4.29 0.6 4.43 0.9 4.65 1.3 4.95 1.6 5.31 1.8 5.71 1.9 6.16
245 0.2 4.29 0.5 4.43 0.8 4.65 1.2 4.95 1.4 5.31 1.6 5.71 1.7 6.16
12 180 0.7 4.29 1.5 4.43 2.3 4.65 3.0 4.95 3.6 5.31 4.1 5.71
185 0.7 4.29 1.4 4.43 2.2 4.65 2.8 4.95 3.4 5.31 3.9 5.71
190 0.7 4.29 1.4 4.43 2.1 4.65 2.7 4.95 3.2 5.31 3.7 5.71
195 0.6 4.29 1.3 4.43 2.0 4.65 2.6 4.95 3.1 5.31 3.5 5.71
200 0.6 4.29 1.2 4.43 1.8 4.65 2.4 4.95 2.9 5.31 3.3 5.71
205 0.6 4.29 1.2 4.43 1.7 4.65 2.3 4.95 2.7 5.31 3.1 5.71
210 0.5 4.29 1.1 4.43 1.6 4.65 2.2 4.95 2.6 5.31 2.9 5.71
215 0.5 4.29 1.0 4.43 1.5 4.65 2.0 4.95 2.4 5.31 2.7 5.71
220 0.5 4.29 1.0 4.43 1.4 4.65 1.9 4.95 2.2 5.31 2.5 5.71
225 0.4 4.29 0.9 4.43 1.3 4.65 1.8 4.95 2.1 5.31 2.3 5.71

8/10/2019 n We a 2011 Norms Report
http://slidepdf.com/reader/full/n-we-a-2011-norms-report 162/268
146 | N W E A 2 0 1 1 R I T S c a l e N o r m s
Table C.17. Means (M) and Standard Deviations (sd) of Academic Grow th by Starting RIT Score and Starting Inst ruct ional Week for VariousEnding Instructi onal Weeks - LANGUAGE USAGE, GRADE 7
Ending Instruction al Weeks
Start Prior Grd Focal Grade
Inst. Start 36 4 8 12 16 20 24 28 32 36
Wk RIT M sd M sd M sd M sd M sd M sd M sd M sd M sd M sd
230 0.4 4.29 0.8 4.43 1.2 4.65 1.6 4.95 1.9 5.31 2.1 5.71
235 0.4 4.29 0.8 4.43 1.1 4.65 1.5 4.95 1.7 5.31 1.9 5.71
240 0.3 4.29 0.7 4.43 1.0 4.65 1.3 4.95 1.6 5.31 1.7 5.71
245 0.3 4.29 0.6 4.43 0.9 4.65 1.2 4.95 1.4 5.31 1.4 5.71
16 180 0.8 4.29 1.5 4.43 2.2 4.65 2.8 4.95 3.3 5.31
185 0.7 4.29 1.5 4.43 2.1 4.65 2.7 4.95 3.2 5.31
190 0.7 4.29 1.4 4.43 2.0 4.65 2.6 4.95 3.0 5.31
195 0.7 4.29 1.3 4.43 1.9 4.65 2.4 4.95 2.8 5.31
200 0.6 4.29 1.3 4.43 1.8 4.65 2.3 4.95 2.7 5.31
205 0.6 4.29 1.2 4.43 1.7 4.65 2.2 4.95 2.5 5.31
210 0.6 4.29 1.1 4.43 1.6 4.65 2.0 4.95 2.3 5.31
215 0.5 4.29 1.1 4.43 1.5 4.65 1.9 4.95 2.2 5.31
220 0.5 4.29 1.0 4.43 1.4 4.65 1.8 4.95 2.0 5.31
225 0.5 4.29 0.9 4.43 1.3 4.65 1.6 4.95 1.8 5.31
230 0.4 4.29 0.9 4.43 1.2 4.65 1.5 4.95 1.7 5.31
235 0.4 4.29 0.8 4.43 1.1 4.65 1.4 4.95 1.5 5.31
240 0.4 4.29 0.7 4.43 1.0 4.65 1.2 4.95 1.3 5.31
245 0.3 4.29 0.6 4.43 0.9 4.65 1.1 4.95 1.2 5.31
20 180 0.8 4.29 1.5 4.43 2.1 4.65 2.6 4.95
185 0.7 4.29 1.4 4.43 2.0 4.65 2.4 4.95
190 0.7 4.29 1.3 4.43 1.9 4.65 2.3 4.95
195 0.7 4.29 1.3 4.43 1.8 4.65 2.2 4.95200 0.6 4.29 1.2 4.43 1.7 4.65 2.0 4.95
205 0.6 4.29 1.1 4.43 1.6 4.65 1.9 4.95
210 0.6 4.29 1.1 4.43 1.5 4.65 1.8 4.95
215 0.5 4.29 1.0 4.43 1.4 4.65 1.6 4.95
220 0.5 4.29 0.9 4.43 1.3 4.65 1.5 4.95
225 0.5 4.29 0.9 4.43 1.2 4.65 1.4 4.95
230 0.4 4.29 0.8 4.43 1.1 4.65 1.2 4.95
235 0.4 4.29 0.7 4.43 1.0 4.65 1.1 4.95
240 0.4 4.29 0.7 4.43 0.9 4.65 1.0 4.95
245 0.3 4.29 0.6 4.43 0.8 4.65 0.8 4.95

8/10/2019 n We a 2011 Norms Report
http://slidepdf.com/reader/full/n-we-a-2011-norms-report 163/268
N W E A 2 0 1 1 R I T S c a l e N o r m s | 147
Table C.18. Means (M) and Standard Deviations (sd) o f Academic Growth by Starting RIT Score and Starting Instru ctional Week forVarious Ending Instructional Weeks - LANGUAGE USAGE, GRADE 8
Table C.18. Means (M) and Standard Deviations (sd ) of Academic Growth by Starting RIT Score and Starting Instructi onal Week forVarious End ing Ins truc tional Weeks - LANGUAGE USAGE, GRADE 8
Ending Instruction al Weeks
Start Prior Grd Focal Grade
Inst. Start 36 4 8 12 16 20 24 28 32 36
Wk RIT M sd M sd M sd M sd M sd M sd M sd M sd M sd M sd
32(Gd 7)
180 0.5 4.30 1.1 4.47 1.8 4.73 2.6 5.08 3.4 5.49 4.2 5.96 4.9 6.46 5.6 7.00 6.2 7.57 6.6 8.16
1850.4 4.30 1.0 4.47 1.6 4.73 2.4 5.08 3.2 5.49 3.9 5.96 4.6 6.46 5.3 7.00 5.8 7.57 6.1 8.16190 0.4 4.30 0.9 4.47 1.5 4.73 2.2 5.08 2.9 5.49 3.7 5.96 4.3 6.46 4.9 7.00 5.4 7.57 5.7 8.16
195 0.3 4.30 0.8 4.47 1.4 4.73 2.0 5.08 2.7 5.49 3.4 5.96 4.0 6.46 4.6 7.00 5.0 7.57 5.3 8.16
200 0.3 4.30 0.7 4.47 1.2 4.73 1.9 5.08 2.5 5.49 3.1 5.96 3.7 6.46 4.2 7.00 4.6 7.57 4.8 8.16
205 0.2 4.30 0.6 4.47 1.1 4.73 1.7 5.08 2.3 5.49 2.9 5.96 3.4 6.46 3.9 7.00 4.2 7.57 4.4 8.16
210 0.2 4.30 0.5 4.47 1.0 4.73 1.5 5.08 2.1 5.49 2.6 5.96 3.1 6.46 3.5 7.00 3.8 7.57 3.9 8.16
215 0.2 4.30 0.4 4.47 0.9 4.73 1.3 5.08 1.8 5.49 2.3 5.96 2.8 6.46 3.2 7.00 3.4 7.57 3.5 8.16
220 0.1 4.30 0.4 4.47 0.7 4.73 1.2 5.08 1.6 5.49 2.1 5.96 2.5 6.46 2.8 7.00 3.0 7.57 3.1 8.16
225 0.1 4.30 0.3 4.47 0.6 4.73 1.0 5.08 1.4 5.49 1.8 5.96 2.2 6.46 2.5 7.00 2.6 7.57 2.6 8.16
230 0.0 4.30 0.2 4.47 0.5 4.73 0.8 5.08 1.2 5.49 1.6 5.96 1.9 6.46 2.1 7.00 2.2 7.57 2.2 8.16
235 0.0 4.30 0.1 4.47 0.3 4.73 0.6 5.08 1.0 5.49 1.3 5.96 1.6 6.46 1.8 7.00 1.8 7.57 1.8 8.16
240 -0.1 4.30 0.0 4.47 0.2 4.73 0.5 5.08 0.7 5.49 1.0 5.96 1.3 6.46 1.4 7.00 1.4 7.57 1.3 8.16
245 -0.1 4.30 -0.1 4.47 0.1 4.73 0.3 5.08 0.5 5.49 0.8 5.96 1.0 6.46 1.1 7.00 1.0 7.57 0.9 8.16
250 -0.2 4.30 -0.2 4.47 -0.1 4.73 0.1 5.08 0.3 5.49 0.5 5.96 0.6 6.46 0.7 7.00 0.7 7.57 0.4 8.16
36(Gd 7)
180 0.6 4.30 1.3 4.47 2.1 4.73 2.9 5.08 3.7 5.49 4.5 5.96 5.2 6.46 5.7 7.00 6.1 7.57
185 0.6 4.30 1.2 4.47 2.0 4.73 2.7 5.08 3.5 5.49 4.2 5.96 4.9 6.46 5.4 7.00 5.7 7.57
190 0.5 4.30 1.1 4.47 1.8 4.73 2.6 5.08 3.3 5.49 4.0 5.96 4.6 6.46 5.0 7.00 5.3 7.57
195 0.5 4.30 1.1 4.47 1.7 4.73 2.4 5.08 3.1 5.49 3.7 5.96 4.3 6.46 4.7 7.00 4.9 7.57
200 0.4 4.30 1.0 4.47 1.6 4.73 2.2 5.08 2.9 5.49 3.4 5.96 3.9 6.46 4.3 7.00 4.5 7.57205 0.4 4.30 0.9 4.47 1.4 4.73 2.0 5.08 2.6 5.49 3.2 5.96 3.6 6.46 4.0 7.00 4.1 7.57
210 0.3 4.30 0.8 4.47 1.3 4.73 1.9 5.08 2.4 5.49 2.9 5.96 3.3 6.46 3.6 7.00 3.8 7.57
215 0.3 4.30 0.7 4.47 1.2 4.73 1.7 5.08 2.2 5.49 2.7 5.96 3.0 6.46 3.3 7.00 3.4 7.57
220 0.3 4.30 0.6 4.47 1.1 4.73 1.5 5.08 2.0 5.49 2.4 5.96 2.7 6.46 2.9 7.00 3.0 7.57
225 0.2 4.30 0.5 4.47 0.9 4.73 1.3 5.08 1.8 5.49 2.1 5.96 2.4 6.46 2.6 7.00 2.6 7.57
230 0.2 4.30 0.4 4.47 0.8 4.73 1.2 5.08 1.5 5.49 1.9 5.96 2.1 6.46 2.2 7.00 2.2 7.57
235 0.1 4.30 0.4 4.47 0.7 4.73 1.0 5.08 1.3 5.49 1.6 5.96 1.8 6.46 1.9 7.00 1.8 7.57
240 0.1 4.30 0.3 4.47 0.5 4.73 0.8 5.08 1.1 5.49 1.3 5.96 1.5 6.46 1.5 7.00 1.4 7.57
245 0.0 4.30 0.2 4.47 0.4 4.73 0.6 5.08 0.9 5.49 1.1 5.96 1.2 6.46 1.2 7.00 1.0 7.57
250 0.0 4.30 0.1 4.47 0.3 4.73 0.5 5.08 0.7 5.49 0.8 5.96 0.9 6.46 0.8 7.00 0.6 7.57
4 180 0.7 4.30 1.5 4.47 2.3 4.73 3.1 5.08 3.9 5.49 4.6 5.96 5.1 6.46 5.5 7.00
185 0.7 4.30 1.4 4.47 2.2 4.73 3.0 5.08 3.7 5.49 4.3 5.96 4.8 6.46 5.2 7.00
8/10/2019 n We a 2011 Norms Report
http://slidepdf.com/reader/full/n-we-a-2011-norms-report 164/268
148 | N W E A 2 0 1 1 R I T S c a l e N o r m s
Table C.18. Means (M) and Standard Deviations (sd ) of Academic Growth by Starting RIT Score and Starting Instructi onal Week forVarious End ing Ins truc tional Weeks - LANGUAGE USAGE, GRADE 8
Ending Instruction al Weeks
Start Prior Grd Focal Grade
Inst. Start 36 4 8 12 16 20 24 28 32 36
Wk RIT M sd M sd M sd M sd M sd M sd M sd M sd M sd M sd
190 0.6 4.30 1.3 4.47 2.1 4.73 2.8 5.08 3.5 5.49 4.0 5.96 4.5 6.46 4.8 7.00
195 0.6 4.30 1.2 4.47 1.9 4.73 2.6 5.08 3.2 5.49 3.8 5.96 4.2 6.46 4.5 7.00
200 0.5 4.30 1.2 4.47 1.8 4.73 2.4 5.08 3.0 5.49 3.5 5.96 3.9 6.46 4.1 7.00
205 0.5 4.30 1.1 4.47 1.7 4.73 2.2 5.08 2.8 5.49 3.3 5.96 3.6 6.46 3.8 7.00
210 0.5 4.30 1.0 4.47 1.5 4.73 2.1 5.08 2.6 5.49 3.0 5.96 3.3 6.46 3.4 7.00
215 0.4 4.30 0.9 4.47 1.4 4.73 1.9 5.08 2.4 5.49 2.7 5.96 3.0 6.46 3.1 7.00
220 0.4 4.30 0.8 4.47 1.3 4.73 1.7 5.08 2.1 5.49 2.5 5.96 2.7 6.46 2.7 7.00
225 0.3 4.30 0.7 4.47 1.1 4.73 1.5 5.08 1.9 5.49 2.2 5.96 2.4 6.46 2.4 7.00
230 0.3 4.30 0.6 4.47 1.0 4.73 1.4 5.08 1.7 5.49 1.9 5.96 2.1 6.46 2.0 7.00
235 0.2 4.30 0.5 4.47 0.9 4.73 1.2 5.08 1.5 5.49 1.7 5.96 1.7 6.46 1.7 7.00
240 0.2 4.30 0.4 4.47 0.7 4.73 1.0 5.08 1.3 5.49 1.4 5.96 1.4 6.46 1.3 7.00
245 0.1 4.30 0.4 4.47 0.6 4.73 0.8 5.08 1.0 5.49 1.1 5.96 1.1 6.46 1.0 7.00
250 0.1 4.30 0.3 4.47 0.5 4.73 0.7 5.08 0.8 5.49 0.9 5.96 0.8 6.46 0.6 7.00
8 185 0.7 4.30 1.5 4.47 2.3 4.73 3.0 5.08 3.6 5.49 4.1 5.96 4.5 6.46
190 0.7 4.30 1.4 4.47 2.2 4.73 2.8 5.08 3.4 5.49 3.9 5.96 4.2 6.46
195 0.7 4.30 1.3 4.47 2.0 4.73 2.7 5.08 3.2 5.49 3.6 5.96 3.9 6.46
200 0.6 4.30 1.3 4.47 1.9 4.73 2.5 5.08 3.0 5.49 3.4 5.96 3.6 6.46
205 0.6 4.30 1.2 4.47 1.8 4.73 2.3 5.08 2.8 5.49 3.1 5.96 3.3 6.46
210 0.5 4.30 1.1 4.47 1.6 4.73 2.1 5.08 2.5 5.49 2.8 5.96 3.0 6.46
215 0.5 4.30 1.0 4.47 1.5 4.73 1.9 5.08 2.3 5.49 2.6 5.96 2.7 6.46
220 0.4 4.30 0.9 4.47 1.4 4.73 1.8 5.08 2.1 5.49 2.3 5.96 2.3 6.46
225 0.4 4.30 0.8 4.47 1.2 4.73 1.6 5.08 1.9 5.49 2.0 5.96 2.0 6.46230 0.3 4.30 0.7 4.47 1.1 4.73 1.4 5.08 1.7 5.49 1.8 5.96 1.7 6.46
235 0.3 4.30 0.6 4.47 1.0 4.73 1.2 5.08 1.4 5.49 1.5 5.96 1.4 6.46
240 0.3 4.30 0.6 4.47 0.8 4.73 1.1 5.08 1.2 5.49 1.3 5.96 1.1 6.46
245 0.2 4.30 0.5 4.47 0.7 4.73 0.9 5.08 1.0 5.49 1.0 5.96 0.8 6.46
250 0.2 4.30 0.4 4.47 0.6 4.73 0.7 5.08 0.8 5.49 0.7 5.96 0.5 6.46
12 185 0.8 4.30 1.5 4.47 2.3 4.73 2.9 5.08 3.4 5.49 3.8 5.96
190 0.7 4.30 1.5 4.47 2.1 4.73 2.7 5.08 3.2 5.49 3.5 5.96
195 0.7 4.30 1.4 4.47 2.0 4.73 2.5 5.08 3.0 5.49 3.2 5.96
200 0.6 4.30 1.3 4.47 1.9 4.73 2.4 5.08 2.8 5.49 3.0 5.96
205 0.6 4.30 1.2 4.47 1.7 4.73 2.2 5.08 2.5 5.49 2.7 5.96
210 0.6 4.30 1.1 4.47 1.6 4.73 2.0 5.08 2.3 5.49 2.4 5.96
215 0.5 4.30 1.0 4.47 1.5 4.73 1.8 5.08 2.1 5.49 2.2 5.96

8/10/2019 n We a 2011 Norms Report
http://slidepdf.com/reader/full/n-we-a-2011-norms-report 165/268
N W E A 2 0 1 1 R I T S c a l e N o r m s | 149
Table C.18. Means (M) and Standard Deviations (sd ) of Academic Growth by Starting RIT Score and Starting Instructi onal Week forVarious End ing Ins truc tional Weeks - LANGUAGE USAGE, GRADE 8
Ending Instruction al Weeks
Start Prior Grd Focal Grade
Inst. Start 36 4 8 12 16 20 24 28 32 36
Wk RIT M sd M sd M sd M sd M sd M sd M sd M sd M sd M sd
220 0.5 4.30 0.9 4.47 1.3 4.73 1.7 5.08 1.9 5.49 1.9 5.96
225 0.4 4.30 0.8 4.47 1.2 4.73 1.5 5.08 1.7 5.49 1.7 5.96
230 0.4 4.30 0.8 4.47 1.1 4.73 1.3 5.08 1.4 5.49 1.4 5.96
235 0.3 4.30 0.7 4.47 0.9 4.73 1.1 5.08 1.2 5.49 1.1 5.96
240 0.3 4.30 0.6 4.47 0.8 4.73 1.0 5.08 1.0 5.49 0.9 5.96
245 0.3 4.30 0.5 4.47 0.7 4.73 0.8 5.08 0.8 5.49 0.6 5.96
250 0.2 4.30 0.4 4.47 0.6 4.73 0.6 5.08 0.6 5.49 0.3 5.96
16 185 0.8 4.30 1.5 4.47 2.1 4.73 2.6 5.08 3.0 5.49
190 0.7 4.30 1.4 4.47 2.0 4.73 2.5 5.08 2.8 5.49
195 0.7 4.30 1.3 4.47 1.9 4.73 2.3 5.08 2.5 5.49
200 0.6 4.30 1.2 4.47 1.7 4.73 2.1 5.08 2.3 5.49
205 0.6 4.30 1.1 4.47 1.6 4.73 1.9 5.08 2.1 5.49
210 0.6 4.30 1.1 4.47 1.5 4.73 1.8 5.08 1.9 5.49
215 0.5 4.30 1.0 4.47 1.3 4.73 1.6 5.08 1.7 5.49
220 0.5 4.30 0.9 4.47 1.2 4.73 1.4 5.08 1.5 5.49
225 0.4 4.30 0.8 4.47 1.1 4.73 1.2 5.08 1.2 5.49
230 0.4 4.30 0.7 4.47 0.9 4.73 1.1 5.08 1.0 5.49
235 0.3 4.30 0.6 4.47 0.8 4.73 0.9 5.08 0.8 5.49
240 0.3 4.30 0.5 4.47 0.7 4.73 0.7 5.08 0.6 5.49
245 0.2 4.30 0.4 4.47 0.5 4.73 0.5 5.08 0.4 5.49
250 0.2 4.30 0.3 4.47 0.4 4.73 0.4 5.08 0.1 5.49
20 185 0.7 4.30 1.4 4.47 1.9 4.73 2.2 5.08190 0.7 4.30 1.3 4.47 1.7 4.73 2.0 5.08
195 0.6 4.30 1.2 4.47 1.6 4.73 1.9 5.08
200 0.6 4.30 1.1 4.47 1.5 4.73 1.7 5.08
205 0.5 4.30 1.0 4.47 1.3 4.73 1.5 5.08
210 0.5 4.30 0.9 4.47 1.2 4.73 1.3 5.08
215 0.5 4.30 0.8 4.47 1.1 4.73 1.2 5.08
220 0.4 4.30 0.7 4.47 1.0 4.73 1.0 5.08
225 0.4 4.30 0.7 4.47 0.8 4.73 0.8 5.08
230 0.3 4.30 0.6 4.47 0.7 4.73 0.6 5.08
235 0.3 4.30 0.5 4.47 0.6 4.73 0.5 5.08
240 0.2 4.30 0.4 4.47 0.4 4.73 0.3 5.08
245 0.2 4.30 0.3 4.47 0.3 4.73 0.1 5.08
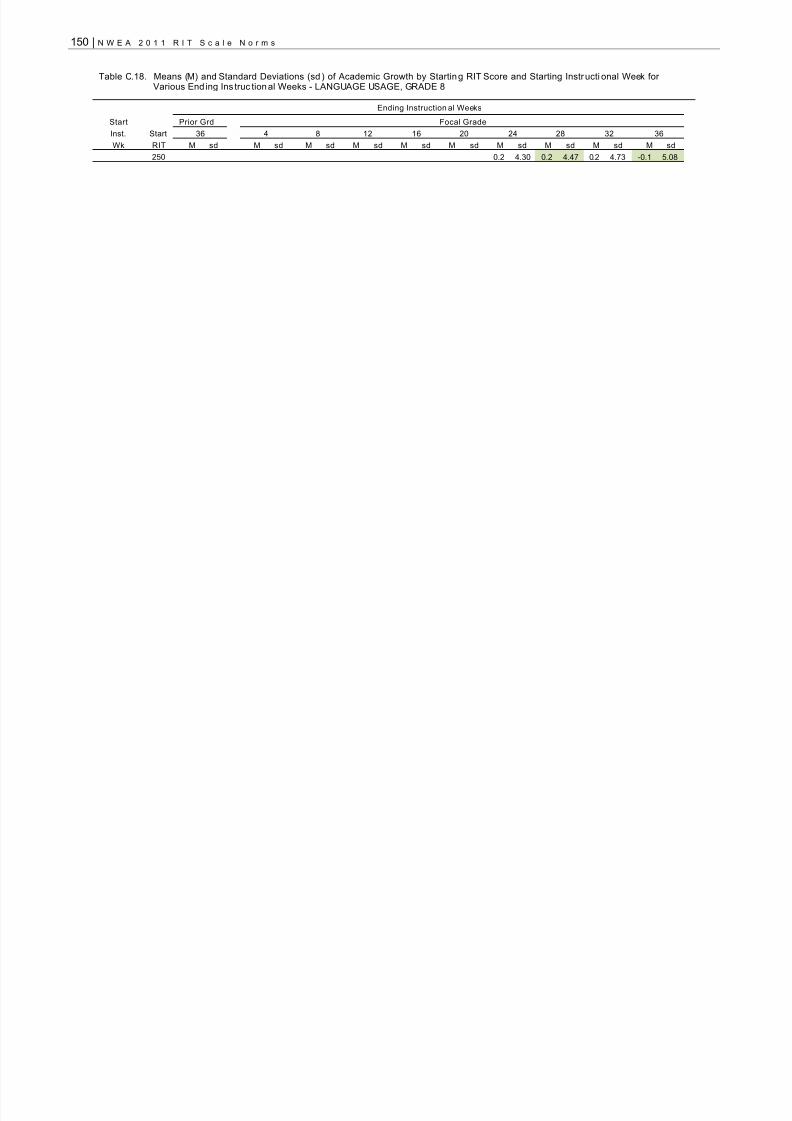
8/10/2019 n We a 2011 Norms Report
http://slidepdf.com/reader/full/n-we-a-2011-norms-report 166/268
150 | N W E A 2 0 1 1 R I T S c a l e N o r m s
Table C.18. Means (M) and Standard Deviations (sd ) of Academic Growth by Starting RIT Score and Starting Instructi onal Week forVarious End ing Ins truc tional Weeks - LANGUAGE USAGE, GRADE 8
Ending Instruction al Weeks
Start Prior Grd Focal Grade
Inst. Start 36 4 8 12 16 20 24 28 32 36
Wk RIT M sd M sd M sd M sd M sd M sd M sd M sd M sd M sd
250 0.2 4.30 0.2 4.47 0.2 4.73 -0.1 5.08

8/10/2019 n We a 2011 Norms Report
http://slidepdf.com/reader/full/n-we-a-2011-norms-report 167/268
N W E A 2 0 1 1 R I T S c a l e N o r m s | 151
Table C.19. Means (M) and Standard Deviations (sd) o f Academic Growth by Starting RIT Score and Starting Instru ctional Week forVarious Ending Instructional Weeks - LANGUAGE USAGE, GRADE 9
Table C.19. Means (M) and Standard Deviations (sd ) of Academic Growth by Starting RIT Score and Starting Instructi onal Week for VariousEnding Instructi onal Weeks - LANGUAGE USAGE, GRADE 9
Ending Instruction al Weeks
Start Prior Grd Focal Grade
Inst. Start 36 4 8 12 16 20 24 28 32 36
Wk RIT M sd M sd M sd M sd M sd M sd M sd M sd M sd M sd
32(Gd 8)
185 0.0 4.32 0.2 4.54 0.4 4.88 0.7 5.33 1.1 5.85 1.5 6.43 2.0 7.06 2.6 7.72 3.1 8.40 3.6 9.10
1900.0 4.32 0.1 4.54 0.3 4.88 0.6 5.33 0.9 5.85 1.4 6.43 1.8 7.06 2.3 7.72 2.8 8.40 3.3 9.10195 -0.1 4.32 0.0 4.54 0.2 4.88 0.4 5.33 0.8 5.85 1.2 6.43 1.6 7.06 2.0 7.72 2.5 8.40 3.0 9.10
200 -0.1 4.32 0.0 4.54 0.1 4.88 0.3 5.33 0.6 5.85 1.0 6.43 1.4 7.06 1.8 7.72 2.2 8.40 2.6 9.10
205 -0.1 4.32 -0.1 4.54 0.0 4.88 0.2 5.33 0.4 5.85 0.8 6.43 1.1 7.06 1.5 7.72 1.9 8.40 2.3 9.10
210 -0.1 4.32 -0.2 4.54 -0.1 4.88 0.1 5.33 0.3 5.85 0.6 6.43 0.9 7.06 1.2 7.72 1.6 8.40 2.0 9.10
215 -0.2 4.32 -0.2 4.54 -0.2 4.88 -0.1 5.33 0.1 5.85 0.4 6.43 0.7 7.06 1.0 7.72 1.3 8.40 1.7 9.10
220 -0.2 4.32 -0.3 4.54 -0.3 4.88 -0.2 5.33 -0.1 5.85 0.2 6.43 0.4 7.06 0.7 7.72 1.0 8.40 1.3 9.10
225 -0.2 4.32 -0.4 4.54 -0.4 4.88 -0.3 5.33 -0.2 5.85 0.0 6.43 0.2 7.06 0.5 7.72 0.7 8.40 1.0 9.10
230 -0.3 4.32 -0.4 4.54 -0.5 4.88 -0.5 5.33 -0.4 5.85 -0.2 6.43 0.0 7.06 0.2 7.72 0.4 8.40 0.7 9.10
235 -0.3 4.32 -0.5 4.54 -0.6 4.88 -0.6 5.33 -0.5 5.85 -0.4 6.43 -0.3 7.06 -0.1 7.72 0.1 8.40 0.3 9.10
240 -0.3 4.32 -0.6 4.54 -0.7 4.88 -0.7 5.33 -0.7 5.85 -0.6 6.43 -0.5 7.06 -0.3 7.72 -0.2 8.40 0.0 9.10
245 -0.4 4.32 -0.6 4.54 -0.8 4.88 -0.9 5.33 -0.9 5.85 -0.8 6.43 -0.7 7.06 -0.6 7.72 -0.5 8.40 -0.3 9.10
250 -0.4 4.32 -0.7 4.54 -0.9 4.88 -1.0 5.33 -1.0 5.85 -1.0 6.43 -0.9 7.06 -0.9 7.72 -0.7 8.40 -0.6 9.10
255 -0.4 4.32 -0.8 4.54 -1.0 4.88 -1.1 5.33 -1.2 5.85 -1.2 6.43 -1.2 7.06 -1.1 7.72 -1.0 8.40 -1.0 9.10
36(Gd 8)
185 0.1 4.32 0.4 4.54 0.7 4.88 1.1 5.33 1.5 5.85 2.0 6.43 2.5 7.06 3.1 7.72 3.6 8.40
190 0.1 4.32 0.3 4.54 0.6 4.88 1.0 5.33 1.4 5.85 1.8 6.43 2.3 7.06 2.8 7.72 3.3 8.40
195 0.1 4.32 0.2 4.54 0.5 4.88 0.8 5.33 1.2 5.85 1.6 6.43 2.1 7.06 2.5 7.72 3.0 8.40
200 0.0 4.32 0.2 4.54 0.4 4.88 0.7 5.33 1.0 5.85 1.4 6.43 1.9 7.06 2.3 7.72 2.7 8.40
205 0.0 4.32 0.1 4.54 0.3 4.88 0.6 5.33 0.9 5.85 1.2 6.43 1.6 7.06 2.0 7.72 2.4 8.40210 0.0 4.32 0.0 4.54 0.2 4.88 0.4 5.33 0.7 5.85 1.0 6.43 1.4 7.06 1.8 7.72 2.1 8.40
215 -0.1 4.32 0.0 4.54 0.1 4.88 0.3 5.33 0.5 5.85 0.8 6.43 1.2 7.06 1.5 7.72 1.8 8.40
220 -0.1 4.32 -0.1 4.54 0.0 4.88 0.2 5.33 0.4 5.85 0.6 6.43 0.9 7.06 1.2 7.72 1.5 8.40
225 -0.1 4.32 -0.2 4.54 -0.1 4.88 0.0 5.33 0.2 5.85 0.5 6.43 0.7 7.06 1.0 7.72 1.2 8.40
230 -0.2 4.32 -0.2 4.54 -0.2 4.88 -0.1 5.33 0.1 5.85 0.3 6.43 0.5 7.06 0.7 7.72 1.0 8.40
235 -0.2 4.32 -0.3 4.54 -0.3 4.88 -0.2 5.33 -0.1 5.85 0.1 6.43 0.2 7.06 0.5 7.72 0.7 8.40
240 -0.2 4.32 -0.4 4.54 -0.4 4.88 -0.4 5.33 -0.3 5.85 -0.1 6.43 0.0 7.06 0.2 7.72 0.4 8.40
245 -0.3 4.32 -0.4 4.54 -0.5 4.88 -0.5 5.33 -0.4 5.85 -0.3 6.43 -0.2 7.06 -0.1 7.72 0.1 8.40
250 -0.3 4.32 -0.5 4.54 -0.6 4.88 -0.6 5.33 -0.6 5.85 -0.5 6.43 -0.4 7.06 -0.3 7.72 -0.2 8.40
255 -0.3 4.32 -0.6 4.54 -0.7 4.88 -0.8 5.33 -0.8 5.85 -0.7 6.43 -0.7 7.06 -0.6 7.72 -0.5 8.40
4 185 0.2 4.32 0.6 4.54 0.9 4.88 1.4 5.33 1.9 5.85 2.4 6.43 2.9 7.06 3.5 7.72
190 0.2 4.32 0.5 4.54 0.9 4.88 1.3 5.33 1.7 5.85 2.2 6.43 2.7 7.06 3.2 7.72

8/10/2019 n We a 2011 Norms Report
http://slidepdf.com/reader/full/n-we-a-2011-norms-report 168/268
152 | N W E A 2 0 1 1 R I T S c a l e N o r m s
Table C.19. Means (M) and Standard Deviations (sd ) of Academic Growth by Starting RIT Score and Starting Instructi onal Week for VariousEnding Instructi onal Weeks - LANGUAGE USAGE, GRADE 9
Ending Instruction al Weeks
Start Prior Grd Focal Grade
Inst. Start 36 4 8 12 16 20 24 28 32 36
Wk RIT M sd M sd M sd M sd M sd M sd M sd M sd M sd M sd
195 0.2 4.32 0.4 4.54 0.8 4.88 1.1 5.33 1.6 5.85 2.0 6.43 2.5 7.06 2.9 7.72
200 0.1 4.32 0.4 4.54 0.7 4.88 1.0 5.33 1.4 5.85 1.8 6.43 2.2 7.06 2.7 7.72
205 0.1 4.32 0.3 4.54 0.6 4.88 0.9 5.33 1.2 5.85 1.6 6.43 2.0 7.06 2.4 7.72
210 0.1 4.32 0.2 4.54 0.5 4.88 0.7 5.33 1.1 5.85 1.4 6.43 1.8 7.06 2.2 7.72
215 0.0 4.32 0.2 4.54 0.4 4.88 0.6 5.33 0.9 5.85 1.2 6.43 1.6 7.06 1.9 7.72
220 0.0 4.32 0.1 4.54 0.3 4.88 0.5 5.33 0.7 5.85 1.0 6.43 1.3 7.06 1.6 7.72
225 0.0 4.32 0.0 4.54 0.2 4.88 0.4 5.33 0.6 5.85 0.8 6.43 1.1 7.06 1.4 7.72
230 -0.1 4.32 0.0 4.54 0.1 4.88 0.2 5.33 0.4 5.85 0.6 6.43 0.9 7.06 1.1 7.72
235 -0.1 4.32 -0.1 4.54 0.0 4.88 0.1 5.33 0.3 5.85 0.4 6.43 0.6 7.06 0.9 7.72
240 -0.1 4.32 -0.2 4.54 -0.1 4.88 -0.1 5.33 0.1 5.85 0.2 6.43 0.4 7.06 0.6 7.72
245 -0.2 4.32 -0.2 4.54 -0.2 4.88 -0.2 5.33 -0.1 5.85 0.1 6.43 0.2 7.06 0.3 7.72
250 -0.2 4.32 -0.3 4.54 -0.3 4.88 -0.3 5.33 -0.2 5.85 -0.2 6.43 0.0 7.06 0.1 7.72
255 -0.2 4.32 -0.4 4.54 -0.4 4.88 -0.4 5.33 -0.4 5.85 -0.4 6.43 -0.3 7.06 -0.2 7.72
8 185 0.3 4.32 0.7 4.54 1.2 4.88 1.7 5.33 2.2 5.85 2.7 6.43 3.2 7.06
190 0.3 4.32 0.6 4.54 1.1 4.88 1.5 5.33 2.0 5.85 2.5 6.43 3.0 7.06
195 0.3 4.32 0.6 4.54 1.0 4.88 1.4 5.33 1.8 5.85 2.3 6.43 2.8 7.06
200 0.2 4.32 0.5 4.54 0.9 4.88 1.3 5.33 1.7 5.85 2.1 6.43 2.5 7.06
205 0.2 4.32 0.5 4.54 0.8 4.88 1.1 5.33 1.5 5.85 1.9 6.43 2.3 7.06
210 0.2 4.32 0.4 4.54 0.7 4.88 1.0 5.33 1.4 5.85 1.7 6.43 2.1 7.06
215 0.1 4.32 0.3 4.54 0.6 4.88 0.9 5.33 1.2 5.85 1.5 6.43 1.9 7.06
220 0.1 4.32 0.3 4.54 0.5 4.88 0.7 5.33 1.0 5.85 1.3 6.43 1.6 7.06
225 0.1 4.32 0.2 4.54 0.4 4.88 0.6 5.33 0.9 5.85 1.1 6.43 1.4 7.06230 0.0 4.32 0.1 4.54 0.3 4.88 0.5 5.33 0.7 5.85 0.9 6.43 1.2 7.06
235 0.0 4.32 0.1 4.54 0.2 4.88 0.3 5.33 0.5 5.85 0.7 6.43 0.9 7.06
240 0.0 4.32 0.0 4.54 0.1 4.88 0.2 5.33 0.4 5.85 0.5 6.43 0.7 7.06
245 -0.1 4.32 -0.1 4.54 0.0 4.88 0.1 5.33 0.2 5.85 0.3 6.43 0.5 7.06
250 -0.1 4.32 -0.1 4.54 -0.1 4.88 -0.1 5.33 0.0 5.85 0.2 6.43 0.3 7.06
255 -0.1 4.32 -0.2 4.54 -0.2 4.88 -0.2 5.33 -0.1 5.85 -0.1 6.43 0.0 7.06
12 185 0.4 4.32 0.8 4.54 1.3 4.88 1.9 5.33 2.4 5.85 2.9 6.43
190 0.4 4.32 0.8 4.54 1.2 4.88 1.7 5.33 2.2 5.85 2.7 6.43
195 0.3 4.32 0.7 4.54 1.1 4.88 1.6 5.33 2.1 5.85 2.5 6.43
200 0.3 4.32 0.6 4.54 1.0 4.88 1.5 5.33 1.9 5.85 2.3 6.43
205 0.3 4.32 0.6 4.54 0.9 4.88 1.3 5.33 1.7 5.85 2.1 6.43
210 0.2 4.32 0.5 4.54 0.8 4.88 1.2 5.33 1.6 5.85 1.9 6.43

8/10/2019 n We a 2011 Norms Report
http://slidepdf.com/reader/full/n-we-a-2011-norms-report 169/268
N W E A 2 0 1 1 R I T S c a l e N o r m s | 153
Table C.19. Means (M) and Standard Deviations (sd ) of Academic Growth by Starting RIT Score and Starting Instructi onal Week for VariousEnding Instructi onal Weeks - LANGUAGE USAGE, GRADE 9
Ending Instruction al Weeks
Start Prior Grd Focal Grade
Inst. Start 36 4 8 12 16 20 24 28 32 36
Wk RIT M sd M sd M sd M sd M sd M sd M sd M sd M sd M sd
215 0.2 4.32 0.5 4.54 0.7 4.88 1.1 5.33 1.4 5.85 1.7 6.43
220 0.2 4.32 0.4 4.54 0.6 4.88 0.9 5.33 1.2 5.85 1.5 6.43
225 0.1 4.32 0.3 4.54 0.5 4.88 0.8 5.33 1.1 5.85 1.3 6.43
230 0.1 4.32 0.3 4.54 0.5 4.88 0.7 5.33 0.9 5.85 1.1 6.43
235 0.1 4.32 0.2 4.54 0.4 4.88 0.5 5.33 0.7 5.85 1.0 6.43
240 0.0 4.32 0.1 4.54 0.3 4.88 0.4 5.33 0.6 5.85 0.8 6.43
245 0.0 4.32 0.1 4.54 0.2 4.88 0.3 5.33 0.4 5.85 0.6 6.43
250 0.0 4.32 0.0 4.54 0.1 4.88 0.2 5.33 0.3 5.85 0.4 6.43
255 -0.1 4.32 -0.1 4.54 0.0 4.88 0.0 5.33 0.1 5.85 0.2 6.43
16 185 0.5 4.32 0.9 4.54 1.5 4.88 2.0 5.33 2.5 5.85
190 0.4 4.32 0.9 4.54 1.4 4.88 1.9 5.33 2.4 5.85
195 0.4 4.32 0.8 4.54 1.3 4.88 1.7 5.33 2.2 5.85
200 0.4 4.32 0.7 4.54 1.2 4.88 1.6 5.33 2.0 5.85
205 0.3 4.32 0.7 4.54 1.1 4.88 1.5 5.33 1.9 5.85
210 0.3 4.32 0.6 4.54 1.0 4.88 1.3 5.33 1.7 5.85
215 0.3 4.32 0.6 4.54 0.9 4.88 1.2 5.33 1.5 5.85
220 0.2 4.32 0.5 4.54 0.8 4.88 1.1 5.33 1.4 5.85
225 0.2 4.32 0.4 4.54 0.7 4.88 0.9 5.33 1.2 5.85
230 0.2 4.32 0.4 4.54 0.6 4.88 0.8 5.33 1.1 5.85
235 0.1 4.32 0.3 4.54 0.5 4.88 0.7 5.33 0.9 5.85
240 0.1 4.32 0.2 4.54 0.4 4.88 0.6 5.33 0.7 5.85
245 0.1 4.32 0.2 4.54 0.3 4.88 0.4 5.33 0.6 5.85250 0.0 4.32 0.1 4.54 0.2 4.88 0.3 5.33 0.4 5.85
255 0.0 4.32 0.0 4.54 0.1 4.88 0.2 5.33 0.2 5.85
20 185 0.5 4.32 1.0 4.54 1.5 4.88 2.1 5.33
190 0.5 4.32 0.9 4.54 1.4 4.88 1.9 5.33
195 0.4 4.32 0.9 4.54 1.3 4.88 1.8 5.33
200 0.4 4.32 0.8 4.54 1.3 4.88 1.7 5.33
205 0.4 4.32 0.8 4.54 1.2 4.88 1.6 5.33
210 0.3 4.32 0.7 4.54 1.1 4.88 1.4 5.33
215 0.3 4.32 0.6 4.54 1.0 4.88 1.3 5.33
220 0.3 4.32 0.6 4.54 0.9 4.88 1.2 5.33
225 0.2 4.32 0.5 4.54 0.8 4.88 1.0 5.33
230 0.2 4.32 0.4 4.54 0.7 4.88 0.9 5.33

8/10/2019 n We a 2011 Norms Report
http://slidepdf.com/reader/full/n-we-a-2011-norms-report 170/268
154 | N W E A 2 0 1 1 R I T S c a l e N o r m s
Table C.19. Means (M) and Standard Deviations (sd ) of Academic Growth by Starting RIT Score and Starting Instructi onal Week for VariousEnding Instructi onal Weeks - LANGUAGE USAGE, GRADE 9
Ending Instruction al Weeks
Start Prior Grd Focal Grade
Inst. Start 36 4 8 12 16 20 24 28 32 36
Wk RIT M sd M sd M sd M sd M sd M sd M sd M sd M sd M sd
235 0.2 4.32 0.4 4.54 0.6 4.88 0.8 5.33
240 0.1 4.32 0.3 4.54 0.5 4.88 0.6 5.33
245 0.1 4.32 0.2 4.54 0.4 4.88 0.5 5.33
250 0.1 4.32 0.2 4.54 0.3 4.88 0.4 5.33
255 0.0 4.32 0.1 4.54 0.2 4.88 0.2 5.33
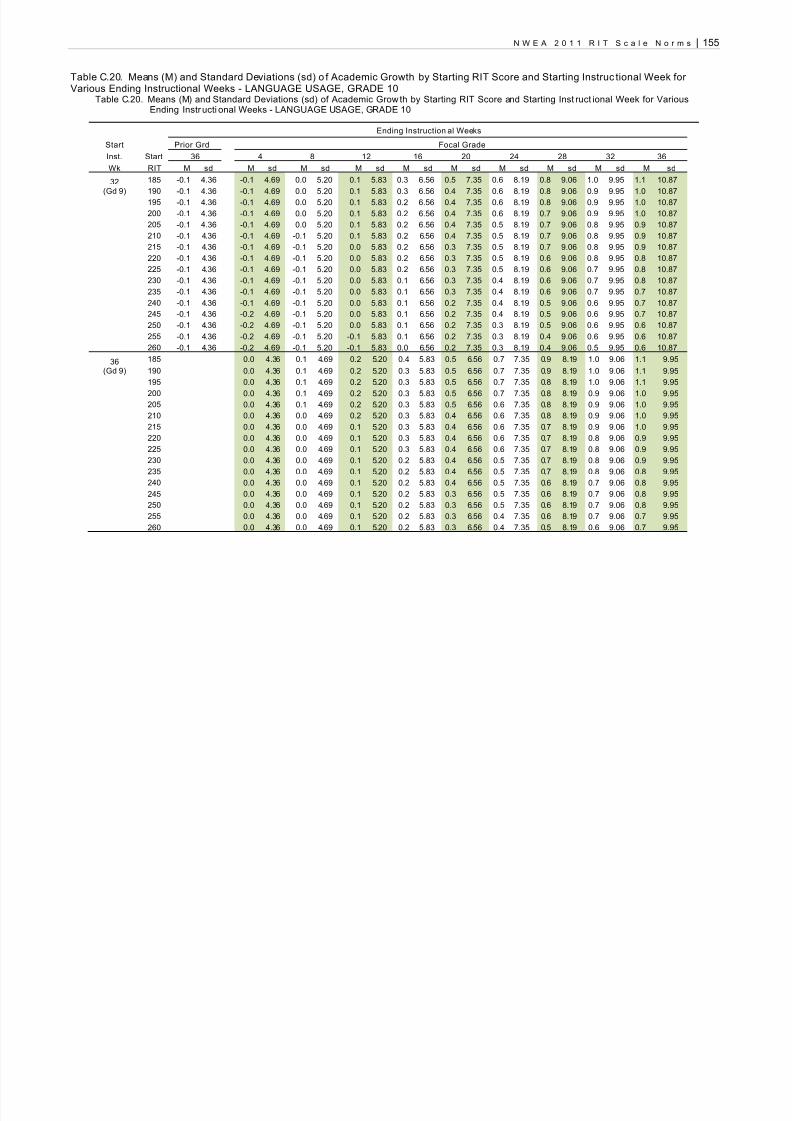
8/10/2019 n We a 2011 Norms Report
http://slidepdf.com/reader/full/n-we-a-2011-norms-report 171/268
N W E A 2 0 1 1 R I T S c a l e N o r m s | 155
Table C.20. Means (M) and Standard Deviations (sd) o f Academic Growth by Starting RIT Score and Starting Instruc tional Week forVarious Ending Instructional Weeks - LANGUAGE USAGE, GRADE 10
Table C.20. Means (M) and Standard Deviations (sd) of Academic Grow th by Starting RIT Score and Starting Inst ruct ional Week for VariousEnding Instructi onal Weeks - LANGUAGE USAGE, GRADE 10
Ending Instruction al Weeks
Start Prior Grd Focal Grade
Inst. Start 36 4 8 12 16 20 24 28 32 36
Wk RIT M sd M sd M sd M sd M sd M sd M sd M sd M sd M sd
32(Gd 9)
185 -0.1 4.36 -0.1 4.69 0.0 5.20 0.1 5.83 0.3 6.56 0.5 7.35 0.6 8.19 0.8 9.06 1.0 9.95 1.1 10.87
190-0.1 4.36 -0.1 4.69 0.0 5.20 0.1 5.83 0.3 6.56 0.4 7.35 0.6 8.19 0.8 9.06 0.9 9.95 1.0 10.87195 -0.1 4.36 -0.1 4.69 0.0 5.20 0.1 5.83 0.2 6.56 0.4 7.35 0.6 8.19 0.8 9.06 0.9 9.95 1.0 10.87
200 -0.1 4.36 -0.1 4.69 0.0 5.20 0.1 5.83 0.2 6.56 0.4 7.35 0.6 8.19 0.7 9.06 0.9 9.95 1.0 10.87
205 -0.1 4.36 -0.1 4.69 0.0 5.20 0.1 5.83 0.2 6.56 0.4 7.35 0.5 8.19 0.7 9.06 0.8 9.95 0.9 10.87
210 -0.1 4.36 -0.1 4.69 -0.1 5.20 0.1 5.83 0.2 6.56 0.4 7.35 0.5 8.19 0.7 9.06 0.8 9.95 0.9 10.87
215 -0.1 4.36 -0.1 4.69 -0.1 5.20 0.0 5.83 0.2 6.56 0.3 7.35 0.5 8.19 0.7 9.06 0.8 9.95 0.9 10.87
220 -0.1 4.36 -0.1 4.69 -0.1 5.20 0.0 5.83 0.2 6.56 0.3 7.35 0.5 8.19 0.6 9.06 0.8 9.95 0.8 10.87
225 -0.1 4.36 -0.1 4.69 -0.1 5.20 0.0 5.83 0.2 6.56 0.3 7.35 0.5 8.19 0.6 9.06 0.7 9.95 0.8 10.87
230 -0.1 4.36 -0.1 4.69 -0.1 5.20 0.0 5.83 0.1 6.56 0.3 7.35 0.4 8.19 0.6 9.06 0.7 9.95 0.8 10.87
235 -0.1 4.36 -0.1 4.69 -0.1 5.20 0.0 5.83 0.1 6.56 0.3 7.35 0.4 8.19 0.6 9.06 0.7 9.95 0.7 10.87
240 -0.1 4.36 -0.1 4.69 -0.1 5.20 0.0 5.83 0.1 6.56 0.2 7.35 0.4 8.19 0.5 9.06 0.6 9.95 0.7 10.87
245 -0.1 4.36 -0.2 4.69 -0.1 5.20 0.0 5.83 0.1 6.56 0.2 7.35 0.4 8.19 0.5 9.06 0.6 9.95 0.7 10.87
250 -0.1 4.36 -0.2 4.69 -0.1 5.20 0.0 5.83 0.1 6.56 0.2 7.35 0.3 8.19 0.5 9.06 0.6 9.95 0.6 10.87
255 -0.1 4.36 -0.2 4.69 -0.1 5.20 -0.1 5.83 0.1 6.56 0.2 7.35 0.3 8.19 0.4 9.06 0.6 9.95 0.6 10.87
260 -0.1 4.36 -0.2 4.69 -0.1 5.20 -0.1 5.83 0.0 6.56 0.2 7.35 0.3 8.19 0.4 9.06 0.5 9.95 0.6 10.87
36(Gd 9)
185 0.0 4.36 0.1 4.69 0.2 5.20 0.4 5.83 0.5 6.56 0.7 7.35 0.9 8.19 1.0 9.06 1.1 9.95
190 0.0 4.36 0.1 4.69 0.2 5.20 0.3 5.83 0.5 6.56 0.7 7.35 0.9 8.19 1.0 9.06 1.1 9.95
195 0.0 4.36 0.1 4.69 0.2 5.20 0.3 5.83 0.5 6.56 0.7 7.35 0.8 8.19 1.0 9.06 1.1 9.95
200 0.0 4.36 0.1 4.69 0.2 5.20 0.3 5.83 0.5 6.56 0.7 7.35 0.8 8.19 0.9 9.06 1.0 9.95205 0.0 4.36 0.1 4.69 0.2 5.20 0.3 5.83 0.5 6.56 0.6 7.35 0.8 8.19 0.9 9.06 1.0 9.95
210 0.0 4.36 0.0 4.69 0.2 5.20 0.3 5.83 0.4 6.56 0.6 7.35 0.8 8.19 0.9 9.06 1.0 9.95
215 0.0 4.36 0.0 4.69 0.1 5.20 0.3 5.83 0.4 6.56 0.6 7.35 0.7 8.19 0.9 9.06 1.0 9.95
220 0.0 4.36 0.0 4.69 0.1 5.20 0.3 5.83 0.4 6.56 0.6 7.35 0.7 8.19 0.8 9.06 0.9 9.95
225 0.0 4.36 0.0 4.69 0.1 5.20 0.3 5.83 0.4 6.56 0.6 7.35 0.7 8.19 0.8 9.06 0.9 9.95
230 0.0 4.36 0.0 4.69 0.1 5.20 0.2 5.83 0.4 6.56 0.5 7.35 0.7 8.19 0.8 9.06 0.9 9.95
235 0.0 4.36 0.0 4.69 0.1 5.20 0.2 5.83 0.4 6.56 0.5 7.35 0.7 8.19 0.8 9.06 0.8 9.95
240 0.0 4.36 0.0 4.69 0.1 5.20 0.2 5.83 0.4 6.56 0.5 7.35 0.6 8.19 0.7 9.06 0.8 9.95
245 0.0 4.36 0.0 4.69 0.1 5.20 0.2 5.83 0.3 6.56 0.5 7.35 0.6 8.19 0.7 9.06 0.8 9.95
250 0.0 4.36 0.0 4.69 0.1 5.20 0.2 5.83 0.3 6.56 0.5 7.35 0.6 8.19 0.7 9.06 0.8 9.95
255 0.0 4.36 0.0 4.69 0.1 5.20 0.2 5.83 0.3 6.56 0.4 7.35 0.6 8.19 0.7 9.06 0.7 9.95
260 0.0 4.36 0.0 4.69 0.1 5.20 0.2 5.83 0.3 6.56 0.4 7.35 0.5 8.19 0.6 9.06 0.7 9.95

8/10/2019 n We a 2011 Norms Report
http://slidepdf.com/reader/full/n-we-a-2011-norms-report 172/268
156 | N W E A 2 0 1 1 R I T S c a l e N o r m s
Table C.20. Means (M) and Standard Deviations (sd) of Academic Grow th by Starting RIT Score and Starting Inst ruct ional Week for VariousEnding Instructi onal Weeks - LANGUAGE USAGE, GRADE 10
Ending Instruction al Weeks
Start Prior Grd Focal Grade
Inst. Start 36 4 8 12 16 20 24 28 32 36
Wk RIT M sd M sd M sd M sd M sd M sd M sd M sd M sd M sd
4 185 0.1 4.36 0.2 4.69 0.3 5.20 0.5 5.83 0.7 6.56 0.9 7.35 1.0 8.19 1.1 9.06
190 0.1 4.36 0.2 4.69 0.3 5.20 0.5 5.83 0.7 6.56 0.9 7.35 1.0 8.19 1.1 9.06
195 0.1 4.36 0.2 4.69 0.3 5.20 0.5 5.83 0.7 6.56 0.8 7.35 1.0 8.19 1.1 9.06
200 0.1 4.36 0.2 4.69 0.3 5.20 0.5 5.83 0.7 6.56 0.8 7.35 1.0 8.19 1.1 9.06
205 0.1 4.36 0.2 4.69 0.3 5.20 0.5 5.83 0.6 6.56 0.8 7.35 0.9 8.19 1.0 9.06
210 0.1 4.36 0.2 4.69 0.3 5.20 0.5 5.83 0.6 6.56 0.8 7.35 0.9 8.19 1.0 9.06
215 0.1 4.36 0.2 4.69 0.3 5.20 0.4 5.83 0.6 6.56 0.8 7.35 0.9 8.19 1.0 9.06
220 0.1 4.36 0.1 4.69 0.3 5.20 0.4 5.83 0.6 6.56 0.7 7.35 0.9 8.19 0.9 9.06
225 0.0 4.36 0.1 4.69 0.3 5.20 0.4 5.83 0.6 6.56 0.7 7.35 0.8 8.19 0.9 9.06
230 0.0 4.36 0.1 4.69 0.3 5.20 0.4 5.83 0.6 6.56 0.7 7.35 0.8 8.19 0.9 9.06
235 0.0 4.36 0.1 4.69 0.3 5.20 0.4 5.83 0.5 6.56 0.7 7.35 0.8 8.19 0.9 9.06
240 0.0 4.36 0.1 4.69 0.2 5.20 0.4 5.83 0.5 6.56 0.7 7.35 0.8 8.19 0.8 9.06
245 0.0 4.36 0.1 4.69 0.2 5.20 0.4 5.83 0.5 6.56 0.6 7.35 0.8 8.19 0.8 9.06
250 0.0 4.36 0.1 4.69 0.2 5.20 0.4 5.83 0.5 6.56 0.6 7.35 0.7 8.19 0.8 9.06
255 0.0 4.36 0.1 4.69 0.2 5.20 0.3 5.83 0.5 6.56 0.6 7.35 0.7 8.19 0.8 9.06
260 0.0 4.36 0.1 4.69 0.2 5.20 0.3 5.83 0.5 6.56 0.6 7.35 0.7 8.19 0.7 9.06
8 185 0.1 4.36 0.3 4.69 0.5 5.20 0.6 5.83 0.8 6.56 0.9 7.35 1.1 8.19
190 0.1 4.36 0.3 4.69 0.4 5.20 0.6 5.83 0.8 6.56 0.9 7.35 1.0 8.19
195 0.1 4.36 0.3 4.69 0.4 5.20 0.6 5.83 0.8 6.56 0.9 7.35 1.0 8.19
200 0.1 4.36 0.3 4.69 0.4 5.20 0.6 5.83 0.8 6.56 0.9 7.35 1.0 8.19
205 0.1 4.36 0.3 4.69 0.4 5.20 0.6 5.83 0.7 6.56 0.9 7.35 1.0 8.19
210 0.1 4.36 0.2 4.69 0.4 5.20 0.6 5.83 0.7 6.56 0.9 7.35 0.9 8.19215 0.1 4.36 0.2 4.69 0.4 5.20 0.6 5.83 0.7 6.56 0.8 7.35 0.9 8.19
220 0.1 4.36 0.2 4.69 0.4 5.20 0.5 5.83 0.7 6.56 0.8 7.35 0.9 8.19
225 0.1 4.36 0.2 4.69 0.4 5.20 0.5 5.83 0.7 6.56 0.8 7.35 0.9 8.19
230 0.1 4.36 0.2 4.69 0.4 5.20 0.5 5.83 0.7 6.56 0.8 7.35 0.9 8.19
235 0.1 4.36 0.2 4.69 0.4 5.20 0.5 5.83 0.6 6.56 0.8 7.35 0.8 8.19
240 0.1 4.36 0.2 4.69 0.3 5.20 0.5 5.83 0.6 6.56 0.7 7.35 0.8 8.19
245 0.1 4.36 0.2 4.69 0.3 5.20 0.5 5.83 0.6 6.56 0.7 7.35 0.8 8.19
250 0.1 4.36 0.2 4.69 0.3 5.20 0.5 5.83 0.6 6.56 0.7 7.35 0.8 8.19
255 0.1 4.36 0.2 4.69 0.3 5.20 0.5 5.83 0.6 6.56 0.7 7.35 0.7 8.19
260 0.1 4.36 0.2 4.69 0.3 5.20 0.4 5.83 0.6 6.56 0.7 7.35 0.7 8.19
12 185 0.2 4.36 0.3 4.69 0.5 5.20 0.7 5.83 0.8 6.56 0.9 7.35
190 0.2 4.36 0.3 4.69 0.5 5.20 0.7 5.83 0.8 6.56 0.9 7.35

8/10/2019 n We a 2011 Norms Report
http://slidepdf.com/reader/full/n-we-a-2011-norms-report 173/268
N W E A 2 0 1 1 R I T S c a l e N o r m s | 157
Table C.20. Means (M) and Standard Deviations (sd) of Academic Grow th by Starting RIT Score and Starting Inst ruct ional Week for VariousEnding Instructi onal Weeks - LANGUAGE USAGE, GRADE 10
Ending Instruction al Weeks
Start Prior Grd Focal Grade
Inst. Start 36 4 8 12 16 20 24 28 32 36
Wk RIT M sd M sd M sd M sd M sd M sd M sd M sd M sd M sd
195 0.2 4.36 0.3 4.69 0.5 5.20 0.7 5.83 0.8 6.56 0.9 7.35
200 0.2 4.36 0.3 4.69 0.5 5.20 0.6 5.83 0.8 6.56 0.9 7.35
205 0.1 4.36 0.3 4.69 0.5 5.20 0.6 5.83 0.8 6.56 0.9 7.35
210 0.1 4.36 0.3 4.69 0.5 5.20 0.6 5.83 0.8 6.56 0.8 7.35
215 0.1 4.36 0.3 4.69 0.5 5.20 0.6 5.83 0.7 6.56 0.8 7.35
220 0.1 4.36 0.3 4.69 0.4 5.20 0.6 5.83 0.7 6.56 0.8 7.35
225 0.1 4.36 0.3 4.69 0.4 5.20 0.6 5.83 0.7 6.56 0.8 7.35
230 0.1 4.36 0.3 4.69 0.4 5.20 0.6 5.83 0.7 6.56 0.8 7.35
235 0.1 4.36 0.3 4.69 0.4 5.20 0.6 5.83 0.7 6.56 0.7 7.35
240 0.1 4.36 0.3 4.69 0.4 5.20 0.5 5.83 0.7 6.56 0.7 7.35
245 0.1 4.36 0.3 4.69 0.4 5.20 0.5 5.83 0.6 6.56 0.7 7.35
250 0.1 4.36 0.3 4.69 0.4 5.20 0.5 5.83 0.6 6.56 0.7 7.35
255 0.1 4.36 0.2 4.69 0.4 5.20 0.5 5.83 0.6 6.56 0.7 7.35
260 0.1 4.36 0.2 4.69 0.4 5.20 0.5 5.83 0.6 6.56 0.7 7.35
16 185 0.2 4.36 0.4 4.69 0.5 5.20 0.7 5.83 0.8 6.56
190 0.2 4.36 0.4 4.69 0.5 5.20 0.7 5.83 0.8 6.56
195 0.2 4.36 0.3 4.69 0.5 5.20 0.7 5.83 0.8 6.56
200 0.2 4.36 0.3 4.69 0.5 5.20 0.6 5.83 0.7 6.56
205 0.2 4.36 0.3 4.69 0.5 5.20 0.6 5.83 0.7 6.56
210 0.2 4.36 0.3 4.69 0.5 5.20 0.6 5.83 0.7 6.56
215 0.2 4.36 0.3 4.69 0.5 5.20 0.6 5.83 0.7 6.56
220 0.2 4.36 0.3 4.69 0.5 5.20 0.6 5.83 0.7 6.56225 0.2 4.36 0.3 4.69 0.5 5.20 0.6 5.83 0.7 6.56
230 0.2 4.36 0.3 4.69 0.4 5.20 0.6 5.83 0.6 6.56
235 0.1 4.36 0.3 4.69 0.4 5.20 0.5 5.83 0.6 6.56
240 0.1 4.36 0.3 4.69 0.4 5.20 0.5 5.83 0.6 6.56
245 0.1 4.36 0.3 4.69 0.4 5.20 0.5 5.83 0.6 6.56
250 0.1 4.36 0.3 4.69 0.4 5.20 0.5 5.83 0.6 6.56
255 0.1 4.36 0.3 4.69 0.4 5.20 0.5 5.83 0.6 6.56
260 0.1 4.36 0.3 4.69 0.4 5.20 0.5 5.83 0.5 6.56
20 185 0.2 4.36 0.4 4.69 0.5 5.20 0.6 5.83
190 0.2 4.36 0.3 4.69 0.5 5.20 0.6 5.83
195 0.2 4.36 0.3 4.69 0.5 5.20 0.6 5.83
200 0.2 4.36 0.3 4.69 0.5 5.20 0.6 5.83

8/10/2019 n We a 2011 Norms Report
http://slidepdf.com/reader/full/n-we-a-2011-norms-report 174/268
158 | N W E A 2 0 1 1 R I T S c a l e N o r m s
Table C.20. Means (M) and Standard Deviations (sd) of Academic Grow th by Starting RIT Score and Starting Inst ruct ional Week for VariousEnding Instructi onal Weeks - LANGUAGE USAGE, GRADE 10
Ending Instruction al Weeks
Start Prior Grd Focal Grade
Inst. Start 36 4 8 12 16 20 24 28 32 36
Wk RIT M sd M sd M sd M sd M sd M sd M sd M sd M sd M sd
205 0.2 4.36 0.3 4.69 0.5 5.20 0.6 5.83
210 0.2 4.36 0.3 4.69 0.5 5.20 0.5 5.83
215 0.2 4.36 0.3 4.69 0.4 5.20 0.5 5.83
220 0.2 4.36 0.3 4.69 0.4 5.20 0.5 5.83
225 0.2 4.36 0.3 4.69 0.4 5.20 0.5 5.83
230 0.2 4.36 0.3 4.69 0.4 5.20 0.5 5.83
235 0.2 4.36 0.3 4.69 0.4 5.20 0.5 5.83
240 0.1 4.36 0.3 4.69 0.4 5.20 0.5 5.83
245 0.1 4.36 0.3 4.69 0.4 5.20 0.5 5.83
250 0.1 4.36 0.3 4.69 0.4 5.20 0.4 5.83
255 0.1 4.36 0.3 4.69 0.4 5.20 0.4 5.83
260 0.1 4.36 0.3 4.69 0.4 5.20 0.4 5.83

8/10/2019 n We a 2011 Norms Report
http://slidepdf.com/reader/full/n-we-a-2011-norms-report 175/268
N W E A 2 0 1 1 R I T S c a l e N o r m s | 159
Table C.21. Means (M) and Standard Deviations (sd ) of Academic Growt h by Starting RIT Score and Starting Inst ruction al Week forVarious Ending Instructional Weeks - MATHEMATICS, KINDERGARTENTable C.21. Means (M) and Standard Deviations (sd ) of Academic Growth by Starting RIT Score and Starting Instr ucti onal Week for VariousEnding Instru ctional Weeks - MATHEMATICS, KINDERGARTEN
Ending Instruction al Weeks
StartPriorGrd Focal Grade
Inst. Start 36 4 8 12 16 20 24 28 32 36
Wk RIT M sd M sd M sd M sd M sd M sd M sd M sd M sd M sd
4 120 2.9 4.38 6.0 4.77 9.1 5.35 12.3 6.08 15.4 6.90 18.4 7.78 21.0 8.72 23.3 9.68
125 2.8 4.38 5.7 4.77 8.8 5.35 11.8 6.08 14.8 6.90 17.6 7 .78 20.2 8.72 22.3 9.68
130 2.6 4.38 5.5 4.77 8.4 5.35 11.4 6.08 14.2 6.90 16.9 7 .78 19.3 8.72 21.4 9.68
135 2.5 4.38 5.2 4.77 8.0 5.35 10.9 6.08 13.6 6.90 16.2 7 .78 18.5 8.72 20.4 9.68
140 2.4 4.38 5.0 4.77 7.7 5.35 10.4 6.08 13.0 6.90 15.4 7.78 17.6 8.72 19.4 9.68
145 2.3 4.38 4.7 4.77 7.3 5.35 9.9 6.08 12.4 6.90 14.7 7.78 16.8 8.72 18.4 9.68
150 2.2 4.38 4.5 4.77 7.0 5.35 9.4 6.08 11.8 6.90 14.0 7.78 15.9 8.72 17.5 9.68
155 2.0 4.38 4.3 4.77 6.6 5.35 8.9 6.08 11.2 6.90 13.3 7.78 15.1 8.72 16.5 9.68
160 1.9 4.38 4.0 4.77 6.2 5.35 8.4 6.08 10.6 6.90 12.5 7.78 14.2 8.72 15.5 9.68
165 1.8 4.38 3.8 4.77 5.9 5.35 8.0 6.08 10.0 6.90 11.8 7.78 13.4 8.72 14.5 9.68
170 1.7 4.38 3.5 4.77 5.5 5.35 7.5 6.08 9.4 6.90 11.1 7.78 12.5 8.72 13.6 9.68
175 1.5 4.38 3.3 4.77 5.1 5.35 7.0 6.08 8.7 6.90 10.3 7.78 11.6 8.72 12.6 9.68
180 1.4 4.38 3.0 4.77 4.8 5.35 6.5 6.08 8.1 6.90 9.6 7.78 10.8 8.72 11.6 9.68
185 1.3 4.38 2.8 4.77 4.4 5.35 6.0 6.08 7.5 6.90 8.9 7.78 9.9 8.72 10.6 9.68
190 1.2 4.38 2.5 4.77 4.0 5.35 5.5 6.08 6.9 6.90 8.1 7.78 9.1 8.72 9.7 9.68
195 1.1 4.38 2.3 4.77 3.7 5.35 5.0 6.08 6.3 6.90 7.4 7.78 8.2 8.72 8.7 9.68
200 0.9 4.38 2.1 4.77 3.3 5.35 4.5 6.08 5.7 6.90 6.7 7.78 7.4 8.72 7.7 9.68
8 120 3.1 4.38 6.3 4.77 9.5 5.35 12.6 6.08 15.5 6.90 18.1 7.78 20.4 8.72
125 3.0 4.38 6.0 4.77 9.1 5.35 12.1 6.08 14.9 6.90 17.4 7.78 19.6 8.72130 2.8 4.38 5.8 4.77 8.7 5.35 11.6 6.08 14.3 6.90 16.7 7.78 18.7 8.72
135 2.7 4.38 5.5 4.77 8.4 5.35 11.1 6.08 13.7 6.90 16.0 7.78 17.9 8.72
140 2.6 4.38 5.3 4.77 8.0 5.35 10.6 6.08 13.1 6.90 15.2 7.78 17.0 8.72
145 2.5 4.38 5.0 4.77 7.6 5.35 10.1 6.08 12.5 6.90 14.5 7.78 16.2 8.72
150 2.4 4.38 4.8 4.77 7.3 5.35 9.6 6.08 11.8 6.90 13.8 7.78 15.3 8.72
155 2.2 4.38 4.6 4.77 6.9 5.35 9.2 6.08 11.2 6.90 13.0 7.78 14.5 8.72
160 2.1 4.38 4.3 4.77 6.5 5.35 8.7 6.08 10.6 6.90 12.3 7.78 13.6 8.72
165 2.0 4.38 4.1 4.77 6.2 5.35 8.2 6.08 10.0 6.90 11.6 7.78 12.8 8.72
170 1.9 4.38 3.8 4.77 5.8 5.35 7.7 6.08 9.4 6.90 10.8 7.78 11.9 8.72
175 1.7 4.38 3.6 4.77 5.4 5.35 7.2 6.08 8.8 6.90 10.1 7.78 11.1 8.72
180 1.6 4.38 3.3 4.77 5.1 5.35 6.7 6.08 8.2 6.90 9.4 7.78 10.2 8.72
185 1.5 4.38 3.1 4.77 4.7 5.35 6.2 6.08 7.6 6.90 8.6 7.78 9.3 8.72

8/10/2019 n We a 2011 Norms Report
http://slidepdf.com/reader/full/n-we-a-2011-norms-report 176/268
160 | N W E A 2 0 1 1 R I T S c a l e N o r m s
Table C.21. Means (M) and Standard Deviations (sd ) of Academic Growth by Starting RIT Score and Starting Instr ucti onal Week for VariousEnding Instru ctional Weeks - MATHEMATICS, KINDERGARTEN
Ending Instruction al Weeks
StartPriorGrd Focal Grade
Inst. Start 36 4 8 12 16 20 24 28 32 36
Wk RIT M sd M sd M sd M sd M sd M sd M sd M sd M sd M sd
190 1.4 4.38 2.9 4.77 4.3 5.35 5.7 6.08 7.0 6.90 7.9 7.78 8.5 8.72
195 1.3 4.38 2.6 4.77 4.0 5.35 5.3 6.08 6.4 6.90 7.2 7.78 7.6 8.72
200 1.1 4.38 2.4 4.77 3.6 5.35 4.8 6.08 5.7 6.90 6.5 7.78 6.8 8.72
12 120 3.2 4.38 6.4 4.77 9.5 5.35 12.4 6.08 15.1 6.90 17.4 7.78
125 3.1 4.38 6.1 4.77 9.1 5.35 11.9 6.08 14.5 6.90 16.6 7.78
130 2.9 4.38 5.9 4.77 8.8 5.35 11.4 6.08 13.9 6.90 15.9 7.78
135 2.8 4.38 5.7 4.77 8.4 5.35 11.0 6.08 13.2 6.90 15.2 7.78
140 2.7 4.38 5.4 4.77 8.0 5.35 10.5 6.08 12.6 6.90 14.4 7.78
145 2.6 4.38 5.2 4.77 7.7 5.35 10.0 6.08 12.0 6.90 13.7 7.78
150 2.5 4.38 4.9 4.77 7.3 5.35 9.5 6.08 11.4 6.90 13.0 7.78
155 2.3 4.38 4.7 4.77 6.9 5.35 9.0 6.08 10.8 6.90 12.2 7.78
160 2.2 4.38 4.4 4.77 6.6 5.35 8.5 6.08 10.2 6.90 11.5 7.78
165 2.1 4.38 4.2 4.77 6.2 5.35 8.0 6.08 9.6 6.90 10.8 7.78
170 2.0 4.38 3.9 4.77 5.8 5.35 7.5 6.08 9.0 6.90 10.0 7.78
175 1.8 4.38 3.7 4.77 5.5 5.35 7.1 6.08 8.4 6.90 9.3 7.78
180 1.7 4.38 3.5 4.77 5.1 5.35 6.6 6.08 7.8 6.90 8.6 7.78
185 1.6 4.38 3.2 4.77 4.7 5.35 6.1 6.08 7.2 6.90 7.9 7.78
190 1.5 4.38 3.0 4.77 4.4 5.35 5.6 6.08 6.5 6.90 7.1 7.78
195 1.4 4.38 2.7 4.77 4.0 5.35 5.1 6.08 5.9 6.90 6.4 7.78
200 1.2 4.38 2.5 4.77 3.6 5.35 4.6 6.08 5.3 6.90 5.7 7.78
16 120 3.2 4.38 6.3 4.77 9.2 5.35 11.9 6.08 14.2 6.90125 3.1 4.38 6.1 4.77 8.9 5.35 11.4 6.08 13.6 6.90
130 3.0 4.38 5.8 4.77 8.5 5.35 10.9 6.08 13.0 6.90
135 2.8 4.38 5.6 4.77 8.1 5.35 10.4 6.08 12.3 6.90
140 2.7 4.38 5.3 4.77 7.8 5.35 9.9 6.08 11.7 6.90
145 2.6 4.38 5.1 4.77 7.4 5.35 9.5 6.08 11.1 6.90
150 2.5 4.38 4.8 4.77 7.0 5.35 9.0 6.08 10.5 6.90
155 2.3 4.38 4.6 4.77 6.7 5.35 8.5 6.08 9.9 6.90
160 2.2 4.38 4.4 4.77 6.3 5.35 8.0 6.08 9.3 6.90
165 2.1 4.38 4.1 4.77 5.9 5.35 7.5 6.08 8.7 6.90
170 2.0 4.38 3.9 4.77 5.6 5.35 7.0 6.08 8.1 6.90
175 1.9 4.38 3.6 4.77 5.2 5.35 6.5 6.08 7.5 6.90
180 1.7 4.38 3.4 4.77 4.8 5.35 6.0 6.08 6.9 6.90

8/10/2019 n We a 2011 Norms Report
http://slidepdf.com/reader/full/n-we-a-2011-norms-report 177/268
N W E A 2 0 1 1 R I T S c a l e N o r m s | 161
Table C.21. Means (M) and Standard Deviations (sd ) of Academic Growth by Starting RIT Score and Starting Instr ucti onal Week for VariousEnding Instru ctional Weeks - MATHEMATICS, KINDERGARTEN
Ending Instruction al Weeks
StartPriorGrd Focal Grade
Inst. Start 36 4 8 12 16 20 24 28 32 36
Wk RIT M sd M sd M sd M sd M sd M sd M sd M sd M sd M sd
185 1.6 4.38 3.1 4.77 4.5 5.35 5.6 6.08 6.3 6.90
190 1.5 4.38 2.9 4.77 4.1 5.35 5.1 6.08 5.6 6.90
195 1.4 4.38 2.7 4.77 3.8 5.35 4.6 6.08 5.0 6.90
200 1.2 4.38 2.4 4.77 3.4 5.35 4.1 6.08 4.4 6.90
20 120 3.1 4.38 6.0 4.77 8.7 5.35 11.0 6.08
125 3.0 4.38 5.8 4.77 8.3 5.35 10.5 6.08
130 2.9 4.38 5.6 4.77 8.0 5.35 10.0 6.08
135 2.7 4.38 5.3 4.77 7.6 5.35 9.5 6.08
140 2.6 4.38 5.1 4.77 7.2 5.35 9.0 6.08
145 2.5 4.38 4.8 4.77 6.9 5.35 8.5 6.08
150 2.4 4.38 4.6 4.77 6.5 5.35 8.1 6.08
155 2.3 4.38 4.3 4.77 6.1 5.35 7.6 6.08
160 2.1 4.38 4.1 4.77 5.8 5.35 7.1 6.08
165 2.0 4.38 3.8 4.77 5.4 5.35 6.6 6.08
170 1.9 4.38 3.6 4.77 5.0 5.35 6.1 6.08
175 1.8 4.38 3.4 4.77 4.7 5.35 5.6 6.08
180 1.7 4.38 3.1 4.77 4.3 5.35 5.1 6.08
185 1.5 4.38 2.9 4.77 3.9 5.35 4.6 6.08
190 1.4 4.38 2.6 4.77 3.6 5.35 4.2 6.08
195 1.3 4.38 2.4 4.77 3.2 5.35 3.7 6.08
200 1.2 4.38 2.1 4.77 2.8 5.35 3.2 6.08

8/10/2019 n We a 2011 Norms Report
http://slidepdf.com/reader/full/n-we-a-2011-norms-report 178/268
162 | N W E A 2 0 1 1 R I T S c a l e N o r m s
Table C.22. Means (M) and Standard Deviations (sd) o f Academic Growth by Starting RIT Score and Starting Instru ctional Week forVarious Ending Instructional Weeks - MATHEMATICS, GRADE 1
Table C.22. Means (M) and Standard Deviations (sd) of Academic Grow th by Starting RIT Score and Starting Inst ruct ional Week for VariousEnding Instructi onal Weeks - MATHEMATICS, GRADE 1
Ending Instruction al Weeks
Start Prior Grd Focal Grade
Inst. Start 36 4 8 12 16 20 24 28 32 36
Wk RIT M sd M sd M sd M sd M sd M sd M sd M sd M sd M sd
32(Gd K)
115 3.6 4.34 7.8 4.61 12.2 5.02 16.8 5.55 21.4 6.17 25.7 6.85 29.5 7.57 32.8 8.33 35.3 9.11 36.7 9.91
1203.5 4.34 7.5 4.61 11.8 5.02 16.2 5.55 20.6 6.17 24.8 6.85 28.5 7.57 31.7 8.33 34.0 9.11 35.3 9.91125 3.3 4.34 7.2 4.61 11.4 5.02 15.7 5.55 19.9 6.17 23.9 6.85 27.5 7.57 30.5 8.33 32.7 9.11 33.9 9.91
130 3.2 4.34 6.9 4.61 10.9 5.02 15.1 5.55 19.2 6.17 23.1 6.85 26.5 7.57 29.4 8.33 31.4 9.11 32.4 9.91
135 3.1 4.34 6.6 4.61 10.5 5.02 14.5 5.55 18.5 6.17 22.2 6.85 25.5 7.57 28.2 8.33 30.1 9.11 31.0 9.91
140 2.9 4.34 6.3 4.61 10.1 5.02 14.0 5.55 17.8 6.17 21.4 6.85 24.5 7.57 27.1 8.33 28.8 9.11 29.6 9.91
145 2.8 4.34 6.0 4.61 9.6 5.02 13.4 5.55 17.1 6.17 20.5 6.85 23.5 7.57 25.9 8.33 27.5 9.11 28.1 9.91
150 2.6 4.34 5.8 4.61 9.2 5.02 12.8 5.55 16.3 6.17 19.6 6.85 22.5 7.57 24.8 8.33 26.2 9.11 26.7 9.91
155 2.5 4.34 5.5 4.61 8.8 5.02 12.2 5.55 15.6 6.17 18.8 6.85 21.5 7.57 23.6 8.33 24.9 9.11 25.2 9.91
160 2.3 4.34 5.2 4.61 8.4 5.02 11.7 5.55 14.9 6.17 17.9 6.85 20.5 7.57 22.5 8.33 23.6 9.11 23.8 9.91
165 2.2 4.34 4.9 4.61 7.9 5.02 11.1 5.55 14.2 6.17 17.1 6.85 19.5 7.57 21.3 8.33 22.3 9.11 22.4 9.91
170 2.1 4.34 4.6 4.61 7.5 5.02 10.5 5.55 13.5 6.17 16.2 6.85 18.5 7.57 20.2 8.33 21.1 9.11 20.9 9.91
175 1.9 4.34 4.3 4.61 7.1 5.02 9.9 5.55 12.8 6.17 15.3 6.85 17.5 7.57 19.0 8.33 19.8 9.11 19.5 9.91
180 1.8 4.34 4.0 4.61 6.6 5.02 9.4 5.55 12.0 6.17 14.5 6.85 16.5 7.57 17.9 8.33 18.5 9.11 18.1 9.91
185 1.6 4.34 3.7 4.61 6.2 5.02 8.8 5.55 11.3 6.17 13.6 6.85 15.5 7.57 16.7 8.33 17.2 9.11 16.6 9.91
190 1.5 4.34 3.5 4.61 5.8 5.02 8.2 5.55 10.6 6.17 12.8 6.85 14.5 7.57 15.6 8.33 15.9 9.11 15.2 9.91
195 1.3 4.34 3.2 4.61 5.3 5.02 7.6 5.55 9.9 6.17 11.9 6.85 13.5 7.57 14.4 8.33 14.6 9.11 13.8 9.91
36(Gd K)
120 4.0 4.34 8.3 4.61 12.8 5.02 17.2 5.55 21.3 6.17 25.1 6.85 28.2 7.57 30.5 8.33 31.8 9.11
125 3.9 4.34 8.0 4.61 12.3 5.02 16.6 5.55 20.6 6.17 24.2 6.85 27.2 7.57 29.3 8.33 30.5 9.11
130 3.7 4.34 7.7 4.61 11.9 5.02 16.0 5.55 19.9 6.17 23.3 6.85 26.2 7.57 28.2 8.33 29.2 9.11135 3.6 4.34 7.5 4.61 11.5 5.02 15.4 5.55 19.2 6.17 22.5 6.85 25.2 7.57 27.0 8.33 27.9 9.11
140 3.4 4.34 7.2 4.61 11.0 5.02 14.9 5.55 18.5 6.17 21.6 6.85 24.2 7.57 25.9 8.33 26.6 9.11
145 3.3 4.34 6.9 4.61 10.6 5.02 14.3 5.55 17.7 6.17 20.8 6.85 23.2 7.57 24.7 8.33 25.4 9.11
150 3.1 4.34 6.6 4.61 10.2 5.02 13.7 5.55 17.0 6.17 19.9 6.85 22.1 7.57 23.6 8.33 24.1 9.11
155 3.0 4.34 6.3 4.61 9.8 5.02 13.1 5.55 16.3 6.17 19.0 6.85 21.1 7.57 22.5 8.33 22.8 9.11
160 2.8 4.34 6.0 4.61 9.3 5.02 12.6 5.55 15.6 6.17 18.2 6.85 20.1 7.57 21.3 8.33 21.5 9.11
165 2.7 4.34 5.7 4.61 8.9 5.02 12.0 5.55 14.9 6.17 17.3 6.85 19.1 7.57 20.2 8.33 20.2 9.11
170 2.6 4.34 5.4 4.61 8.5 5.02 11.4 5.55 14.2 6.17 16.5 6.85 18.1 7.57 19.0 8.33 18.9 9.11
175 2.4 4.34 5.2 4.61 8.0 5.02 10.9 5.55 13.4 6.17 15.6 6.85 17.1 7.57 17.9 8.33 17.6 9.11
180 2.3 4.34 4.9 4.61 7.6 5.02 10.3 5.55 12.7 6.17 14.7 6.85 16.1 7.57 16.7 8.33 16.3 9.11
185 2.1 4.34 4.6 4.61 7.2 5.02 9.7 5.55 12.0 6.17 13.9 6.85 15.1 7.57 15.6 8.33 15.0 9.11
190 2.0 4.34 4.3 4.61 6.7 5.02 9.1 5.55 11.3 6.17 13.0 6.85 14.1 7.57 14.4 8.33 13.7 9.11

8/10/2019 n We a 2011 Norms Report
http://slidepdf.com/reader/full/n-we-a-2011-norms-report 179/268
N W E A 2 0 1 1 R I T S c a l e N o r m s | 163
Table C.22. Means (M) and Standard Deviations (sd) of Academic Grow th by Starting RIT Score and Starting Inst ruct ional Week for VariousEnding Instructi onal Weeks - MATHEMATICS, GRADE 1
Ending Instruction al Weeks
Start Prior Grd Focal Grade
Inst. Start 36 4 8 12 16 20 24 28 32 36
Wk RIT M sd M sd M sd M sd M sd M sd M sd M sd M sd M sd
195 1.8 4.34 4.0 4.61 6.3 5.02 8.6 5.55 10.6 6.17 12.1 6.85 13.1 7.57 13.3 8.33 12.4 9.11
200 1.7 4.34 3.7 4.61 5.9 5.02 8.0 5.55 9.8 6.17 11.3 6.85 12.1 7.57 12.1 8.33 11.2 9.11
4 125 4.2 4.34 8.5 4.61 12.7 5.02 16.8 5.55 20.3 6.17 23.3 6.85 25.5 7.57 26.7 8.33
1304.0 4.34 8.2 4.61 12.3 5.02 16.2 5.55 19.6 6.17 22.5 6.85 24.5 7.57 25.5 8.33135 3.9 4.34 7.9 4.61 11.9 5.02 15.6 5.55 18.9 6.17 21.6 6.85 23.5 7.57 24.4 8.33
140 3.7 4.34 7.6 4.61 11.5 5.02 15.0 5.55 18.2 6.17 20.7 6.85 22.5 7.57 23.2 8.33
145 3.6 4.34 7.3 4.61 11.0 5.02 14.5 5.55 17.5 6.17 19.9 6.85 21.5 7.57 22.1 8.33
150 3.5 4.34 7.1 4.61 10.6 5.02 13.9 5.55 16.8 6.17 19.0 6.85 20.5 7.57 20.9 8.33
155 3.3 4.34 6.8 4.61 10.2 5.02 13.3 5.55 16.0 6.17 18.2 6.85 19.5 7.57 19.8 8.33
160 3.2 4.34 6.5 4.61 9.7 5.02 12.7 5.55 15.3 6.17 17.3 6.85 18.5 7.57 18.6 8.33
165 3.0 4.34 6.2 4.61 9.3 5.02 12.2 5.55 14.6 6.17 16.4 6.85 17.5 7.57 17.5 8.33
170 2.9 4.34 5.9 4.61 8.9 5.02 11.6 5.55 13.9 6.17 15.6 6.85 16.5 7.57 16.3 8.33
175 2.7 4.34 5.6 4.61 8.4 5.02 11.0 5.55 13.2 6.17 14.7 6.85 15.4 7.57 15.2 8.33
180 2.6 4.34 5.3 4.61 8.0 5.02 10.4 5.55 12.5 6.17 13.9 6.85 14.4 7.57 14.0 8.33
185 2.5 4.34 5.0 4.61 7.6 5.02 9.9 5.55 11.7 6.17 13.0 6.85 13.4 7.57 12.9 8.33
190 2.3 4.34 4.8 4.61 7.1 5.02 9.3 5.55 11.0 6.17 12.1 6.85 12.4 7.57 11.8 8.33
195 2.2 4.34 4.5 4.61 6.7 5.02 8.7 5.55 10.3 6.17 11.3 6.85 11.4 7.57 10.6 8.33
200 2.0 4.34 4.2 4.61 6.3 5.02 8.2 5.55 9.6 6.17 10.4 6.85 10.4 7.57 9.5 8.33
8 125 4.3 4.34 8.6 4.61 12.6 5.02 16.2 5.55 19.1 6.17 21.3 6.85 22.5 7.57
130 4.2 4.34 8.3 4.61 12.2 5.02 15.6 5.55 18.4 6.17 20.5 6.85 21.5 7.57
135 4.0 4.34 8.0 4.61 11.7 5.02 15.0 5.55 17.7 6.17 19.6 6.85 20.5 7.57
140 3.9 4.34 7.7 4.61 11.3 5.02 14.5 5.55 17.0 6.17 18.7 6.85 19.5 7.57145 3.7 4.34 7.4 4.61 10.9 5.02 13.9 5.55 16.3 6.17 17.9 6.85 18.5 7.57
150 3.6 4.34 7.1 4.61 10.4 5.02 13.3 5.55 15.6 6.17 17.0 6.85 17.5 7.57
155 3.5 4.34 6.8 4.61 10.0 5.02 12.7 5.55 14.8 6.17 16.2 6.85 16.5 7.57
160 3.3 4.34 6.6 4.61 9.6 5.02 12.2 5.55 14.1 6.17 15.3 6.85 15.5 7.57
165 3.2 4.34 6.3 4.61 9.1 5.02 11.6 5.55 13.4 6.17 14.4 6.85 14.5 7.57
170 3.0 4.34 6.0 4.61 8.7 5.02 11.0 5.55 12.7 6.17 13.6 6.85 13.5 7.57
175 2.9 4.34 5.7 4.61 8.3 5.02 10.4 5.55 12.0 6.17 12.7 6.85 12.5 7.57
180 2.7 4.34 5.4 4.61 7.9 5.02 9.9 5.55 11.3 6.17 11.9 6.85 11.5 7.57
185 2.6 4.34 5.1 4.61 7.4 5.02 9.3 5.55 10.5 6.17 11.0 6.85 10.4 7.57
190 2.4 4.34 4.8 4.61 7.0 5.02 8.7 5.55 9.8 6.17 10.1 6.85 9.4 7.57
195 2.3 4.34 4.6 4.61 6.6 5.02 8.1 5.55 9.1 6.17 9.3 6.85 8.4 7.57
200 2.2 4.34 4.3 4.61 6.1 5.02 7.6 5.55 8.4 6.17 8.4 6.85 7.4 7.57

8/10/2019 n We a 2011 Norms Report
http://slidepdf.com/reader/full/n-we-a-2011-norms-report 180/268
164 | N W E A 2 0 1 1 R I T S c a l e N o r m s
Table C.22. Means (M) and Standard Deviations (sd) of Academic Grow th by Starting RIT Score and Starting Inst ruct ional Week for VariousEnding Instructi onal Weeks - MATHEMATICS, GRADE 1
Ending Instruction al Weeks
Start Prior Grd Focal Grade
Inst. Start 36 4 8 12 16 20 24 28 32 36
Wk RIT M sd M sd M sd M sd M sd M sd M sd M sd M sd M sd
12 130 4.1 4.34 8.0 4.61 11.4 5.02 14.3 5.55 16.3 6.17 17.3 6.85
135 4.0 4.34 7.7 4.61 11.0 5.02 13.7 5.55 15.6 6.17 16.5 6.85
140 3.8 4.34 7.4 4.61 10.6 5.02 13.1 5.55 14.9 6.17 15.6 6.85
145 3.7 4.34 7.1 4.61 10.1 5.02 12.5 5.55 14.1 6.17 14.7 6.85
150 3.5 4.34 6.8 4.61 9.7 5.02 12.0 5.55 13.4 6.17 13.9 6.85
155 3.4 4.34 6.6 4.61 9.3 5.02 11.4 5.55 12.7 6.17 13.0 6.85
160 3.3 4.34 6.3 4.61 8.9 5.02 10.8 5.55 12.0 6.17 12.2 6.85
165 3.1 4.34 6.0 4.61 8.4 5.02 10.2 5.55 11.3 6.17 11.3 6.85
170 3.0 4.34 5.7 4.61 8.0 5.02 9.7 5.55 10.6 6.17 10.4 6.85
175 2.8 4.34 5.4 4.61 7.6 5.02 9.1 5.55 9.8 6.17 9.6 6.85
180 2.7 4.34 5.1 4.61 7.1 5.02 8.5 5.55 9.1 6.17 8.7 6.85
185 2.5 4.34 4.8 4.61 6.7 5.02 8.0 5.55 8.4 6.17 7.9 6.85
190 2.4 4.34 4.5 4.61 6.3 5.02 7.4 5.55 7.7 6.17 7.0 6.85
195 2.3 4.34 4.3 4.61 5.8 5.02 6.8 5.55 7.0 6.17 6.1 6.85
200 2.1 4.34 4.0 4.61 5.4 5.02 6.2 5.55 6.3 6.17 5.3 6.85
205 2.0 4.34 3.7 4.61 5.0 5.02 5.7 5.55 5.5 6.17 4.4 6.85
16 135 3.7 4.34 7.0 4.61 9.7 5.02 11.6 5.55 12.5 6.17
140 3.6 4.34 6.7 4.61 9.3 5.02 11.0 5.55 11.8 6.17
145 3.4 4.34 6.5 4.61 8.9 5.02 10.5 5.55 11.1 6.17
150 3.3 4.34 6.2 4.61 8.4 5.02 9.9 5.55 10.3 6.17
155 3.2 4.34 5.9 4.61 8.0 5.02 9.3 5.55 9.6 6.17
160 3.0 4.34 5.6 4.61 7.6 5.02 8.7 5.55 8.9 6.17165 2.9 4.34 5.3 4.61 7.1 5.02 8.2 5.55 8.2 6.17
170 2.7 4.34 5.0 4.61 6.7 5.02 7.6 5.55 7.5 6.17
175 2.6 4.34 4.7 4.61 6.3 5.02 7.0 5.55 6.8 6.17
180 2.4 4.34 4.5 4.61 5.8 5.02 6.4 5.55 6.0 6.17
185 2.3 4.34 4.2 4.61 5.4 5.02 5.9 5.55 5.3 6.17
190 2.2 4.34 3.9 4.61 5.0 5.02 5.3 5.55 4.6 6.17
195 2.0 4.34 3.6 4.61 4.6 5.02 4.7 5.55 3.9 6.17
200 1.9 4.34 3.3 4.61 4.1 5.02 4.1 5.55 3.2 6.17
205 1.7 4.34 3.0 4.61 3.7 5.02 3.6 5.55 2.5 6.17
20 140 3.2 4.34 5.7 4.61 7.4 5.02 8.2 5.55
145 3.0 4.34 5.4 4.61 7.0 5.02 7.6 5.55
150 2.9 4.34 5.1 4.61 6.6 5.02 7.0 5.55

8/10/2019 n We a 2011 Norms Report
http://slidepdf.com/reader/full/n-we-a-2011-norms-report 181/268
N W E A 2 0 1 1 R I T S c a l e N o r m s | 165
Table C.22. Means (M) and Standard Deviations (sd) of Academic Grow th by Starting RIT Score and Starting Inst ruct ional Week for VariousEnding Instructi onal Weeks - MATHEMATICS, GRADE 1
Ending Instruction al Weeks
Start Prior Grd Focal Grade
Inst. Start 36 4 8 12 16 20 24 28 32 36
Wk RIT M sd M sd M sd M sd M sd M sd M sd M sd M sd M sd
155 2.7 4.34 4.8 4.61 6.2 5.02 6.5 5.55
160 2.6 4.34 4.6 4.61 5.7 5.02 5.9 5.55
165 2.4 4.34 4.3 4.61 5.3 5.02 5.3 5.55
170 2.3 4.34 4.0 4.61 4.9 5.02 4.8 5.55
175 2.2 4.34 3.7 4.61 4.4 5.02 4.2 5.55
180 2.0 4.34 3.4 4.61 4.0 5.02 3.6 5.55
185 1.9 4.34 3.1 4.61 3.6 5.02 3.0 5.55
190 1.7 4.34 2.8 4.61 3.1 5.02 2.5 5.55
195 1.6 4.34 2.6 4.61 2.7 5.02 1.9 5.55
200 1.4 4.34 2.3 4.61 2.3 5.02 1.3 5.55
205 1.3 4.34 2.0 4.61 1.9 5.02 0.7 5.55
210 1.2 4.34 1.7 4.61 1.4 5.02 0.2 5.55

8/10/2019 n We a 2011 Norms Report
http://slidepdf.com/reader/full/n-we-a-2011-norms-report 182/268
166 | N W E A 2 0 1 1 R I T S c a l e N o r m s
Table C.23. Means (M) and Standard Deviations (sd) o f Academic Growth by Starting RIT Score and Starting Instru ctional Week forVarious Ending Instructional Weeks - MATHEMATICS, GRADE 2Table C.23. Means (M) and Standard Deviations (sd) of Academic Grow th by Starting RIT Score and Starting Inst ruct ional Week for Various
Ending Instru ctional Weeks - MATHEMATICS, GRADE 2
Ending Instructio nal Weeks
Start Prior Grd Focal Grade
Inst. Start 36 4 8 12 16 20 24 28 32 36
Wk RIT M sd M sd M sd M sd M sd M sd M sd M sd M sd M sd
32(Gd 1)
140 1.2 4.31 3.2 4.52 5.7 4.85 8.5 5.27 11.5 5.77 14.6 6.32 17.4 6.92 20.0 7.55 22.0 8.21 23.3 8.89
1451.1 4.31 3.0 4.52 5.4 4.85 8.1 5.27 11.1 5.77 14.0 6.32 16.8 6.92 19.2 7.55 21.1 8.21 22.3 8.89150 1.0 4.31 2.8 4.52 5.1 4.85 7.8 5.27 10.6 5.77 13.4 6.32 16.1 6.92 18.4 7.55 20.3 8.21 21.4 8.89
155 1.0 4.31 2.6 4.52 4.8 4.85 7.4 5.27 10.1 5.77 12.9 6.32 15.5 6.92 17.7 7.55 19.4 8.21 20.4 8.89
160 0.9 4.31 2.4 4.52 4.5 4.85 7.0 5.27 9.6 5.77 12.3 6.32 14.8 6.92 16.9 7.55 18.6 8.21 19.5 8.89
165 0.8 4.31 2.2 4.52 4.2 4.85 6.6 5.27 9.2 5.77 11.7 6.32 14.1 6.92 16.2 7.55 17.7 8.21 18.5 8.89
170 0.7 4.31 2.0 4.52 4.0 4.85 6.2 5.27 8.7 5.77 11.2 6.32 13.5 6.92 15.4 7.55 16.8 8.21 17.6 8.89
175 0.6 4.31 1.9 4.52 3.7 4.85 5.9 5.27 8.2 5.77 10.6 6.32 12.8 6.92 14.7 7.55 16.0 8.21 16.6 8.89
180 0.5 4.31 1.7 4.52 3.4 4.85 5.5 5.27 7.7 5.77 10.0 6.32 12.1 6.92 13.9 7.55 15.1 8.21 15.7 8.89
185 0.4 4.31 1.5 4.52 3.1 4.85 5.1 5.27 7.3 5.77 9.5 6.32 11.5 6.92 13.1 7.55 14.3 8.21 14.7 8.89
190 0.3 4.31 1.3 4.52 2.8 4.85 4.7 5.27 6.8 5.77 8.9 6.32 10.8 6.92 12.4 7.55 13.4 8.21 13.8 8.89
195 0.2 4.31 1.1 4.52 2.5 4.85 4.3 5.27 6.3 5.77 8.3 6.32 10.1 6.92 11.6 7.55 12.6 8.21 12.8 8.89
200 0.1 4.31 0.9 4.52 2.3 4.85 4.0 5.27 5.9 5.77 7.7 6.32 9.5 6.92 10.9 7.55 11.7 8.21 11.9 8.89
205 0.0 4.31 0.7 4.52 2.0 4.85 3.6 5.27 5.4 5.77 7.2 6.32 8.8 6.92 10.1 7.55 10.9 8.21 10.9 8.89
210 -0.1 4.31 0.5 4.52 1.7 4.85 3.2 5.27 4.9 5.77 6.6 6.32 8.2 6.92 9.3 7.55 10.0 8.21 10.0 8.89
215 -0.2 4.31 0.3 4.52 1.4 4.85 2.8 5.27 4.4 5.77 6.0 6.32 7.5 6.92 8.6 7.55 9.2 8.21 9.0 8.89
36(Gd 1)
140 2.0 4.31 4.4 4.52 7.3 4.85 10.3 5.27 13.3 5.77 16.2 6.32 18.7 6.92 20.7 7.55 22.0 8.21
145 1.9 4.31 4.2 4.52 7.0 4.85 9.9 5.27 12.9 5.77 15.6 6.32 18.1 6.92 20.0 7.55 21.2 8.21
150 1.8 4.31 4.1 4.52 6.7 4.85 9.5 5.27 12.4 5.77 15.1 6.32 17.4 6.92 19.2 7.55 20.3 8.21
155 1.7 4.31 3.9 4.52 6.4 4.85 9.2 5.27 11.9 5.77 14.5 6.32 16.7 6.92 18.5 7.55 19.5 8.21160 1.6 4.31 3.7 4.52 6.1 4.85 8.8 5.27 11.4 5.77 13.9 6.32 16.1 6.92 17.7 7.55 18.6 8.21
165 1.5 4.31 3.5 4.52 5.9 4.85 8.4 5.27 11.0 5.77 13.4 6.32 15.4 6.92 16.9 7.55 17.8 8.21
170 1.4 4.31 3.3 4.52 5.6 4.85 8.0 5.27 10.5 5.77 12.8 6.32 14.8 6.92 16.2 7.55 16.9 8.21
175 1.3 4.31 3.1 4.52 5.3 4.85 7.7 5.27 10.0 5.77 12.2 6.32 14.1 6.92 15.4 7.55 16.1 8.21
180 1.2 4.31 2.9 4.52 5.0 4.85 7.3 5.27 9.6 5.77 11.7 6.32 13.4 6.92 14.7 7.55 15.2 8.21
185 1.1 4.31 2.7 4.52 4.7 4.85 6.9 5.27 9.1 5.77 11.1 6.32 12.8 6.92 13.9 7.55 14.4 8.21
190 1.0 4.31 2.5 4.52 4.4 4.85 6.5 5.27 8.6 5.77 10.5 6.32 12.1 6.92 13.1 7.55 13.5 8.21
195 0.9 4.31 2.3 4.52 4.1 4.85 6.1 5.27 8.1 5.77 10.0 6.32 11.4 6.92 12.4 7.55 12.7 8.21
200 0.8 4.31 2.2 4.52 3.9 4.85 5.8 5.27 7.7 5.77 9.4 6.32 10.8 6.92 11.6 7.55 11.8 8.21
205 0.7 4.31 2.0 4.52 3.6 4.85 5.4 5.27 7.2 5.77 8.8 6.32 10.1 6.92 10.9 7.55 10.9 8.21
210 0.6 4.31 1.8 4.52 3.3 4.85 5.0 5.27 6.7 5.77 8.2 6.32 9.4 6.92 10.1 7.55 10.1 8.21
215 0.5 4.31 1.6 4.52 3.0 4.85 4.6 5.27 6.2 5.77 7.7 6.32 8.8 6.92 9.4 7.55 9.2 8.21

8/10/2019 n We a 2011 Norms Report
http://slidepdf.com/reader/full/n-we-a-2011-norms-report 183/268
N W E A 2 0 1 1 R I T S c a l e N o r m s | 167
Table C.23. Means (M) and Standard Deviations (sd) of Academic Grow th by Starting RIT Score and Starting Inst ruct ional Week for VariousEnding Instru ctional Weeks - MATHEMATICS, GRADE 2
Ending Instructio nal Weeks
Start Prior Grd Focal Grade
Inst. Start 36 4 8 12 16 20 24 28 32 36
Wk RIT M sd M sd M sd M sd M sd M sd M sd M sd M sd M sd
4 140 2.5 4.31 5.3 4.52 8.4 4.85 11.4 5.27 14.3 5.77 16.8 6.32 18.8 6.92 20.1 7.55
145 2.4 4.31 5.1 4.52 8.1 4.85 11.0 5.27 13.8 5.77 16.2 6.32 18.1 6.92 19.3 7.55
150 2.3 4.31 5.0 4.52 7.8 4.85 10.6 5.27 13.3 5.77 15.6 6.32 17.5 6.92 18.6 7.55
155 2.2 4.31 4.8 4.52 7.5 4.85 10.3 5.27 12.8 5.77 15.1 6.32 16.8 6.92 17.8 7.55
160 2.1 4.31 4.6 4.52 7.2 4.85 9.9 5.27 12.4 5.77 14.5 6.32 16.1 6.92 17.1 7.55
165 2.0 4.31 4.4 4.52 6.9 4.85 9.5 5.27 11.9 5.77 13.9 6.32 15.5 6.92 16.3 7.55
170 1.9 4.31 4.2 4.52 6.7 4.85 9.1 5.27 11.4 5.77 13.4 6.32 14.8 6.92 15.5 7.55
175 1.8 4.31 4.0 4.52 6.4 4.85 8.7 5.27 10.9 5.77 12.8 6.32 14.1 6.92 14.8 7.55
180 1.7 4.31 3.8 4.52 6.1 4.85 8.4 5.27 10.5 5.77 12.2 6.32 13.5 6.92 14.0 7.55
185 1.6 4.31 3.6 4.52 5.8 4.85 8.0 5.27 10.0 5.77 11.7 6.32 12.8 6.92 13.3 7.55
190 1.5 4.31 3.4 4.52 5.5 4.85 7.6 5.27 9.5 5.77 11.1 6.32 12.2 6.92 12.5 7.55
195 1.4 4.31 3.2 4.52 5.2 4.85 7.2 5.27 9.1 5.77 10.5 6.32 11.5 6.92 11.7 7.55
200 1.4 4.31 3.1 4.52 4.9 4.85 6.8 5.27 8.6 5.77 10.0 6.32 10.8 6.92 11.0 7.55
205 1.3 4.31 2.9 4.52 4.7 4.85 6.5 5.27 8.1 5.77 9.4 6.32 10.2 6.92 10.2 7.55
210 1.2 4.31 2.7 4.52 4.4 4.85 6.1 5.27 7.6 5.77 8.8 6.32 9.5 6.92 9.5 7.55
215 1.1 4.31 2.5 4.52 4.1 4.85 5.7 5.27 7.2 5.77 8.3 6.32 8.8 6.92 8.7 7.55
8 145 2.8 4.31 5.7 4.52 8.6 4.85 11.4 5.27 13.8 5.77 15.7 6.32 16.9 6.92
150 2.7 4.31 5.5 4.52 8.3 4.85 11.0 5.27 13.4 5.77 15.2 6.32 16.3 6.92
155 2.6 4.31 5.3 4.52 8.1 4.85 10.6 5.27 12.9 5.77 14.6 6.32 15.6 6.92
160 2.5 4.31 5.1 4.52 7.8 4.85 10.3 5.27 12.4 5.77 14.0 6.32 15.0 6.92
165 2.4 4.31 4.9 4.52 7.5 4.85 9.9 5.27 11.9 5.77 13.5 6.32 14.3 6.92
170 2.3 4.31 4.7 4.52 7.2 4.85 9.5 5.27 11.5 5.77 12.9 6.32 13.6 6.92175 2.2 4.31 4.6 4.52 6.9 4.85 9.1 5.27 11.0 5.77 12.3 6.32 13.0 6.92
180 2.1 4.31 4.4 4.52 6.6 4.85 8.7 5.27 10.5 5.77 11.8 6.32 12.3 6.92
185 2.0 4.31 4.2 4.52 6.4 4.85 8.4 5.27 10.0 5.77 11.2 6.32 11.6 6.92
190 1.9 4.31 4.0 4.52 6.1 4.85 8.0 5.27 9.6 5.77 10.6 6.32 11.0 6.92
195 1.8 4.31 3.8 4.52 5.8 4.85 7.6 5.27 9.1 5.77 10.0 6.32 10.3 6.92
200 1.7 4.31 3.6 4.52 5.5 4.85 7.2 5.27 8.6 5.77 9.5 6.32 9.6 6.92
205 1.6 4.31 3.4 4.52 5.2 4.85 6.9 5.27 8.1 5.77 8.9 6.32 9.0 6.92
210 1.5 4.31 3.2 4.52 4.9 4.85 6.5 5.27 7.7 5.77 8.3 6.32 8.3 6.92
215 1.4 4.31 3.0 4.52 4.6 4.85 6.1 5.27 7.2 5.77 7.8 6.32 7.7 6.92
12 145 2.9 4.31 5.9 4.52 8.7 4.85 11.1 5.27 13.0 5.77 14.2 6.32
150 2.8 4.31 5.7 4.52 8.4 4.85 10.7 5.27 12.5 5.77 13.6 6.32
155 2.7 4.31 5.5 4.52 8.1 4.85 10.3 5.27 12.0 5.77 13.1 6.32

8/10/2019 n We a 2011 Norms Report
http://slidepdf.com/reader/full/n-we-a-2011-norms-report 184/268
168 | N W E A 2 0 1 1 R I T S c a l e N o r m s
Table C.23. Means (M) and Standard Deviations (sd) of Academic Grow th by Starting RIT Score and Starting Inst ruct ional Week for VariousEnding Instru ctional Weeks - MATHEMATICS, GRADE 2
Ending Instructio nal Weeks
Start Prior Grd Focal Grade
Inst. Start 36 4 8 12 16 20 24 28 32 36
Wk RIT M sd M sd M sd M sd M sd M sd M sd M sd M sd M sd
160 2.7 4.31 5.3 4.52 7.8 4.85 9.9 5.27 11.6 5.77 12.5 6.32
165 2.6 4.31 5.1 4.52 7.5 4.85 9.6 5.27 11.1 5.77 11.9 6.32
170 2.5 4.31 4.9 4.52 7.2 4.85 9.2 5.27 10.6 5.77 11.4 6.32
175 2.4 4.31 4.7 4.52 6.9 4.85 8.8 5.27 10.1 5.77 10.8 6.32
180 2.3 4.31 4.6 4.52 6.7 4.85 8.4 5.27 9.7 5.77 10.2 6.32
185 2.2 4.31 4.4 4.52 6.4 4.85 8.0 5.27 9.2 5.77 9.6 6.32
190 2.1 4.31 4.2 4.52 6.1 4.85 7.7 5.27 8.7 5.77 9.1 6.32
195 2.0 4.31 4.0 4.52 5.8 4.85 7.3 5.27 8.2 5.77 8.5 6.32
200 1.9 4.31 3.8 4.52 5.5 4.85 6.9 5.27 7.8 5.77 7.9 6.32
205 1.8 4.31 3.6 4.52 5.2 4.85 6.5 5.27 7.3 5.77 7.4 6.32
210 1.7 4.31 3.4 4.52 5.0 4.85 6.2 5.27 6.8 5.77 6.8 6.32
215 1.6 4.31 3.2 4.52 4.7 4.85 5.8 5.27 6.4 5.77 6.2 6.32
16 150 2.9 4.31 5.5 4.52 7.9 4.85 9.7 5.27 10.8 5.77
155 2.8 4.31 5.3 4.52 7.6 4.85 9.3 5.27 10.3 5.77
160 2.7 4.31 5.2 4.52 7.3 4.85 8.9 5.27 9.8 5.77
165 2.6 4.31 5.0 4.52 7.0 4.85 8.5 5.27 9.4 5.77
170 2.5 4.31 4.8 4.52 6.7 4.85 8.2 5.27 8.9 5.77
175 2.4 4.31 4.6 4.52 6.4 4.85 7.8 5.27 8.4 5.77
180 2.3 4.31 4.4 4.52 6.2 4.85 7.4 5.27 7.9 5.77
185 2.2 4.31 4.2 4.52 5.9 4.85 7.0 5.27 7.5 5.77
190 2.1 4.31 4.0 4.52 5.6 4.85 6.6 5.27 7.0 5.77
195 2.0 4.31 3.8 4.52 5.3 4.85 6.3 5.27 6.5 5.77200 1.9 4.31 3.6 4.52 5.0 4.85 5.9 5.27 6.0 5.77
205 1.8 4.31 3.4 4.52 4.7 4.85 5.5 5.27 5.6 5.77
210 1.7 4.31 3.3 4.52 4.4 4.85 5.1 5.27 5.1 5.77
215 1.6 4.31 3.1 4.52 4.2 4.85 4.7 5.27 4.6 5.77
220 1.5 4.31 2.9 4.52 3.9 4.85 4.4 5.27 4.2 5.77
20 150 2.7 4.31 5.0 4.52 6.8 4.85 7.9 5.27
155 2.6 4.31 4.8 4.52 6.5 4.85 7.6 5.27
160 2.5 4.31 4.6 4.52 6.3 4.85 7.2 5.27
165 2.4 4.31 4.4 4.52 6.0 4.85 6.8 5.27
170 2.3 4.31 4.3 4.52 5.7 4.85 6.4 5.27
175 2.2 4.31 4.1 4.52 5.4 4.85 6.0 5.27
180 2.1 4.31 3.9 4.52 5.1 4.85 5.7 5.27
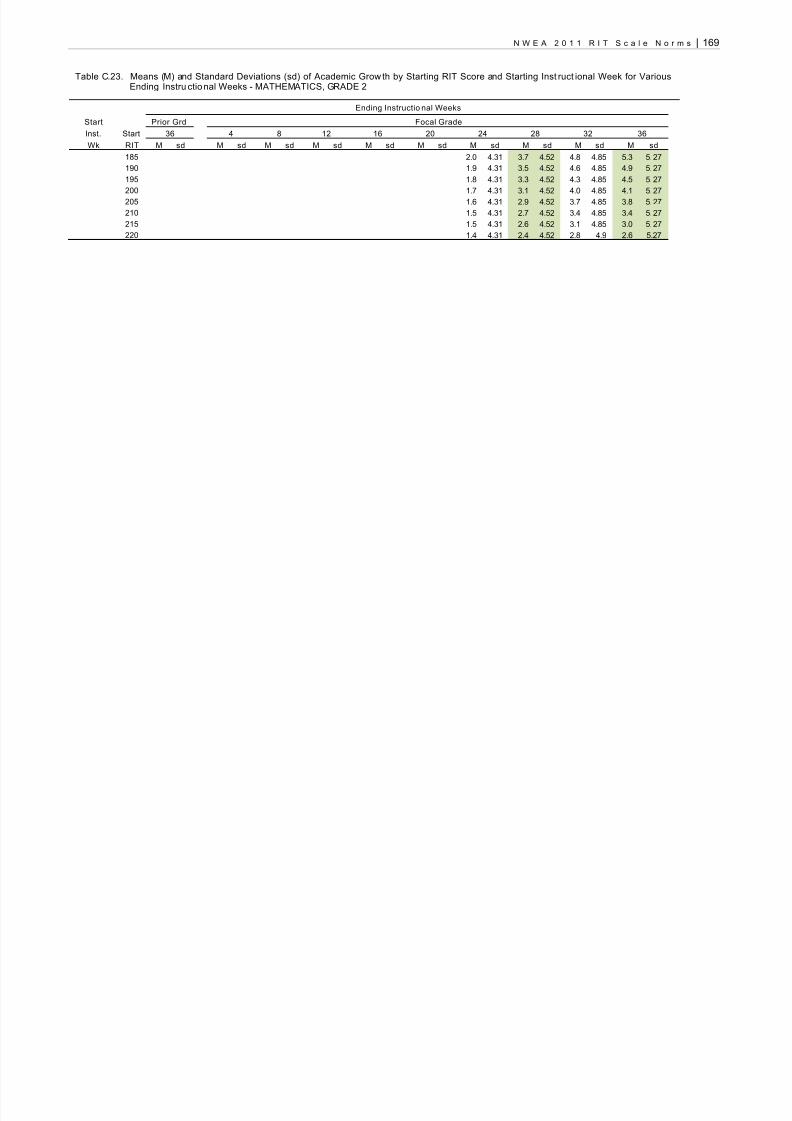
8/10/2019 n We a 2011 Norms Report
http://slidepdf.com/reader/full/n-we-a-2011-norms-report 185/268
N W E A 2 0 1 1 R I T S c a l e N o r m s | 169
Table C.23. Means (M) and Standard Deviations (sd) of Academic Grow th by Starting RIT Score and Starting Inst ruct ional Week for VariousEnding Instru ctional Weeks - MATHEMATICS, GRADE 2
Ending Instructio nal Weeks
Start Prior Grd Focal Grade
Inst. Start 36 4 8 12 16 20 24 28 32 36
Wk RIT M sd M sd M sd M sd M sd M sd M sd M sd M sd M sd
185 2.0 4.31 3.7 4.52 4.8 4.85 5.3 5.27
190 1.9 4.31 3.5 4.52 4.6 4.85 4.9 5.27
195 1.8 4.31 3.3 4.52 4.3 4.85 4.5 5.27
200 1.7 4.31 3.1 4.52 4.0 4.85 4.1 5.27
205 1.6 4.31 2.9 4.52 3.7 4.85 3.8 5.27
210 1.5 4.31 2.7 4.52 3.4 4.85 3.4 5.27
215 1.5 4.31 2.6 4.52 3.1 4.85 3.0 5.27
220 1.4 4.31 2.4 4.52 2.8 4.9 2.6 5.27

8/10/2019 n We a 2011 Norms Report
http://slidepdf.com/reader/full/n-we-a-2011-norms-report 186/268
170 | N W E A 2 0 1 1 R I T S c a l e N o r m s
Table C.24. Means (M) and Standard Deviations (sd) o f Academic Growth by Starting RIT Score and Starting Instru ctional Week forVarious Ending Instructional Weeks - MATHEMATICS, GRADE 3
Table C.24. Means (M) and Standard Deviations (sd ) of Academic Growth by Starting RIT Score and Starting Instr ucti onal Week forVarious Endi ng Inst ruct ional Weeks - MATHEMATICS, GRADE 3
Ending Instruction al Weeks
Start Prior Grd Focal Grade
Inst. Start 36 4 8 12 16 20 24 28 32 36
Wk RIT M sd M sd M sd M sd M sd M sd M sd M sd M sd M sd
32(Gd 2)
155 1.0 4.30 2.4 4.45 4.2 4.70 6.2 5.03 8.3 5.42 10.4 5.86 12.3 6.35 13.8 6.86 15.0 7.41 15.6 7.97
1600.9 4.30 2.4 4.45 4.1 4.70 6.1 5.03 8.2 5.42 10.2 5.86 12.1 6.35 13.7 6.86 14.8 7.41 15.4 7.97165 0.9 4.30 2.3 4.45 4.1 4.70 6.0 5.03 8.1 5.42 10.1 5.86 11.9 6.35 13.5 6.86 14.6 7.41 15.2 7.97
170 0.9 4.30 2.3 4.45 4.0 4.70 5.9 5.03 8.0 5.42 9.9 5.86 11.8 6.35 13.3 6.86 14.4 7.41 14.9 7.97
175 0.9 4.30 2.2 4.45 3.9 4.70 5.8 5.03 7.8 5.42 9.8 5.86 11.6 6.35 13.1 6.86 14.2 7.41 14.7 7.97
180 0.8 4.30 2.2 4.45 3.8 4.70 5.7 5.03 7.7 5.42 9.7 5.86 11.5 6.35 12.9 6.86 14.0 7.41 14.5 7.97
185 0.8 4.30 2.1 4.45 3.8 4.70 5.7 5.03 7.6 5.42 9.5 5.86 11.3 6.35 12.7 6.86 13.8 7.41 14.2 7.97
190 0.8 4.30 2.1 4.45 3.7 4.70 5.6 5.03 7.5 5.42 9.4 5.86 11.1 6.35 12.6 6.86 13.6 7.41 14.0 7.97
195 0.8 4.30 2.0 4.45 3.6 4.70 5.5 5.03 7.4 5.42 9.3 5.86 11.0 6.35 12.4 6.86 13.4 7.41 13.8 7.97
200 0.8 4.30 2.0 4.45 3.6 4.70 5.4 5.03 7.3 5.42 9.1 5.86 10.8 6.35 12.2 6.86 13.1 7.41 13.5 7.97
205 0.7 4.30 1.9 4.45 3.5 4.70 5.3 5.03 7.2 5.42 9.0 5.86 10.6 6.35 12.0 6.86 12.9 7.41 13.3 7.97
210 0.7 4.30 1.9 4.45 3.4 4.70 5.2 5.03 7.0 5.42 8.8 5.86 10.5 6.35 11.8 6.86 12.7 7.41 13.1 7.97
215 0.7 4.30 1.9 4.45 3.4 4.70 5.1 5.03 6.9 5.42 8.7 5.86 10.3 6.35 11.6 6.86 12.5 7.41 12.9 7.97
220 0.7 4.30 1.8 4.45 3.3 4.70 5.0 5.03 6.8 5.42 8.6 5.86 10.2 6.35 11.5 6.86 12.3 7.41 12.6 7.97
225 0.6 4.30 1.8 4.45 3.2 4.70 4.9 5.03 6.7 5.42 8.4 5.86 10.0 6.35 11.3 6.86 12.1 7.41 12.4 7.97
36(Gd 2)
155 1.4 4.30 3.2 4.45 5.2 4.70 7.3 5.03 9.4 5.42 11.3 5.86 12.9 6.35 14.0 6.86 14.7 7.41
160 1.4 4.30 3.2 4.45 5.2 4.70 7.3 5.03 9.3 5.42 11.2 5.86 12.7 6.35 13.9 6.86 14.4 7.41
165 1.4 4.30 3.1 4.45 5.1 4.70 7.2 5.03 9.2 5.42 11.0 5.86 12.6 6.35 13.7 6.86 14.2 7.41
170 1.4 4.30 3.1 4.45 5.0 4.70 7.1 5.03 9.1 5.42 10.9 5.86 12.4 6.35 13.5 6.86 14.0 7.41
175 1.4 4.30 3.0 4.45 5.0 4.70 7.0 5.03 8.9 5.42 10.7 5.86 12.2 6.35 13.3 6.86 13.8 7.41180 1.3 4.30 3.0 4.45 4.9 4.70 6.9 5.03 8.8 5.42 10.6 5.86 12.1 6.35 13.1 6.86 13.6 7.41
185 1.3 4.30 3.0 4.45 4.8 4.70 6.8 5.03 8.7 5.42 10.5 5.86 11.9 6.35 12.9 6.86 13.4 7.41
190 1.3 4.30 2.9 4.45 4.8 4.70 6.7 5.03 8.6 5.42 10.3 5.86 11.8 6.35 12.8 6.86 13.2 7.41
195 1.3 4.30 2.9 4.45 4.7 4.70 6.6 5.03 8.5 5.42 10.2 5.86 11.6 6.35 12.6 6.86 13.0 7.41
200 1.2 4.30 2.8 4.45 4.6 4.70 6.5 5.03 8.4 5.42 10.1 5.86 11.4 6.35 12.4 6.86 12.8 7.41
205 1.2 4.30 2.8 4.45 4.6 4.70 6.4 5.03 8.3 5.42 9.9 5.86 11.3 6.35 12.2 6.86 12.6 7.41
210 1.2 4.30 2.7 4.45 4.5 4.70 6.3 5.03 8.1 5.42 9.8 5.86 11.1 6.35 12.0 6.86 12.4 7.41
215 1.2 4.30 2.7 4.45 4.4 4.70 6.2 5.03 8.0 5.42 9.6 5.86 11.0 6.35 11.8 6.86 12.2 7.41
220 1.1 4.30 2.6 4.45 4.3 4.70 6.2 5.03 7.9 5.42 9.5 5.86 10.8 6.35 11.7 6.86 12.0 7.41
225 1.1 4.30 2.6 4.45 4.3 4.70 6.1 5.03 7.8 5.42 9.4 5.86 10.6 6.35 11.5 6.86 11.8 7.41
4 155 1.8 4.30 3.8 4.45 5.9 4.70 8.0 5.03 9.9 5.42 11.4 5.86 12.6 6.35 13.2 6.86
160 1.8 4.30 3.8 4.45 5.8 4.70 7.9 5.03 9.7 5.42 11.3 5.86 12.5 6.35 13.0 6.86

8/10/2019 n We a 2011 Norms Report
http://slidepdf.com/reader/full/n-we-a-2011-norms-report 187/268
N W E A 2 0 1 1 R I T S c a l e N o r m s | 171
Table C.24. Means (M) and Standard Deviations (sd ) of Academic Growth by Starting RIT Score and Starting Instr ucti onal Week forVarious Endi ng Inst ruct ional Weeks - MATHEMATICS, GRADE 3
Ending Instruction al Weeks
Start Prior Grd Focal Grade
Inst. Start 36 4 8 12 16 20 24 28 32 36
Wk RIT M sd M sd M sd M sd M sd M sd M sd M sd M sd M sd
165 1.7 4.30 3.7 4.45 5.8 4.70 7.8 5.03 9.6 5.42 11.2 5.86 12.3 6.35 12.8 6.86
170 1.7 4.30 3.7 4.45 5.7 4.70 7.7 5.03 9.5 5.42 11.0 5.86 12.1 6.35 12.7 6.86
175 1.7 4.30 3.6 4.45 5.6 4.70 7.6 5.03 9.4 5.42 10.9 5.86 12.0 6.35 12.5 6.86
180 1.7 4.30 3.6 4.45 5.6 4.70 7.5 5.03 9.3 5.42 10.8 5.86 11.8 6.35 12.3 6.86
185 1.7 4.30 3.5 4.45 5.5 4.70 7.4 5.03 9.2 5.42 10.6 5.86 11.6 6.35 12.1 6.86
190 1.6 4.30 3.5 4.45 5.4 4.70 7.3 5.03 9.1 5.42 10.5 5.86 11.5 6.35 11.9 6.86
195 1.6 4.30 3.4 4.45 5.4 4.70 7.2 5.03 8.9 5.42 10.3 5.86 11.3 6.35 11.7 6.86
200 1.6 4.30 3.4 4.45 5.3 4.70 7.1 5.03 8.8 5.42 10.2 5.86 11.2 6.35 11.6 6.86
205 1.6 4.30 3.3 4.45 5.2 4.70 7.0 5.03 8.7 5.42 10.1 5.86 11.0 6.35 11.4 6.86
210 1.5 4.30 3.3 4.45 5.1 4.70 7.0 5.03 8.6 5.42 9.9 5.86 10.8 6.35 11.2 6.86
215 1.5 4.30 3.3 4.45 5.1 4.70 6.9 5.03 8.5 5.42 9.8 5.86 10.7 6.35 11.0 6.86
220 1.5 4.30 3.2 4.45 5.0 4.70 6.8 5.03 8.4 5.42 9.7 5.86 10.5 6.35 10.8 6.86
225 1.5 4.30 3.2 4.45 4.9 4.70 6.7 5.03 8.3 5.42 9.5 5.86 10.4 6.35 10.6 6.86
8 160 2.0 4.30 4.1 4.45 6.1 4.70 8.0 5.03 9.5 5.42 10.7 5.86 11.3 6.35
165 2.0 4.30 4.0 4.45 6.0 4.70 7.9 5.03 9.4 5.42 10.5 5.86 11.1 6.35
170 1.9 4.30 4.0 4.45 6.0 4.70 7.8 5.03 9.3 5.42 10.4 5.86 10.9 6.35
175 1.9 4.30 3.9 4.45 5.9 4.70 7.7 5.03 9.2 5.42 10.3 5.86 10.8 6.35
180 1.9 4.30 3.9 4.45 5.8 4.70 7.6 5.03 9.1 5.42 10.1 5.86 10.6 6.35
185 1.9 4.30 3.8 4.45 5.8 4.70 7.5 5.03 9.0 5.42 10.0 5.86 10.5 6.35
190 1.9 4.30 3.8 4.45 5.7 4.70 7.4 5.03 8.9 5.42 9.9 5.86 10.3 6.35
195 1.8 4.30 3.7 4.45 5.6 4.70 7.3 5.03 8.7 5.42 9.7 5.86 10.1 6.35
200 1.8 4.30 3.7 4.45 5.6 4.70 7.2 5.03 8.6 5.42 9.6 5.86 10.0 6.35205 1.8 4.30 3.7 4.45 5.5 4.70 7.1 5.03 8.5 5.42 9.4 5.86 9.8 6.35
210 1.8 4.30 3.6 4.45 5.4 4.70 7.1 5.03 8.4 5.42 9.3 5.86 9.7 6.35
215 1.7 4.30 3.6 4.45 5.4 4.70 7.0 5.03 8.3 5.42 9.2 5.86 9.5 6.35
220 1.7 4.30 3.5 4.45 5.3 4.70 6.9 5.03 8.2 5.42 9.0 5.86 9.3 6.35
225 1.7 4.30 3.5 4.45 5.2 4.70 6.8 5.03 8.1 5.42 8.9 5.86 9.2 6.35
12 160 2.1 4.30 4.1 4.45 6.0 4.70 7.6 5.03 8.7 5.42 9.3 5.86
165 2.1 4.30 4.1 4.45 5.9 4.70 7.5 5.03 8.6 5.42 9.1 5.86
170 2.0 4.30 4.0 4.45 5.9 4.70 7.4 5.03 8.5 5.42 9.0 5.86
175 2.0 4.30 4.0 4.45 5.8 4.70 7.3 5.03 8.4 5.42 8.9 5.86
180 2.0 4.30 3.9 4.45 5.7 4.70 7.2 5.03 8.2 5.42 8.7 5.86
185 2.0 4.30 3.9 4.45 5.6 4.70 7.1 5.03 8.1 5.42 8.6 5.86
190 1.9 4.30 3.8 4.45 5.6 4.70 7.0 5.03 8.0 5.42 8.5 5.86

8/10/2019 n We a 2011 Norms Report
http://slidepdf.com/reader/full/n-we-a-2011-norms-report 188/268
172 | N W E A 2 0 1 1 R I T S c a l e N o r m s
Table C.24. Means (M) and Standard Deviations (sd ) of Academic Growth by Starting RIT Score and Starting Instr ucti onal Week forVarious Endi ng Inst ruct ional Weeks - MATHEMATICS, GRADE 3
Ending Instruction al Weeks
Start Prior Grd Focal Grade
Inst. Start 36 4 8 12 16 20 24 28 32 36
Wk RIT M sd M sd M sd M sd M sd M sd M sd M sd M sd M sd
195 1.9 4.30 3.8 4.45 5.5 4.70 6.9 5.03 7.9 5.42 8.3 5.86
200 1.9 4.30 3.8 4.45 5.4 4.70 6.8 5.03 7.8 5.42 8.2 5.86
205 1.9 4.30 3.7 4.45 5.4 4.70 6.7 5.03 7.7 5.42 8.0 5.86
210 1.9 4.30 3.7 4.45 5.3 4.70 6.6 5.03 7.6 5.42 7.9 5.86
215 1.8 4.30 3.6 4.45 5.2 4.70 6.5 5.03 7.4 5.42 7.8 5.86
220 1.8 4.30 3.6 4.45 5.2 4.70 6.5 5.03 7.3 5.42 7.6 5.86
225 1.8 4.30 3.5 4.45 5.1 4.70 6.4 5.03 7.2 5.42 7.5 5.86
16 165 2.0 4.30 3.9 4.45 5.4 4.70 6.5 5.03 7.1 5.42
170 2.0 4.30 3.8 4.45 5.3 4.70 6.4 5.03 7.0 5.42
175 2.0 4.30 3.8 4.45 5.3 4.70 6.3 5.03 6.9 5.42
180 2.0 4.30 3.7 4.45 5.2 4.70 6.3 5.03 6.7 5.42
185 1.9 4.30 3.7 4.45 5.1 4.70 6.2 5.03 6.6 5.42
190 1.9 4.30 3.6 4.45 5.1 4.70 6.1 5.03 6.5 5.42
195 1.9 4.30 3.6 4.45 5.0 4.70 6.0 5.03 6.4 5.42
200 1.9 4.30 3.5 4.45 4.9 4.70 5.9 5.03 6.3 5.42
205 1.8 4.30 3.5 4.45 4.9 4.70 5.8 5.03 6.2 5.42
210 1.8 4.30 3.5 4.45 4.8 4.70 5.7 5.03 6.1 5.42
215 1.8 4.30 3.4 4.45 4.7 4.70 5.6 5.03 5.9 5.42
220 1.8 4.30 3.4 4.45 4.7 4.70 5.5 5.03 5.8 5.42
225 1.7 4.30 3.3 4.45 4.6 4.70 5.4 5.03 5.7 5.42
20 165 1.9 4.30 3.4 4.45 4.5 4.70 5.1 5.03
170 1.8 4.30 3.4 4.45 4.4 4.70 5.0 5.03175 1.8 4.30 3.3 4.45 4.4 4.70 4.9 5.03
180 1.8 4.30 3.3 4.45 4.3 4.70 4.8 5.03
185 1.8 4.30 3.2 4.45 4.2 4.70 4.7 5.03
190 1.7 4.30 3.2 4.45 4.2 4.70 4.6 5.03
195 1.7 4.30 3.1 4.45 4.1 4.70 4.5 5.03
200 1.7 4.30 3.1 4.45 4.0 4.70 4.4 5.03
205 1.7 4.30 3.0 4.45 4.0 4.70 4.3 5.03
210 1.6 4.30 3.0 4.45 3.9 4.70 4.2 5.03
215 1.6 4.30 2.9 4.45 3.8 4.70 4.2 5.03
220 1.6 4.30 2.9 4.45 3.8 4.70 4.1 5.03
225 1.6 4.30 2.8 4.45 3.7 4.70 4.0 5.03

8/10/2019 n We a 2011 Norms Report
http://slidepdf.com/reader/full/n-we-a-2011-norms-report 189/268
N W E A 2 0 1 1 R I T S c a l e N o r m s | 173
Table C.25. Means (M) and Standard Deviations (sd) o f Academic Growth by Starting RIT Score and Starting Instru ctional Week forVarious Ending Instructional Weeks - MATHEMATICS, GRADE 4
Table C.25. Means (M) and Standard Deviations (sd) of Academic Grow th by Starting RIT Score and Starting Inst ruct ional Week forVarious Endi ng Inst ruct ional Weeks - MATHEMATICS, GRADE 4
Ending Instruction al Weeks
Start Prior Grd Focal Grade
Inst. Start 36 4 8 12 16 20 24 28 32 36
Wk RIT M sd M sd M sd M sd M sd M sd M sd M sd M sd M sd
32(Gd 3)
165 0.3 4.29 1.1 4.43 2.2 4.65 3.4 4.94 4.8 5.30 6.1 5.70 7.4 6.14 8.3 6.61 9.0 7.11 9.2 7.63
1700.4 4.29 1.1 4.43 2.2 4.65 3.5 4.94 4.9 5.30 6.3 5.70 7.5 6.14 8.5 6.61 9.2 7.11 9.4 7.63175 0.4 4.29 1.2 4.43 2.3 4.65 3.6 4.94 5.0 5.30 6.4 5.70 7.6 6.14 8.7 6.61 9.4 7.11 9.6 7.63
180 0.4 4.29 1.2 4.43 2.3 4.65 3.7 4.94 5.1 5.30 6.5 5.70 7.8 6.14 8.8 6.61 9.5 7.11 9.8 7.63
185 0.4 4.29 1.3 4.43 2.4 4.65 3.8 4.94 5.2 5.30 6.6 5.70 7.9 6.14 9.0 6.61 9.7 7.11 10.0 7.63
190 0.4 4.29 1.3 4.43 2.5 4.65 3.8 4.94 5.3 5.30 6.7 5.70 8.1 6.14 9.2 6.61 9.9 7.11 10.2 7.63
195 0.5 4.29 1.3 4.43 2.5 4.65 3.9 4.94 5.4 5.30 6.9 5.70 8.2 6.14 9.3 6.61 10.1 7.11 10.4 7.63
200 0.5 4.29 1.4 4.43 2.6 4.65 4.0 4.94 5.5 5.30 7.0 5.70 8.3 6.14 9.5 6.61 10.3 7.11 10.6 7.63
205 0.5 4.29 1.4 4.43 2.6 4.65 4.1 4.94 5.6 5.30 7.1 5.70 8.5 6.14 9.6 6.61 10.5 7.11 10.8 7.63
210 0.5 4.29 1.5 4.43 2.7 4.65 4.2 4.94 5.7 5.30 7.2 5.70 8.6 6.14 9.8 6.61 10.6 7.11 11.0 7.63
215 0.5 4.29 1.5 4.43 2.8 4.65 4.2 4.94 5.8 5.30 7.3 5.70 8.8 6.14 10.0 6.61 10.8 7.11 11.2 7.63
220 0.6 4.29 1.5 4.43 2.8 4.65 4.3 4.94 5.9 5.30 7.5 5.70 8.9 6.14 10.1 6.61 11.0 7.11 11.4 7.63
225 0.6 4.29 1.6 4.43 2.9 4.65 4.4 4.94 6.0 5.30 7.6 5.70 9.1 6.14 10.3 6.61 11.2 7.11 11.6 7.63
230 0.6 4.29 1.6 4.43 2.9 4.65 4.5 4.94 6.1 5.3 7.7 5.70 9.19 6.14 10.5 6.61 11.4 7.11 11.8 7.63
36(Gd 3)
165 0.8 4.29 1.8 4.43 3.1 4.65 4.4 4.94 5.8 5.30 7.0 5.70 8.0 6.14 8.7 6.61 8.9 7.11
170 0.8 4.29 1.9 4.43 3.1 4.65 4.5 4.94 5.9 5.30 7.1 5.70 8.1 6.14 8.8 6.61 9.1 7.11
175 0.8 4.29 1.9 4.43 3.2 4.65 4.6 4.94 6.0 5.30 7.3 5.70 8.3 6.14 9.0 6.61 9.2 7.11
180 0.8 4.29 1.9 4.43 3.3 4.65 4.7 4.94 6.1 5.30 7.4 5.70 8.4 6.14 9.2 6.61 9.4 7.11
185 0.8 4.29 2.0 4.43 3.3 4.65 4.8 4.94 6.2 5.30 7.5 5.70 8.6 6.14 9.3 6.61 9.6 7.11
190 0.9 4.29 2.0 4.43 3.4 4.65 4.9 4.94 6.3 5.30 7.6 5.70 8.7 6.14 9.5 6.61 9.8 7.11195 0.9 4.29 2.1 4.43 3.5 4.65 4.9 4.94 6.4 5.30 7.7 5.70 8.9 6.14 9.6 6.61 10.0 7.11
200 0.9 4.29 2.1 4.43 3.5 4.65 5.0 4.94 6.5 5.30 7.9 5.70 9.0 6.14 9.8 6.61 10.2 7.11
205 0.9 4.29 2.1 4.43 3.6 4.65 5.1 4.94 6.6 5.30 8.0 5.70 9.1 6.14 10.0 6.61 10.3 7.11
210 0.9 4.29 2.2 4.43 3.6 4.65 5.2 4.94 6.7 5.30 8.1 5.70 9.3 6.14 10.1 6.61 10.5 7.11
215 1.0 4.29 2.2 4.43 3.7 4.65 5.3 4.94 6.8 5.30 8.2 5.70 9.4 6.14 10.3 6.61 10.7 7.11
220 1.0 4.29 2.3 4.43 3.8 4.65 5.3 4.94 6.9 5.30 8.4 5.70 9.6 6.14 10.4 6.61 10.9 7.11
225 1.0 4.29 2.3 4.43 3.8 4.65 5.4 4.94 7.0 5.30 8.5 5.70 9.7 6.14 10.6 6.61 11.1 7.11
230 1.0 4.29 2.3 4.43 3.9 4.65 5.5 4.94 7.1 5.30 8.6 5.70 9.8 6.14 10.8 6.61 11.2 7.11
4 170 1.1 4.29 2.4 4.43 3.8 4.65 5.1 4.94 6.4 5.30 7.4 5.70 8.1 6.14 8.3 6.61
175 1.1 4.29 2.4 4.43 3.8 4.65 5.2 4.94 6.5 5.30 7.5 5.70 8.2 6.14 8.4 6.61
180 1.1 4.29 2.5 4.43 3.9 4.65 5.3 4.94 6.6 5.30 7.6 5.70 8.3 6.14 8.6 6.61
185 1.1 4.29 2.5 4.43 3.9 4.65 5.4 4.94 6.7 5.30 7.7 5.70 8.5 6.14 8.8 6.61

8/10/2019 n We a 2011 Norms Report
http://slidepdf.com/reader/full/n-we-a-2011-norms-report 190/268
174 | N W E A 2 0 1 1 R I T S c a l e N o r m s
Table C.25. Means (M) and Standard Deviations (sd) of Academic Grow th by Starting RIT Score and Starting Inst ruct ional Week forVarious Endi ng Inst ruct ional Weeks - MATHEMATICS, GRADE 4
Ending Instruction al Weeks
Start Prior Grd Focal Grade
Inst. Start 36 4 8 12 16 20 24 28 32 36
Wk RIT M sd M sd M sd M sd M sd M sd M sd M sd M sd M sd
190 1.2 4.29 2.5 4.43 4.0 4.65 5.4 4.94 6.8 5.30 7.9 5.70 8.6 6.14 8.9 6.61
195 1.2 4.29 2.6 4.43 4.1 4.65 5.5 4.94 6.9 5.30 8.0 5.70 8.8 6.14 9.1 6.61
200 1.2 4.29 2.6 4.43 4.1 4.65 5.6 4.94 7.0 5.30 8.1 5.70 8.9 6.14 9.3 6.61
205 1.2 4.29 2.7 4.43 4.2 4.65 5.7 4.94 7.1 5.30 8.2 5.70 9.0 6.14 9.4 6.61
210 1.3 4.29 2.7 4.43 4.2 4.65 5.8 4.94 7.2 5.30 8.3 5.70 9.2 6.14 9.6 6.61
215 1.3 4.29 2.7 4.43 4.3 4.65 5.8 4.94 7.3 5.30 8.5 5.70 9.3 6.14 9.7 6.61
220 1.3 4.29 2.8 4.43 4.4 4.65 5.9 4.94 7.4 5.30 8.6 5.70 9.5 6.14 9.9 6.61
225 1.3 4.29 2.8 4.43 4.4 4.65 6.0 4.94 7.5 5.30 8.7 5.70 9.6 6.14 10.1 6.61
230 1.3 4.29 2.9 4.43 4.5 4.65 6.1 4.94 7.6 5.30 8.8 5.70 9.8 6.14 10.2 6.61
8 170 1.3 4.29 2.7 4.43 4.0 4.65 5.3 4.94 6.3 5.30 7.0 5.70 7.2 6.14
175 1.3 4.29 2.7 4.43 4.1 4.65 5.4 4.94 6.4 5.30 7.1 5.70 7.3 6.14
180 1.3 4.29 2.7 4.43 4.2 4.65 5.4 4.94 6.5 5.30 7.2 5.70 7.5 6.14
185 1.4 4.29 2.8 4.43 4.2 4.65 5.5 4.94 6.6 5.30 7.3 5.70 7.6 6.14
190 1.4 4.29 2.8 4.43 4.3 4.65 5.6 4.94 6.7 5.30 7.5 5.70 7.8 6.14
195 1.4 4.29 2.9 4.43 4.3 4.65 5.7 4.94 6.8 5.30 7.6 5.70 7.9 6.14
200 1.4 4.29 2.9 4.43 4.4 4.65 5.8 4.94 6.9 5.30 7.7 5.70 8.0 6.14
205 1.4 4.29 3.0 4.43 4.5 4.65 5.8 4.94 7.0 5.30 7.8 5.70 8.2 6.14
210 1.5 4.29 3.0 4.43 4.5 4.65 5.9 4.94 7.1 5.30 7.9 5.70 8.3 6.14
215 1.5 4.29 3.0 4.43 4.6 4.65 6.0 4.94 7.2 5.30 8.1 5.70 8.5 6.14
220 1.5 4.29 3.1 4.43 4.6 4.65 6.1 4.94 7.3 5.30 8.2 5.70 8.6 6.14
225 1.5 4.29 3.1 4.43 4.7 4.65 6.2 4.94 7.4 5.30 8.3 5.70 8.8 6.14
230 1.5 4.29 3.2 4.43 4.8 4.65 6.2 4.94 7.5 5.30 8.4 5.70 8.9 6.1412 170 1.4 4.29 2.7 4.43 4.0 4.65 5.0 4.94 5.7 5.30 5.9 5.70
175 1.4 4.29 2.8 4.43 4.1 4.65 5.1 4.94 5.8 5.30 6.0 5.70
180 1.4 4.29 2.8 4.43 4.1 4.65 5.2 4.94 5.9 5.30 6.2 5.70
185 1.4 4.29 2.9 4.43 4.2 4.65 5.2 4.94 6.0 5.30 6.3 5.70
190 1.5 4.29 2.9 4.43 4.2 4.65 5.3 4.94 6.1 5.30 6.4 5.70
195 1.5 4.29 3.0 4.43 4.3 4.65 5.4 4.94 6.2 5.30 6.5 5.70
200 1.5 4.29 3.0 4.43 4.4 4.65 5.5 4.94 6.3 5.30 6.6 5.70
205 1.5 4.29 3.0 4.43 4.4 4.65 5.6 4.94 6.4 5.30 6.8 5.70
210 1.5 4.29 3.1 4.43 4.5 4.65 5.7 4.94 6.5 5.30 6.9 5.70
215 1.6 4.29 3.1 4.43 4.5 4.65 5.7 4.94 6.6 5.30 7.0 5.70
220 1.6 4.29 3.2 4.43 4.6 4.65 5.8 4.94 6.7 5.30 7.1 5.70
225 1.6 4.29 3.2 4.43 4.7 4.65 5.9 4.94 6.8 5.30 7.2 5.70

8/10/2019 n We a 2011 Norms Report
http://slidepdf.com/reader/full/n-we-a-2011-norms-report 191/268
N W E A 2 0 1 1 R I T S c a l e N o r m s | 175
Table C.25. Means (M) and Standard Deviations (sd) of Academic Grow th by Starting RIT Score and Starting Inst ruct ional Week forVarious Endi ng Inst ruct ional Weeks - MATHEMATICS, GRADE 4
Ending Instruction al Weeks
Start Prior Grd Focal Grade
Inst. Start 36 4 8 12 16 20 24 28 32 36
Wk RIT M sd M sd M sd M sd M sd M sd M sd M sd M sd M sd
230 1.6 4.29 3.2 4.43 4.7 4.65 6.0 4.94 6.9 5.30 7.4 5.70
16 170 1.4 4.29 2.6 4.43 3.6 4.65 4.3 4.94 4.5 5.30
175 1.4 4.29 2.7 4.43 3.7 4.65 4.4 4.94 4.6 5.30
1801.4 4.29 2.7 4.43 3.7 4.65 4.5 4.94 4.7 5.30185 1.4 4.29 2.7 4.43 3.8 4.65 4.5 4.94 4.8 5.30
190 1.5 4.29 2.8 4.43 3.9 4.65 4.6 4.94 4.9 5.30
195 1.5 4.29 2.8 4.43 3.9 4.65 4.7 4.94 5.0 5.30
200 1.5 4.29 2.9 4.43 4.0 4.65 4.8 4.94 5.1 5.30
205 1.5 4.29 2.9 4.43 4.1 4.65 4.9 4.94 5.2 5.30
210 1.5 4.29 2.9 4.43 4.1 4.65 5.0 4.94 5.3 5.30
215 1.6 4.29 3.0 4.43 4.2 4.65 5.0 4.94 5.4 5.30
220 1.6 4.29 3.0 4.43 4.2 4.65 5.1 4.94 5.5 5.30
225 1.6 4.29 3.1 4.43 4.3 4.65 5.2 4.94 5.6 5.30
230 1.6 4.29 3.1 4.43 4.4 4.65 5.3 4.94 5.7 5.30
20 170 1.2 4.29 2.3 4.43 2.9 4.65 3.2 4.94
175 1.3 4.29 2.3 4.43 3.0 4.65 3.3 4.94
180 1.3 4.29 2.3 4.43 3.1 4.65 3.3 4.94
185 1.3 4.29 2.4 4.43 3.1 4.65 3.4 4.94
190 1.3 4.29 2.4 4.43 3.2 4.65 3.5 4.94
195 1.3 4.29 2.5 4.43 3.2 4.65 3.6 4.94
200 1.4 4.29 2.5 4.43 3.3 4.65 3.7 4.94
205 1.4 4.29 2.5 4.43 3.4 4.65 3.7 4.94210 1.4 4.29 2.6 4.43 3.4 4.65 3.8 4.94
215 1.4 4.29 2.6 4.43 3.5 4.65 3.9 4.94
220 1.5 4.29 2.7 4.43 3.5 4.65 4.0 4.94
225 1.5 4.29 2.7 4.43 3.6 4.65 4.1 4.94
230 1.5 4.29 2.7 4.43 3.7 4.65 4.1 4.94

8/10/2019 n We a 2011 Norms Report
http://slidepdf.com/reader/full/n-we-a-2011-norms-report 192/268
176 | N W E A 2 0 1 1 R I T S c a l e N o r m s
Table C.26. Means (M) and Standard Deviations (sd) o f Academic Growth by Starting RIT Score and Starting Instru ctional Week forVarious Ending Instructional Weeks - MATHEMATICS, GRADE 5
Table C.26. Means (M) and Standard Deviations (sd) of Academic Grow th by Starting RIT Score and Starting Inst ruct ional Week forVarious Endi ng Inst ruct ional Weeks - MATHEMATICS, GRADE 5
Ending Instruction al Weeks
Start Prior Grd Focal Grade
Inst. Start 36 4 8 12 16 20 24 28 32 36
Wk RIT M sd M sd M sd M sd M sd M sd M sd M sd M sd M sd
32(Gd 4)
175 0.4 4.29 1.3 4.44 2.5 4.67 3.9 4.98 5.4 5.34 6.8 5.76 8.1 6.22 9.0 6.71 9.5 7.22 9.5 7.76
1800.4 4.29 1.3 4.44 2.5 4.67 3.9 4.98 5.4 5.34 6.8 5.76 8.1 6.22 9.0 6.71 9.6 7.22 9.5 7.76185 0.4 4.29 1.3 4.44 2.5 4.67 3.9 4.98 5.4 5.34 6.8 5.76 8.1 6.22 9.0 6.71 9.6 7.22 9.6 7.76
190 0.4 4.29 1.3 4.44 2.5 4.67 3.9 4.98 5.4 5.34 6.9 5.76 8.1 6.22 9.1 6.71 9.6 7.22 9.6 7.76
195 0.4 4.29 1.3 4.44 2.5 4.67 3.9 4.98 5.4 5.34 6.9 5.76 8.1 6.22 9.1 6.71 9.6 7.22 9.6 7.76
200 0.4 4.29 1.3 4.44 2.5 4.67 4.0 4.98 5.4 5.34 6.9 5.76 8.1 6.22 9.1 6.71 9.6 7.22 9.6 7.76
205 0.4 4.29 1.3 4.44 2.6 4.67 4.0 4.98 5.5 5.34 6.9 5.76 8.1 6.22 9.1 6.71 9.6 7.22 9.6 7.76
210 0.5 4.29 1.3 4.44 2.6 4.67 4.0 4.98 5.5 5.34 6.9 5.76 8.2 6.22 9.1 6.71 9.7 7.22 9.7 7.76
215 0.5 4.29 1.3 4.44 2.6 4.67 4.0 4.98 5.5 5.34 6.9 5.76 8.2 6.22 9.1 6.71 9.7 7.22 9.7 7.76
220 0.5 4.29 1.4 4.44 2.6 4.67 4.0 4.98 5.5 5.34 6.9 5.76 8.2 6.22 9.2 6.71 9.7 7.22 9.7 7.76
225 0.5 4.29 1.4 4.44 2.6 4.67 4.0 4.98 5.5 5.34 6.9 5.76 8.2 6.22 9.2 6.71 9.7 7.22 9.7 7.76
230 0.5 4.29 1.4 4.44 2.6 4.67 4.0 4.98 5.5 5.34 7.0 5.76 8.2 6.22 9.2 6.71 9.7 7.22 9.7 7.76
235 0.5 4.29 1.4 4.44 2.6 4.67 4.0 4.98 5.5 5.34 7.0 5.76 8.2 6.22 9.2 6.71 9.8 7.22 9.8 7.76
36(Gd 4)
175 0.9 4.29 2.1 4.44 3.5 4.67 5.0 4.98 6.4 5.34 7.6 5.76 8.6 6.22 9.1 6.71 9.1 7.22
180 0.9 4.29 2.1 4.44 3.5 4.67 5.0 4.98 6.4 5.34 7.6 5.76 8.6 6.22 9.1 6.71 9.1 7.22
185 0.9 4.29 2.1 4.44 3.5 4.67 5.0 4.98 6.4 5.34 7.7 5.76 8.6 6.22 9.1 6.71 9.1 7.22
190 0.9 4.29 2.1 4.44 3.5 4.67 5.0 4.98 6.4 5.34 7.7 5.76 8.6 6.22 9.2 6.71 9.1 7.22
195 0.9 4.29 2.1 4.44 3.5 4.67 5.0 4.98 6.4 5.34 7.7 5.76 8.6 6.22 9.2 6.71 9.2 7.22
200 0.9 4.29 2.1 4.44 3.5 4.67 5.0 4.98 6.4 5.34 7.7 5.76 8.7 6.22 9.2 6.71 9.2 7.22
205 0.9 4.29 2.1 4.44 3.5 4.67 5.0 4.98 6.4 5.34 7.7 5.76 8.7 6.22 9.2 6.71 9.2 7.22210 0.9 4.29 2.1 4.44 3.5 4.67 5.0 4.98 6.5 5.34 7.7 5.76 8.7 6.22 9.2 6.71 9.2 7.22
215 0.9 4.29 2.1 4.44 3.5 4.67 5.0 4.98 6.5 5.34 7.7 5.76 8.7 6.22 9.2 6.71 9.2 7.22
220 0.9 4.29 2.1 4.44 3.5 4.67 5.0 4.98 6.5 5.34 7.7 5.76 8.7 6.22 9.3 6.71 9.3 7.22
225 0.9 4.29 2.1 4.44 3.5 4.67 5.0 4.98 6.5 5.34 7.8 5.76 8.7 6.22 9.3 6.71 9.3 7.22
230 0.9 4.29 2.1 4.44 3.6 4.67 5.1 4.98 6.5 5.34 7.8 5.76 8.7 6.22 9.3 6.71 9.3 7.22
235 0.9 4.29 2.1 4.44 3.6 4.67 5.1 4.98 6.5 5.34 7.8 5.76 8.8 6.22 9.3 6.71 9.3 7.22
4 175 1.2 4.29 2.6 4.44 4.1 4.67 5.5 4.98 6.8 5.34 7.7 5.76 8.2 6.22 8.2 6.71
180 1.2 4.29 2.6 4.44 4.1 4.67 5.5 4.98 6.8 5.34 7.7 5.76 8.2 6.22 8.2 6.71
185 1.2 4.29 2.6 4.44 4.1 4.67 5.5 4.98 6.8 5.34 7.7 5.76 8.3 6.22 8.2 6.71
190 1.2 4.29 2.6 4.44 4.1 4.67 5.5 4.98 6.8 5.34 7.7 5.76 8.3 6.22 8.3 6.71
195 1.2 4.29 2.6 4.44 4.1 4.67 5.5 4.98 6.8 5.34 7.8 5.76 8.3 6.22 8.3 6.71
200 1.2 4.29 2.6 4.44 4.1 4.67 5.5 4.98 6.8 5.34 7.8 5.76 8.3 6.22 8.3 6.71

8/10/2019 n We a 2011 Norms Report
http://slidepdf.com/reader/full/n-we-a-2011-norms-report 193/268
N W E A 2 0 1 1 R I T S c a l e N o r m s | 177
Table C.26. Means (M) and Standard Deviations (sd) of Academic Grow th by Starting RIT Score and Starting Inst ruct ional Week forVarious Endi ng Inst ruct ional Weeks - MATHEMATICS, GRADE 5
Ending Instruction al Weeks
Start Prior Grd Focal Grade
Inst. Start 36 4 8 12 16 20 24 28 32 36
Wk RIT M sd M sd M sd M sd M sd M sd M sd M sd M sd M sd
205 1.2 4.29 2.6 4.44 4.1 4.67 5.6 4.98 6.8 5.34 7.8 5.76 8.3 6.22 8.3 6.71
210 1.2 4.29 2.6 4.44 4.1 4.67 5.6 4.98 6.8 5.34 7.8 5.76 8.3 6.22 8.3 6.71
215 1.2 4.29 2.6 4.44 4.1 4.67 5.6 4.98 6.8 5.34 7.8 5.76 8.3 6.22 8.3 6.71
220 1.2 4.29 2.6 4.44 4.1 4.67 5.6 4.98 6.8 5.34 7.8 5.76 8.4 6.22 8.4 6.71
225 1.2 4.29 2.6 4.44 4.1 4.67 5.6 4.98 6.9 5.34 7.8 5.76 8.4 6.22 8.4 6.71
230 1.2 4.29 2.7 4.44 4.1 4.67 5.6 4.98 6.9 5.34 7.8 5.76 8.4 6.22 8.4 6.71
235 1.2 4.29 2.7 4.44 4.2 4.67 5.6 4.98 6.9 5.34 7.9 5.76 8.4 6.22 8.4 6.71
8 175 1.4 4.29 2.9 4.44 4.3 4.67 5.5 4.98 6.5 5.34 7.0 5.76 7.0 6.22
180 1.4 4.29 2.9 4.44 4.3 4.67 5.6 4.98 6.5 5.34 7.0 5.76 7.0 6.22
185 1.4 4.29 2.9 4.44 4.3 4.67 5.6 4.98 6.5 5.34 7.0 5.76 7.0 6.22
190 1.4 4.29 2.9 4.44 4.3 4.67 5.6 4.98 6.5 5.34 7.1 5.76 7.0 6.22
195 1.4 4.29 2.9 4.44 4.3 4.67 5.6 4.98 6.5 5.34 7.1 5.76 7.1 6.22
200 1.4 4.29 2.9 4.44 4.3 4.67 5.6 4.98 6.6 5.34 7.1 5.76 7.1 6.22
205 1.4 4.29 2.9 4.44 4.3 4.67 5.6 4.98 6.6 5.34 7.1 5.76 7.1 6.22
210 1.4 4.29 2.9 4.44 4.3 4.67 5.6 4.98 6.6 5.34 7.1 5.76 7.1 6.22
215 1.4 4.29 2.9 4.44 4.4 4.67 5.6 4.98 6.6 5.34 7.1 5.76 7.1 6.22
220 1.4 4.29 2.9 4.44 4.4 4.67 5.6 4.98 6.6 5.34 7.1 5.76 7.1 6.22
225 1.4 4.29 2.9 4.44 4.4 4.67 5.6 4.98 6.6 5.34 7.1 5.76 7.1 6.22
230 1.4 4.29 2.9 4.44 4.4 4.67 5.6 4.98 6.6 5.34 7.2 5.76 7.2 6.22
235 1.4 4.3 2.9 4.4 4.4 4.7 5.7 4.98 6.6 5.34 7.2 5.76 7.2 6.22
12 175 1.5 4.29 2.9 4.44 4.1 4.67 5.1 4.98 5.6 5.34 5.6 5.76
180 1.5 4.29 2.9 4.44 4.2 4.67 5.1 4.98 5.6 5.34 5.6 5.76185 1.5 4.29 2.9 4.44 4.2 4.67 5.1 4.98 5.6 5.34 5.6 5.76
190 1.5 4.29 2.9 4.44 4.2 4.67 5.1 4.98 5.7 5.34 5.6 5.76
195 1.5 4.29 2.9 4.44 4.2 4.67 5.1 4.98 5.7 5.34 5.7 5.76
200 1.5 4.29 2.9 4.44 4.2 4.67 5.1 4.98 5.7 5.34 5.7 5.76
205 1.5 4.29 2.9 4.44 4.2 4.67 5.1 4.98 5.7 5.34 5.7 5.76
210 1.5 4.29 2.9 4.44 4.2 4.67 5.2 4.98 5.7 5.34 5.7 5.76
215 1.5 4.29 2.9 4.44 4.2 4.67 5.2 4.98 5.7 5.34 5.7 5.76
220 1.5 4.29 2.9 4.44 4.2 4.67 5.2 4.98 5.7 5.34 5.7 5.76
225 1.5 4.29 2.9 4.44 4.2 4.67 5.2 4.98 5.7 5.34 5.7 5.76
230 1.5 4.29 2.9 4.44 4.2 4.67 5.2 4.98 5.7 5.34 5.7 5.76
235 1.5 4.29 3.0 4.44 4.2 4.67 5.2 4.98 5.7 5.34 5.8 5.76
16 180 1.4 4.29 2.7 4.44 3.6 4.67 4.2 4.98 4.1 5.34
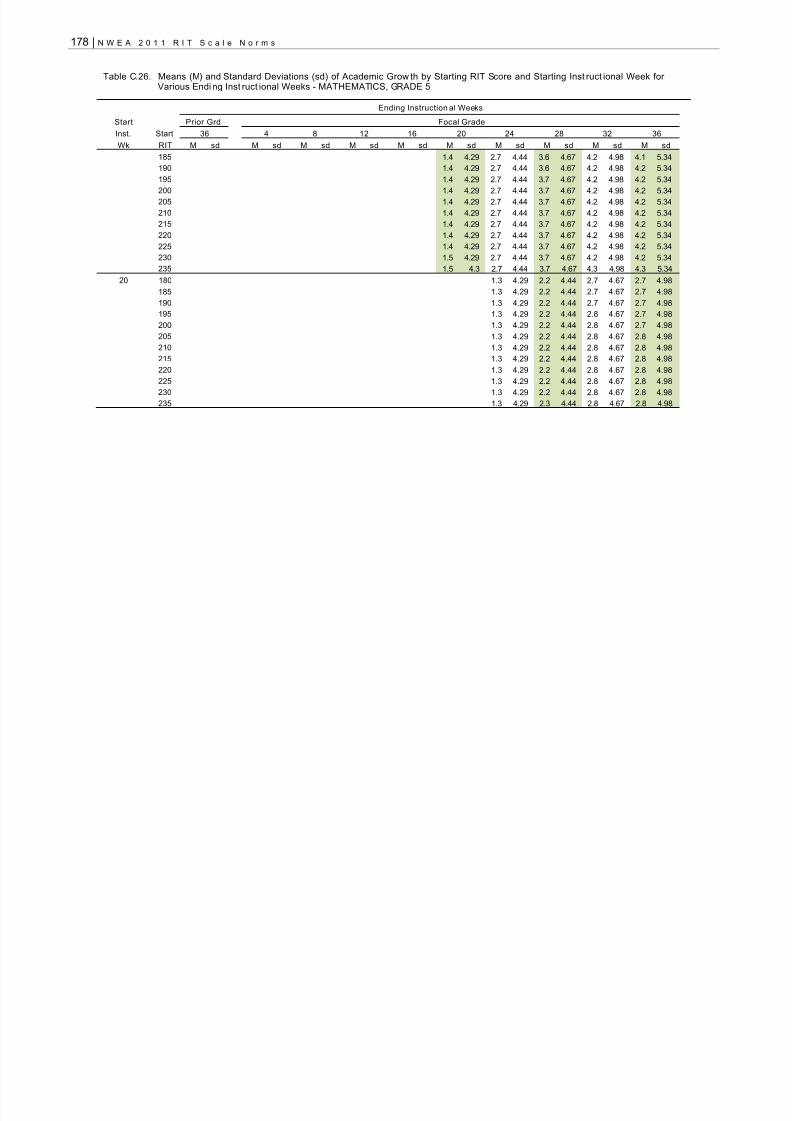
8/10/2019 n We a 2011 Norms Report
http://slidepdf.com/reader/full/n-we-a-2011-norms-report 194/268
178 | N W E A 2 0 1 1 R I T S c a l e N o r m s
Table C.26. Means (M) and Standard Deviations (sd) of Academic Grow th by Starting RIT Score and Starting Inst ruct ional Week forVarious Endi ng Inst ruct ional Weeks - MATHEMATICS, GRADE 5
Ending Instruction al Weeks
Start Prior Grd Focal Grade
Inst. Start 36 4 8 12 16 20 24 28 32 36
Wk RIT M sd M sd M sd M sd M sd M sd M sd M sd M sd M sd
185 1.4 4.29 2.7 4.44 3.6 4.67 4.2 4.98 4.1 5.34
190 1.4 4.29 2.7 4.44 3.6 4.67 4.2 4.98 4.2 5.34
195 1.4 4.29 2.7 4.44 3.7 4.67 4.2 4.98 4.2 5.34
200 1.4 4.29 2.7 4.44 3.7 4.67 4.2 4.98 4.2 5.34
205 1.4 4.29 2.7 4.44 3.7 4.67 4.2 4.98 4.2 5.34
210 1.4 4.29 2.7 4.44 3.7 4.67 4.2 4.98 4.2 5.34
215 1.4 4.29 2.7 4.44 3.7 4.67 4.2 4.98 4.2 5.34
220 1.4 4.29 2.7 4.44 3.7 4.67 4.2 4.98 4.2 5.34
225 1.4 4.29 2.7 4.44 3.7 4.67 4.2 4.98 4.2 5.34
230 1.5 4.29 2.7 4.44 3.7 4.67 4.2 4.98 4.2 5.34
235 1.5 4.3 2.7 4.44 3.7 4.67 4.3 4.98 4.3 5.34
20 180 1.3 4.29 2.2 4.44 2.7 4.67 2.7 4.98
185 1.3 4.29 2.2 4.44 2.7 4.67 2.7 4.98
190 1.3 4.29 2.2 4.44 2.7 4.67 2.7 4.98
195 1.3 4.29 2.2 4.44 2.8 4.67 2.7 4.98
200 1.3 4.29 2.2 4.44 2.8 4.67 2.7 4.98
205 1.3 4.29 2.2 4.44 2.8 4.67 2.8 4.98
210 1.3 4.29 2.2 4.44 2.8 4.67 2.8 4.98
215 1.3 4.29 2.2 4.44 2.8 4.67 2.8 4.98
220 1.3 4.29 2.2 4.44 2.8 4.67 2.8 4.98
225 1.3 4.29 2.2 4.44 2.8 4.67 2.8 4.98
230 1.3 4.29 2.2 4.44 2.8 4.67 2.8 4.98235 1.3 4.29 2.3 4.44 2.8 4.67 2.8 4.98

8/10/2019 n We a 2011 Norms Report
http://slidepdf.com/reader/full/n-we-a-2011-norms-report 195/268
N W E A 2 0 1 1 R I T S c a l e N o r m s | 179
Table C.27. Means (M) and Standard Deviations (sd) o f Academic Growth by Starting RIT Score and Starting Instru ctional Week forVarious Ending Instructional Weeks - MATHEMATICS, GRADE 6
Table C.27. Means (M) and Standard Deviations (sd ) of Academic Growth by Starting RIT Score and Starting Instructi onal Week forVarious Ending Instructional Weeks - MATHEMATICS, GRADE 6
Ending Instruction al Weeks
Start Prior Grd Focal Grade
Inst. Start 36 4 8 12 16 20 24 28 32 36
Wk RIT M sd M sd M sd M sd M sd M sd M sd M sd M sd M sd
32(Gd 5)
175 -0.2 4.30 0.1 4.45 0.8 4.70 1.7 5.03 2.7 5.42 3.7 5.87 4.8 6.35 5.6 6.87 6.2 7.41 6.4 7.98
180-0.2 4.30 0.1 4.45 0.8 4.70 1.7 5.03 2.7 5.42 3.8 5.87 4.8 6.35 5.6 6.87 6.2 7.41 6.4 7.98185 -0.2 4.30 0.1 4.45 0.8 4.70 1.7 5.03 2.7 5.42 3.8 5.87 4.8 6.35 5.6 6.87 6.2 7.41 6.5 7.98
190 -0.2 4.30 0.1 4.45 0.8 4.70 1.7 5.03 2.7 5.42 3.8 5.87 4.8 6.35 5.7 6.87 6.3 7.41 6.5 7.98
195 -0.2 4.30 0.2 4.45 0.8 4.70 1.7 5.03 2.7 5.42 3.8 5.87 4.8 6.35 5.7 6.87 6.3 7.41 6.5 7.98
200 -0.2 4.30 0.2 4.45 0.8 4.70 1.7 5.03 2.7 5.42 3.8 5.87 4.9 6.35 5.7 6.87 6.3 7.41 6.5 7.98
205 -0.1 4.30 0.2 4.45 0.8 4.70 1.7 5.03 2.8 5.42 3.8 5.87 4.9 6.35 5.7 6.87 6.3 7.41 6.6 7.98
210 -0.1 4.30 0.2 4.45 0.8 4.70 1.7 5.03 2.8 5.42 3.9 5.87 4.9 6.35 5.8 6.87 6.4 7.41 6.6 7.98
215 -0.1 4.30 0.2 4.45 0.8 4.70 1.7 5.03 2.8 5.42 3.9 5.87 4.9 6.35 5.8 6.87 6.4 7.41 6.6 7.98
220 -0.1 4.30 0.2 4.45 0.8 4.70 1.8 5.03 2.8 5.42 3.9 5.87 4.9 6.35 5.8 6.87 6.4 7.41 6.7 7.98
225 -0.1 4.30 0.2 4.45 0.9 4.70 1.8 5.03 2.8 5.42 3.9 5.87 5.0 6.35 5.8 6.87 6.4 7.41 6.7 7.98
230 -0.1 4.30 0.2 4.45 0.9 4.70 1.8 5.03 2.8 5.42 3.9 5.87 5.0 6.35 5.8 6.87 6.5 7.41 6.7 7.98
235 -0.1 4.30 0.2 4.45 0.9 4.70 1.8 5.03 2.8 5.42 3.9 5.87 5.0 6.35 5.9 6.87 6.5 7.41 6.7 7.98
240 -0.1 4.30 0.2 4.45 0.9 4.70 1.8 5.03 2.9 5.42 4.0 5.87 5.0 6.35 5.9 6.87 6.5 7.41 6.8 7.98
36(Gd 5)
175 0.3 4.30 0.9 4.45 1.8 4.70 2.8 5.03 3.9 5.42 4.9 5.87 5.8 6.35 6.3 6.87 6.6 7.41
180 0.3 4.30 0.9 4.45 1.8 4.70 2.8 5.03 3.9 5.42 4.9 5.87 5.8 6.35 6.4 6.87 6.6 7.41
185 0.3 4.30 0.9 4.45 1.8 4.70 2.9 5.03 3.9 5.42 5.0 5.87 5.8 6.35 6.4 6.87 6.6 7.41
190 0.3 4.30 0.9 4.45 1.8 4.70 2.9 5.03 3.9 5.42 5.0 5.87 5.8 6.35 6.4 6.87 6.6 7.41
195 0.3 4.30 1.0 4.45 1.8 4.70 2.9 5.03 4.0 5.42 5.0 5.87 5.8 6.35 6.4 6.87 6.7 7.41
200 0.3 4.30 1.0 4.45 1.9 4.70 2.9 5.03 4.0 5.42 5.0 5.87 5.9 6.35 6.5 6.87 6.7 7.41205 0.3 4.30 1.0 4.45 1.9 4.70 2.9 5.03 4.0 5.42 5.0 5.87 5.9 6.35 6.5 6.87 6.7 7.41
210 0.3 4.30 1.0 4.45 1.9 4.70 2.9 5.03 4.0 5.42 5.0 5.87 5.9 6.35 6.5 6.87 6.7 7.41
215 0.3 4.30 1.0 4.45 1.9 4.70 2.9 5.03 4.0 5.42 5.1 5.87 5.9 6.35 6.5 6.87 6.8 7.41
220 0.3 4.30 1.0 4.45 1.9 4.70 2.9 5.03 4.0 5.42 5.1 5.87 5.9 6.35 6.5 6.87 6.8 7.41
225 0.3 4.30 1.0 4.45 1.9 4.70 3.0 5.03 4.0 5.42 5.1 5.87 6.0 6.35 6.6 6.87 6.8 7.41
230 0.3 4.30 1.0 4.45 1.9 4.70 3.0 5.03 4.1 5.42 5.1 5.87 6.0 6.35 6.6 6.87 6.8 7.41
235 0.3 4.30 1.0 4.45 1.9 4.70 3.0 5.03 4.1 5.42 5.1 5.87 6.0 6.35 6.6 6.87 6.9 7.41
240 0.3 4.30 1.0 4.45 1.9 4.70 3.0 5.03 4.1 5.42 5.1 5.87 6.0 6.35 6.6 6.87 6.9 7.41
4 175 0.6 4.30 1.5 4.45 2.6 4.70 3.6 5.03 4.6 5.42 5.5 5.87 6.1 6.35 6.3 6.87
180 0.6 4.30 1.5 4.45 2.6 4.70 3.6 5.03 4.6 5.42 5.5 5.87 6.1 6.35 6.3 6.87
185 0.6 4.30 1.5 4.45 2.6 4.70 3.6 5.03 4.7 5.42 5.5 5.87 6.1 6.35 6.3 6.87
190 0.6 4.30 1.5 4.45 2.6 4.70 3.7 5.03 4.7 5.42 5.5 5.87 6.1 6.35 6.3 6.87

8/10/2019 n We a 2011 Norms Report
http://slidepdf.com/reader/full/n-we-a-2011-norms-report 196/268
180 | N W E A 2 0 1 1 R I T S c a l e N o r m s
Table C.27. Means (M) and Standard Deviations (sd ) of Academic Growth by Starting RIT Score and Starting Instructi onal Week forVarious Ending Instructional Weeks - MATHEMATICS, GRADE 6
Ending Instruction al Weeks
Start Prior Grd Focal Grade
Inst. Start 36 4 8 12 16 20 24 28 32 36
Wk RIT M sd M sd M sd M sd M sd M sd M sd M sd M sd M sd
195 0.7 4.30 1.5 4.45 2.6 4.70 3.7 5.03 4.7 5.42 5.5 5.87 6.1 6.35 6.4 6.87
200 0.7 4.30 1.6 4.45 2.6 4.70 3.7 5.03 4.7 5.42 5.6 5.87 6.2 6.35 6.4 6.87
205 0.7 4.30 1.6 4.45 2.6 4.70 3.7 5.03 4.7 5.42 5.6 5.87 6.2 6.35 6.4 6.87
210 0.7 4.30 1.6 4.45 2.6 4.70 3.7 5.03 4.7 5.42 5.6 5.87 6.2 6.35 6.4 6.87
215 0.7 4.30 1.6 4.45 2.6 4.70 3.7 5.03 4.7 5.42 5.6 5.87 6.2 6.35 6.5 6.87
220 0.7 4.30 1.6 4.45 2.6 4.70 3.7 5.03 4.8 5.42 5.6 5.87 6.2 6.35 6.5 6.87
225 0.7 4.30 1.6 4.45 2.6 4.70 3.7 5.03 4.8 5.42 5.6 5.87 6.3 6.35 6.5 6.87
230 0.7 4.30 1.6 4.45 2.6 4.70 3.7 5.03 4.8 5.42 5.7 5.87 6.3 6.35 6.5 6.87
235 0.7 4.30 1.6 4.45 2.7 4.70 3.8 5.03 4.8 5.42 5.7 5.87 6.3 6.35 6.5 6.87
240 0.7 4.30 1.6 4.45 2.7 4.70 3.8 5.03 4.8 5.42 5.7 5.87 6.3 6.35 6.6 6.87
8 180 0.9 4.30 1.9 4.45 3.0 4.70 4.0 5.03 4.9 5.42 5.4 5.87 5.7 6.35
185 0.9 4.30 1.9 4.45 3.0 4.70 4.0 5.03 4.9 5.42 5.5 5.87 5.7 6.35
190 0.9 4.30 1.9 4.45 3.0 4.70 4.0 5.03 4.9 5.42 5.5 5.87 5.7 6.35
195 0.9 4.30 1.9 4.45 3.0 4.70 4.0 5.03 4.9 5.42 5.5 5.87 5.7 6.35
200 0.9 4.30 1.9 4.45 3.0 4.70 4.0 5.03 4.9 5.42 5.5 5.87 5.7 6.35
205 0.9 4.30 1.9 4.45 3.0 4.70 4.1 5.03 4.9 5.42 5.5 5.87 5.8 6.35
210 0.9 4.30 2.0 4.45 3.0 4.70 4.1 5.03 4.9 5.42 5.5 5.87 5.8 6.35
215 0.9 4.30 2.0 4.45 3.0 4.70 4.1 5.03 5.0 5.42 5.6 5.87 5.8 6.35
220 0.9 4.30 2.0 4.45 3.1 4.70 4.1 5.03 5.0 5.42 5.6 5.87 5.8 6.35
225 0.9 4.30 2.0 4.45 3.1 4.70 4.1 5.03 5.0 5.42 5.6 5.87 5.8 6.35
230 0.9 4.30 2.0 4.45 3.1 4.70 4.1 5.03 5.0 5.42 5.6 5.87 5.9 6.35
235 0.9 4.30 2.0 4.45 3.1 4.70 4.1 5.03 5.0 5.42 5.6 5.87 5.9 6.35240 0.9 4.30 2.0 4.45 3.1 4.70 4.1 5.03 5.0 5.42 5.6 5.87 5.9 6.35
12 180 1.0 4.30 2.1 4.45 3.1 4.70 4.0 5.03 4.6 5.42 4.8 5.87
185 1.0 4.30 2.1 4.45 3.1 4.70 4.0 5.03 4.6 5.42 4.8 5.87
190 1.0 4.30 2.1 4.45 3.1 4.70 4.0 5.03 4.6 5.42 4.8 5.87
195 1.0 4.30 2.1 4.45 3.1 4.70 4.0 5.03 4.6 5.42 4.8 5.87
200 1.0 4.30 2.1 4.45 3.2 4.70 4.0 5.03 4.6 5.42 4.8 5.87
210 1.1 4.30 2.1 4.45 3.2 4.70 4.0 5.03 4.6 5.42 4.9 5.87
215 1.1 4.30 2.1 4.45 3.2 4.70 4.0 5.03 4.7 5.42 4.9 5.87
220 1.1 4.30 2.2 4.45 3.2 4.70 4.1 5.03 4.7 5.42 4.9 5.87
225 1.1 4.30 2.2 4.45 3.2 4.70 4.1 5.03 4.7 5.42 4.9 5.87
230 1.1 4.30 2.2 4.45 3.2 4.70 4.1 5.03 4.7 5.42 4.9 5.87
235 1.1 4.30 2.2 4.45 3.2 4.70 4.1 5.03 4.7 5.42 5.0 5.87

8/10/2019 n We a 2011 Norms Report
http://slidepdf.com/reader/full/n-we-a-2011-norms-report 197/268
N W E A 2 0 1 1 R I T S c a l e N o r m s | 181
Table C.27. Means (M) and Standard Deviations (sd ) of Academic Growth by Starting RIT Score and Starting Instructi onal Week forVarious Ending Instructional Weeks - MATHEMATICS, GRADE 6
Ending Instruction al Weeks
Start Prior Grd Focal Grade
Inst. Start 36 4 8 12 16 20 24 28 32 36
Wk RIT M sd M sd M sd M sd M sd M sd M sd M sd M sd M sd
240 1.1 4.30 2.2 4.45 3.2 4.70 4.1 5.03 4.7 5.42 5.0 5.87
16 180 1.1 4.30 2.1 4.45 2.9 4.70 3.5 5.03 3.7 5.42
185 1.1 4.30 2.1 4.45 2.9 4.70 3.5 5.03 3.8 5.42
1901.1 4.30 2.1 4.45 3.0 4.70 3.5 5.03 3.8 5.42195 1.1 4.30 2.1 4.45 3.0 4.70 3.6 5.03 3.8 5.42
200 1.1 4.30 2.1 4.45 3.0 4.70 3.6 5.03 3.8 5.42
205 1.1 4.30 2.1 4.45 3.0 4.70 3.6 5.03 3.8 5.42
210 1.1 4.30 2.1 4.45 3.0 4.70 3.6 5.03 3.8 5.42
215 1.1 4.30 2.1 4.45 3.0 4.70 3.6 5.03 3.8 5.42
220 1.1 4.30 2.1 4.45 3.0 4.70 3.6 5.03 3.9 5.42
225 1.1 4.30 2.1 4.45 3.0 4.70 3.6 5.03 3.9 5.42
230 1.1 4.30 2.1 4.45 3.0 4.70 3.6 5.03 3.9 5.42
235 1.1 4.30 2.2 4.45 3.0 4.70 3.6 5.03 3.9 5.42
240 1.1 4.30 2.2 4.45 3.0 4.70 3.7 5.03 3.9 5.42
20 180 1.0 4.30 1.9 4.45 2.5 4.70 2.7 5.03
185 1.0 4.30 1.9 4.45 2.5 4.70 2.7 5.03
190 1.0 4.30 1.9 4.45 2.5 4.70 2.7 5.03
195 1.0 4.30 1.9 4.45 2.5 4.70 2.7 5.03
200 1.0 4.30 1.9 4.45 2.5 4.70 2.7 5.03
205 1.0 4.30 1.9 4.45 2.5 4.70 2.7 5.03
210 1.0 4.30 1.9 4.45 2.5 4.70 2.7 5.03
215 1.0 4.30 1.9 4.45 2.5 4.70 2.8 5.03220 1.0 4.30 1.9 4.45 2.5 4.70 2.8 5.03
225 1.0 4.30 1.9 4.45 2.5 4.70 2.8 5.03
230 1.0 4.30 1.9 4.45 2.5 4.70 2.8 5.03
235 1.0 4.30 1.9 4.45 2.5 4.70 2.8 5.03
240 1.1 4.30 1.9 4.45 2.6 4.70 2.8 5.03

8/10/2019 n We a 2011 Norms Report
http://slidepdf.com/reader/full/n-we-a-2011-norms-report 198/268
182 | N W E A 2 0 1 1 R I T S c a l e N o r m s
Table C.28. Means (M) and Standard Deviations (sd) o f Academic Growth by Starting RIT Score and Starting Instru ctional Week forVarious Ending Instructional Weeks - MATHEMATICS, GRADE 7
Table C.28. Means (M) and Standard Deviations (sd ) of Academic Growth by Starting RIT Score and Starting Instructi onal Week forVarious Endi ng Inst ruct ional Weeks - MATHEMATICS, GRADE 7
Ending Instruction al Weeks
Start Prior Grd Focal Grade
Inst. Start 36 4 8 12 16 20 24 28 32 36
Wk RIT M sd M sd M sd M sd M sd M sd M sd M sd M sd M sd
32(Gd 6)
180 0.2 4.29 0.5 4.45 1.1 4.69 1.8 5.01 2.5 5.39 3.2 5.82 4.0 6.29 4.6 6.80 5.0 7.33 5.3 7.88
1850.2 4.29 0.6 4.45 1.1 4.69 1.8 5.01 2.5 5.39 3.3 5.82 4.0 6.29 4.7 6.80 5.1 7.33 5.4 7.88190 0.2 4.29 0.6 4.45 1.1 4.69 1.8 5.01 2.6 5.39 3.4 5.82 4.1 6.29 4.7 6.80 5.2 7.33 5.5 7.88
195 0.2 4.29 0.6 4.45 1.2 4.69 1.9 5.01 2.6 5.39 3.4 5.82 4.2 6.29 4.8 6.80 5.3 7.33 5.6 7.88
200 0.2 4.29 0.6 4.45 1.2 4.69 1.9 5.01 2.7 5.39 3.5 5.82 4.2 6.29 4.9 6.80 5.4 7.33 5.7 7.88
205 0.2 4.29 0.6 4.45 1.2 4.69 2.0 5.01 2.7 5.39 3.5 5.82 4.3 6.29 5.0 6.80 5.5 7.33 5.8 7.88
210 0.2 4.29 0.7 4.45 1.3 4.69 2.0 5.01 2.8 5.39 3.6 5.82 4.4 6.29 5.0 6.80 5.6 7.33 5.9 7.88
215 0.2 4.29 0.7 4.45 1.3 4.69 2.0 5.01 2.8 5.39 3.6 5.82 4.4 6.29 5.1 6.80 5.7 7.33 6.0 7.88
220 0.2 4.29 0.7 4.45 1.3 4.69 2.1 5.01 2.9 5.39 3.7 5.82 4.5 6.29 5.2 6.80 5.7 7.33 6.1 7.88
225 0.2 4.29 0.7 4.45 1.3 4.69 2.1 5.01 2.9 5.39 3.8 5.82 4.6 6.29 5.3 6.80 5.8 7.33 6.2 7.88
230 0.3 4.29 0.7 4.45 1.4 4.69 2.1 5.01 3.0 5.39 3.8 5.82 4.6 6.29 5.3 6.80 5.9 7.33 6.3 7.88
235 0.3 4.29 0.8 4.45 1.4 4.69 2.2 5.01 3.0 5.39 3.9 5.82 4.7 6.29 5.4 6.80 6.0 7.33 6.4 7.88
240 0.3 4.29 0.8 4.45 1.4 4.69 2.2 5.01 3.1 5.39 3.9 5.82 4.8 6.29 5.5 6.80 6.1 7.33 6.5 7.88
245 0.3 4.29 0.8 4.45 1.5 4.69 2.3 5.01 3.1 5.39 4.0 5.82 4.8 6.29 5.6 6.80 6.2 7.33 6.6 7.88
36(Gd 6)
180 0.4 4.29 0.9 4.45 1.6 4.69 2.3 5.01 3.1 5.39 3.8 5.82 4.4 6.29 4.9 6.80 5.2 7.33
185 0.4 4.29 1.0 4.45 1.6 4.69 2.4 5.01 3.1 5.39 3.9 5.82 4.5 6.29 5.0 6.80 5.3 7.33
190 0.4 4.29 1.0 4.45 1.7 4.69 2.4 5.01 3.2 5.39 3.9 5.82 4.6 6.29 5.0 6.80 5.3 7.33
195 0.4 4.29 1.0 4.45 1.7 4.69 2.5 5.01 3.2 5.39 4.0 5.82 4.6 6.29 5.1 6.80 5.4 7.33
200 0.4 4.29 1.0 4.45 1.7 4.69 2.5 5.01 3.3 5.39 4.0 5.82 4.7 6.29 5.2 6.80 5.5 7.33
205 0.4 4.29 1.0 4.45 1.7 4.69 2.5 5.01 3.3 5.39 4.1 5.82 4.8 6.29 5.3 6.80 5.6 7.33210 0.4 4.29 1.0 4.45 1.8 4.69 2.6 5.01 3.4 5.39 4.1 5.82 4.8 6.29 5.4 6.80 5.7 7.33
215 0.5 4.29 1.1 4.45 1.8 4.69 2.6 5.01 3.4 5.39 4.2 5.82 4.9 6.29 5.4 6.80 5.8 7.33
220 0.5 4.29 1.1 4.45 1.8 4.69 2.6 5.01 3.5 5.39 4.3 5.82 5.0 6.29 5.5 6.80 5.9 7.33
225 0.5 4.29 1.1 4.45 1.9 4.69 2.7 5.01 3.5 5.39 4.3 5.82 5.0 6.29 5.6 6.80 5.9 7.33
230 0.5 4.29 1.1 4.45 1.9 4.69 2.7 5.01 3.6 5.39 4.4 5.82 5.1 6.29 5.7 6.80 6.0 7.33
235 0.5 4.29 1.1 4.45 1.9 4.69 2.8 5.01 3.6 5.39 4.4 5.82 5.2 6.29 5.7 6.80 6.1 7.33
240 0.5 4.29 1.2 4.45 1.9 4.69 2.8 5.01 3.7 5.39 4.5 5.82 5.2 6.29 5.8 6.80 6.2 7.33
245 0.5 4.29 1.2 4.45 2.0 4.69 2.8 5.01 3.7 5.39 4.5 5.82 5.3 6.29 5.9 6.80 6.3 7.33
4 180 0.6 4.29 1.2 4.45 2.0 4.69 2.7 5.01 3.4 5.39 4.0 5.82 4.5 6.29 4.8 6.80
185 0.6 4.29 1.2 4.45 2.0 4.69 2.7 5.01 3.5 5.39 4.1 5.82 4.6 6.29 4.9 6.80
190 0.6 4.29 1.3 4.45 2.0 4.69 2.8 5.01 3.5 5.39 4.2 5.82 4.6 6.29 4.9 6.80
195 0.6 4.29 1.3 4.45 2.0 4.69 2.8 5.01 3.6 5.39 4.2 5.82 4.7 6.29 5.0 6.80

8/10/2019 n We a 2011 Norms Report
http://slidepdf.com/reader/full/n-we-a-2011-norms-report 199/268
N W E A 2 0 1 1 R I T S c a l e N o r m s | 183
Table C.28. Means (M) and Standard Deviations (sd ) of Academic Growth by Starting RIT Score and Starting Instructi onal Week forVarious Endi ng Inst ruct ional Weeks - MATHEMATICS, GRADE 7
Ending Instruction al Weeks
Start Prior Grd Focal Grade
Inst. Start 36 4 8 12 16 20 24 28 32 36
Wk RIT M sd M sd M sd M sd M sd M sd M sd M sd M sd M sd
200 0.6 4.29 1.3 4.45 2.1 4.69 2.9 5.01 3.6 5.39 4.3 5.82 4.8 6.29 5.1 6.80
205 0.6 4.29 1.3 4.45 2.1 4.69 2.9 5.01 3.7 5.39 4.3 5.82 4.8 6.29 5.2 6.80
210 0.6 4.29 1.3 4.45 2.1 4.69 2.9 5.01 3.7 5.39 4.4 5.82 4.9 6.29 5.3 6.80
215 0.6 4.29 1.4 4.45 2.2 4.69 3.0 5.01 3.8 5.39 4.4 5.82 5.0 6.29 5.3 6.80
220 0.6 4.29 1.4 4.45 2.2 4.69 3.0 5.01 3.8 5.39 4.5 5.82 5.1 6.29 5.4 6.80
225 0.6 4.29 1.4 4.45 2.2 4.69 3.1 5.01 3.9 5.39 4.6 5.82 5.1 6.29 5.5 6.80
230 0.7 4.29 1.4 4.45 2.2 4.69 3.1 5.01 3.9 5.39 4.6 5.82 5.2 6.29 5.6 6.80
235 0.7 4.29 1.4 4.45 2.3 4.69 3.1 5.01 3.9 5.39 4.7 5.82 5.3 6.29 5.6 6.80
240 0.7 4.29 1.5 4.45 2.3 4.69 3.2 5.01 4.0 5.39 4.7 5.82 5.3 6.29 5.7 6.80
245 0.7 4.29 1.5 4.45 2.3 4.69 3.2 5.01 4.0 5.39 4.8 5.82 5.4 6.29 5.8 6.80
8 180 0.7 4.29 1.4 4.45 2.2 4.69 2.9 5.01 3.5 5.39 4.0 5.82 4.2 6.29
185 0.7 4.29 1.4 4.45 2.2 4.69 2.9 5.01 3.5 5.39 4.0 5.82 4.3 6.29
190 0.7 4.29 1.4 4.45 2.2 4.69 2.9 5.01 3.6 5.39 4.1 5.82 4.4 6.29
195 0.7 4.29 1.5 4.45 2.2 4.69 3.0 5.01 3.6 5.39 4.1 5.82 4.4 6.29
200 0.7 4.29 1.5 4.45 2.3 4.69 3.0 5.01 3.7 5.39 4.2 5.82 4.5 6.29
205 0.7 4.29 1.5 4.45 2.3 4.69 3.1 5.01 3.7 5.39 4.3 5.82 4.6 6.29
210 0.7 4.29 1.5 4.45 2.3 4.69 3.1 5.01 3.8 5.39 4.3 5.82 4.6 6.29
215 0.7 4.29 1.5 4.45 2.4 4.69 3.1 5.01 3.8 5.39 4.4 5.82 4.7 6.29
220 0.8 4.29 1.6 4.45 2.4 4.69 3.2 5.01 3.9 5.39 4.4 5.82 4.8 6.29
225 0.8 4.29 1.6 4.45 2.4 4.69 3.2 5.01 3.9 5.39 4.5 5.82 4.8 6.29
230 0.8 4.29 1.6 4.45 2.4 4.69 3.3 5.01 4.0 5.39 4.5 5.82 4.9 6.29
235 0.8 4.29 1.6 4.45 2.5 4.69 3.3 5.01 4.0 5.39 4.6 5.82 5.0 6.29240 0.8 4.29 1.6 4.45 2.5 4.69 3.3 5.01 4.1 5.39 4.7 5.82 5.0 6.29
245 0.8 4.29 1.7 4.45 2.5 4.69 3.4 5.01 4.1 5.39 4.7 5.82 5.1 6.29
12 180 0.7 4.29 1.5 4.45 2.2 4.69 2.8 5.01 3.3 5.39 3.6 5.82
185 0.7 4.29 1.5 4.45 2.2 4.69 2.9 5.01 3.3 5.39 3.6 5.82
190 0.8 4.29 1.5 4.45 2.3 4.69 2.9 5.01 3.4 5.39 3.7 5.82
195 0.8 4.29 1.5 4.45 2.3 4.69 2.9 5.01 3.4 5.39 3.7 5.82
200 0.8 4.29 1.6 4.45 2.3 4.69 3.0 5.01 3.5 5.39 3.8 5.82
205 0.8 4.29 1.6 4.45 2.3 4.69 3.0 5.01 3.5 5.39 3.9 5.82
210 0.8 4.29 1.6 4.45 2.4 4.69 3.0 5.01 3.6 5.39 3.9 5.82
215 0.8 4.29 1.6 4.45 2.4 4.69 3.1 5.01 3.6 5.39 4.0 5.82
220 0.8 4.29 1.6 4.45 2.4 4.69 3.1 5.01 3.7 5.39 4.0 5.82
225 0.8 4.29 1.7 4.45 2.5 4.69 3.2 5.01 3.7 5.39 4.1 5.82

8/10/2019 n We a 2011 Norms Report
http://slidepdf.com/reader/full/n-we-a-2011-norms-report 200/268
184 | N W E A 2 0 1 1 R I T S c a l e N o r m s
Table C.28. Means (M) and Standard Deviations (sd ) of Academic Growth by Starting RIT Score and Starting Instructi onal Week forVarious Endi ng Inst ruct ional Weeks - MATHEMATICS, GRADE 7
Ending Instruction al Weeks
Start Prior Grd Focal Grade
Inst. Start 36 4 8 12 16 20 24 28 32 36
Wk RIT M sd M sd M sd M sd M sd M sd M sd M sd M sd M sd
230 0.8 4.29 1.7 4.45 2.5 4.69 3.2 5.01 3.8 5.39 4.1 5.82
235 0.8 4.29 1.7 4.45 2.5 4.69 3.2 5.01 3.8 5.39 4.2 5.82
240 0.9 4.29 1.7 4.45 2.5 4.69 3.3 5.01 3.9 5.39 4.3 5.82
245 0.9 4.29 1.7 4.45 2.6 4.69 3.3 5.01 3.9 5.39 4.3 5.82
16 180 0.8 4.29 1.5 4.45 2.1 4.69 2.6 5.01 2.8 5.39
185 0.8 4.29 1.5 4.45 2.1 4.69 2.6 5.01 2.9 5.39
190 0.8 4.29 1.5 4.45 2.1 4.69 2.6 5.01 2.9 5.39
195 0.8 4.29 1.5 4.45 2.2 4.69 2.7 5.01 3.0 5.39
200 0.8 4.29 1.5 4.45 2.2 4.69 2.7 5.01 3.0 5.39
205 0.8 4.29 1.6 4.45 2.2 4.69 2.8 5.01 3.1 5.39
210 0.8 4.29 1.6 4.45 2.3 4.69 2.8 5.01 3.1 5.39
215 0.8 4.29 1.6 4.45 2.3 4.69 2.8 5.01 3.2 5.39
220 0.8 4.29 1.6 4.45 2.3 4.69 2.9 5.01 3.2 5.39
225 0.8 4.29 1.6 4.45 2.3 4.69 2.9 5.01 3.3 5.39
230 0.8 4.29 1.7 4.45 2.4 4.69 2.9 5.01 3.3 5.39
235 0.9 4.29 1.7 4.45 2.4 4.69 3.0 5.01 3.4 5.39
240 0.9 4.29 1.7 4.45 2.4 4.69 3.0 5.01 3.4 5.39
245 0.9 4.29 1.7 4.45 2.5 4.69 3.1 5.01 3.5 5.39
20 180 0.7 4.29 1.3 4.45 1.8 4.69 2.1 5.01
185 0.7 4.29 1.4 4.45 1.8 4.69 2.1 5.01
190 0.7 4.29 1.4 4.45 1.9 4.69 2.2 5.01
195 0.7 4.29 1.4 4.45 1.9 4.69 2.2 5.01200 0.8 4.29 1.4 4.45 1.9 4.69 2.2 5.01
205 0.8 4.29 1.4 4.45 2.0 4.69 2.3 5.01
210 0.8 4.29 1.4 4.45 2.0 4.69 2.3 5.01
215 0.8 4.29 1.5 4.45 2.0 4.69 2.4 5.01
220 0.8 4.29 1.5 4.45 2.0 4.69 2.4 5.01
225 0.8 4.29 1.5 4.45 2.1 4.69 2.4 5.01
230 0.8 4.29 1.5 4.45 2.1 4.69 2.5 5.01
235 0.8 4.29 1.5 4.45 2.1 4.69 2.5 5.01
240 0.8 4.29 1.6 4.45 2.2 4.69 2.5 5.01
245 0.8 4.29 1.6 4.45 2.2 4.69 2.6 5.01

8/10/2019 n We a 2011 Norms Report
http://slidepdf.com/reader/full/n-we-a-2011-norms-report 201/268
N W E A 2 0 1 1 R I T S c a l e N o r m s | 185
Table C.29. Means (M) and Standard Deviations (sd) o f Academic Growth by Starting RIT Score and Starting Instru ctional Week forVarious Ending Instructional Weeks - MATHEMATICS, GRADE 8
Table C.29. Means (M) and Standard Deviations (sd ) of Academic Growth by Starting RIT Score and Starting Instructi onal Week forVarious Endi ng Inst ruct ional Weeks - MATHEMATICS, GRADE 8
Ending Instruction al Weeks
Start Prior Grd Focal Grade
Inst. Start 36 4 8 12 16 20 24 28 32 36
Wk RIT M sd M sd M sd M sd M sd M sd M sd M sd M sd M sd
32(Gd 7)
185 0.3 4.31 0.9 4.49 1.5 4.79 2.3 5.18 3.1 5.63 3.8 6.15 4.5 6.70 5.1 7.29 5.4 7.90 5.6 8.54
1900.3 4.31 0.9 4.49 1.5 4.79 2.3 5.18 3.1 5.63 3.8 6.15 4.5 6.70 5.1 7.29 5.4 7.90 5.5 8.54195 0.3 4.31 0.8 4.49 1.5 4.79 2.3 5.18 3.1 5.63 3.8 6.15 4.5 6.70 5.0 7.29 5.4 7.90 5.5 8.54
200 0.3 4.31 0.8 4.49 1.5 4.79 2.3 5.18 3.0 5.63 3.8 6.15 4.5 6.70 5.0 7.29 5.4 7.90 5.5 8.54
205 0.3 4.31 0.8 4.49 1.5 4.79 2.3 5.18 3.0 5.63 3.8 6.15 4.5 6.70 5.0 7.29 5.4 7.90 5.5 8.54
210 0.3 4.31 0.8 4.49 1.5 4.79 2.2 5.18 3.0 5.63 3.8 6.15 4.5 6.70 5.0 7.29 5.3 7.90 5.4 8.54
215 0.3 4.31 0.8 4.49 1.5 4.79 2.2 5.18 3.0 5.63 3.8 6.15 4.4 6.70 5.0 7.29 5.3 7.90 5.4 8.54
220 0.3 4.31 0.8 4.49 1.5 4.79 2.2 5.18 3.0 5.63 3.7 6.15 4.4 6.70 5.0 7.29 5.3 7.90 5.4 8.54
225 0.3 4.31 0.8 4.49 1.5 4.79 2.2 5.18 3.0 5.63 3.7 6.15 4.4 6.70 4.9 7.29 5.3 7.90 5.4 8.54
230 0.3 4.31 0.8 4.49 1.5 4.79 2.2 5.18 3.0 5.63 3.7 6.15 4.4 6.70 4.9 7.29 5.3 7.90 5.3 8.54
235 0.3 4.31 0.8 4.49 1.5 4.79 2.2 5.18 3.0 5.63 3.7 6.15 4.4 6.70 4.9 7.29 5.2 7.90 5.3 8.54
240 0.3 4.31 0.8 4.49 1.5 4.79 2.2 5.18 3.0 5.63 3.7 6.15 4.4 6.70 4.9 7.29 5.2 7.90 5.3 8.54
245 0.3 4.31 0.8 4.49 1.4 4.79 2.2 5.18 2.9 5.63 3.7 6.15 4.3 6.70 4.9 7.29 5.2 7.90 5.3 8.54
250 0.3 4.31 0.8 4.49 1.4 4.79 2.2 5.18 2.9 5.63 3.7 6.15 4.3 6.70 4.8 7.29 5.2 7.90 5.2 8.54
36(Gd 7)
185 0.5 4.31 1.2 4.49 2.0 4.79 2.8 5.18 3.5 5.63 4.2 6.15 4.8 6.70 5.1 7.29 5.2 7.90
190 0.5 4.31 1.2 4.49 2.0 4.79 2.7 5.18 3.5 5.63 4.2 6.15 4.7 6.70 5.1 7.29 5.2 7.90
195 0.5 4.31 1.2 4.49 1.9 4.79 2.7 5.18 3.5 5.63 4.2 6.15 4.7 6.70 5.1 7.29 5.2 7.90
200 0.5 4.31 1.2 4.49 1.9 4.79 2.7 5.18 3.5 5.63 4.2 6.15 4.7 6.70 5.1 7.29 5.2 7.90
205 0.5 4.31 1.2 4.49 1.9 4.79 2.7 5.18 3.5 5.63 4.1 6.15 4.7 6.70 5.0 7.29 5.1 7.90
210 0.5 4.31 1.2 4.49 1.9 4.79 2.7 5.18 3.5 5.63 4.1 6.15 4.7 6.70 5.0 7.29 5.1 7.90215 0.5 4.31 1.2 4.49 1.9 4.79 2.7 5.18 3.4 5.63 4.1 6.15 4.7 6.70 5.0 7.29 5.1 7.90
220 0.5 4.31 1.2 4.49 1.9 4.79 2.7 5.18 3.4 5.63 4.1 6.15 4.6 6.70 5.0 7.29 5.1 7.90
225 0.5 4.31 1.2 4.49 1.9 4.79 2.7 5.18 3.4 5.63 4.1 6.15 4.6 6.70 5.0 7.29 5.1 7.90
230 0.5 4.31 1.2 4.49 1.9 4.79 2.7 5.18 3.4 5.63 4.1 6.15 4.6 6.70 4.9 7.29 5.0 7.90
235 0.5 4.31 1.2 4.49 1.9 4.79 2.7 5.18 3.4 5.63 4.1 6.15 4.6 6.70 4.9 7.29 5.0 7.90
240 0.5 4.31 1.2 4.49 1.9 4.79 2.6 5.18 3.4 5.63 4.1 6.15 4.6 6.70 4.9 7.29 5.0 7.90
245 0.5 4.31 1.1 4.49 1.9 4.79 2.6 5.18 3.4 5.63 4.0 6.15 4.6 6.70 4.9 7.29 5.0 7.90
250 0.5 4.31 1.1 4.49 1.9 4.79 2.6 5.18 3.4 5.63 4.0 6.15 4.5 6.70 4.9 7.29 5.0 7.90
4 185 0.7 4.31 1.4 4.49 2.2 4.79 3.0 5.18 3.7 5.63 4.2 6.15 4.6 6.70 4.7 7.29
190 0.7 4.31 1.4 4.49 2.2 4.79 3.0 5.18 3.7 5.63 4.2 6.15 4.6 6.70 4.7 7.29
195 0.7 4.31 1.4 4.49 2.2 4.79 3.0 5.18 3.7 5.63 4.2 6.15 4.6 6.70 4.7 7.29
200 0.7 4.31 1.4 4.49 2.2 4.79 3.0 5.18 3.6 5.63 4.2 6.15 4.5 6.70 4.6 7.29

8/10/2019 n We a 2011 Norms Report
http://slidepdf.com/reader/full/n-we-a-2011-norms-report 202/268
186 | N W E A 2 0 1 1 R I T S c a l e N o r m s
Table C.29. Means (M) and Standard Deviations (sd ) of Academic Growth by Starting RIT Score and Starting Instructi onal Week forVarious Endi ng Inst ruct ional Weeks - MATHEMATICS, GRADE 8
Ending Instruction al Weeks
Start Prior Grd Focal Grade
Inst. Start 36 4 8 12 16 20 24 28 32 36
Wk RIT M sd M sd M sd M sd M sd M sd M sd M sd M sd M sd
205 0.7 4.31 1.4 4.49 2.2 4.79 3.0 5.18 3.6 5.63 4.2 6.15 4.5 6.70 4.6 7.29
210 0.7 4.31 1.4 4.49 2.2 4.79 2.9 5.18 3.6 5.63 4.2 6.15 4.5 6.70 4.6 7.29
215 0.7 4.31 1.4 4.49 2.2 4.79 2.9 5.18 3.6 5.63 4.1 6.15 4.5 6.70 4.6 7.29
220 0.7 4.31 1.4 4.49 2.2 4.79 2.9 5.18 3.6 5.63 4.1 6.15 4.5 6.70 4.6 7.29
225 0.7 4.31 1.4 4.49 2.2 4.79 2.9 5.18 3.6 5.63 4.1 6.15 4.5 6.70 4.5 7.29
230 0.7 4.31 1.4 4.49 2.2 4.79 2.9 5.18 3.6 5.63 4.1 6.15 4.4 6.70 4.5 7.29
235 0.7 4.31 1.4 4.49 2.2 4.79 2.9 5.18 3.6 5.63 4.1 6.15 4.4 6.70 4.5 7.29
240 0.7 4.31 1.4 4.49 2.1 4.79 2.9 5.18 3.5 5.63 4.1 6.15 4.4 6.70 4.5 7.29
245 0.6 4.31 1.4 4.49 2.1 4.79 2.9 5.18 3.5 5.63 4.1 6.15 4.4 6.70 4.5 7.29
250 0.6 4.31 1.4 4.49 2.1 4.79 2.9 5.18 3.5 5.63 4.0 6.15 4.4 6.70 4.5 7.29
8 185 0.8 4.31 1.6 4.49 2.3 4.79 3.0 5.18 3.6 5.63 3.9 6.15 4.0 6.70
190 0.8 4.31 1.5 4.49 2.3 4.79 3.0 5.18 3.5 5.63 3.9 6.15 4.0 6.70
195 0.8 4.31 1.5 4.49 2.3 4.79 3.0 5.18 3.5 5.63 3.9 6.15 4.0 6.70
200 0.8 4.31 1.5 4.49 2.3 4.79 3.0 5.18 3.5 5.63 3.9 6.15 4.0 6.70
205 0.8 4.31 1.5 4.49 2.3 4.79 3.0 5.18 3.5 5.63 3.9 6.15 4.0 6.70
210 0.8 4.31 1.5 4.49 2.3 4.79 3.0 5.18 3.5 5.63 3.8 6.15 3.9 6.70
215 0.7 4.31 1.5 4.49 2.3 4.79 3.0 5.18 3.5 5.63 3.8 6.15 3.9 6.70
220 0.7 4.31 1.5 4.49 2.3 4.79 2.9 5.18 3.5 5.63 3.8 6.15 3.9 6.70
225 0.7 4.31 1.5 4.49 2.3 4.79 2.9 5.18 3.5 5.63 3.8 6.15 3.9 6.70
230 0.7 4.31 1.5 4.49 2.3 4.79 2.9 5.18 3.5 5.63 3.8 6.15 3.9 6.70
235 0.7 4.31 1.5 4.49 2.3 4.79 2.9 5.18 3.4 5.63 3.8 6.15 3.9 6.70
240 0.7 4.31 1.5 4.49 2.2 4.79 2.9 5.18 3.4 5.63 3.8 6.15 3.8 6.70245 0.7 4.31 1.5 4.49 2.2 4.79 2.9 5.18 3.4 5.63 3.7 6.15 3.8 6.70
250 0.7 4.31 1.5 4.49 2.2 4.79 2.9 5.18 3.4 5.63 3.7 6.15 3.8 6.70
12 185 0.8 4.31 1.6 4.49 2.2 4.79 2.8 5.18 3.2 5.63 3.3 6.15
190 0.8 4.31 1.6 4.49 2.2 4.79 2.8 5.18 3.1 5.63 3.3 6.15
195 0.8 4.31 1.6 4.49 2.2 4.79 2.8 5.18 3.1 5.63 3.2 6.15
200 0.8 4.31 1.5 4.49 2.2 4.79 2.8 5.18 3.1 5.63 3.2 6.15
205 0.8 4.31 1.5 4.49 2.2 4.79 2.8 5.18 3.1 5.63 3.2 6.15
210 0.8 4.31 1.5 4.49 2.2 4.79 2.8 5.18 3.1 5.63 3.2 6.15
215 0.8 4.31 1.5 4.49 2.2 4.79 2.7 5.18 3.1 5.63 3.2 6.15
220 0.8 4.31 1.5 4.49 2.2 4.79 2.7 5.18 3.1 5.63 3.2 6.15
225 0.8 4.31 1.5 4.49 2.2 4.79 2.7 5.18 3.1 5.63 3.2 6.15
230 0.8 4.31 1.5 4.49 2.2 4.79 2.7 5.18 3.1 5.63 3.1 6.15

8/10/2019 n We a 2011 Norms Report
http://slidepdf.com/reader/full/n-we-a-2011-norms-report 203/268
N W E A 2 0 1 1 R I T S c a l e N o r m s | 187
Table C.29. Means (M) and Standard Deviations (sd ) of Academic Growth by Starting RIT Score and Starting Instructi onal Week forVarious Endi ng Inst ruct ional Weeks - MATHEMATICS, GRADE 8
Ending Instruction al Weeks
Start Prior Grd Focal Grade
Inst. Start 36 4 8 12 16 20 24 28 32 36
Wk RIT M sd M sd M sd M sd M sd M sd M sd M sd M sd M sd
235 0.8 4.31 1.5 4.49 2.2 4.79 2.7 5.18 3.0 5.63 3.1 6.15
240 0.8 4.31 1.5 4.49 2.2 4.79 2.7 5.18 3.0 5.63 3.1 6.15
245 0.8 4.31 1.5 4.49 2.2 4.79 2.7 5.18 3.0 5.63 3.1 6.15
250 0.8 4.31 1.5 4.49 2.2 4.79 2.7 5.18 3.0 5.63 3.1 6.15
16 185 0.8 4.31 1.5 4.49 2.0 4.79 2.4 5.18 2.5 5.63
190 0.8 4.31 1.5 4.49 2.0 4.79 2.4 5.18 2.5 5.63
195 0.8 4.31 1.4 4.49 2.0 4.79 2.3 5.18 2.5 5.63
200 0.8 4.31 1.4 4.49 2.0 4.79 2.3 5.18 2.4 5.63
205 0.8 4.31 1.4 4.49 2.0 4.79 2.3 5.18 2.4 5.63
210 0.8 4.31 1.4 4.49 2.0 4.79 2.3 5.18 2.4 5.63
215 0.8 4.31 1.4 4.49 2.0 4.79 2.3 5.18 2.4 5.63
220 0.8 4.31 1.4 4.49 2.0 4.79 2.3 5.18 2.4 5.63
225 0.8 4.31 1.4 4.49 2.0 4.79 2.3 5.18 2.4 5.63
230 0.8 4.31 1.4 4.49 1.9 4.79 2.3 5.18 2.4 5.63
235 0.7 4.31 1.4 4.49 1.9 4.79 2.3 5.18 2.4 5.63
240 0.7 4.31 1.4 4.49 1.9 4.79 2.3 5.18 2.3 5.63
245 0.7 4.31 1.4 4.49 1.9 4.79 2.3 5.18 2.3 5.63
250 0.7 4.31 1.4 4.49 1.9 4.79 2.2 5.18 2.3 5.63
20 185 0.7 4.31 1.2 4.49 1.6 4.79 1.7 5.18
190 0.7 4.31 1.2 4.49 1.6 4.79 1.7 5.18
195 0.7 4.31 1.2 4.49 1.6 4.79 1.7 5.18
200 0.7 4.31 1.2 4.49 1.6 4.79 1.7 5.18205 0.7 4.31 1.2 4.49 1.6 4.79 1.7 5.18
210 0.7 4.31 1.2 4.49 1.6 4.79 1.7 5.18
215 0.7 4.31 1.2 4.49 1.6 4.79 1.7 5.18
220 0.7 4.31 1.2 4.49 1.6 4.79 1.6 5.18
225 0.7 4.31 1.2 4.49 1.5 4.79 1.6 5.18
230 0.7 4.31 1.2 4.49 1.5 4.79 1.6 5.18
235 0.7 4.31 1.2 4.49 1.5 4.79 1.6 5.18
240 0.7 4.31 1.2 4.49 1.5 4.79 1.6 5.18
245 0.7 4.31 1.2 4.49 1.5 4.79 1.6 5.18
250 0.7 4.31 1.2 4.49 1.5 4.79 1.6 5.18

8/10/2019 n We a 2011 Norms Report
http://slidepdf.com/reader/full/n-we-a-2011-norms-report 204/268
188 | N W E A 2 0 1 1 R I T S c a l e N o r m s
Table C.30. Means (M) and Standard Deviations (sd) o f Academic Growth by Starting RIT Score and Starting Instruc tional Week forVarious Ending Instructional Weeks - MATHEMATICS, GRADE 9
Table C.30. Means (M) and Standard Deviations (sd) of Academic Grow th by Starting RIT Score and Starting Inst ruct ional Week forVarious Endi ng Inst ruct ional Weeks - MATHEMATICS, GRADE 9
Ending Instruction al Weeks
Start Prior Grd Focal Grade
Inst. Start 36 4 8 12 16 20 24 28 32 36
Wk RIT M sd M sd M sd M sd M sd M sd M sd M sd M sd M sd
32(Gd 8)
185 -0.1 4.34 -0.1 4.62 0.1 5.04 0.3 5.59 0.6 6.22 0.9 6.91 1.3 7.65 1.5 8.42 1.7 9.21 1.9 10.03
190-0.1 4.34 -0.1 4.62 0.1 5.04 0.4 5.59 0.7 6.22 1.0 6.91 1.3 7.65 1.6 8.42 1.8 9.21 1.9 10.03195 -0.1 4.34 -0.1 4.62 0.1 5.04 0.4 5.59 0.7 6.22 1.0 6.91 1.4 7.65 1.7 8.42 1.9 9.21 2.0 10.03
200 -0.1 4.34 0.0 4.62 0.1 5.04 0.4 5.59 0.7 6.22 1.1 6.91 1.4 7.65 1.7 8.42 1.9 9.21 2.1 10.03
205 -0.1 4.34 0.0 4.62 0.2 5.04 0.4 5.59 0.8 6.22 1.1 6.91 1.5 7.65 1.8 8.42 2.0 9.21 2.1 10.03
210 -0.1 4.34 0.0 4.62 0.2 5.04 0.5 5.59 0.8 6.22 1.2 6.91 1.5 7.65 1.8 8.42 2.1 9.21 2.2 10.03
215 -0.1 4.34 0.0 4.62 0.2 5.04 0.5 5.59 0.8 6.22 1.2 6.91 1.5 7.65 1.9 8.42 2.1 9.21 2.3 10.03
220 -0.1 4.34 0.0 4.62 0.2 5.04 0.5 5.59 0.9 6.22 1.2 6.91 1.6 7.65 1.9 8.42 2.2 9.21 2.3 10.03
225 -0.1 4.34 0.0 4.62 0.2 5.04 0.5 5.59 0.9 6.22 1.3 6.91 1.6 7.65 2.0 8.42 2.2 9.21 2.4 10.03
230 -0.1 4.34 0.0 4.62 0.3 5.04 0.6 5.59 0.9 6.22 1.3 6.91 1.7 7.65 2.0 8.42 2.3 9.21 2.5 10.03
235 -0.1 4.34 0.1 4.62 0.3 5.04 0.6 5.59 1.0 6.22 1.4 6.91 1.7 7.65 2.1 8.42 2.4 9.21 2.5 10.03
240 0.0 4.34 0.1 4.62 0.3 5.04 0.6 5.59 1.0 6.22 1.4 6.91 1.8 7.65 2.1 8.42 2.4 9.21 2.6 10.03
245 0.0 4.34 0.1 4.62 0.3 5.04 0.7 5.59 1.0 6.22 1.4 6.91 1.8 7.65 2.2 8.42 2.5 9.21 2.7 10.03
250 0.0 4.34 0.1 4.62 0.3 5.04 0.7 5.59 1.1 6.22 1.5 6.91 1.9 7.65 2.3 8.42 2.5 9.21 2.7 10.03
255 0.0 4.34 0.1 4.62 0.4 5.04 0.7 5.59 1.1 6.22 1.5 6.91 1.9 7.65 2.3 8.42 2.6 9.21 2.8 10.03
36(Gd 8)
185 0.0 4.34 0.2 4.62 0.4 5.04 0.7 5.59 1.1 6.22 1.4 6.91 1.7 7.65 1.9 8.42 2.0 9.21
190 0.0 4.34 0.2 4.62 0.5 5.04 0.8 5.59 1.1 6.22 1.4 6.91 1.7 7.65 1.9 8.42 2.0 9.21
195 0.1 4.34 0.2 4.62 0.5 5.04 0.8 5.59 1.1 6.22 1.5 6.91 1.8 7.65 2.0 8.42 2.1 9.21
200 0.1 4.34 0.2 4.62 0.5 5.04 0.8 5.59 1.2 6.22 1.5 6.91 1.8 7.65 2.0 8.42 2.2 9.21
205 0.1 4.34 0.3 4.62 0.5 5.04 0.8 5.59 1.2 6.22 1.5 6.91 1.8 7.65 2.1 8.42 2.2 9.21210 0.1 4.34 0.3 4.62 0.5 5.04 0.9 5.59 1.2 6.22 1.6 6.91 1.9 7.65 2.1 8.42 2.3 9.21
215 0.1 4.34 0.3 4.62 0.6 5.04 0.9 5.59 1.3 6.22 1.6 6.91 1.9 7.65 2.2 8.42 2.3 9.21
220 0.1 4.34 0.3 4.62 0.6 5.04 0.9 5.59 1.3 6.22 1.7 6.91 2.0 7.65 2.2 8.42 2.4 9.21
225 0.1 4.34 0.3 4.62 0.6 5.04 1.0 5.59 1.3 6.22 1.7 6.91 2.0 7.65 2.3 8.42 2.5 9.21
230 0.1 4.34 0.3 4.62 0.6 5.04 1.0 5.59 1.4 6.22 1.7 6.91 2.1 7.65 2.4 8.42 2.5 9.21
235 0.1 4.34 0.3 4.62 0.6 5.04 1.0 5.59 1.4 6.22 1.8 6.91 2.1 7.65 2.4 8.42 2.6 9.21
240 0.1 4.34 0.3 4.62 0.7 5.04 1.0 5.59 1.4 6.22 1.8 6.91 2.2 7.65 2.5 8.42 2.6 9.21
245 0.1 4.34 0.4 4.62 0.7 5.04 1.1 5.59 1.5 6.22 1.9 6.91 2.2 7.65 2.5 8.42 2.7 9.21
250 0.1 4.34 0.4 4.62 0.7 5.04 1.1 5.59 1.5 6.22 1.9 6.91 2.3 7.65 2.6 8.42 2.8 9.21
255 0.1 4.34 0.4 4.62 0.7 5.04 1.1 5.59 1.5 6.22 2.0 6.91 2.3 7.65 2.6 8.42 2.8 9.21
4 185 0.2 4.34 0.4 4.62 0.7 5.04 1.0 5.59 1.3 6.22 1.6 6.91 1.8 7.65 1.9 8.42
190 0.2 4.34 0.4 4.62 0.7 5.04 1.1 5.59 1.4 6.22 1.7 6.91 1.9 7.65 2.0 8.42
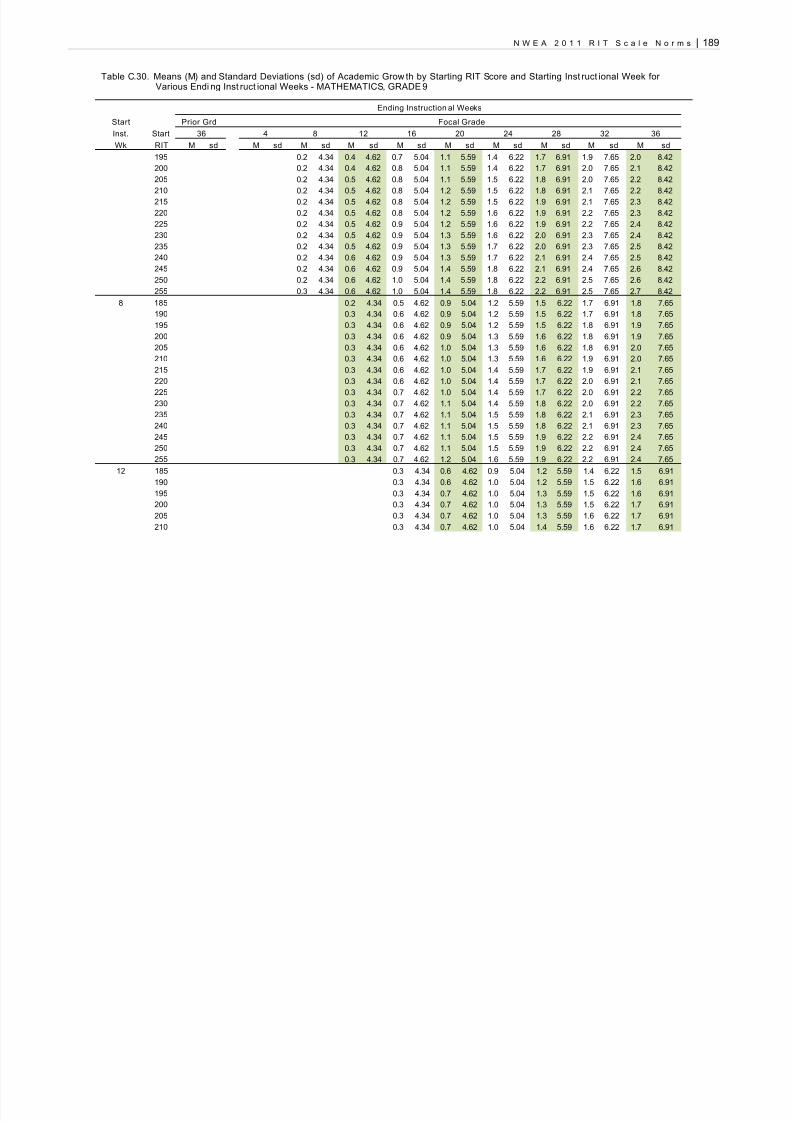
8/10/2019 n We a 2011 Norms Report
http://slidepdf.com/reader/full/n-we-a-2011-norms-report 205/268
N W E A 2 0 1 1 R I T S c a l e N o r m s | 189
Table C.30. Means (M) and Standard Deviations (sd) of Academic Grow th by Starting RIT Score and Starting Inst ruct ional Week forVarious Endi ng Inst ruct ional Weeks - MATHEMATICS, GRADE 9
Ending Instruction al Weeks
Start Prior Grd Focal Grade
Inst. Start 36 4 8 12 16 20 24 28 32 36
Wk RIT M sd M sd M sd M sd M sd M sd M sd M sd M sd M sd
195 0.2 4.34 0.4 4.62 0.7 5.04 1.1 5.59 1.4 6.22 1.7 6.91 1.9 7.65 2.0 8.42
200 0.2 4.34 0.4 4.62 0.8 5.04 1.1 5.59 1.4 6.22 1.7 6.91 2.0 7.65 2.1 8.42
205 0.2 4.34 0.5 4.62 0.8 5.04 1.1 5.59 1.5 6.22 1.8 6.91 2.0 7.65 2.2 8.42
210 0.2 4.34 0.5 4.62 0.8 5.04 1.2 5.59 1.5 6.22 1.8 6.91 2.1 7.65 2.2 8.42
215 0.2 4.34 0.5 4.62 0.8 5.04 1.2 5.59 1.5 6.22 1.9 6.91 2.1 7.65 2.3 8.42
220 0.2 4.34 0.5 4.62 0.8 5.04 1.2 5.59 1.6 6.22 1.9 6.91 2.2 7.65 2.3 8.42
225 0.2 4.34 0.5 4.62 0.9 5.04 1.2 5.59 1.6 6.22 1.9 6.91 2.2 7.65 2.4 8.42
230 0.2 4.34 0.5 4.62 0.9 5.04 1.3 5.59 1.6 6.22 2.0 6.91 2.3 7.65 2.4 8.42
235 0.2 4.34 0.5 4.62 0.9 5.04 1.3 5.59 1.7 6.22 2.0 6.91 2.3 7.65 2.5 8.42
240 0.2 4.34 0.6 4.62 0.9 5.04 1.3 5.59 1.7 6.22 2.1 6.91 2.4 7.65 2.5 8.42
245 0.2 4.34 0.6 4.62 0.9 5.04 1.4 5.59 1.8 6.22 2.1 6.91 2.4 7.65 2.6 8.42
250 0.2 4.34 0.6 4.62 1.0 5.04 1.4 5.59 1.8 6.22 2.2 6.91 2.5 7.65 2.6 8.42
255 0.3 4.34 0.6 4.62 1.0 5.04 1.4 5.59 1.8 6.22 2.2 6.91 2.5 7.65 2.7 8.42
8 185 0.2 4.34 0.5 4.62 0.9 5.04 1.2 5.59 1.5 6.22 1.7 6.91 1.8 7.65
190 0.3 4.34 0.6 4.62 0.9 5.04 1.2 5.59 1.5 6.22 1.7 6.91 1.8 7.65
195 0.3 4.34 0.6 4.62 0.9 5.04 1.2 5.59 1.5 6.22 1.8 6.91 1.9 7.65
200 0.3 4.34 0.6 4.62 0.9 5.04 1.3 5.59 1.6 6.22 1.8 6.91 1.9 7.65
205 0.3 4.34 0.6 4.62 1.0 5.04 1.3 5.59 1.6 6.22 1.8 6.91 2.0 7.65
210 0.3 4.34 0.6 4.62 1.0 5.04 1.3 5.59 1.6 6.22 1.9 6.91 2.0 7.65
215 0.3 4.34 0.6 4.62 1.0 5.04 1.4 5.59 1.7 6.22 1.9 6.91 2.1 7.65
220 0.3 4.34 0.6 4.62 1.0 5.04 1.4 5.59 1.7 6.22 2.0 6.91 2.1 7.65
225 0.3 4.34 0.7 4.62 1.0 5.04 1.4 5.59 1.7 6.22 2.0 6.91 2.2 7.65230 0.3 4.34 0.7 4.62 1.1 5.04 1.4 5.59 1.8 6.22 2.0 6.91 2.2 7.65
235 0.3 4.34 0.7 4.62 1.1 5.04 1.5 5.59 1.8 6.22 2.1 6.91 2.3 7.65
240 0.3 4.34 0.7 4.62 1.1 5.04 1.5 5.59 1.8 6.22 2.1 6.91 2.3 7.65
245 0.3 4.34 0.7 4.62 1.1 5.04 1.5 5.59 1.9 6.22 2.2 6.91 2.4 7.65
250 0.3 4.34 0.7 4.62 1.1 5.04 1.5 5.59 1.9 6.22 2.2 6.91 2.4 7.65
255 0.3 4.34 0.7 4.62 1.2 5.04 1.6 5.59 1.9 6.22 2.2 6.91 2.4 7.65
12 185 0.3 4.34 0.6 4.62 0.9 5.04 1.2 5.59 1.4 6.22 1.5 6.91
190 0.3 4.34 0.6 4.62 1.0 5.04 1.2 5.59 1.5 6.22 1.6 6.91
195 0.3 4.34 0.7 4.62 1.0 5.04 1.3 5.59 1.5 6.22 1.6 6.91
200 0.3 4.34 0.7 4.62 1.0 5.04 1.3 5.59 1.5 6.22 1.7 6.91
205 0.3 4.34 0.7 4.62 1.0 5.04 1.3 5.59 1.6 6.22 1.7 6.91
210 0.3 4.34 0.7 4.62 1.0 5.04 1.4 5.59 1.6 6.22 1.7 6.91

8/10/2019 n We a 2011 Norms Report
http://slidepdf.com/reader/full/n-we-a-2011-norms-report 206/268
190 | N W E A 2 0 1 1 R I T S c a l e N o r m s
Table C.30. Means (M) and Standard Deviations (sd) of Academic Grow th by Starting RIT Score and Starting Inst ruct ional Week forVarious Endi ng Inst ruct ional Weeks - MATHEMATICS, GRADE 9
Ending Instruction al Weeks
Start Prior Grd Focal Grade
Inst. Start 36 4 8 12 16 20 24 28 32 36
Wk RIT M sd M sd M sd M sd M sd M sd M sd M sd M sd M sd
215 0.3 4.34 0.7 4.62 1.1 5.04 1.4 5.59 1.6 6.22 1.8 6.91
220 0.4 4.34 0.7 4.62 1.1 5.04 1.4 5.59 1.7 6.22 1.8 6.91
225 0.4 4.34 0.7 4.62 1.1 5.04 1.4 5.59 1.7 6.22 1.9 6.91
230 0.4 4.34 0.8 4.62 1.1 5.04 1.5 5.59 1.7 6.22 1.9 6.91
235 0.4 4.34 0.8 4.62 1.1 5.04 1.5 5.59 1.8 6.22 1.9 6.91
240 0.4 4.34 0.8 4.62 1.2 5.04 1.5 5.59 1.8 6.22 2.0 6.91
245 0.4 4.34 0.8 4.62 1.2 5.04 1.6 5.59 1.8 6.22 2.0 6.91
250 0.4 4.34 0.8 4.62 1.2 5.04 1.6 5.59 1.9 6.22 2.1 6.91
255 0.4 4.34 0.8 4.62 1.2 5.04 1.6 5.59 1.9 6.22 2.1 6.91
16 185 0.3 4.34 0.6 4.62 0.9 5.04 1.1 5.59 1.2 6.22
190 0.3 4.34 0.7 4.62 0.9 5.04 1.2 5.59 1.3 6.22
195 0.3 4.34 0.7 4.62 1.0 5.04 1.2 5.59 1.3 6.22
200 0.3 4.34 0.7 4.62 1.0 5.04 1.2 5.59 1.3 6.22
205 0.4 4.34 0.7 4.62 1.0 5.04 1.2 5.59 1.4 6.22
210 0.4 4.34 0.7 4.62 1.0 5.04 1.3 5.59 1.4 6.22
215 0.4 4.34 0.7 4.62 1.0 5.04 1.3 5.59 1.4 6.22
220 0.4 4.34 0.7 4.62 1.1 5.04 1.3 5.59 1.5 6.22
225 0.4 4.34 0.8 4.62 1.1 5.04 1.4 5.59 1.5 6.22
230 0.4 4.34 0.8 4.62 1.1 5.04 1.4 5.59 1.5 6.22
235 0.4 4.34 0.8 4.62 1.1 5.04 1.4 5.59 1.6 6.22
240 0.4 4.34 0.8 4.62 1.1 5.04 1.4 5.59 1.6 6.22
245 0.4 4.34 0.8 4.62 1.2 5.04 1.5 5.59 1.6 6.22250 0.4 4.34 0.8 4.62 1.2 5.04 1.5 5.59 1.7 6.22
255 0.4 4.34 0.8 4.62 1.2 5.04 1.5 5.59 1.7 6.22
20 185 0.3 4.34 0.6 4.62 0.8 5.04 0.9 5.59
190 0.3 4.34 0.6 4.62 0.8 5.04 0.9 5.59
195 0.3 4.34 0.6 4.62 0.8 5.04 1.0 5.59
200 0.3 4.34 0.6 4.62 0.9 5.04 1.0 5.59
205 0.3 4.34 0.7 4.62 0.9 5.04 1.0 5.59
210 0.4 4.34 0.7 4.62 0.9 5.04 1.1 5.59
215 0.4 4.34 0.7 4.62 0.9 5.04 1.1 5.59
220 0.4 4.34 0.7 4.62 1.0 5.04 1.1 5.59
225 0.4 4.34 0.7 4.62 1.0 5.04 1.1 5.59
230 0.4 4.34 0.7 4.62 1.0 5.04 1.2 5.59
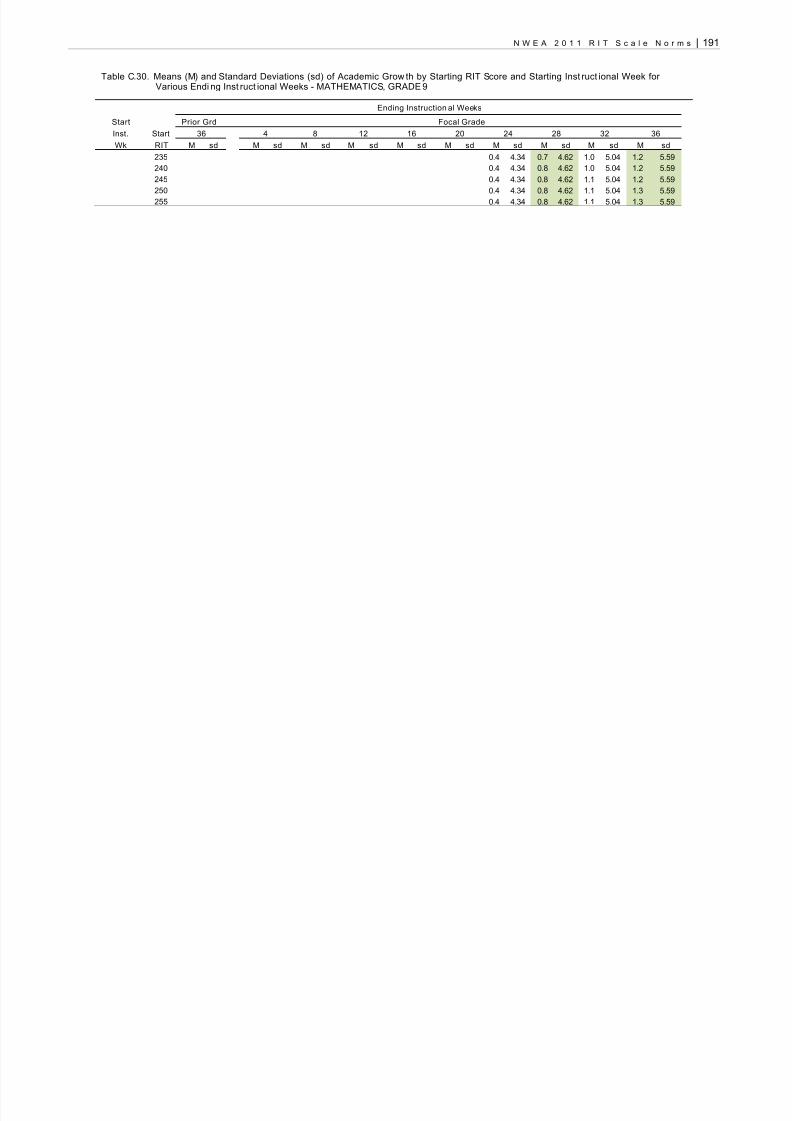
8/10/2019 n We a 2011 Norms Report
http://slidepdf.com/reader/full/n-we-a-2011-norms-report 207/268
N W E A 2 0 1 1 R I T S c a l e N o r m s | 191
Table C.30. Means (M) and Standard Deviations (sd) of Academic Grow th by Starting RIT Score and Starting Inst ruct ional Week forVarious Endi ng Inst ruct ional Weeks - MATHEMATICS, GRADE 9
Ending Instruction al Weeks
Start Prior Grd Focal Grade
Inst. Start 36 4 8 12 16 20 24 28 32 36
Wk RIT M sd M sd M sd M sd M sd M sd M sd M sd M sd M sd
235 0.4 4.34 0.7 4.62 1.0 5.04 1.2 5.59
240 0.4 4.34 0.8 4.62 1.0 5.04 1.2 5.59
245 0.4 4.34 0.8 4.62 1.1 5.04 1.2 5.59
250 0.4 4.34 0.8 4.62 1.1 5.04 1.3 5.59
255 0.4 4.34 0.8 4.62 1.1 5.04 1.3 5.59

8/10/2019 n We a 2011 Norms Report
http://slidepdf.com/reader/full/n-we-a-2011-norms-report 208/268
192 | N W E A 2 0 1 1 R I T S c a l e N o r m s
Table C.31. Means (M) and Standard Deviations (sd) o f Academic Growth by Starting RIT Score and Starting Instruc tional Week forVarious Ending Instructional Weeks - MATHEMATICS, GRADE 10
Table C.31. Means (M) and Standard Deviations (sd) of Academic Grow th by Starting RIT Score and Starting Inst ruct ional Week forVarious Ending Instructi onal Weeks - MATHEMATICS, GRADE 10
Ending Instructio nal Weeks
Start Prior Grd Focal Grade
Inst. Start 36 4 8 12 16 20 24 28 32 36
Wk RIT M sd M sd M sd M sd M sd M sd M sd M sd M sd M sd
32(Gd 9)
185 0.2 4.37 0.6 4.72 1.1 5.25 1.6 5.91 2.2 6.67 2.8 7.50 3.4 8.36 4.0 9.27 4.5 10.19 4.9 11.14
1900.2 4.37 0.6 4.72 1.0 5.25 1.6 5.91 2.1 6.67 2.7 7.50 3.3 8.36 3.8 9.27 4.3 10.19 4.7 11.14195 0.2 4.37 0.5 4.72 1.0 5.25 1.5 5.91 2.0 6.67 2.6 7.50 3.2 8.36 3.7 9.27 4.1 10.19 4.5 11.14
200 0.2 4.37 0.5 4.72 0.9 5.25 1.4 5.91 1.9 6.67 2.5 7.50 3.0 8.36 3.5 9.27 4.0 10.19 4.3 11.14
205 0.2 4.37 0.4 4.72 0.8 5.25 1.3 5.91 1.8 6.67 2.4 7.50 2.9 8.36 3.4 9.27 3.8 10.19 4.1 11.14
210 0.1 4.37 0.4 4.72 0.8 5.25 1.2 5.91 1.7 6.67 2.3 7.50 2.8 8.36 3.2 9.27 3.6 10.19 3.9 11.14
215 0.1 4.37 0.4 4.72 0.7 5.25 1.2 5.91 1.6 6.67 2.1 7.50 2.6 8.36 3.1 9.27 3.4 10.19 3.7 11.14
220 0.1 4.37 0.3 4.72 0.7 5.25 1.1 5.91 1.5 6.67 2.0 7.50 2.5 8.36 2.9 9.27 3.3 10.19 3.5 11.14
225 0.1 4.37 0.3 4.72 0.6 5.25 1.0 5.91 1.4 6.67 1.9 7.50 2.3 8.36 2.8 9.27 3.1 10.19 3.3 11.14
230 0.1 4.37 0.3 4.72 0.6 5.25 0.9 5.91 1.3 6.67 1.8 7.50 2.2 8.36 2.6 9.27 2.9 10.19 3.1 11.14
235 0.0 4.37 0.2 4.72 0.5 5.25 0.9 5.91 1.3 6.67 1.7 7.50 2.1 8.36 2.4 9.27 2.7 10.19 2.9 11.14
240 0.0 4.37 0.2 4.72 0.4 5.25 0.8 5.91 1.2 6.67 1.6 7.50 1.9 8.36 2.3 9.27 2.6 10.19 2.7 11.14
245 0.0 4.37 0.1 4.72 0.4 5.25 0.7 5.91 1.1 6.67 1.4 7.50 1.8 8.36 2.1 9.27 2.4 10.19 2.5 11.14
250 0.0 4.37 0.1 4.72 0.3 5.25 0.6 5.91 1.0 6.67 1.3 7.50 1.7 8.36 2.0 9.27 2.2 10.19 2.3 11.14
255 0.0 4.37 0.1 4.72 0.3 5.25 0.5 5.91 0.9 6.67 1.2 7.50 1.5 8.36 1.8 9.27 2.0 10.19 2.1 11.14
260 -0.1 4.37 0.0 4.72 0.2 5.25 0.5 5.91 0.8 6.67 1.1 7.50 1.4 8.36 1.7 9.27 1.9 10.19 2.0 11.14
36(Gd 9)
185 0.4 4.37 0.8 4.72 1.4 5.25 2.0 5.91 2.6 6.67 3.2 7.50 3.8 8.36 4.3 9.27 4.6 10.19
190 0.4 4.37 0.8 4.72 1.3 5.25 1.9 5.91 2.5 6.67 3.1 7.50 3.6 8.36 4.1 9.27 4.5 10.19
195 0.3 4.37 0.8 4.72 1.3 5.25 1.8 5.91 2.4 6.67 3.0 7.50 3.5 8.36 3.9 9.27 4.3 10.19
200 0.3 4.37 0.7 4.72 1.2 5.25 1.8 5.91 2.3 6.67 2.9 7.50 3.4 8.36 3.8 9.27 4.1 10.19205 0.3 4.37 0.7 4.72 1.2 5.25 1.7 5.91 2.2 6.67 2.7 7.50 3.2 8.36 3.6 9.27 3.9 10.19
210 0.3 4.37 0.7 4.72 1.1 5.25 1.6 5.91 2.1 6.67 2.6 7.50 3.1 8.36 3.5 9.27 3.8 10.19
215 0.3 4.37 0.6 4.72 1.0 5.25 1.5 5.91 2.0 6.67 2.5 7.50 2.9 8.36 3.3 9.27 3.6 10.19
220 0.2 4.37 0.6 4.72 1.0 5.25 1.4 5.91 1.9 6.67 2.4 7.50 2.8 8.36 3.2 9.27 3.4 10.19
225 0.2 4.37 0.5 4.72 0.9 5.25 1.4 5.91 1.8 6.67 2.3 7.50 2.7 8.36 3.0 9.27 3.2 10.19
230 0.2 4.37 0.5 4.72 0.9 5.25 1.3 5.91 1.7 6.67 2.2 7.50 2.5 8.36 2.9 9.27 3.1 10.19
235 0.2 4.37 0.5 4.72 0.8 5.25 1.2 5.91 1.6 6.67 2.0 7.50 2.4 8.36 2.7 9.27 2.9 10.19
240 0.2 4.37 0.4 4.72 0.8 5.25 1.1 5.91 1.5 6.67 1.9 7.50 2.3 8.36 2.5 9.27 2.7 10.19
245 0.1 4.37 0.4 4.72 0.7 5.25 1.1 5.91 1.4 6.67 1.8 7.50 2.1 8.36 2.4 9.27 2.5 10.19
250 0.1 4.37 0.3 4.72 0.6 5.25 1.0 5.91 1.3 6.67 1.7 7.50 2.0 8.36 2.2 9.27 2.4 10.19
255 0.1 4.37 0.3 4.72 0.6 5.25 0.9 5.91 1.2 6.67 1.6 7.50 1.9 8.36 2.1 9.27 2.2 10.19
260 0.1 4.37 0.3 4.72 0.5 5.25 0.8 5.91 1.1 6.67 1.5 7.50 1.7 8.36 1.9 9.27 2.0 10.19

8/10/2019 n We a 2011 Norms Report
http://slidepdf.com/reader/full/n-we-a-2011-norms-report 209/268
N W E A 2 0 1 1 R I T S c a l e N o r m s | 193
Table C.31. Means (M) and Standard Deviations (sd) of Academic Grow th by Starting RIT Score and Starting Inst ruct ional Week forVarious Ending Instructi onal Weeks - MATHEMATICS, GRADE 10
Ending Instructio nal Weeks
Start Prior Grd Focal Grade
Inst. Start 36 4 8 12 16 20 24 28 32 36
Wk RIT M sd M sd M sd M sd M sd M sd M sd M sd M sd M sd
4 185 0.5 4.37 1.0 4.72 1.6 5.25 2.2 5.91 2.8 6.67 3.4 7.50 3.9 8.36 4.3 9.27
190 0.5 4.37 1.0 4.72 1.6 5.25 2.2 5.91 2.7 6.67 3.3 7.50 3.7 8.36 4.1 9.27
195 0.4 4.37 1.0 4.72 1.5 5.25 2.1 5.91 2.6 6.67 3.2 7.50 3.6 8.36 4.0 9.27
200 0.4 4.37 0.9 4.72 1.4 5.25 2.0 5.91 2.5 6.67 3.0 7.50 3.5 8.36 3.8 9.27
205 0.4 4.37 0.9 4.72 1.4 5.25 1.9 5.91 2.4 6.67 2.9 7.50 3.3 8.36 3.6 9.27
210 0.4 4.37 0.8 4.72 1.3 5.25 1.8 5.91 2.4 6.67 2.8 7.50 3.2 8.36 3.5 9.27
215 0.4 4.37 0.8 4.72 1.3 5.25 1.8 5.91 2.3 6.67 2.7 7.50 3.1 8.36 3.3 9.27
220 0.3 4.37 0.8 4.72 1.2 5.25 1.7 5.91 2.2 6.67 2.6 7.50 2.9 8.36 3.2 9.27
225 0.3 4.37 0.7 4.72 1.2 5.25 1.6 5.91 2.1 6.67 2.5 7.50 2.8 8.36 3.0 9.27
230 0.3 4.37 0.7 4.72 1.1 5.25 1.5 5.91 2.0 6.67 2.3 7.50 2.7 8.36 2.9 9.27
235 0.3 4.37 0.6 4.72 1.0 5.25 1.5 5.91 1.9 6.67 2.2 7.50 2.5 8.36 2.7 9.27
240 0.3 4.37 0.6 4.72 1.0 5.25 1.4 5.91 1.8 6.67 2.1 7.50 2.4 8.36 2.6 9.27
245 0.2 4.37 0.6 4.72 0.9 5.25 1.3 5.91 1.7 6.67 2.0 7.50 2.3 8.36 2.4 9.27
250 0.2 4.37 0.5 4.72 0.9 5.25 1.2 5.91 1.6 6.67 1.9 7.50 2.1 8.36 2.2 9.27
255 0.2 4.37 0.5 4.72 0.8 5.25 1.1 5.91 1.5 6.67 1.8 7.50 2.0 8.36 2.1 9.27
260 0.2 4.37 0.4 4.72 0.7 5.25 1.1 5.91 1.4 6.67 1.6 7.50 1.8 8.36 1.9 9.27
8 185 0.6 4.37 1.2 4.72 1.8 5.25 2.4 5.91 2.9 6.67 3.4 7.50 3.8 8.36
190 0.5 4.37 1.1 4.72 1.7 5.25 2.3 5.91 2.8 6.67 3.3 7.50 3.7 8.36
195 0.5 4.37 1.1 4.72 1.6 5.25 2.2 5.91 2.7 6.67 3.2 7.50 3.5 8.36
200 0.5 4.37 1.0 4.72 1.6 5.25 2.1 5.91 2.6 6.67 3.1 7.50 3.4 8.36
205 0.5 4.37 1.0 4.72 1.5 5.25 2.1 5.91 2.5 6.67 2.9 7.50 3.3 8.36
210 0.5 4.37 1.0 4.72 1.5 5.25 2.0 5.91 2.4 6.67 2.8 7.50 3.1 8.36215 0.4 4.37 0.9 4.72 1.4 5.25 1.9 5.91 2.3 6.67 2.7 7.50 3.0 8.36
220 0.4 4.37 0.9 4.72 1.4 5.25 1.8 5.91 2.2 6.67 2.6 7.50 2.8 8.36
225 0.4 4.37 0.8 4.72 1.3 5.25 1.7 5.91 2.1 6.67 2.5 7.50 2.7 8.36
230 0.4 4.37 0.8 4.72 1.2 5.25 1.7 5.91 2.0 6.67 2.4 7.50 2.6 8.36
235 0.4 4.37 0.8 4.72 1.2 5.25 1.6 5.91 2.0 6.67 2.2 7.50 2.4 8.36
240 0.3 4.37 0.7 4.72 1.1 5.25 1.5 5.91 1.9 6.67 2.1 7.50 2.3 8.36
245 0.3 4.37 0.7 4.72 1.1 5.25 1.4 5.91 1.8 6.67 2.0 7.50 2.2 8.36
250 0.3 4.37 0.6 4.72 1.0 5.25 1.4 5.91 1.7 6.67 1.9 7.50 2.0 8.36
255 0.3 4.37 0.6 4.72 0.9 5.25 1.3 5.91 1.6 6.67 1.8 7.50 1.9 8.36
260 0.3 4.37 0.6 4.72 0.9 5.25 1.2 5.91 1.5 6.67 1.7 7.50 1.8 8.36
12 185 0.6 4.37 1.2 4.72 1.8 5.25 2.4 5.91 2.9 6.67 3.2 7.50
190 0.6 4.37 1.2 4.72 1.8 5.25 2.3 5.91 2.8 6.67 3.1 7.50

8/10/2019 n We a 2011 Norms Report
http://slidepdf.com/reader/full/n-we-a-2011-norms-report 210/268
194 | N W E A 2 0 1 1 R I T S c a l e N o r m s
Table C.31. Means (M) and Standard Deviations (sd) of Academic Grow th by Starting RIT Score and Starting Inst ruct ional Week forVarious Ending Instructi onal Weeks - MATHEMATICS, GRADE 10
Ending Instructio nal Weeks
Start Prior Grd Focal Grade
Inst. Start 36 4 8 12 16 20 24 28 32 36
Wk RIT M sd M sd M sd M sd M sd M sd M sd M sd M sd M sd
195 0.6 4.37 1.1 4.72 1.7 5.25 2.2 5.91 2.7 6.67 3.0 7.50
200 0.5 4.37 1.1 4.72 1.6 5.25 2.1 5.91 2.6 6.67 2.9 7.50
205 0.5 4.37 1.1 4.72 1.6 5.25 2.1 5.91 2.5 6.67 2.8 7.50
210 0.5 4.37 1.0 4.72 1.5 5.25 2.0 5.91 2.4 6.67 2.7 7.50
215 0.5 4.37 1.0 4.72 1.5 5.25 1.9 5.91 2.3 6.67 2.5 7.50
220 0.5 4.37 0.9 4.72 1.4 5.25 1.8 5.91 2.2 6.67 2.4 7.50
225 0.4 4.37 0.9 4.72 1.3 5.25 1.8 5.91 2.1 6.67 2.3 7.50
230 0.4 4.37 0.9 4.72 1.3 5.25 1.7 5.91 2.0 6.67 2.2 7.50
235 0.4 4.37 0.8 4.72 1.2 5.25 1.6 5.91 1.9 6.67 2.1 7.50
240 0.4 4.37 0.8 4.72 1.2 5.25 1.5 5.91 1.8 6.67 2.0 7.50
245 0.4 4.37 0.7 4.72 1.1 5.25 1.4 5.91 1.7 6.67 1.8 7.50
250 0.3 4.37 0.7 4.72 1.1 5.25 1.4 5.91 1.6 6.67 1.7 7.50
255 0.3 4.37 0.7 4.72 1.0 5.25 1.3 5.91 1.5 6.67 1.6 7.50
260 0.3 4.37 0.6 4.72 0.9 5.25 1.2 5.91 1.4 6.67 1.5 7.50
16 185 0.6 4.37 1.2 4.72 1.8 5.25 2.3 5.91 2.7 6.67
190 0.6 4.37 1.2 4.72 1.7 5.25 2.2 5.91 2.6 6.67
195 0.6 4.37 1.1 4.72 1.7 5.25 2.1 5.91 2.5 6.67
200 0.6 4.37 1.1 4.72 1.6 5.25 2.0 5.91 2.4 6.67
205 0.5 4.37 1.1 4.72 1.5 5.25 2.0 5.91 2.3 6.67
210 0.5 4.37 1.0 4.72 1.5 5.25 1.9 5.91 2.2 6.67
215 0.5 4.37 1.0 4.72 1.4 5.25 1.8 5.91 2.1 6.67
220 0.5 4.37 0.9 4.72 1.4 5.25 1.7 5.91 2.0 6.67225 0.5 4.37 0.9 4.72 1.3 5.25 1.6 5.91 1.9 6.67
230 0.4 4.37 0.9 4.72 1.3 5.25 1.6 5.91 1.8 6.67
235 0.4 4.37 0.8 4.72 1.2 5.25 1.5 5.91 1.7 6.67
240 0.4 4.37 0.8 4.72 1.1 5.25 1.4 5.91 1.6 6.67
245 0.4 4.37 0.8 4.72 1.1 5.25 1.3 5.91 1.5 6.67
250 0.4 4.37 0.7 4.72 1.0 5.25 1.3 5.91 1.4 6.67
255 0.3 4.37 0.7 4.72 1.0 5.25 1.2 5.91 1.3 6.67
260 0.3 4.37 0.6 4.72 0.9 5.25 1.1 5.91 1.2 6.67
20 185 0.6 4.37 1.2 4.72 1.7 5.25 2.0 5.91
190 0.6 4.37 1.1 4.72 1.6 5.25 2.0 5.91
195 0.6 4.37 1.1 4.72 1.5 5.25 1.9 5.91
200 0.5 4.37 1.0 4.72 1.5 5.25 1.8 5.91
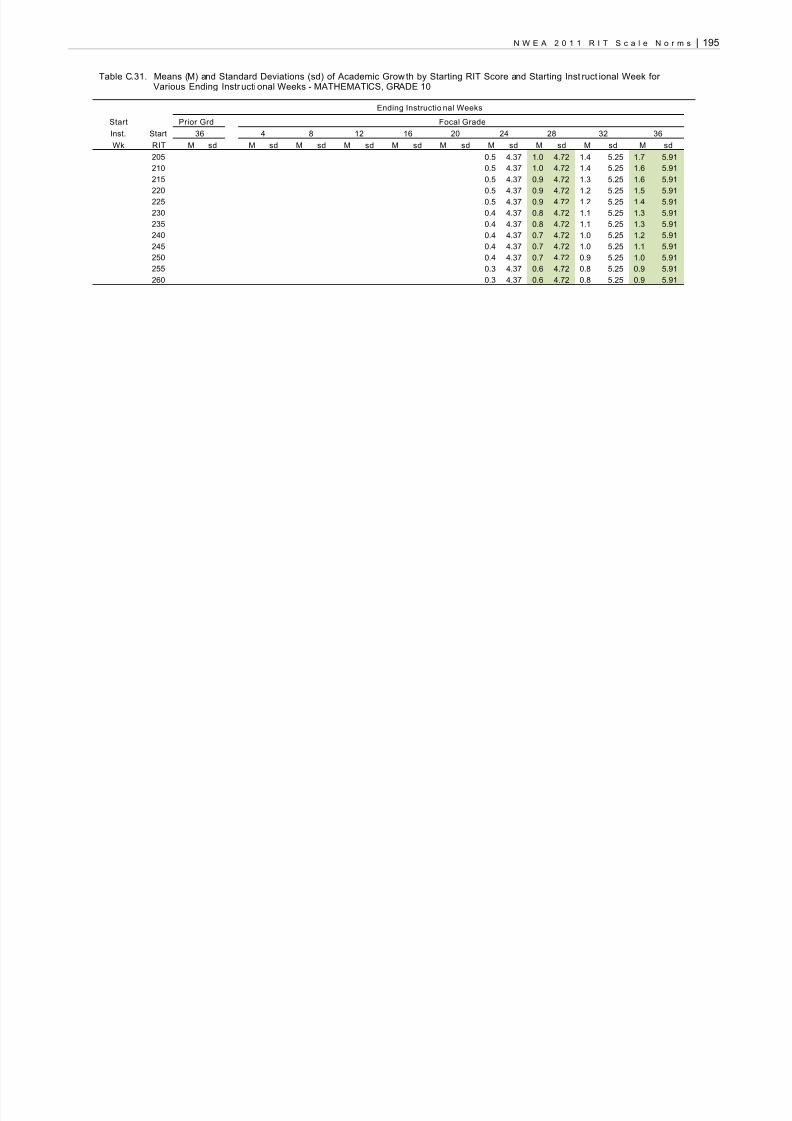
8/10/2019 n We a 2011 Norms Report
http://slidepdf.com/reader/full/n-we-a-2011-norms-report 211/268
N W E A 2 0 1 1 R I T S c a l e N o r m s | 195
Table C.31. Means (M) and Standard Deviations (sd) of Academic Grow th by Starting RIT Score and Starting Inst ruct ional Week forVarious Ending Instructi onal Weeks - MATHEMATICS, GRADE 10
Ending Instructio nal Weeks
Start Prior Grd Focal Grade
Inst. Start 36 4 8 12 16 20 24 28 32 36
Wk RIT M sd M sd M sd M sd M sd M sd M sd M sd M sd M sd
205 0.5 4.37 1.0 4.72 1.4 5.25 1.7 5.91
210 0.5 4.37 1.0 4.72 1.4 5.25 1.6 5.91
215 0.5 4.37 0.9 4.72 1.3 5.25 1.6 5.91
220 0.5 4.37 0.9 4.72 1.2 5.25 1.5 5.91
225 0.5 4.37 0.9 4.72 1.2 5.25 1.4 5.91
230 0.4 4.37 0.8 4.72 1.1 5.25 1.3 5.91
235 0.4 4.37 0.8 4.72 1.1 5.25 1.3 5.91
240 0.4 4.37 0.7 4.72 1.0 5.25 1.2 5.91
245 0.4 4.37 0.7 4.72 1.0 5.25 1.1 5.91
250 0.4 4.37 0.7 4.72 0.9 5.25 1.0 5.91
255 0.3 4.37 0.6 4.72 0.8 5.25 0.9 5.91
260 0.3 4.37 0.6 4.72 0.8 5.25 0.9 5.91

8/10/2019 n We a 2011 Norms Report
http://slidepdf.com/reader/full/n-we-a-2011-norms-report 212/268
196 | N W E A 2 0 1 1 R I T S c a l e N o r m s
Table C.32. Means (M) and Standard Deviations (sd) o f Academic Growth by Starting RIT Score and Starting Instru ctional Week forVarious Ending Instructional Weeks - GENERAL SCIENCE, GRADE 3
Table C.32. Means (M) and Standard Deviations (sd) of Academic Grow th by Starting RIT Score and Starting Inst ruct ional Week for VariousEnding Instructi onal Weeks - GENERAL SCIENCE, GRADE 3
Ending Instruction al Weeks
Start Prior Grd Focal Grade
Inst. Start 36 4 8 12 16 20 24 28 32 36
Wk RIT M sd M sd M sd M sd M sd M sd M sd M sd M sd M sd
32(Gd 2)
155 1.1 5.41 2.6 5.53 4.3 5.72 6.1 5.98 8.0 6.29 9.9 6.65 11.6 7.06 13.2 7.50 14.5 7.97 15.4 8.47
1601.0 5.41 2.4 5.53 4.0 5.72 5.7 5.98 7.5 6.29 9.3 6.65 10.9 7.06 12.4 7.50 13.6 7.97 14.4 8.47165 0.9 5.41 2.2 5.53 3.7 5.72 5.3 5.98 7.0 6.29 8.7 6.65 10.2 7.06 11.6 7.50 12.7 7.97 13.4 8.47
170 0.8 5.41 2.0 5.53 3.4 5.72 4.9 5.98 6.5 6.29 8.1 6.65 9.6 7.06 10.8 7.50 11.8 7.97 12.4 8.46
175 0.7 5.41 1.8 5.53 3.1 5.72 4.5 5.98 6.0 6.29 7.5 6.65 8.9 7.06 10.0 7.50 10.9 7.97 11.5 8.46
180 0.6 5.41 1.6 5.53 2.8 5.72 4.1 5.98 5.5 6.29 6.9 6.65 8.2 7.06 9.2 7.50 10.0 7.97 10.5 8.46
185 0.5 5.41 1.4 5.53 2.5 5.72 3.7 5.98 5.0 6.29 6.3 6.65 7.5 7.06 8.5 7.50 9.2 7.97 9.5 8.46
190 0.4 5.41 1.2 5.53 2.2 5.72 3.3 5.98 4.5 6.29 5.7 6.65 6.8 7.06 7.7 7.50 8.3 7.97 8.5 8.46
195 0.4 5.41 1.0 5.53 1.9 5.72 3.0 5.98 4.1 6.29 5.1 6.65 6.1 7.06 6.9 7.50 7.4 7.97 7.5 8.46
200 0.3 5.41 0.8 5.53 1.6 5.72 2.6 5.98 3.6 6.29 4.5 6.65 5.4 7.06 6.1 7.50 6.5 7.97 6.5 8.46
205 0.2 5.41 0.6 5.53 1.3 5.72 2.2 5.98 3.1 6.29 4.0 6.65 4.7 7.06 5.3 7.50 5.6 7.97 5.5 8.46
210 0.1 5.41 0.4 5.53 1.0 5.72 1.8 5.98 2.6 6.29 3.4 6.65 4.0 7.06 4.5 7.50 4.7 7.97 4.6 8.47
215 -0.1 5.41 0.2 5.53 0.7 5.72 1.4 5.98 2.1 6.29 2.8 6.65 3.3 7.06 3.7 7.50 3.8 7.97 3.6 8.47
220 -0.2 5.41 0.0 5.53 0.4 5.72 1.0 5.98 1.6 6.29 2.2 6.65 2.7 7.06 2.9 7.50 2.9 7.97 2.6 8.47
36(Gd 2)
155 1.5 5.41 3.1 5.53 5.0 5.72 6.9 5.98 8.7 6.29 10.5 6.65 12.1 7.06 13.3 7.50 14.3 7.97
160 1.4 5.41 2.9 5.53 4.7 5.72 6.5 5.98 8.2 6.29 9.9 6.65 11.4 7.06 12.5 7.50 13.4 7.97
165 1.3 5.41 2.7 5.53 4.4 5.72 6.1 5.98 7.7 6.29 9.3 6.65 10.7 7.06 11.8 7.50 12.5 7.97
170 1.2 5.41 2.5 5.53 4.1 5.72 5.7 5.98 7.3 6.29 8.7 6.65 10.0 7.06 11.0 7.50 11.6 7.97
175 1.1 5.41 2.4 5.53 3.8 5.72 5.3 5.98 6.8 6.29 8.1 6.65 9.3 7.06 10.2 7.50 10.7 7.97
180 1.0 5.41 2.2 5.53 3.5 5.72 4.9 5.98 6.3 6.29 7.5 6.65 8.6 7.06 9.4 7.50 9.8 7.97185 0.9 5.41 2.0 5.53 3.2 5.72 4.5 5.98 5.8 6.29 6.9 6.65 7.9 7.06 8.6 7.50 8.9 7.97
190 0.8 5.41 1.8 5.53 2.9 5.72 4.1 5.98 5.3 6.29 6.3 6.65 7.2 7.06 7.8 7.50 8.0 7.97
195 0.7 5.41 1.6 5.53 2.6 5.72 3.7 5.98 4.8 6.29 5.8 6.65 6.5 7.06 7.0 7.50 7.2 7.97
200 0.6 5.41 1.4 5.53 2.3 5.72 3.3 5.98 4.3 6.29 5.2 6.65 5.8 7.06 6.2 7.50 6.3 7.97
205 0.5 5.41 1.2 5.53 2.0 5.72 2.9 5.98 3.8 6.29 4.6 6.65 5.2 7.06 5.5 7.50 5.4 7.97
210 0.4 5.41 1.0 5.53 1.7 5.72 2.5 5.98 3.3 6.29 4.0 6.65 4.5 7.06 4.7 7.50 4.5 7.97
215 0.3 5.41 0.8 5.53 1.4 5.72 2.1 5.98 2.8 6.29 3.4 6.65 3.8 7.06 3.9 7.50 3.6 7.97
220 0.2 5.41 0.6 5.53 1.1 5.72 1.7 5.98 2.3 6.29 2.8 6.65 3.1 7.06 3.1 7.50 2.7 7.97
4 160 1.6 5.41 3.3 5.53 5.1 5.72 6.9 5.98 8.5 6.29 10.0 6.65 11.2 7.06 12.0 7.50
165 1.5 5.41 3.1 5.53 4.8 5.72 6.5 5.98 8.1 6.29 9.4 6.65 10.5 7.06 11.2 7.50
170 1.4 5.41 2.9 5.53 4.5 5.72 6.1 5.98 7.6 6.29 8.8 6.65 9.8 7.06 10.4 7.50
175 1.3 5.41 2.7 5.53 4.2 5.72 5.7 5.98 7.1 6.29 8.2 6.65 9.1 7.06 9.7 7.50

8/10/2019 n We a 2011 Norms Report
http://slidepdf.com/reader/full/n-we-a-2011-norms-report 213/268
N W E A 2 0 1 1 R I T S c a l e N o r m s | 197
Table C.32. Means (M) and Standard Deviations (sd) of Academic Grow th by Starting RIT Score and Starting Inst ruct ional Week for VariousEnding Instructi onal Weeks - GENERAL SCIENCE, GRADE 3
Ending Instruction al Weeks
Start Prior Grd Focal Grade
Inst. Start 36 4 8 12 16 20 24 28 32 36
Wk RIT M sd M sd M sd M sd M sd M sd M sd M sd M sd M sd
180 1.2 5.41 2.5 5.53 3.9 5.72 5.3 5.98 6.6 6.29 7.6 6.65 8.4 7.06 8.9 7.50
185 1.1 5.41 2.3 5.53 3.6 5.72 4.9 5.98 6.1 6.29 7.1 6.65 7.7 7.06 8.1 7.50
190 1.0 5.41 2.1 5.53 3.3 5.72 4.5 5.98 5.6 6.29 6.5 6.65 7.1 7.06 7.3 7.50
195 0.9 5.41 1.9 5.53 3.0 5.72 4.1 5.98 5.1 6.29 5.9 6.65 6.4 7.06 6.5 7.50
200 0.8 5.41 1.7 5.53 2.7 5.72 3.7 5.98 4.6 6.29 5.3 6.65 5.7 7.06 5.7 7.50
205 0.7 5.41 1.5 5.53 2.5 5.72 3.3 5.98 4.1 6.29 4.7 6.65 5.0 7.06 4.9 7.50
210 0.6 5.41 1.4 5.53 2.2 5.72 2.9 5.98 3.6 6.29 4.1 6.65 4.3 7.06 4.1 7.50
215 0.5 5.41 1.2 5.53 1.9 5.72 2.5 5.98 3.1 6.29 3.5 6.65 3.6 7.06 3.3 7.50
220 0.4 5.41 1.0 5.53 1.6 5.72 2.2 5.98 2.6 6.29 2.9 6.65 2.9 7.06 2.6 7.50
8 160 1.7 5.41 3.5 5.53 5.3 5.72 7.0 5.98 8.4 6.29 9.6 6.65 10.4 7.06
165 1.6 5.41 3.3 5.53 5.0 5.72 6.6 5.98 7.9 6.29 9.0 6.65 9.7 7.06
170 1.5 5.41 3.1 5.53 4.7 5.72 6.2 5.98 7.4 6.29 8.4 6.65 9.1 7.06
175 1.4 5.41 2.9 5.53 4.4 5.72 5.8 5.98 6.9 6.29 7.8 6.65 8.4 7.06
180 1.3 5.41 2.7 5.53 4.1 5.72 5.4 5.98 6.5 6.29 7.2 6.65 7.7 7.06
185 1.2 5.41 2.5 5.53 3.8 5.72 5.0 5.98 6.0 6.29 6.7 6.65 7.0 7.06
190 1.1 5.41 2.3 5.53 3.5 5.72 4.6 5.98 5.5 6.29 6.1 6.65 6.3 7.06
195 1.0 5.41 2.2 5.53 3.2 5.72 4.2 5.98 5.0 6.29 5.5 6.65 5.6 7.06
200 0.9 5.41 2.0 5.53 2.9 5.72 3.8 5.98 4.5 6.29 4.9 6.65 4.9 7.06
205 0.8 5.41 1.8 5.53 2.6 5.72 3.4 5.98 4.0 6.29 4.3 6.65 4.2 7.06
210 0.8 5.41 1.6 5.53 2.3 5.72 3.0 5.98 3.5 6.29 3.7 6.65 3.5 7.06
215 0.7 5.41 1.4 5.53 2.0 5.72 2.6 5.98 3.0 6.29 3.1 6.65 2.8 7.06
220 0.6 5.41 1.2 5.53 1.8 5.72 2.2 5.98 2.5 6.29 2.5 6.65 2.2 7.0612 160 1.8 5.41 3.6 5.53 5.2 5.72 6.7 5.98 7.9 6.29 8.7 6.65
165 1.7 5.41 3.4 5.53 4.9 5.72 6.3 5.98 7.4 6.29 8.1 6.65
170 1.6 5.41 3.2 5.53 4.6 5.72 5.9 5.98 6.9 6.29 7.5 6.65
175 1.5 5.41 3.0 5.53 4.3 5.72 5.5 5.98 6.4 6.29 6.9 6.65
180 1.4 5.41 2.8 5.53 4.0 5.72 5.1 5.98 5.9 6.29 6.3 6.65
185 1.3 5.41 2.6 5.53 3.7 5.72 4.7 5.98 5.4 6.29 5.7 6.65
190 1.2 5.41 2.4 5.53 3.5 5.72 4.3 5.98 4.9 6.29 5.2 6.65
195 1.1 5.41 2.2 5.53 3.2 5.72 3.9 5.98 4.4 6.29 4.6 6.65
200 1.0 5.41 2.0 5.53 2.9 5.72 3.5 5.98 3.9 6.29 4.0 6.65
205 0.9 5.41 1.8 5.53 2.6 5.72 3.1 5.98 3.4 6.29 3.4 6.65
210 0.8 5.41 1.6 5.53 2.3 5.72 2.8 5.98 3.0 6.29 2.8 6.65
215 0.7 5.41 1.4 5.53 2.0 5.72 2.4 5.98 2.5 6.29 2.2 6.65
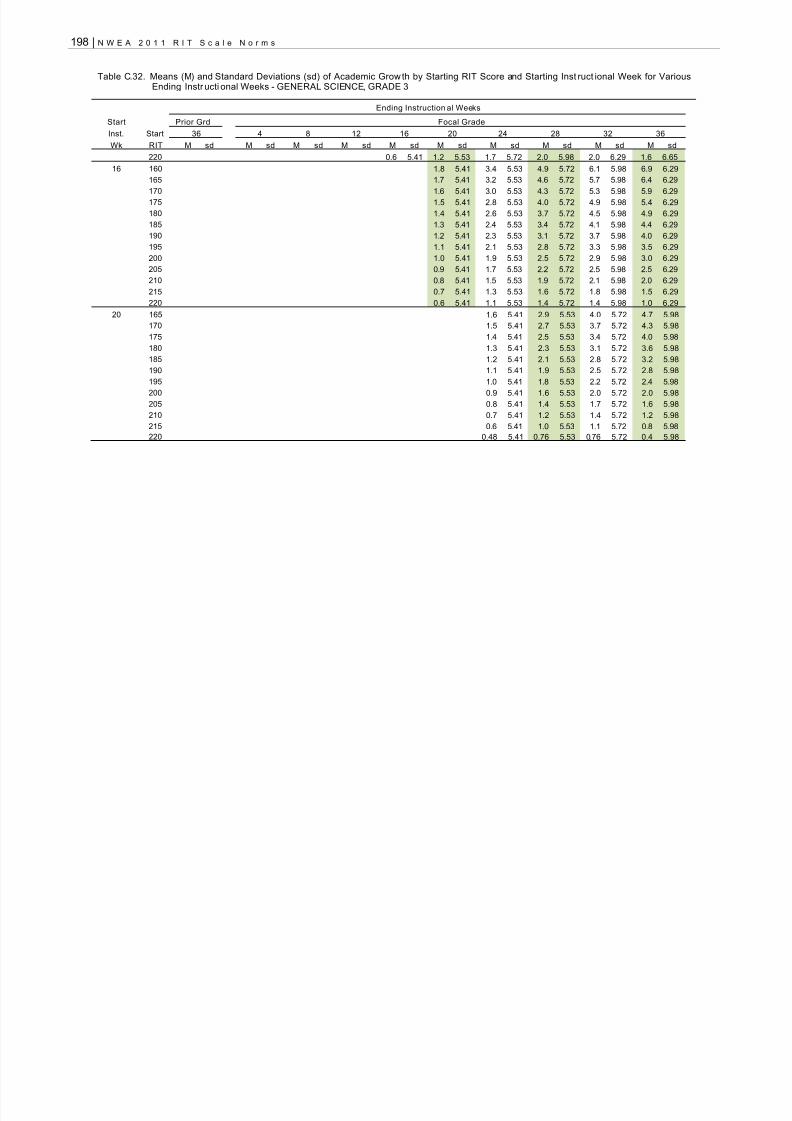
8/10/2019 n We a 2011 Norms Report
http://slidepdf.com/reader/full/n-we-a-2011-norms-report 214/268
198 | N W E A 2 0 1 1 R I T S c a l e N o r m s
Table C.32. Means (M) and Standard Deviations (sd) of Academic Grow th by Starting RIT Score and Starting Inst ruct ional Week for VariousEnding Instructi onal Weeks - GENERAL SCIENCE, GRADE 3
Ending Instruction al Weeks
Start Prior Grd Focal Grade
Inst. Start 36 4 8 12 16 20 24 28 32 36
Wk RIT M sd M sd M sd M sd M sd M sd M sd M sd M sd M sd
220 0.6 5.41 1.2 5.53 1.7 5.72 2.0 5.98 2.0 6.29 1.6 6.65
16 160 1.8 5.41 3.4 5.53 4.9 5.72 6.1 5.98 6.9 6.29
165 1.7 5.41 3.2 5.53 4.6 5.72 5.7 5.98 6.4 6.29
1701.6 5.41 3.0 5.53 4.3 5.72 5.3 5.98 5.9 6.29175 1.5 5.41 2.8 5.53 4.0 5.72 4.9 5.98 5.4 6.29
180 1.4 5.41 2.6 5.53 3.7 5.72 4.5 5.98 4.9 6.29
185 1.3 5.41 2.4 5.53 3.4 5.72 4.1 5.98 4.4 6.29
190 1.2 5.41 2.3 5.53 3.1 5.72 3.7 5.98 4.0 6.29
195 1.1 5.41 2.1 5.53 2.8 5.72 3.3 5.98 3.5 6.29
200 1.0 5.41 1.9 5.53 2.5 5.72 2.9 5.98 3.0 6.29
205 0.9 5.41 1.7 5.53 2.2 5.72 2.5 5.98 2.5 6.29
210 0.8 5.41 1.5 5.53 1.9 5.72 2.1 5.98 2.0 6.29
215 0.7 5.41 1.3 5.53 1.6 5.72 1.8 5.98 1.5 6.29
220 0.6 5.41 1.1 5.53 1.4 5.72 1.4 5.98 1.0 6.29
20 165 1.6 5.41 2.9 5.53 4.0 5.72 4.7 5.98
170 1.5 5.41 2.7 5.53 3.7 5.72 4.3 5.98
175 1.4 5.41 2.5 5.53 3.4 5.72 4.0 5.98
180 1.3 5.41 2.3 5.53 3.1 5.72 3.6 5.98
185 1.2 5.41 2.1 5.53 2.8 5.72 3.2 5.98
190 1.1 5.41 1.9 5.53 2.5 5.72 2.8 5.98
195 1.0 5.41 1.8 5.53 2.2 5.72 2.4 5.98
200 0.9 5.41 1.6 5.53 2.0 5.72 2.0 5.98205 0.8 5.41 1.4 5.53 1.7 5.72 1.6 5.98
210 0.7 5.41 1.2 5.53 1.4 5.72 1.2 5.98
215 0.6 5.41 1.0 5.53 1.1 5.72 0.8 5.98
220 0.48 5.41 0.76 5.53 0.76 5.72 0.4 5.98

8/10/2019 n We a 2011 Norms Report
http://slidepdf.com/reader/full/n-we-a-2011-norms-report 215/268
N W E A 2 0 1 1 R I T S c a l e N o r m s | 199
Table C.33. Means (M) and Standard Deviations (sd) o f Academic Growth by Starting RIT Score and Starting Instru ctional Week forVarious Ending Instructional Weeks - GENERAL SCIENCE, GRADE 4
Table C.33. Means (M) and Standard Deviations (sd ) of Academic Growth by Starting RIT Score and Starting Instr ucti onal Week forVarious Ending Instructi onal Weeks - GENERAL SCIENCE, GRADE 4
Ending Instructio nal Weeks
Start Prior Grd Focal Grade
Inst. Start 36 4 8 12 16 20 24 28 32 36
Wk RIT M sd M sd M sd M sd M sd M sd M sd M sd M sd M sd
32(Gd 3)
165 1.0 5.41 2.1 5.52 3.3 5.69 4.5 5.92 5.7 6.21 6.9 6.54 8.1 6.92 9.2 7.32 10.2 7.76 11.1 8.22
1700.9 5.41 1.9 5.52 3.0 5.69 4.2 5.92 5.3 6.21 6.5 6.54 7.6 6.92 8.6 7.32 9.6 7.76 10.4 8.22175 0.8 5.41 1.8 5.52 2.8 5.69 3.9 5.92 5.0 6.21 6.1 6.54 7.1 6.92 8.1 7.32 8.9 7.76 9.7 8.22
180 0.8 5.41 1.7 5.52 2.6 5.69 3.6 5.92 4.6 6.21 5.6 6.54 6.6 6.91 7.5 7.32 8.3 7.76 8.9 8.22
185 0.7 5.41 1.5 5.52 2.4 5.69 3.3 5.92 4.3 6.21 5.2 6.54 6.1 6.91 6.9 7.32 7.6 7.76 8.2 8.22
190 0.6 5.41 1.4 5.52 2.2 5.69 3.0 5.92 3.9 6.21 4.8 6.54 5.6 6.91 6.4 7.32 7.0 7.76 7.5 8.22
195 0.6 5.41 1.2 5.52 2.0 5.69 2.8 5.92 3.6 6.21 4.4 6.54 5.1 6.91 5.8 7.32 6.4 7.76 6.8 8.22
200 0.5 5.41 1.1 5.52 1.7 5.69 2.5 5.92 3.2 6.21 3.9 6.54 4.6 6.91 5.2 7.32 5.7 7.76 6.1 8.22
205 0.4 5.41 0.9 5.52 1.5 5.69 2.2 5.92 2.8 6.21 3.5 6.54 4.1 6.91 4.6 7.32 5.1 7.76 5.4 8.22
210 0.3 5.41 0.8 5.52 1.3 5.69 1.9 5.92 2.5 6.21 3.1 6.54 3.6 6.91 4.1 7.32 4.4 7.76 4.6 8.22
215 0.3 5.41 0.6 5.52 1.1 5.69 1.6 5.92 2.1 6.21 2.6 6.54 3.1 6.91 3.5 7.32 3.8 7.76 3.9 8.22
220 0.2 5.41 0.5 5.52 0.9 5.69 1.3 5.92 1.8 6.21 2.2 6.54 2.6 6.92 2.9 7.32 3.1 7.76 3.2 8.22
225 0.1 5.41 0.4 5.52 0.7 5.69 1.0 5.92 1.4 6.21 1.8 6.54 2.1 6.92 2.3 7.32 2.5 7.76 2.5 8.22
36(Gd 3)
165 1.1 5.41 2.3 5.52 3.5 5.69 4.7 5.92 5.9 6.21 7.1 6.54 8.2 6.92 9.2 7.32 10.1 7.76
170 1.0 5.41 2.1 5.52 3.3 5.69 4.4 5.92 5.6 6.21 6.7 6.54 7.7 6.92 8.7 7.32 9.5 7.76
175 1.0 5.41 2.0 5.52 3.1 5.69 4.1 5.92 5.2 6.21 6.3 6.54 7.2 6.91 8.1 7.32 8.8 7.76
180 0.9 5.41 1.8 5.52 2.8 5.69 3.9 5.92 4.9 6.21 5.8 6.54 6.7 6.91 7.5 7.32 8.2 7.76
185 0.8 5.41 1.7 5.52 2.6 5.69 3.6 5.92 4.5 6.21 5.4 6.54 6.2 6.91 6.9 7.32 7.5 7.76
190 0.7 5.41 1.6 5.52 2.4 5.69 3.3 5.92 4.2 6.21 5.0 6.54 5.7 6.91 6.4 7.32 6.9 7.76
195 0.7 5.41 1.4 5.52 2.2 5.69 3.0 5.92 3.8 6.21 4.5 6.54 5.2 6.91 5.8 7.32 6.2 7.76200 0.6 5.41 1.3 5.52 2.0 5.69 2.7 5.92 3.4 6.21 4.1 6.54 4.7 6.91 5.2 7.32 5.6 7.76
205 0.5 5.41 1.1 5.52 1.8 5.69 2.4 5.92 3.1 6.21 3.7 6.54 4.2 6.91 4.7 7.32 5.0 7.76
210 0.5 5.41 1.0 5.52 1.6 5.69 2.1 5.92 2.7 6.21 3.3 6.54 3.7 6.91 4.1 7.32 4.3 7.76
215 0.4 5.41 0.8 5.52 1.3 5.69 1.9 5.92 2.4 6.21 2.8 6.54 3.2 6.91 3.5 7.32 3.7 7.76
220 0.3 5.41 0.7 5.52 1.1 5.69 1.6 5.92 2.0 6.21 2.4 6.54 2.7 6.92 2.9 7.32 3.0 7.76
225 0.2 5.41 0.5 5.52 0.9 5.69 1.3 5.92 1.7 6.21 2.0 6.54 2.2 6.92 2.4 7.32 2.4 7.76
4 165 1.2 5.41 2.4 5.52 3.6 5.69 4.9 5.92 6.0 6.21 7.1 6.54 8.1 6.92 9.0 7.32
170 1.1 5.41 2.3 5.52 3.4 5.69 4.6 5.92 5.7 6.21 6.7 6.54 7.6 6.92 8.4 7.32
175 1.0 5.41 2.1 5.52 3.2 5.69 4.3 5.92 5.3 6.21 6.3 6.54 7.1 6.91 7.9 7.32
180 1.0 5.41 2.0 5.52 3.0 5.69 4.0 5.92 5.0 6.21 5.9 6.54 6.6 6.91 7.3 7.32
185 0.9 5.41 1.8 5.52 2.8 5.69 3.7 5.92 4.6 6.21 5.4 6.54 6.1 6.91 6.7 7.32
190 0.8 5.41 1.7 5.52 2.6 5.69 3.4 5.92 4.2 6.21 5.0 6.54 5.6 6.91 6.2 7.32
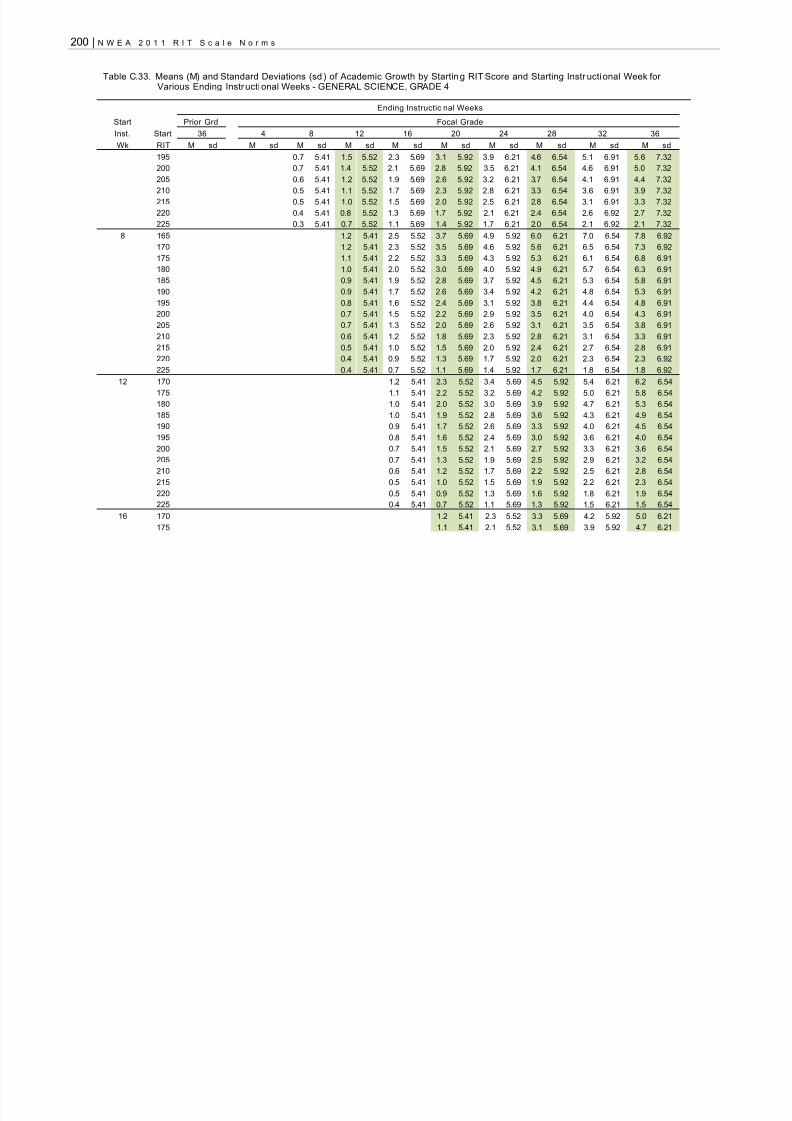
8/10/2019 n We a 2011 Norms Report
http://slidepdf.com/reader/full/n-we-a-2011-norms-report 216/268
200 | N W E A 2 0 1 1 R I T S c a l e N o r m s
Table C.33. Means (M) and Standard Deviations (sd ) of Academic Growth by Starting RIT Score and Starting Instr ucti onal Week forVarious Ending Instructi onal Weeks - GENERAL SCIENCE, GRADE 4
Ending Instructio nal Weeks
Start Prior Grd Focal Grade
Inst. Start 36 4 8 12 16 20 24 28 32 36
Wk RIT M sd M sd M sd M sd M sd M sd M sd M sd M sd M sd
195 0.7 5.41 1.5 5.52 2.3 5.69 3.1 5.92 3.9 6.21 4.6 6.54 5.1 6.91 5.6 7.32
200 0.7 5.41 1.4 5.52 2.1 5.69 2.8 5.92 3.5 6.21 4.1 6.54 4.6 6.91 5.0 7.32
205 0.6 5.41 1.2 5.52 1.9 5.69 2.6 5.92 3.2 6.21 3.7 6.54 4.1 6.91 4.4 7.32
210 0.5 5.41 1.1 5.52 1.7 5.69 2.3 5.92 2.8 6.21 3.3 6.54 3.6 6.91 3.9 7.32
215 0.5 5.41 1.0 5.52 1.5 5.69 2.0 5.92 2.5 6.21 2.8 6.54 3.1 6.91 3.3 7.32
220 0.4 5.41 0.8 5.52 1.3 5.69 1.7 5.92 2.1 6.21 2.4 6.54 2.6 6.92 2.7 7.32
225 0.3 5.41 0.7 5.52 1.1 5.69 1.4 5.92 1.7 6.21 2.0 6.54 2.1 6.92 2.1 7.32
8 165 1.2 5.41 2.5 5.52 3.7 5.69 4.9 5.92 6.0 6.21 7.0 6.54 7.8 6.92
170 1.2 5.41 2.3 5.52 3.5 5.69 4.6 5.92 5.6 6.21 6.5 6.54 7.3 6.92
175 1.1 5.41 2.2 5.52 3.3 5.69 4.3 5.92 5.3 6.21 6.1 6.54 6.8 6.91
180 1.0 5.41 2.0 5.52 3.0 5.69 4.0 5.92 4.9 6.21 5.7 6.54 6.3 6.91
185 0.9 5.41 1.9 5.52 2.8 5.69 3.7 5.92 4.5 6.21 5.3 6.54 5.8 6.91
190 0.9 5.41 1.7 5.52 2.6 5.69 3.4 5.92 4.2 6.21 4.8 6.54 5.3 6.91
195 0.8 5.41 1.6 5.52 2.4 5.69 3.1 5.92 3.8 6.21 4.4 6.54 4.8 6.91
200 0.7 5.41 1.5 5.52 2.2 5.69 2.9 5.92 3.5 6.21 4.0 6.54 4.3 6.91
205 0.7 5.41 1.3 5.52 2.0 5.69 2.6 5.92 3.1 6.21 3.5 6.54 3.8 6.91
210 0.6 5.41 1.2 5.52 1.8 5.69 2.3 5.92 2.8 6.21 3.1 6.54 3.3 6.91
215 0.5 5.41 1.0 5.52 1.5 5.69 2.0 5.92 2.4 6.21 2.7 6.54 2.8 6.91
220 0.4 5.41 0.9 5.52 1.3 5.69 1.7 5.92 2.0 6.21 2.3 6.54 2.3 6.92
225 0.4 5.41 0.7 5.52 1.1 5.69 1.4 5.92 1.7 6.21 1.8 6.54 1.8 6.92
12 170 1.2 5.41 2.3 5.52 3.4 5.69 4.5 5.92 5.4 6.21 6.2 6.54
175 1.1 5.41 2.2 5.52 3.2 5.69 4.2 5.92 5.0 6.21 5.8 6.54180 1.0 5.41 2.0 5.52 3.0 5.69 3.9 5.92 4.7 6.21 5.3 6.54
185 1.0 5.41 1.9 5.52 2.8 5.69 3.6 5.92 4.3 6.21 4.9 6.54
190 0.9 5.41 1.7 5.52 2.6 5.69 3.3 5.92 4.0 6.21 4.5 6.54
195 0.8 5.41 1.6 5.52 2.4 5.69 3.0 5.92 3.6 6.21 4.0 6.54
200 0.7 5.41 1.5 5.52 2.1 5.69 2.7 5.92 3.3 6.21 3.6 6.54
205 0.7 5.41 1.3 5.52 1.9 5.69 2.5 5.92 2.9 6.21 3.2 6.54
210 0.6 5.41 1.2 5.52 1.7 5.69 2.2 5.92 2.5 6.21 2.8 6.54
215 0.5 5.41 1.0 5.52 1.5 5.69 1.9 5.92 2.2 6.21 2.3 6.54
220 0.5 5.41 0.9 5.52 1.3 5.69 1.6 5.92 1.8 6.21 1.9 6.54
225 0.4 5.41 0.7 5.52 1.1 5.69 1.3 5.92 1.5 6.21 1.5 6.54
16 170 1.2 5.41 2.3 5.52 3.3 5.69 4.2 5.92 5.0 6.21
175 1.1 5.41 2.1 5.52 3.1 5.69 3.9 5.92 4.7 6.21

8/10/2019 n We a 2011 Norms Report
http://slidepdf.com/reader/full/n-we-a-2011-norms-report 217/268
N W E A 2 0 1 1 R I T S c a l e N o r m s | 201
Table C.33. Means (M) and Standard Deviations (sd ) of Academic Growth by Starting RIT Score and Starting Instr ucti onal Week forVarious Ending Instructi onal Weeks - GENERAL SCIENCE, GRADE 4
Ending Instructio nal Weeks
Start Prior Grd Focal Grade
Inst. Start 36 4 8 12 16 20 24 28 32 36
Wk RIT M sd M sd M sd M sd M sd M sd M sd M sd M sd M sd
180 1.0 5.41 2.0 5.52 2.9 5.69 3.7 5.92 4.3 6.21
185 0.9 5.41 1.8 5.52 2.7 5.69 3.4 5.92 4.0 6.21
190 0.9 5.41 1.7 5.52 2.4 5.69 3.1 5.92 3.6 6.21
195 0.8 5.41 1.6 5.52 2.2 5.69 2.8 5.92 3.2 6.21
200 0.7 5.41 1.4 5.52 2.0 5.69 2.5 5.92 2.9 6.21
205 0.7 5.41 1.3 5.52 1.8 5.69 2.2 5.92 2.5 6.21
210 0.6 5.41 1.1 5.52 1.6 5.69 1.9 5.92 2.2 6.21
215 0.5 5.41 1.0 5.52 1.4 5.69 1.7 5.92 1.8 6.21
220 0.4 5.41 0.8 5.52 1.2 5.69 1.4 5.92 1.5 6.21
225 0.4 5.41 0.7 5.52 0.9 5.69 1.1 5.92 1.1 6.21
230 0.3 5.41 0.5 5.52 0.7 5.69 0.8 5.92 0.7 6.21
20 170 1.1 5.41 2.1 5.52 3.1 5.69 3.9 5.92
175 1.0 5.41 2.0 5.52 2.9 5.69 3.6 5.92
180 1.0 5.41 1.9 5.52 2.7 5.69 3.3 5.92
185 0.9 5.41 1.7 5.52 2.4 5.69 3.0 5.92
190 0.8 5.41 1.6 5.52 2.2 5.69 2.7 5.92
195 0.8 5.41 1.4 5.52 2.0 5.69 2.4 5.92
200 0.7 5.41 1.3 5.52 1.8 5.69 2.2 5.92
205 0.6 5.41 1.1 5.52 1.6 5.69 1.9 5.92
210 0.5 5.41 1.0 5.52 1.4 5.69 1.6 5.92
215 0.5 5.41 0.9 5.52 1.1 5.69 1.3 5.92
220 0.4 5.41 0.7 5.52 0.9 5.69 1.0 5.92225 0.3 5.41 0.6 5.52 0.7 5.69 0.7 5.92
230 0.3 5.41 0.4 5.52 0.5 5.69 0.4 5.92

8/10/2019 n We a 2011 Norms Report
http://slidepdf.com/reader/full/n-we-a-2011-norms-report 218/268
202 | N W E A 2 0 1 1 R I T S c a l e N o r m s
Table C.34. Means (M) and Standard Deviations (sd) o f Academic Growth by Starting RIT Score and Starting Instru ctional Week forVarious Ending Instructional Weeks - GENERAL SCIENCE, GRADE 5
Table C.34. Means (M) and Standard Deviations (sd) of Academic Grow th by Starting RIT Score and Starting Inst ruct ional Week forVarious Ending Instru ctional Weeks - GENERAL SCIENCE, GRADE 5
Ending Instruction al Weeks
Start Prior Grd Focal Grade
Inst. Start 36 4 8 12 16 20 24 28 32 36
Wk RIT M sd M sd M sd M sd M sd M sd M sd M sd M sd M sd
32(Gd 4)
170 0.8 5.42 1.7 5.54 2.7 5.74 3.7 6.01 4.6 6.34 5.6 6.72 6.4 7.15 7.2 7.61 7.7 8.10 8.1 8.62
1750.8 5.42 1.6 5.54 2.5 5.74 3.5 6.01 4.4 6.34 5.3 6.72 6.1 7.15 6.8 7.61 7.4 8.10 7.7 8.62180 0.7 5.42 1.5 5.54 2.4 5.74 3.3 6.01 4.2 6.34 5.1 6.72 5.8 7.15 6.5 7.61 7.0 8.10 7.2 8.62
185 0.7 5.42 1.4 5.54 2.3 5.74 3.1 6.01 4.0 6.34 4.8 6.72 5.5 7.15 6.1 7.61 6.6 8.10 6.8 8.62
190 0.6 5.42 1.3 5.54 2.1 5.74 3.0 6.01 3.8 6.34 4.5 6.72 5.2 7.15 5.8 7.61 6.2 8.10 6.4 8.62
195 0.6 5.42 1.3 5.54 2.0 5.74 2.8 6.01 3.6 6.34 4.3 6.72 4.9 7.15 5.4 7.61 5.8 8.10 5.9 8.62
200 0.5 5.42 1.2 5.54 1.9 5.74 2.6 6.01 3.3 6.34 4.0 6.72 4.6 7.15 5.1 7.61 5.4 8.10 5.5 8.62
205 0.5 5.42 1.1 5.54 1.7 5.74 2.4 6.01 3.1 6.34 3.8 6.72 4.3 7.15 4.7 7.61 5.0 8.10 5.1 8.62
210 0.4 5.42 1.0 5.54 1.6 5.74 2.3 6.01 2.9 6.34 3.5 6.72 4.0 7.15 4.4 7.61 4.6 8.10 4.6 8.62
215 0.4 5.42 0.9 5.54 1.5 5.74 2.1 6.01 2.7 6.34 3.2 6.72 3.7 7.15 4.0 7.61 4.2 8.10 4.2 8.62
220 0.4 5.42 0.8 5.54 1.4 5.74 1.9 6.01 2.5 6.34 3.0 6.72 3.4 7.15 3.7 7.61 3.8 8.10 3.7 8.62
225 0.3 5.42 0.7 5.54 1.2 5.74 1.7 6.01 2.2 6.34 2.7 6.72 3.1 7.15 3.3 7.61 3.4 8.10 3.3 8.62
230 0.3 5.42 0.6 5.54 1.1 5.74 1.6 6.01 2.0 6.34 2.4 6.72 2.8 7.15 3.0 7.61 3.0 8.10 2.9 8.62
36(Gd 4)
170 0.9 5.42 1.9 5.54 2.9 5.74 3.9 6.01 4.8 6.34 5.7 6.72 6.4 7.15 7.0 7.61 7.3 8.10
175 0.9 5.42 1.8 5.54 2.7 5.74 3.7 6.01 4.6 6.34 5.4 6.72 6.1 7.15 6.6 7.61 6.9 8.10
180 0.8 5.42 1.7 5.54 2.6 5.74 3.5 6.01 4.4 6.34 5.1 6.72 5.8 7.15 6.3 7.61 6.5 8.10
185 0.8 5.42 1.6 5.54 2.5 5.74 3.3 6.01 4.1 6.34 4.9 6.72 5.5 7.15 5.9 7.61 6.1 8.10
190 0.7 5.42 1.5 5.54 2.3 5.74 3.2 6.01 3.9 6.34 4.6 6.72 5.2 7.15 5.6 7.61 5.8 8.10
195 0.7 5.42 1.4 5.54 2.2 5.74 3.0 6.01 3.7 6.34 4.3 6.72 4.9 7.15 5.2 7.61 5.4 8.10
200 0.6 5.42 1.3 5.54 2.1 5.74 2.8 6.01 3.5 6.34 4.1 6.72 4.5 7.15 4.9 7.61 5.0 8.10205 0.6 5.42 1.3 5.54 1.9 5.74 2.6 6.01 3.3 6.34 3.8 6.72 4.2 7.15 4.5 7.61 4.6 8.10
210 0.6 5.42 1.2 5.54 1.8 5.74 2.5 6.01 3.0 6.34 3.6 6.72 3.9 7.15 4.2 7.61 4.2 8.10
215 0.5 5.42 1.1 5.54 1.7 5.74 2.3 6.01 2.8 6.34 3.3 6.72 3.6 7.15 3.8 7.61 3.8 8.10
220 0.5 5.42 1.0 5.54 1.6 5.74 2.1 6.01 2.6 6.34 3.0 6.72 3.3 7.15 3.5 7.61 3.4 8.10
225 0.4 5.42 0.9 5.54 1.4 5.74 1.9 6.01 2.4 6.34 2.8 6.72 3.0 7.15 3.1 7.61 3.0 8.10
230 0.4 5.42 0.8 5.54 1.3 5.74 1.8 6.01 2.2 6.34 2.5 6.72 2.7 7.15 2.8 7.61 2.6 8.10
4 170 1.0 5.42 2.0 5.54 3.0 5.74 3.9 6.01 4.8 6.34 5.5 6.72 6.1 7.15 6.4 7.61
175 0.9 5.42 1.9 5.54 2.8 5.74 3.7 6.01 4.5 6.34 5.2 6.72 5.8 7.15 6.1 7.61
180 0.9 5.42 1.8 5.54 2.7 5.74 3.5 6.01 4.3 6.34 5.0 6.72 5.4 7.15 5.7 7.61
185 0.8 5.42 1.7 5.54 2.6 5.74 3.4 6.01 4.1 6.34 4.7 6.72 5.1 7.15 5.4 7.61
190 0.8 5.42 1.6 5.54 2.4 5.74 3.2 6.01 3.9 6.34 4.4 6.72 4.8 7.15 5.0 7.61
195 0.8 5.42 1.5 5.54 2.3 5.74 3.0 6.01 3.7 6.34 4.2 6.72 4.5 7.15 4.7 7.61
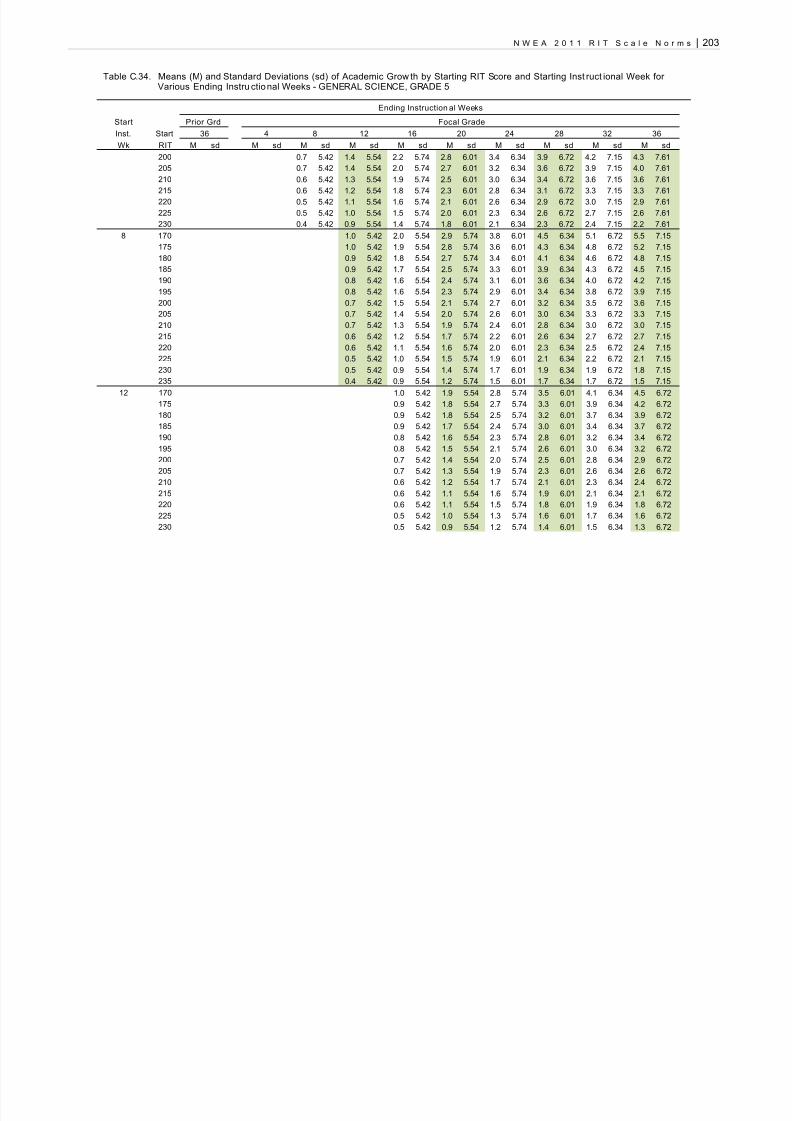
8/10/2019 n We a 2011 Norms Report
http://slidepdf.com/reader/full/n-we-a-2011-norms-report 219/268
N W E A 2 0 1 1 R I T S c a l e N o r m s | 203
Table C.34. Means (M) and Standard Deviations (sd) of Academic Grow th by Starting RIT Score and Starting Inst ruct ional Week forVarious Ending Instru ctional Weeks - GENERAL SCIENCE, GRADE 5
Ending Instruction al Weeks
Start Prior Grd Focal Grade
Inst. Start 36 4 8 12 16 20 24 28 32 36
Wk RIT M sd M sd M sd M sd M sd M sd M sd M sd M sd M sd
200 0.7 5.42 1.4 5.54 2.2 5.74 2.8 6.01 3.4 6.34 3.9 6.72 4.2 7.15 4.3 7.61
205 0.7 5.42 1.4 5.54 2.0 5.74 2.7 6.01 3.2 6.34 3.6 6.72 3.9 7.15 4.0 7.61
210 0.6 5.42 1.3 5.54 1.9 5.74 2.5 6.01 3.0 6.34 3.4 6.72 3.6 7.15 3.6 7.61
215 0.6 5.42 1.2 5.54 1.8 5.74 2.3 6.01 2.8 6.34 3.1 6.72 3.3 7.15 3.3 7.61
220 0.5 5.42 1.1 5.54 1.6 5.74 2.1 6.01 2.6 6.34 2.9 6.72 3.0 7.15 2.9 7.61
225 0.5 5.42 1.0 5.54 1.5 5.74 2.0 6.01 2.3 6.34 2.6 6.72 2.7 7.15 2.6 7.61
230 0.4 5.42 0.9 5.54 1.4 5.74 1.8 6.01 2.1 6.34 2.3 6.72 2.4 7.15 2.2 7.61
8 170 1.0 5.42 2.0 5.54 2.9 5.74 3.8 6.01 4.5 6.34 5.1 6.72 5.5 7.15
175 1.0 5.42 1.9 5.54 2.8 5.74 3.6 6.01 4.3 6.34 4.8 6.72 5.2 7.15
180 0.9 5.42 1.8 5.54 2.7 5.74 3.4 6.01 4.1 6.34 4.6 6.72 4.8 7.15
185 0.9 5.42 1.7 5.54 2.5 5.74 3.3 6.01 3.9 6.34 4.3 6.72 4.5 7.15
190 0.8 5.42 1.6 5.54 2.4 5.74 3.1 6.01 3.6 6.34 4.0 6.72 4.2 7.15
195 0.8 5.42 1.6 5.54 2.3 5.74 2.9 6.01 3.4 6.34 3.8 6.72 3.9 7.15
200 0.7 5.42 1.5 5.54 2.1 5.74 2.7 6.01 3.2 6.34 3.5 6.72 3.6 7.15
205 0.7 5.42 1.4 5.54 2.0 5.74 2.6 6.01 3.0 6.34 3.3 6.72 3.3 7.15
210 0.7 5.42 1.3 5.54 1.9 5.74 2.4 6.01 2.8 6.34 3.0 6.72 3.0 7.15
215 0.6 5.42 1.2 5.54 1.7 5.74 2.2 6.01 2.6 6.34 2.7 6.72 2.7 7.15
220 0.6 5.42 1.1 5.54 1.6 5.74 2.0 6.01 2.3 6.34 2.5 6.72 2.4 7.15
225 0.5 5.42 1.0 5.54 1.5 5.74 1.9 6.01 2.1 6.34 2.2 6.72 2.1 7.15
230 0.5 5.42 0.9 5.54 1.4 5.74 1.7 6.01 1.9 6.34 1.9 6.72 1.8 7.15
235 0.4 5.42 0.9 5.54 1.2 5.74 1.5 6.01 1.7 6.34 1.7 6.72 1.5 7.15
12 170 1.0 5.42 1.9 5.54 2.8 5.74 3.5 6.01 4.1 6.34 4.5 6.72175 0.9 5.42 1.8 5.54 2.7 5.74 3.3 6.01 3.9 6.34 4.2 6.72
180 0.9 5.42 1.8 5.54 2.5 5.74 3.2 6.01 3.7 6.34 3.9 6.72
185 0.9 5.42 1.7 5.54 2.4 5.74 3.0 6.01 3.4 6.34 3.7 6.72
190 0.8 5.42 1.6 5.54 2.3 5.74 2.8 6.01 3.2 6.34 3.4 6.72
195 0.8 5.42 1.5 5.54 2.1 5.74 2.6 6.01 3.0 6.34 3.2 6.72
200 0.7 5.42 1.4 5.54 2.0 5.74 2.5 6.01 2.8 6.34 2.9 6.72
205 0.7 5.42 1.3 5.54 1.9 5.74 2.3 6.01 2.6 6.34 2.6 6.72
210 0.6 5.42 1.2 5.54 1.7 5.74 2.1 6.01 2.3 6.34 2.4 6.72
215 0.6 5.42 1.1 5.54 1.6 5.74 1.9 6.01 2.1 6.34 2.1 6.72
220 0.6 5.42 1.1 5.54 1.5 5.74 1.8 6.01 1.9 6.34 1.8 6.72
225 0.5 5.42 1.0 5.54 1.3 5.74 1.6 6.01 1.7 6.34 1.6 6.72
230 0.5 5.42 0.9 5.54 1.2 5.74 1.4 6.01 1.5 6.34 1.3 6.72

8/10/2019 n We a 2011 Norms Report
http://slidepdf.com/reader/full/n-we-a-2011-norms-report 220/268
204 | N W E A 2 0 1 1 R I T S c a l e N o r m s
Table C.34. Means (M) and Standard Deviations (sd) of Academic Grow th by Starting RIT Score and Starting Inst ruct ional Week forVarious Ending Instru ctional Weeks - GENERAL SCIENCE, GRADE 5
Ending Instruction al Weeks
Start Prior Grd Focal Grade
Inst. Start 36 4 8 12 16 20 24 28 32 36
Wk RIT M sd M sd M sd M sd M sd M sd M sd M sd M sd M sd
235 0.4 5.42 0.8 5.54 1.1 5.74 1.2 6.01 1.2 6.34 1.1 6.72
16 175 0.9 5.42 1.7 5.54 2.4 5.74 2.9 6.01 3.3 6.34
180 0.9 5.42 1.6 5.54 2.3 5.74 2.8 6.01 3.0 6.34
1850.8 5.42 1.5 5.54 2.1 5.74 2.6 6.01 2.8 6.34190 0.8 5.42 1.5 5.54 2.0 5.74 2.4 6.01 2.6 6.34
195 0.7 5.42 1.4 5.54 1.9 5.74 2.2 6.01 2.4 6.34
200 0.7 5.42 1.3 5.54 1.7 5.74 2.1 6.01 2.2 6.34
205 0.6 5.42 1.2 5.54 1.6 5.74 1.9 6.01 1.9 6.34
210 0.6 5.42 1.1 5.54 1.5 5.74 1.7 6.01 1.7 6.34
215 0.6 5.42 1.0 5.54 1.4 5.74 1.5 6.01 1.5 6.34
220 0.5 5.42 0.9 5.54 1.2 5.74 1.4 6.01 1.3 6.34
225 0.5 5.42 0.8 5.54 1.1 5.74 1.2 6.01 1.1 6.34
230 0.4 5.42 0.8 5.54 1.0 5.74 1.0 6.01 0.9 6.34
235 0.4 5.42 0.7 5.54 0.8 5.74 0.8 6.01 0.6 6.34
20 175 0.8 5.42 1.5 5.54 2.0 5.74 2.4 6.01
180 0.8 5.42 1.4 5.54 1.9 5.74 2.2 6.01
185 0.7 5.42 1.3 5.54 1.8 5.74 2.0 6.01
190 0.7 5.42 1.2 5.54 1.6 5.74 1.8 6.01
195 0.6 5.42 1.2 5.54 1.5 5.74 1.7 6.01
200 0.6 5.42 1.1 5.54 1.4 5.74 1.5 6.01
205 0.6 5.42 1.0 5.54 1.2 5.74 1.3 6.01
210 0.5 5.42 0.9 5.54 1.1 5.74 1.1 6.01215 0.5 5.42 0.8 5.54 1.0 5.74 1.0 6.01
220 0.4 5.42 0.7 5.54 0.9 5.74 0.8 6.01
225 0.4 5.42 0.6 5.54 0.7 5.74 0.6 6.01
230 0.3 5.42 0.5 5.54 0.6 5.74 0.4 6.01
235 0.3 5.42 0.5 5.54 0.5 5.74 0.3 6.01

8/10/2019 n We a 2011 Norms Report
http://slidepdf.com/reader/full/n-we-a-2011-norms-report 221/268
N W E A 2 0 1 1 R I T S c a l e N o r m s | 205
Table C.35. Means (M) and Standard Deviations (sd) o f Academic Growth by Starting RIT Score and Starting Instru ctional Week forVarious Ending Instructional Weeks - GENERAL SCIENCE, GRADE 6
Table C.35. Means (M) and Standard Deviations (sd ) of Academic Growth by Starting RIT Score and Starting Instructi onal Week for VariousEnding Instructi onal Weeks - GENERAL SCIENCE, GRADE 6
Ending Instruction al Weeks
Start Prior Grd Focal Grade
Inst. Start 36 4 8 12 16 20 24 28 32 36
Wk RIT M sd M sd M sd M sd M sd M sd M sd M sd M sd M sd
32(Gd 5)
170 0.6 5.41 1.4 5.52 2.2 5.70 3.2 5.95 4.1 6.24 5.1 6.59 6.0 6.98 6.9 7.40 7.6 7.85 8.3 8.33
1750.6 5.41 1.3 5.52 2.0 5.70 2.9 5.95 3.8 6.24 4.7 6.59 5.5 6.98 6.3 7.40 7.0 7.85 7.6 8.33180 0.5 5.41 1.1 5.52 1.8 5.70 2.6 5.95 3.5 6.24 4.3 6.59 5.1 6.98 5.8 7.40 6.5 7.85 7.0 8.32
185 0.4 5.41 1.0 5.52 1.6 5.70 2.4 5.95 3.1 6.24 3.9 6.59 4.6 6.98 5.3 7.40 5.9 7.85 6.3 8.32
190 0.4 5.41 0.9 5.52 1.4 5.70 2.1 5.95 2.8 6.24 3.5 6.59 4.2 6.98 4.8 7.40 5.3 7.85 5.7 8.32
195 0.3 5.41 0.7 5.52 1.3 5.70 1.8 5.95 2.5 6.24 3.1 6.59 3.7 6.98 4.2 7.40 4.7 7.85 5.0 8.32
200 0.2 5.41 0.6 5.52 1.1 5.70 1.6 5.95 2.1 6.24 2.7 6.59 3.2 6.98 3.7 7.40 4.1 7.85 4.4 8.32
205 0.2 5.41 0.5 5.52 0.9 5.70 1.3 5.95 1.8 6.24 2.3 6.59 2.8 6.98 3.2 7.40 3.5 7.85 3.7 8.32
210 0.1 5.41 0.3 5.52 0.7 5.70 1.1 5.95 1.5 6.24 1.9 6.59 2.3 6.98 2.7 7.40 2.9 7.85 3.0 8.32
215 0.0 5.41 0.2 5.52 0.5 5.70 0.8 5.95 1.2 6.24 1.5 6.59 1.9 6.98 2.1 7.40 2.3 7.85 2.4 8.32
220 0.0 5.41 0.1 5.52 0.3 5.70 0.5 5.95 0.8 6.24 1.1 6.59 1.4 6.98 1.6 7.40 1.7 7.85 1.7 8.32
225 -0.1 5.41 -0.1 5.52 0.1 5.70 0.3 5.95 0.5 6.24 0.7 6.59 0.9 6.98 1.1 7.40 1.1 7.85 1.1 8.32
230 -0.2 5.41 -0.2 5.52 -0.1 5.70 0.0 5.95 0.2 6.24 0.3 6.59 0.5 6.98 0.6 7.40 0.6 7.85 0.4 8.32
235 -0.2 5.41 -0.3 5.52 -0.3 5.70 -0.3 5.95 -0.2 6.24 -0.1 6.59 0.0 6.98 0.0 7.40 0.0 7.85 -0.2 8.33
36(Gd 5)
175 0.7 5.41 1.5 5.52 2.3 5.70 3.2 5.95 4.1 6.24 5.0 6.59 5.8 6.98 6.5 7.40 7.1 7.85
180 0.6 5.41 1.3 5.52 2.1 5.70 3.0 5.95 3.8 6.24 4.6 6.59 5.3 6.98 6.0 7.40 6.5 7.85
185 0.6 5.41 1.2 5.52 1.9 5.70 2.7 5.95 3.5 6.24 4.2 6.59 4.9 6.98 5.4 7.40 5.9 7.85
190 0.5 5.41 1.1 5.52 1.7 5.70 2.4 5.95 3.1 6.24 3.8 6.59 4.4 6.98 4.9 7.40 5.3 7.85
195 0.4 5.41 1.0 5.52 1.5 5.70 2.2 5.95 2.8 6.24 3.4 6.59 3.9 6.98 4.4 7.40 4.7 7.85
200 0.4 5.41 0.8 5.52 1.3 5.70 1.9 5.95 2.5 6.24 3.0 6.59 3.5 6.98 3.9 7.40 4.1 7.85205 0.3 5.41 0.7 5.52 1.2 5.70 1.6 5.95 2.1 6.24 2.6 6.59 3.0 6.98 3.3 7.40 3.5 7.85
210 0.2 5.41 0.6 5.52 1.0 5.70 1.4 5.95 1.8 6.24 2.2 6.59 2.6 6.98 2.8 7.40 2.9 7.85
215 0.2 5.41 0.4 5.52 0.8 5.70 1.1 5.95 1.5 6.24 1.8 6.59 2.1 6.98 2.3 7.40 2.4 7.85
220 0.1 5.41 0.3 5.52 0.6 5.70 0.9 5.95 1.2 6.24 1.4 6.59 1.6 6.98 1.8 7.40 1.8 7.85
225 0.0 5.41 0.2 5.52 0.4 5.70 0.6 5.95 0.8 6.24 1.0 6.59 1.2 6.98 1.2 7.40 1.2 7.85
230 0.0 5.41 0.0 5.52 0.2 5.70 0.3 5.95 0.5 6.24 0.6 6.59 0.7 6.98 0.7 7.40 0.6 7.85
235 -0.1 5.41 -0.1 5.52 0.0 5.70 0.1 5.95 0.2 6.24 0.2 6.59 0.3 6.98 0.2 7.40 0.0 7.85
4 175 0.8 5.41 1.6 5.52 2.5 5.70 3.4 5.95 4.3 6.24 5.1 6.59 5.8 6.98 6.4 7.40
180 0.7 5.41 1.5 5.52 2.3 5.70 3.2 5.95 4.0 6.24 4.7 6.59 5.3 6.98 5.9 7.40
185 0.7 5.41 1.4 5.52 2.1 5.70 2.9 5.95 3.6 6.24 4.3 6.59 4.9 6.98 5.3 7.40
190 0.6 5.41 1.2 5.52 1.9 5.70 2.6 5.95 3.3 6.24 3.9 6.59 4.4 6.98 4.8 7.40
195 0.5 5.41 1.1 5.52 1.7 5.70 2.4 5.95 3.0 6.24 3.5 6.59 4.0 6.98 4.3 7.40

8/10/2019 n We a 2011 Norms Report
http://slidepdf.com/reader/full/n-we-a-2011-norms-report 222/268
206 | N W E A 2 0 1 1 R I T S c a l e N o r m s
Table C.35. Means (M) and Standard Deviations (sd ) of Academic Growth by Starting RIT Score and Starting Instructi onal Week for VariousEnding Instructi onal Weeks - GENERAL SCIENCE, GRADE 6
Ending Instruction al Weeks
Start Prior Grd Focal Grade
Inst. Start 36 4 8 12 16 20 24 28 32 36
Wk RIT M sd M sd M sd M sd M sd M sd M sd M sd M sd M sd
200 0.5 5.41 1.0 5.52 1.5 5.70 2.1 5.95 2.6 6.24 3.1 6.59 3.5 6.98 3.8 7.40
205 0.4 5.41 0.9 5.52 1.3 5.70 1.8 5.95 2.3 6.24 2.7 6.59 3.0 6.98 3.2 7.40
210 0.3 5.41 0.7 5.52 1.2 5.70 1.6 5.95 2.0 6.24 2.3 6.59 2.6 6.98 2.7 7.40
215 0.3 5.41 0.6 5.52 1.0 5.70 1.3 5.95 1.7 6.24 1.9 6.59 2.1 6.98 2.2 7.40
220 0.2 5.41 0.5 5.52 0.8 5.70 1.1 5.95 1.3 6.24 1.5 6.59 1.7 6.98 1.7 7.40
225 0.1 5.41 0.3 5.52 0.6 5.70 0.8 5.95 1.0 6.24 1.2 6.59 1.2 6.98 1.1 7.40
230 0.1 5.41 0.2 5.52 0.4 5.70 0.5 5.95 0.7 6.24 0.8 6.59 0.7 6.98 0.6 7.40
235 0.0 5.41 0.1 5.52 0.2 5.70 0.3 5.95 0.3 6.24 0.4 6.59 0.3 6.98 0.1 7.40
8 175 0.9 5.41 1.7 5.52 2.6 5.70 3.5 5.95 4.3 6.24 5.0 6.59 5.6 6.98
180 0.8 5.41 1.6 5.52 2.4 5.70 3.2 5.95 4.0 6.24 4.6 6.59 5.1 6.98
185 0.7 5.41 1.5 5.52 2.2 5.70 3.0 5.95 3.6 6.24 4.2 6.59 4.7 6.98
190 0.7 5.41 1.4 5.52 2.0 5.70 2.7 5.95 3.3 6.24 3.8 6.59 4.2 6.98
195 0.6 5.41 1.2 5.52 1.8 5.70 2.4 5.95 3.0 6.24 3.4 6.59 3.8 6.98
200 0.5 5.41 1.1 5.52 1.7 5.70 2.2 5.95 2.7 6.24 3.0 6.59 3.3 6.98
205 0.5 5.41 1.0 5.52 1.5 5.70 1.9 5.95 2.3 6.24 2.7 6.59 2.9 6.98
210 0.4 5.41 0.8 5.52 1.3 5.70 1.7 5.95 2.0 6.24 2.3 6.59 2.4 6.98
215 0.3 5.41 0.7 5.52 1.1 5.70 1.4 5.95 1.7 6.24 1.9 6.59 1.9 6.98
220 0.3 5.41 0.6 5.52 0.9 5.70 1.1 5.95 1.3 6.24 1.5 6.59 1.5 6.98
225 0.2 5.41 0.4 5.52 0.7 5.70 0.9 5.95 1.0 6.24 1.1 6.59 1.0 6.98
230 0.1 5.41 0.3 5.52 0.5 5.70 0.6 5.95 0.7 6.24 0.7 6.59 0.6 6.98
235 0.1 5.41 0.2 5.52 0.3 5.70 0.3 5.95 0.4 6.24 0.3 6.59 0.1 6.98
12 175 0.9 5.41 1.8 5.52 2.6 5.70 3.4 5.95 4.2 6.24 4.8 6.59180 0.8 5.41 1.7 5.52 2.4 5.70 3.2 5.95 3.8 6.24 4.4 6.59
185 0.8 5.41 1.5 5.52 2.3 5.70 2.9 5.95 3.5 6.24 4.0 6.59
190 0.7 5.41 1.4 5.52 2.1 5.70 2.7 5.95 3.2 6.24 3.6 6.59
195 0.6 5.41 1.3 5.52 1.9 5.70 2.4 5.95 2.8 6.24 3.2 6.59
200 0.6 5.41 1.1 5.52 1.7 5.70 2.1 5.95 2.5 6.24 2.8 6.59
205 0.5 5.41 1.0 5.52 1.5 5.70 1.9 5.95 2.2 6.24 2.4 6.59
210 0.4 5.41 0.9 5.52 1.3 5.70 1.6 5.95 1.9 6.24 2.0 6.59
215 0.4 5.41 0.7 5.52 1.1 5.70 1.3 5.95 1.5 6.24 1.6 6.59
220 0.3 5.41 0.6 5.52 0.9 5.70 1.1 5.95 1.2 6.24 1.2 6.59
225 0.2 5.41 0.5 5.52 0.7 5.70 0.8 5.95 0.9 6.24 0.8 6.59
230 0.2 5.41 0.3 5.52 0.5 5.70 0.6 5.95 0.6 6.24 0.4 6.59
235 0.1 5.41 0.2 5.52 0.3 5.70 0.3 5.95 0.2 6.24 0.0 6.59

8/10/2019 n We a 2011 Norms Report
http://slidepdf.com/reader/full/n-we-a-2011-norms-report 223/268
N W E A 2 0 1 1 R I T S c a l e N o r m s | 207
Table C.35. Means (M) and Standard Deviations (sd ) of Academic Growth by Starting RIT Score and Starting Instructi onal Week for VariousEnding Instructi onal Weeks - GENERAL SCIENCE, GRADE 6
Ending Instruction al Weeks
Start Prior Grd Focal Grade
Inst. Start 36 4 8 12 16 20 24 28 32 36
Wk RIT M sd M sd M sd M sd M sd M sd M sd M sd M sd M sd
16 175 0.9 5.41 1.8 5.52 2.6 5.70 3.3 5.95 3.9 6.24
180 0.8 5.41 1.6 5.52 2.4 5.70 3.0 5.95 3.5 6.24
185 0.8 5.41 1.5 5.52 2.2 5.70 2.8 5.95 3.2 6.24
190 0.7 5.41 1.4 5.52 2.0 5.70 2.5 5.95 2.9 6.24
195 0.6 5.41 1.2 5.52 1.8 5.70 2.2 5.95 2.6 6.24
200 0.6 5.41 1.1 5.52 1.6 5.70 2.0 5.95 2.2 6.24
205 0.5 5.41 1.0 5.52 1.4 5.70 1.7 5.95 1.9 6.24
210 0.4 5.41 0.8 5.52 1.2 5.70 1.4 5.95 1.6 6.24
215 0.4 5.41 0.7 5.52 1.0 5.70 1.2 5.95 1.2 6.24
220 0.3 5.41 0.6 5.52 0.8 5.70 0.9 5.95 0.9 6.24
225 0.2 5.41 0.4 5.52 0.6 5.70 0.7 5.95 0.6 6.24
230 0.2 5.41 0.3 5.52 0.4 5.70 0.4 5.95 0.3 6.24
235 0.1 5.41 0.2 5.52 0.2 5.70 0.1 5.95 -0.1 6.24
240 0.0 5.41 0.1 5.52 0.0 5.70 -0.1 5.95 -0.4 6.24
20 175 0.9 5.41 1.7 5.52 2.4 5.70 3.0 5.95
180 0.8 5.41 1.5 5.52 2.2 5.70 2.7 5.95
185 0.7 5.41 1.4 5.52 2.0 5.70 2.5 5.95
190 0.7 5.41 1.3 5.52 1.8 5.70 2.2 5.95
195 0.6 5.41 1.1 5.52 1.6 5.70 1.9 5.95
200 0.5 5.41 1.0 5.52 1.4 5.70 1.7 5.95
205 0.5 5.41 0.9 5.52 1.2 5.70 1.4 5.95
210 0.4 5.41 0.8 5.52 1.0 5.70 1.1 5.95215 0.3 5.41 0.6 5.52 0.8 5.70 0.9 5.95
220 0.3 5.41 0.5 5.52 0.6 5.70 0.6 5.95
225 0.2 5.41 0.4 5.52 0.4 5.70 0.4 5.95
230 0.1 5.41 0.2 5.52 0.2 5.70 0.1 5.95
235 0.1 5.41 0.1 5.52 0.0 5.70 -0.2 5.95
240 0.0 5.41 0.0 5.52 -0.2 5.70 -0.4 5.95

8/10/2019 n We a 2011 Norms Report
http://slidepdf.com/reader/full/n-we-a-2011-norms-report 224/268
208 | N W E A 2 0 1 1 R I T S c a l e N o r m s
Table C.36. Means (M) and Standard Deviations (sd) o f Academic Growth by Starting RIT Score and Starting Instru ctional Week forVarious Ending Instructional Weeks - GENERAL SCIENCE, GRADE 7
Table C.36. Means (M) and Standard Deviations (sd) of Academic Grow th by Starting RIT Score and Starting Inst ruct ional Week for VariousEnding Instru ctional Weeks - GENERAL SCIENCE, GRADE 7
Ending Instruction al Weeks
Start Prior Grd Focal Grade
Inst. Start 36 4 8 12 16 20 24 28 32 36
Wk RIT M sd M sd M sd M sd M sd M sd M sd M sd M sd M sd
32(Gd 6)
175 0.6 5.42 1.3 5.55 2.1 5.77 3.0 6.05 3.9 6.41 4.8 6.81 5.7 7.26 6.6 7.75 7.4 8.26 8.1 8.80
1800.5 5.42 1.2 5.55 1.9 5.77 2.7 6.05 3.6 6.41 4.4 6.81 5.3 7.26 6.1 7.74 6.8 8.26 7.5 8.80185 0.5 5.42 1.0 5.55 1.7 5.77 2.5 6.05 3.2 6.41 4.0 6.81 4.8 7.26 5.5 7.74 6.2 8.26 6.8 8.80
190 0.4 5.42 0.9 5.55 1.5 5.77 2.2 6.05 2.9 6.41 3.6 6.81 4.3 7.26 5.0 7.74 5.6 8.26 6.1 8.80
195 0.3 5.42 0.8 5.55 1.3 5.77 1.9 6.05 2.6 6.41 3.2 6.81 3.9 7.26 4.5 7.74 5.0 8.26 5.5 8.80
200 0.3 5.42 0.7 5.55 1.1 5.77 1.7 6.05 2.3 6.41 2.8 6.81 3.4 7.26 4.0 7.74 4.5 8.26 4.8 8.80
205 0.2 5.42 0.5 5.55 0.9 5.77 1.4 6.05 1.9 6.41 2.5 6.81 3.0 7.26 3.4 7.74 3.9 8.26 4.2 8.80
210 0.1 5.42 0.4 5.55 0.7 5.77 1.1 6.05 1.6 6.41 2.1 6.81 2.5 7.26 2.9 7.74 3.3 8.26 3.5 8.80
215 0.1 5.42 0.3 5.55 0.5 5.77 0.9 6.05 1.3 6.41 1.7 6.81 2.1 7.26 2.4 7.74 2.7 8.26 2.9 8.80
220 0.0 5.42 0.1 5.55 0.3 5.77 0.6 6.05 0.9 6.41 1.3 6.81 1.6 7.26 1.9 7.74 2.1 8.26 2.2 8.80
225 -0.1 5.42 0.0 5.55 0.1 5.77 0.4 6.05 0.6 6.41 0.9 6.81 1.1 7.26 1.4 7.74 1.5 8.26 1.6 8.80
230 -0.1 5.42 -0.1 5.55 -0.1 5.77 0.1 6.05 0.3 6.41 0.5 6.81 0.7 7.26 0.8 7.74 0.9 8.26 0.9 8.80
235 -0.2 5.42 -0.3 5.55 -0.3 5.77 -0.2 6.05 0.0 6.41 0.1 6.81 0.2 7.26 0.3 7.74 0.3 8.26 0.3 8.80
240 -0.3 5.42 -0.4 5.55 -0.5 5.77 -0.4 6.05 -0.4 6.41 -0.3 6.81 -0.2 7.26 -0.2 7.75 -0.3 8.26 -0.4 8.80
36(Gd 6)
175 0.7 5.42 1.5 5.55 2.4 5.77 3.3 6.05 4.2 6.41 5.1 6.81 6.0 7.26 6.8 7.75 7.5 8.26
180 0.6 5.42 1.4 5.55 2.2 5.77 3.0 6.05 3.9 6.41 4.7 6.81 5.5 7.26 6.3 7.74 6.9 8.26
185 0.6 5.42 1.3 5.55 2.0 5.77 2.8 6.05 3.6 6.41 4.3 6.81 5.1 7.26 5.8 7.74 6.3 8.26
190 0.5 5.42 1.1 5.55 1.8 5.77 2.5 6.05 3.2 6.41 3.9 6.81 4.6 7.26 5.2 7.74 5.8 8.26
195 0.5 5.42 1.0 5.55 1.6 5.77 2.2 6.05 2.9 6.41 3.6 6.81 4.2 7.26 4.7 7.74 5.2 8.26
200 0.4 5.42 0.9 5.55 1.4 5.77 2.0 6.05 2.6 6.41 3.2 6.81 3.7 7.26 4.2 7.74 4.6 8.26205 0.3 5.42 0.7 5.55 1.2 5.77 1.7 6.05 2.3 6.41 2.8 6.81 3.3 7.26 3.7 7.74 4.0 8.26
210 0.3 5.42 0.6 5.55 1.0 5.77 1.5 6.05 1.9 6.41 2.4 6.81 2.8 7.26 3.1 7.74 3.4 8.26
215 0.2 5.42 0.5 5.55 0.8 5.77 1.2 6.05 1.6 6.41 2.0 6.81 2.3 7.26 2.6 7.74 2.8 8.26
220 0.1 5.42 0.3 5.55 0.6 5.77 0.9 6.05 1.3 6.41 1.6 6.81 1.9 7.26 2.1 7.74 2.2 8.26
225 0.1 5.42 0.2 5.55 0.4 5.77 0.7 6.05 0.9 6.41 1.2 6.81 1.4 7.26 1.6 7.74 1.6 8.26
230 0.0 5.42 0.1 5.55 0.2 5.77 0.4 6.05 0.6 6.41 0.8 6.81 1.0 7.26 1.1 7.74 1.0 8.26
235 -0.1 5.42 -0.1 5.55 0.0 5.77 0.2 6.05 0.3 6.41 0.4 6.81 0.5 7.26 0.5 7.74 0.5 8.26
240 -0.1 5.42 -0.2 5.55 -0.2 5.77 -0.1 6.05 0.0 6.41 0.0 6.81 0.0 7.26 0.0 7.75 -0.1 8.26
4 175 0.8 5.42 1.7 5.55 2.6 5.77 3.5 6.05 4.4 6.41 5.3 6.81 6.1 7.26 6.8 7.75
180 0.7 5.42 1.5 5.55 2.4 5.77 3.2 6.05 4.1 6.41 4.9 6.81 5.6 7.26 6.3 7.74
185 0.7 5.42 1.4 5.55 2.2 5.77 3.0 6.05 3.8 6.41 4.5 6.81 5.2 7.26 5.8 7.74
190 0.6 5.42 1.3 5.55 2.0 5.77 2.7 6.05 3.4 6.41 4.1 6.81 4.7 7.26 5.2 7.74

8/10/2019 n We a 2011 Norms Report
http://slidepdf.com/reader/full/n-we-a-2011-norms-report 225/268
N W E A 2 0 1 1 R I T S c a l e N o r m s | 209
Table C.36. Means (M) and Standard Deviations (sd) of Academic Grow th by Starting RIT Score and Starting Inst ruct ional Week for VariousEnding Instru ctional Weeks - GENERAL SCIENCE, GRADE 7
Ending Instruction al Weeks
Start Prior Grd Focal Grade
Inst. Start 36 4 8 12 16 20 24 28 32 36
Wk RIT M sd M sd M sd M sd M sd M sd M sd M sd M sd M sd
195 0.5 5.42 1.2 5.55 1.8 5.77 2.5 6.05 3.1 6.41 3.7 6.81 4.3 7.26 4.7 7.74
200 0.5 5.42 1.0 5.55 1.6 5.77 2.2 6.05 2.8 6.41 3.3 6.81 3.8 7.26 4.2 7.74
205 0.4 5.42 0.9 5.55 1.4 5.77 1.9 6.05 2.5 6.41 2.9 6.81 3.3 7.26 3.7 7.74
210 0.3 5.42 0.8 5.55 1.2 5.77 1.7 6.05 2.1 6.41 2.5 6.81 2.9 7.26 3.1 7.74
215 0.3 5.42 0.6 5.55 1.0 5.77 1.4 6.05 1.8 6.41 2.1 6.81 2.4 7.26 2.6 7.74
220 0.2 5.42 0.5 5.55 0.8 5.77 1.2 6.05 1.5 6.41 1.8 6.81 2.0 7.26 2.1 7.74
225 0.2 5.42 0.4 5.55 0.6 5.77 0.9 6.05 1.1 6.41 1.4 6.81 1.5 7.26 1.6 7.74
230 0.1 5.42 0.2 5.55 0.4 5.77 0.6 6.05 0.8 6.41 1.0 6.81 1.1 7.26 1.1 7.74
235 0.0 5.42 0.1 5.55 0.2 5.77 0.4 6.05 0.5 6.41 0.6 6.81 0.6 7.26 0.5 7.74
240 -0.1 5.42 0.0 5.55 0.0 5.77 0.1 6.05 0.2 6.41 0.2 6.81 0.1 7.26 0.0 7.75
8 175 0.9 5.42 1.8 5.55 2.7 5.77 3.6 6.05 4.5 6.41 5.3 6.81 6.0 7.26
180 0.8 5.42 1.7 5.55 2.5 5.77 3.4 6.05 4.2 6.41 4.9 6.81 5.5 7.26
185 0.7 5.42 1.5 5.55 2.3 5.77 3.1 6.05 3.8 6.41 4.5 6.81 5.1 7.26
190 0.7 5.42 1.4 5.55 2.1 5.77 2.8 6.05 3.5 6.41 4.1 6.81 4.6 7.26
195 0.6 5.42 1.3 5.55 1.9 5.77 2.6 6.05 3.2 6.41 3.7 6.81 4.2 7.26
200 0.5 5.42 1.1 5.55 1.7 5.77 2.3 6.05 2.8 6.41 3.3 6.81 3.7 7.26
205 0.5 5.42 1.0 5.55 1.5 5.77 2.0 6.05 2.5 6.41 2.9 6.81 3.3 7.26
210 0.4 5.42 0.9 5.55 1.3 5.77 1.8 6.05 2.2 6.41 2.5 6.81 2.8 7.26
215 0.4 5.42 0.7 5.55 1.1 5.77 1.5 6.05 1.9 6.41 2.2 6.81 2.3 7.26
220 0.3 5.42 0.6 5.55 0.9 5.77 1.3 6.05 1.5 6.41 1.8 6.81 1.9 7.26
225 0.2 5.42 0.5 5.55 0.7 5.77 1.0 6.05 1.2 6.41 1.4 6.81 1.4 7.26
230 0.2 5.42 0.3 5.55 0.5 5.77 0.7 6.05 0.9 6.41 1.0 6.81 1.0 7.26235 0.1 5.42 0.2 5.55 0.4 5.77 0.5 6.05 0.6 6.41 0.6 6.81 0.5 7.26
240 0.0 5.42 0.1 5.55 0.2 5.77 0.2 6.05 0.2 6.41 0.2 6.81 0.1 7.26
12 175 0.9 5.42 1.8 5.55 2.7 5.77 3.6 6.05 4.4 6.41 5.1 6.81
180 0.8 5.42 1.7 5.55 2.5 5.77 3.4 6.05 4.1 6.41 4.7 6.81
185 0.8 5.42 1.6 5.55 2.4 5.77 3.1 6.05 3.8 6.41 4.4 6.81
190 0.7 5.42 1.4 5.55 2.2 5.77 2.8 6.05 3.4 6.41 4.0 6.81
195 0.7 5.42 1.3 5.55 2.0 5.77 2.6 6.05 3.1 6.41 3.6 6.81
200 0.6 5.42 1.2 5.55 1.8 5.77 2.3 6.05 2.8 6.41 3.2 6.81
205 0.5 5.42 1.1 5.55 1.6 5.77 2.0 6.05 2.5 6.41 2.8 6.81
210 0.5 5.42 0.9 5.55 1.4 5.77 1.8 6.05 2.1 6.41 2.4 6.81
215 0.4 5.42 0.8 5.55 1.2 5.77 1.5 6.05 1.8 6.41 2.0 6.81
220 0.3 5.42 0.7 5.55 1.0 5.77 1.3 6.05 1.5 6.41 1.6 6.81
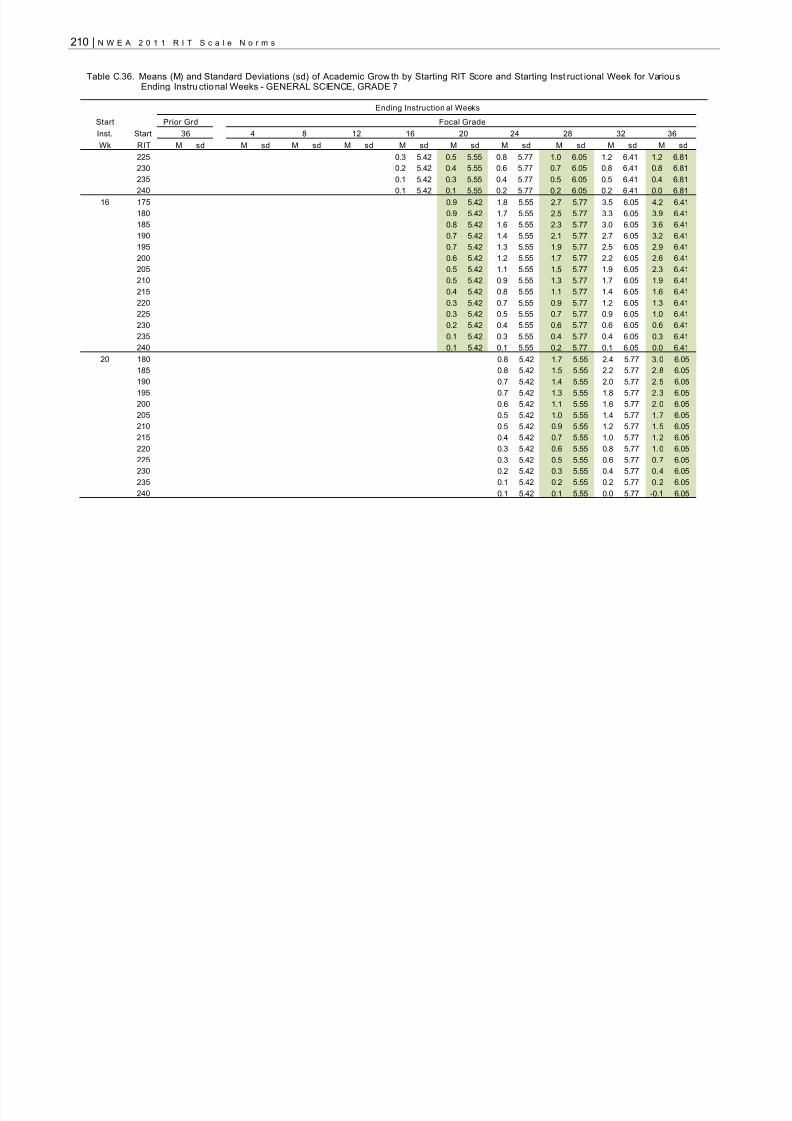
8/10/2019 n We a 2011 Norms Report
http://slidepdf.com/reader/full/n-we-a-2011-norms-report 226/268
210 | N W E A 2 0 1 1 R I T S c a l e N o r m s
Table C.36. Means (M) and Standard Deviations (sd) of Academic Grow th by Starting RIT Score and Starting Inst ruct ional Week for VariousEnding Instru ctional Weeks - GENERAL SCIENCE, GRADE 7
Ending Instruction al Weeks
Start Prior Grd Focal Grade
Inst. Start 36 4 8 12 16 20 24 28 32 36
Wk RIT M sd M sd M sd M sd M sd M sd M sd M sd M sd M sd
225 0.3 5.42 0.5 5.55 0.8 5.77 1.0 6.05 1.2 6.41 1.2 6.81
230 0.2 5.42 0.4 5.55 0.6 5.77 0.7 6.05 0.8 6.41 0.8 6.81
235 0.1 5.42 0.3 5.55 0.4 5.77 0.5 6.05 0.5 6.41 0.4 6.81
240 0.1 5.42 0.1 5.55 0.2 5.77 0.2 6.05 0.2 6.41 0.0 6.81
16 175 0.9 5.42 1.8 5.55 2.7 5.77 3.5 6.05 4.2 6.41
180 0.9 5.42 1.7 5.55 2.5 5.77 3.3 6.05 3.9 6.41
185 0.8 5.42 1.6 5.55 2.3 5.77 3.0 6.05 3.6 6.41
190 0.7 5.42 1.4 5.55 2.1 5.77 2.7 6.05 3.2 6.41
195 0.7 5.42 1.3 5.55 1.9 5.77 2.5 6.05 2.9 6.41
200 0.6 5.42 1.2 5.55 1.7 5.77 2.2 6.05 2.6 6.41
205 0.5 5.42 1.1 5.55 1.5 5.77 1.9 6.05 2.3 6.41
210 0.5 5.42 0.9 5.55 1.3 5.77 1.7 6.05 1.9 6.41
215 0.4 5.42 0.8 5.55 1.1 5.77 1.4 6.05 1.6 6.41
220 0.3 5.42 0.7 5.55 0.9 5.77 1.2 6.05 1.3 6.41
225 0.3 5.42 0.5 5.55 0.7 5.77 0.9 6.05 1.0 6.41
230 0.2 5.42 0.4 5.55 0.6 5.77 0.6 6.05 0.6 6.41
235 0.1 5.42 0.3 5.55 0.4 5.77 0.4 6.05 0.3 6.41
240 0.1 5.42 0.1 5.55 0.2 5.77 0.1 6.05 0.0 6.41
20 180 0.8 5.42 1.7 5.55 2.4 5.77 3.0 6.05
185 0.8 5.42 1.5 5.55 2.2 5.77 2.8 6.05
190 0.7 5.42 1.4 5.55 2.0 5.77 2.5 6.05
195 0.7 5.42 1.3 5.55 1.8 5.77 2.3 6.05200 0.6 5.42 1.1 5.55 1.6 5.77 2.0 6.05
205 0.5 5.42 1.0 5.55 1.4 5.77 1.7 6.05
210 0.5 5.42 0.9 5.55 1.2 5.77 1.5 6.05
215 0.4 5.42 0.7 5.55 1.0 5.77 1.2 6.05
220 0.3 5.42 0.6 5.55 0.8 5.77 1.0 6.05
225 0.3 5.42 0.5 5.55 0.6 5.77 0.7 6.05
230 0.2 5.42 0.3 5.55 0.4 5.77 0.4 6.05
235 0.1 5.42 0.2 5.55 0.2 5.77 0.2 6.05
240 0.1 5.42 0.1 5.55 0.0 5.77 -0.1 6.05

8/10/2019 n We a 2011 Norms Report
http://slidepdf.com/reader/full/n-we-a-2011-norms-report 227/268
N W E A 2 0 1 1 R I T S c a l e N o r m s | 211
Table C.37. Means (M) and Standard Deviations (sd) o f Academic Growth by Starting RIT Score and Starting Instru ctional Week forVarious Ending Instructional Weeks - GENERAL SCIENCE, GRADE 8
Table C.37. Means (M) and Standard Deviations (sd) of Academic Grow th by Starting RIT Score and Starting Instruc tion al Week forVarious Ending Instructi onal Weeks - GENERAL SCIENCE, GRADE 8
Ending Instruction al Weeks
Start Prior Grd Focal Grade
Inst. Start 36 4 8 12 16 20 24 28 32 36
Wk RIT M sd M sd M sd M sd M sd M sd M sd M sd M sd M sd
32(Gd 7)
175 0.4 5.43 0.8 5.58 1.4 5.82 2.0 6.15 2.7 6.54 3.3 7.00 3.9 7.50 4.5 8.04 4.9 8.61 5.2 9.20
1800.3 5.43 0.8 5.58 1.3 5.82 1.9 6.15 2.5 6.54 3.2 7.00 3.7 7.50 4.2 8.04 4.7 8.61 4.9 9.20185 0.3 5.43 0.7 5.58 1.2 5.82 1.8 6.15 2.4 6.54 3.0 7.00 3.5 7.50 4.0 8.04 4.4 8.61 4.6 9.20
190 0.3 5.43 0.7 5.58 1.1 5.82 1.7 6.15 2.2 6.54 2.8 7.00 3.3 7.50 3.8 8.04 4.1 8.61 4.3 9.20
195 0.2 5.43 0.6 5.58 1.1 5.82 1.6 6.15 2.1 6.54 2.6 7.00 3.1 7.50 3.5 8.04 3.9 8.61 4.1 9.20
200 0.2 5.43 0.5 5.58 1.0 5.82 1.5 6.15 2.0 6.54 2.5 7.00 2.9 7.50 3.3 8.04 3.6 8.61 3.8 9.20
205 0.2 5.43 0.5 5.58 0.9 5.82 1.3 6.15 1.8 6.54 2.3 7.00 2.7 7.50 3.1 8.04 3.4 8.61 3.5 9.20
210 0.2 5.43 0.4 5.58 0.8 5.82 1.2 6.15 1.7 6.54 2.1 7.00 2.5 7.50 2.9 8.04 3.1 8.61 3.2 9.20
215 0.1 5.43 0.4 5.58 0.7 5.82 1.1 6.15 1.5 6.54 1.9 7.00 2.3 7.50 2.6 8.04 2.8 8.61 2.9 9.20
220 0.1 5.43 0.3 5.58 0.6 5.82 1.0 6.15 1.4 6.54 1.8 7.00 2.1 7.50 2.4 8.04 2.6 8.61 2.6 9.20
225 0.1 5.43 0.3 5.58 0.5 5.82 0.9 6.15 1.2 6.54 1.6 7.00 1.9 7.50 2.2 8.04 2.3 8.61 2.3 9.20
230 0.0 5.43 0.2 5.58 0.5 5.82 0.8 6.15 1.1 6.54 1.4 7.00 1.7 7.50 1.9 8.04 2.1 8.61 2.0 9.20
235 0.0 5.43 0.1 5.58 0.4 5.82 0.6 6.15 0.9 6.54 1.2 7.00 1.5 7.50 1.7 8.04 1.8 8.61 1.7 9.20
240 0.0 5.43 0.1 5.58 0.3 5.82 0.5 6.15 0.8 6.54 1.1 7.00 1.3 7.50 1.5 8.04 1.5 8.61 1.5 9.20
245 -0.1 5.43 0.0 5.58 0.2 5.82 0.4 6.15 0.7 6.54 0.9 7.00 1.1 7.50 1.2 8.04 1.3 8.61 1.2 9.20
36(Gd 7)
175 0.5 5.43 1.0 5.58 1.7 5.82 2.3 6.15 3.0 6.54 3.6 7.00 4.1 7.50 4.6 8.04 4.9 8.61
180 0.5 5.43 1.0 5.58 1.6 5.82 2.2 6.15 2.8 6.54 3.4 7.00 3.9 7.50 4.3 8.04 4.6 8.61
185 0.4 5.43 0.9 5.58 1.5 5.82 2.1 6.15 2.7 6.54 3.2 7.00 3.7 7.50 4.1 8.04 4.3 8.61
190 0.4 5.43 0.9 5.58 1.4 5.82 2.0 6.15 2.5 6.54 3.1 7.00 3.5 7.50 3.9 8.04 4.1 8.61
195 0.4 5.43 0.8 5.58 1.3 5.82 1.9 6.15 2.4 6.54 2.9 7.00 3.3 7.50 3.6 8.04 3.8 8.61200 0.3 5.43 0.8 5.58 1.2 5.82 1.7 6.15 2.3 6.54 2.7 7.00 3.1 7.50 3.4 8.04 3.6 8.61
205 0.3 5.43 0.7 5.58 1.2 5.82 1.6 6.15 2.1 6.54 2.5 7.00 2.9 7.50 3.2 8.04 3.3 8.61
210 0.3 5.43 0.6 5.58 1.1 5.82 1.5 6.15 2.0 6.54 2.4 7.00 2.7 7.50 2.9 8.04 3.0 8.61
215 0.3 5.43 0.6 5.58 1.0 5.82 1.4 6.15 1.8 6.54 2.2 7.00 2.5 7.50 2.7 8.04 2.8 8.61
220 0.2 5.43 0.5 5.58 0.9 5.82 1.3 6.15 1.7 6.54 2.0 7.00 2.3 7.50 2.5 8.04 2.5 8.61
225 0.2 5.43 0.5 5.58 0.8 5.82 1.2 6.15 1.5 6.54 1.8 7.00 2.1 7.50 2.2 8.04 2.3 8.61
230 0.2 5.43 0.4 5.58 0.7 5.82 1.1 6.15 1.4 6.54 1.7 7.00 1.9 7.50 2.0 8.04 2.0 8.61
235 0.1 5.43 0.4 5.58 0.6 5.82 0.9 6.15 1.2 6.54 1.5 7.00 1.7 7.50 1.8 8.04 1.7 8.61
240 0.1 5.43 0.3 5.58 0.5 5.82 0.8 6.15 1.1 6.54 1.3 7.00 1.5 7.50 1.6 8.04 1.5 8.61
245 0.1 5.43 0.2 5.58 0.5 5.82 0.7 6.15 1.0 6.54 1.2 7.00 1.3 7.50 1.3 8.04 1.2 8.61
4 180 0.5 5.43 1.1 5.58 1.8 5.82 2.4 6.15 3.0 6.54 3.5 7.00 3.9 7.50 4.2 8.04
185 0.5 5.43 1.1 5.58 1.7 5.82 2.3 6.15 2.8 6.54 3.3 7.00 3.7 7.50 3.9 8.04

8/10/2019 n We a 2011 Norms Report
http://slidepdf.com/reader/full/n-we-a-2011-norms-report 228/268
212 | N W E A 2 0 1 1 R I T S c a l e N o r m s
Table C.37. Means (M) and Standard Deviations (sd) of Academic Grow th by Starting RIT Score and Starting Instruc tion al Week forVarious Ending Instructi onal Weeks - GENERAL SCIENCE, GRADE 8
Ending Instruction al Weeks
Start Prior Grd Focal Grade
Inst. Start 36 4 8 12 16 20 24 28 32 36
Wk RIT M sd M sd M sd M sd M sd M sd M sd M sd M sd M sd
190 0.5 5.43 1.0 5.58 1.6 5.82 2.1 6.15 2.7 6.54 3.1 7.00 3.5 7.50 3.7 8.04
195 0.5 5.43 1.0 5.58 1.5 5.82 2.0 6.15 2.5 6.54 2.9 7.00 3.3 7.50 3.5 8.04
200 0.4 5.43 0.9 5.58 1.4 5.82 1.9 6.15 2.4 6.54 2.8 7.00 3.1 7.50 3.2 8.04
205 0.4 5.43 0.9 5.58 1.3 5.82 1.8 6.15 2.2 6.54 2.6 7.00 2.9 7.50 3.0 8.04
210 0.4 5.43 0.8 5.58 1.2 5.82 1.7 6.15 2.1 6.54 2.4 7.00 2.7 7.50 2.8 8.04
215 0.3 5.43 0.7 5.58 1.2 5.82 1.6 6.15 1.9 6.54 2.3 7.00 2.5 7.50 2.5 8.04
220 0.3 5.43 0.7 5.58 1.1 5.82 1.5 6.15 1.8 6.54 2.1 7.00 2.3 7.50 2.3 8.04
225 0.3 5.43 0.6 5.58 1.0 5.82 1.3 6.15 1.7 6.54 1.9 7.00 2.1 7.50 2.1 8.04
230 0.3 5.43 0.6 5.58 0.9 5.82 1.2 6.15 1.5 6.54 1.7 7.00 1.9 7.50 1.8 8.04
235 0.2 5.43 0.5 5.58 0.8 5.82 1.1 6.15 1.4 6.54 1.6 7.00 1.7 7.50 1.6 8.04
240 0.2 5.43 0.4 5.58 0.7 5.82 1.0 6.15 1.2 6.54 1.4 7.00 1.5 7.50 1.4 8.04
245 0.2 5.43 0.4 5.58 0.6 5.82 0.9 6.15 1.1 6.54 1.2 7.00 1.2 7.50 1.1 8.04
8 180 0.6 5.43 1.2 5.58 1.8 5.82 2.4 6.15 2.9 6.54 3.3 7.00 3.6 7.50
185 0.6 5.43 1.2 5.58 1.8 5.82 2.3 6.15 2.8 6.54 3.2 7.00 3.4 7.50
190 0.5 5.43 1.1 5.58 1.7 5.82 2.2 6.15 2.6 6.54 3.0 7.00 3.2 7.50
195 0.5 5.43 1.1 5.58 1.6 5.82 2.1 6.15 2.5 6.54 2.8 7.00 3.0 7.50
200 0.5 5.43 1.0 5.58 1.5 5.82 2.0 6.15 2.4 6.54 2.6 7.00 2.8 7.50
205 0.5 5.43 0.9 5.58 1.4 5.82 1.8 6.15 2.2 6.54 2.5 7.00 2.6 7.50
210 0.4 5.43 0.9 5.58 1.3 5.82 1.7 6.15 2.1 6.54 2.3 7.00 2.4 7.50
215 0.4 5.43 0.8 5.58 1.2 5.82 1.6 6.15 1.9 6.54 2.1 7.00 2.2 7.50
220 0.4 5.43 0.8 5.58 1.1 5.82 1.5 6.15 1.8 6.54 2.0 7.00 2.0 7.50
225 0.3 5.43 0.7 5.58 1.1 5.82 1.4 6.15 1.6 6.54 1.8 7.00 1.8 7.50230 0.3 5.43 0.6 5.58 1.0 5.82 1.3 6.15 1.5 6.54 1.6 7.00 1.6 7.50
235 0.3 5.43 0.6 5.58 0.9 5.82 1.2 6.15 1.3 6.54 1.4 7.00 1.4 7.50
240 0.3 5.43 0.5 5.58 0.8 5.82 1.0 6.15 1.2 6.54 1.3 7.00 1.2 7.50
245 0.2 5.43 0.5 5.58 0.7 5.82 0.9 6.15 1.1 6.54 1.1 7.00 1.0 7.50
12 180 0.6 5.43 1.2 5.58 1.8 5.82 2.3 6.15 2.7 6.54 3.0 7.00
185 0.6 5.43 1.2 5.58 1.7 5.82 2.2 6.15 2.6 6.54 2.8 7.00
190 0.6 5.43 1.1 5.58 1.7 5.82 2.1 6.15 2.5 6.54 2.7 7.00
195 0.5 5.43 1.1 5.58 1.6 5.82 2.0 6.15 2.3 6.54 2.5 7.00
200 0.5 5.43 1.0 5.58 1.5 5.82 1.9 6.15 2.2 6.54 2.3 7.00
205 0.5 5.43 1.0 5.58 1.4 5.82 1.8 6.15 2.0 6.54 2.2 7.00
210 0.5 5.43 0.9 5.58 1.3 5.82 1.6 6.15 1.9 6.54 2.0 7.00
215 0.4 5.43 0.8 5.58 1.2 5.82 1.5 6.15 1.7 6.54 1.8 7.00

8/10/2019 n We a 2011 Norms Report
http://slidepdf.com/reader/full/n-we-a-2011-norms-report 229/268
N W E A 2 0 1 1 R I T S c a l e N o r m s | 213
Table C.37. Means (M) and Standard Deviations (sd) of Academic Grow th by Starting RIT Score and Starting Instruc tion al Week forVarious Ending Instructi onal Weeks - GENERAL SCIENCE, GRADE 8
Ending Instruction al Weeks
Start Prior Grd Focal Grade
Inst. Start 36 4 8 12 16 20 24 28 32 36
Wk RIT M sd M sd M sd M sd M sd M sd M sd M sd M sd M sd
220 0.4 5.43 0.8 5.58 1.1 5.82 1.4 6.15 1.6 6.54 1.6 7.00
225 0.4 5.43 0.7 5.58 1.0 5.82 1.3 6.15 1.4 6.54 1.5 7.00
230 0.3 5.43 0.7 5.58 1.0 5.82 1.2 6.15 1.3 6.54 1.3 7.00
235 0.3 5.43 0.6 5.58 0.9 5.82 1.1 6.15 1.2 6.54 1.1 7.00
240 0.3 5.43 0.6 5.58 0.8 5.82 0.9 6.15 1.0 6.54 0.9 7.00
245 0.3 5.43 0.5 5.58 0.7 5.82 0.8 6.15 0.9 6.54 0.8 7.00
16 180 0.6 5.43 1.2 5.58 1.7 5.82 2.1 6.15 2.4 6.54
185 0.6 5.43 1.1 5.58 1.6 5.82 2.0 6.15 2.3 6.54
190 0.6 5.43 1.1 5.58 1.5 5.82 1.9 6.15 2.1 6.54
195 0.5 5.43 1.0 5.58 1.5 5.82 1.8 6.15 2.0 6.54
200 0.5 5.43 1.0 5.58 1.4 5.82 1.7 6.15 1.8 6.54
205 0.5 5.43 0.9 5.58 1.3 5.82 1.5 6.15 1.7 6.54
210 0.4 5.43 0.9 5.58 1.2 5.82 1.4 6.15 1.5 6.54
215 0.4 5.43 0.8 5.58 1.1 5.82 1.3 6.15 1.4 6.54
220 0.4 5.43 0.7 5.58 1.0 5.82 1.2 6.15 1.2 6.54
225 0.4 5.43 0.7 5.58 0.9 5.82 1.1 6.15 1.1 6.54
230 0.3 5.43 0.6 5.58 0.8 5.82 1.0 6.15 1.0 6.54
235 0.3 5.43 0.6 5.58 0.8 5.82 0.8 6.15 0.8 6.54
240 0.3 5.43 0.5 5.58 0.7 5.82 0.7 6.15 0.7 6.54
245 0.2 5.43 0.5 5.58 0.6 5.82 0.6 6.15 0.5 6.54
20 180 0.6 5.43 1.1 5.58 1.5 5.82 1.8 6.15
185 0.6 5.43 1.0 5.58 1.4 5.82 1.7 6.15190 0.5 5.43 1.0 5.58 1.3 5.82 1.5 6.15
195 0.5 5.43 0.9 5.58 1.2 5.82 1.4 6.15
200 0.5 5.43 0.9 5.58 1.2 5.82 1.3 6.15
205 0.4 5.43 0.8 5.58 1.1 5.82 1.2 6.15
210 0.4 5.43 0.7 5.58 1.0 5.82 1.1 6.15
215 0.4 5.43 0.7 5.58 0.9 5.82 1.0 6.15
220 0.4 5.43 0.6 5.58 0.8 5.82 0.9 6.15
225 0.3 5.43 0.6 5.58 0.7 5.82 0.7 6.15
230 0.3 5.43 0.5 5.58 0.6 5.82 0.6 6.15
235 0.3 5.43 0.5 5.58 0.6 5.82 0.5 6.15
240 0.2 5.43 0.4 5.58 0.5 5.82 0.4 6.15
245 0.2 5.43 0.3 5.58 0.4 5.82 0.3 6.15

8/10/2019 n We a 2011 Norms Report
http://slidepdf.com/reader/full/n-we-a-2011-norms-report 230/268
214 | N W E A 2 0 1 1 R I T S c a l e N o r m s
Table C.38. Means (M) and Standard Deviations (sd) of Academic Growth by Starting RIT Score and Starting Instructi onal Week forVarious Ending Instructional Weeks - GENERAL SCIENCE, GRADE 9
Table C.38. Means (M) and Standard Deviations (sd ) of Academic Growth by Starting RIT Score and Starting Instructi onal Week for VariousEnding Instru ctional Weeks - GENERAL SCIENCE, GRADE 9
Ending Instruction al Weeks
Start Prior Grd Focal Grade
Inst. Start 36 4 8 12 16 20 24 28 32 36
Wk RIT M sd M sd M sd M sd M sd M sd M sd M sd M sd M sd
32(Gd 8)
180 0.1 5.43 0.2 5.58 0.4 5.82 0.6 6.14 0.9 6.53 1.2 6.98 1.6 7.48 2.0 8.01 2.3 8.57 2.7 9.16
1850.1 5.43 0.2 5.58 0.3 5.82 0.6 6.14 0.8 6.53 1.1 6.98 1.5 7.48 1.8 8.01 2.2 8.57 2.5 9.16190 0.0 5.43 0.1 5.58 0.3 5.82 0.5 6.14 0.7 6.53 1.0 6.98 1.3 7.48 1.7 8.01 2.0 8.57 2.3 9.16
195 0.0 5.43 0.1 5.58 0.2 5.82 0.4 6.14 0.6 6.53 0.9 6.98 1.2 7.48 1.5 8.01 1.8 8.57 2.1 9.16
200 0.0 5.43 0.0 5.58 0.2 5.82 0.3 6.14 0.5 6.53 0.8 6.98 1.1 7.47 1.3 8.01 1.6 8.57 1.9 9.16
205 0.0 5.43 0.0 5.58 0.1 5.82 0.3 6.14 0.4 6.53 0.7 6.98 0.9 7.47 1.2 8.01 1.5 8.57 1.8 9.16
210 -0.1 5.43 0.0 5.58 0.0 5.82 0.2 6.14 0.3 6.53 0.5 6.98 0.8 7.47 1.0 8.01 1.3 8.57 1.6 9.16
215 -0.1 5.43 -0.1 5.58 0.0 5.82 0.1 6.14 0.2 6.53 0.4 6.98 0.6 7.47 0.9 8.01 1.1 8.57 1.4 9.16
220 -0.1 5.43 -0.1 5.58 -0.1 5.82 0.0 6.14 0.1 6.53 0.3 6.98 0.5 7.47 0.7 8.01 0.9 8.57 1.2 9.16
225 -0.1 5.43 -0.2 5.58 -0.1 5.82 -0.1 6.14 0.1 6.53 0.2 6.98 0.4 7.47 0.6 8.01 0.8 8.57 1.0 9.16
230 -0.1 5.43 -0.2 5.58 -0.2 5.82 -0.1 6.14 -0.1 6.53 0.1 6.98 0.2 7.48 0.4 8.01 0.6 8.57 0.8 9.16
235 -0.2 5.43 -0.2 5.58 -0.3 5.82 -0.2 6.14 -0.2 6.53 0.0 6.98 0.1 7.48 0.3 8.01 0.4 8.57 0.6 9.16
240 -0.2 5.43 -0.3 5.58 -0.3 5.82 -0.3 6.14 -0.3 6.53 -0.2 6.98 0.0 7.48 0.1 8.01 0.2 8.57 0.4 9.16
245 -0.2 5.43 -0.3 5.58 -0.4 5.82 -0.4 6.14 -0.3 6.53 -0.3 6.98 -0.2 7.48 -0.1 8.01 0.1 8.57 0.2 9.16
250 -0.2 5.43 -0.3 5.58 -0.4 5.82 -0.5 6.14 -0.4 6.53 -0.4 6.98 -0.3 7.48 -0.2 8.01 -0.1 8.57 0.0 9.16
36(Gd 8)
180 0.1 5.43 0.3 5.58 0.6 5.82 0.9 6.14 1.2 6.53 1.5 6.98 1.9 7.48 2.3 8.01 2.7 8.57
185 0.1 5.43 0.3 5.58 0.5 5.82 0.8 6.14 1.1 6.53 1.4 6.98 1.8 7.48 2.1 8.01 2.5 8.57
190 0.1 5.43 0.3 5.58 0.5 5.82 0.7 6.14 1.0 6.53 1.3 6.98 1.6 7.48 2.0 8.01 2.3 8.57
195 0.1 5.43 0.2 5.58 0.4 5.82 0.6 6.14 0.9 6.53 1.2 6.98 1.5 7.48 1.8 8.01 2.1 8.57
200 0.1 5.43 0.2 5.58 0.3 5.82 0.5 6.14 0.8 6.53 1.1 6.98 1.4 7.47 1.7 8.01 2.0 8.57205 0.0 5.43 0.1 5.58 0.3 5.82 0.5 6.14 0.7 6.53 0.9 6.98 1.2 7.47 1.5 8.01 1.8 8.57
210 0.0 5.43 0.1 5.58 0.2 5.82 0.4 6.14 0.6 6.53 0.8 6.98 1.1 7.47 1.3 8.01 1.6 8.57
215 0.0 5.43 0.1 5.58 0.2 5.82 0.3 6.14 0.5 6.53 0.7 6.98 0.9 7.47 1.2 8.01 1.4 8.57
220 0.0 5.43 0.0 5.58 0.1 5.82 0.2 6.14 0.4 6.53 0.6 6.98 0.8 7.47 1.0 8.01 1.3 8.57
225 0.0 5.43 0.0 5.58 0.0 5.82 0.2 6.14 0.3 6.53 0.5 6.98 0.7 7.47 0.9 8.01 1.1 8.57
230 -0.1 5.43 -0.1 5.58 0.0 5.82 0.1 6.14 0.2 6.53 0.4 6.98 0.5 7.48 0.7 8.01 0.9 8.57
235 -0.1 5.43 -0.1 5.58 -0.1 5.82 0.0 6.14 0.1 6.53 0.2 6.98 0.4 7.48 0.6 8.01 0.7 8.57
240 -0.1 5.43 -0.1 5.58 -0.1 5.82 -0.1 6.14 0.0 6.53 0.1 6.98 0.3 7.48 0.4 8.01 0.6 8.57
245 -0.1 5.43 -0.2 5.58 -0.2 5.82 -0.2 6.14 -0.1 6.53 0.0 6.98 0.1 7.48 0.3 8.01 0.4 8.57
4 180 0.2 5.43 0.4 5.58 0.7 5.82 1.0 6.14 1.4 6.53 1.8 6.98 2.1 7.48 2.5 8.01
185 0.2 5.43 0.4 5.58 0.7 5.82 1.0 6.14 1.3 6.53 1.6 6.98 2.0 7.48 2.4 8.01
190 0.2 5.43 0.4 5.58 0.6 5.82 0.9 6.14 1.2 6.53 1.5 6.98 1.9 7.48 2.2 8.01

8/10/2019 n We a 2011 Norms Report
http://slidepdf.com/reader/full/n-we-a-2011-norms-report 231/268
N W E A 2 0 1 1 R I T S c a l e N o r m s | 215
Table C.38. Means (M) and Standard Deviations (sd ) of Academic Growth by Starting RIT Score and Starting Instructi onal Week for VariousEnding Instru ctional Weeks - GENERAL SCIENCE, GRADE 9
Ending Instruction al Weeks
Start Prior Grd Focal Grade
Inst. Start 36 4 8 12 16 20 24 28 32 36
Wk RIT M sd M sd M sd M sd M sd M sd M sd M sd M sd M sd
195 0.1 5.43 0.3 5.58 0.6 5.82 0.8 6.14 1.1 6.53 1.4 6.98 1.7 7.48 2.1 8.01
200 0.1 5.43 0.3 5.58 0.5 5.82 0.7 6.14 1.0 6.53 1.3 6.98 1.6 7.47 1.9 8.01
205 0.1 5.43 0.2 5.58 0.4 5.82 0.7 6.14 0.9 6.53 1.2 6.98 1.5 7.47 1.7 8.01
210 0.1 5.43 0.2 5.58 0.4 5.82 0.6 6.14 0.8 6.53 1.1 6.98 1.3 7.47 1.6 8.01
215 0.1 5.43 0.2 5.58 0.3 5.82 0.5 6.14 0.7 6.53 0.9 6.98 1.2 7.47 1.4 8.01
220 0.0 5.43 0.1 5.58 0.3 5.82 0.4 6.14 0.6 6.53 0.8 6.98 1.1 7.47 1.3 8.01
225 0.0 5.43 0.1 5.58 0.2 5.82 0.3 6.14 0.5 6.53 0.7 6.98 0.9 7.47 1.1 8.01
230 0.0 5.43 0.1 5.58 0.1 5.82 0.3 6.14 0.4 6.53 0.6 6.98 0.8 7.48 1.0 8.01
235 0.0 5.43 0.0 5.58 0.1 5.82 0.2 6.14 0.3 6.53 0.5 6.98 0.6 7.48 0.8 8.01
240 0.0 5.43 0.0 5.58 0.0 5.82 0.1 6.14 0.2 6.53 0.4 6.98 0.5 7.48 0.7 8.01
245 -0.1 5.43 -0.1 5.58 0.0 5.82 0.0 6.14 0.1 6.53 0.2 6.98 0.4 7.48 0.5 8.01
8 180 0.2 5.43 0.5 5.58 0.9 5.82 1.2 6.14 1.6 6.53 2.0 6.98 2.3 7.48
185 0.2 5.43 0.5 5.58 0.8 5.82 1.1 6.14 1.5 6.53 1.8 6.98 2.2 7.48
190 0.2 5.43 0.5 5.58 0.7 5.82 1.0 6.14 1.4 6.53 1.7 6.98 2.1 7.48
195 0.2 5.43 0.4 5.58 0.7 5.82 1.0 6.14 1.3 6.53 1.6 6.98 1.9 7.48
200 0.2 5.43 0.4 5.58 0.6 5.82 0.9 6.14 1.2 6.53 1.5 6.98 1.8 7.47
205 0.2 5.43 0.3 5.58 0.6 5.82 0.8 6.14 1.1 6.53 1.4 6.98 1.7 7.47
210 0.1 5.43 0.3 5.58 0.5 5.82 0.7 6.14 1.0 6.53 1.3 6.98 1.5 7.47
215 0.1 5.43 0.3 5.58 0.4 5.82 0.7 6.14 0.9 6.53 1.1 6.98 1.4 7.47
220 0.1 5.43 0.2 5.58 0.4 5.82 0.6 6.14 0.8 6.53 1.0 6.98 1.2 7.47
225 0.1 5.43 0.2 5.58 0.3 5.82 0.5 6.14 0.7 6.53 0.9 6.98 1.1 7.47
230 0.1 5.43 0.1 5.58 0.3 5.82 0.4 6.14 0.6 6.53 0.8 6.98 1.0 7.48235 0.0 5.43 0.1 5.58 0.2 5.82 0.3 6.14 0.5 6.53 0.7 6.98 0.8 7.48
240 0.0 5.43 0.1 5.58 0.2 5.82 0.3 6.14 0.4 6.53 0.6 6.98 0.7 7.48
245 0.0 5.43 0.0 5.58 0.1 5.82 0.2 6.14 0.3 6.53 0.4 6.98 0.6 7.48
12 180 0.3 5.43 0.6 5.58 1.0 5.82 1.3 6.14 1.7 6.53 2.1 6.98
185 0.3 5.43 0.6 5.58 0.9 5.82 1.3 6.14 1.6 6.53 2.0 6.98
190 0.3 5.43 0.5 5.58 0.8 5.82 1.2 6.14 1.5 6.53 1.9 6.98
195 0.2 5.43 0.5 5.58 0.8 5.82 1.1 6.14 1.4 6.53 1.7 6.98
200 0.2 5.43 0.5 5.58 0.7 5.82 1.0 6.14 1.3 6.53 1.6 6.98
205 0.2 5.43 0.4 5.58 0.7 5.82 0.9 6.14 1.2 6.53 1.5 6.98
210 0.2 5.43 0.4 5.58 0.6 5.82 0.9 6.14 1.1 6.53 1.4 6.98
215 0.2 5.43 0.3 5.58 0.6 5.82 0.8 6.14 1.0 6.53 1.3 6.98
220 0.1 5.43 0.3 5.58 0.5 5.82 0.7 6.14 0.9 6.53 1.2 6.98

8/10/2019 n We a 2011 Norms Report
http://slidepdf.com/reader/full/n-we-a-2011-norms-report 232/268
216 | N W E A 2 0 1 1 R I T S c a l e N o r m s
Table C.38. Means (M) and Standard Deviations (sd ) of Academic Growth by Starting RIT Score and Starting Instructi onal Week for VariousEnding Instru ctional Weeks - GENERAL SCIENCE, GRADE 9
Ending Instruction al Weeks
Start Prior Grd Focal Grade
Inst. Start 36 4 8 12 16 20 24 28 32 36
Wk RIT M sd M sd M sd M sd M sd M sd M sd M sd M sd M sd
225 0.1 5.43 0.3 5.58 0.4 5.82 0.6 6.14 0.8 6.53 1.0 6.98
230 0.1 5.43 0.2 5.58 0.4 5.82 0.6 6.14 0.7 6.53 0.9 6.98
235 0.1 5.43 0.2 5.58 0.3 5.82 0.5 6.14 0.6 6.53 0.8 6.98
240 0.1 5.43 0.1 5.58 0.3 5.82 0.4 6.14 0.5 6.53 0.7 6.98
245 0.0 5.43 0.1 5.58 0.2 5.82 0.3 6.14 0.4 6.53 0.6 6.98
250 0.0 5.43 0.1 5.58 0.1 5.82 0.2 6.14 0.3 6.53 0.5 6.98
16 180 0.3 5.43 0.7 5.58 1.0 5.82 1.4 6.14 1.8 6.53
185 0.3 5.43 0.6 5.58 1.0 5.82 1.3 6.14 1.7 6.53
190 0.3 5.43 0.6 5.58 0.9 5.82 1.3 6.14 1.6 6.53
195 0.3 5.43 0.6 5.58 0.9 5.82 1.2 6.14 1.5 6.53
200 0.2 5.43 0.5 5.58 0.8 5.82 1.1 6.14 1.4 6.53
205 0.2 5.43 0.5 5.58 0.8 5.82 1.0 6.14 1.3 6.53
210 0.2 5.43 0.4 5.58 0.7 5.82 1.0 6.14 1.2 6.53
215 0.2 5.43 0.4 5.58 0.6 5.82 0.9 6.14 1.1 6.53
220 0.2 5.43 0.4 5.58 0.6 5.82 0.8 6.14 1.0 6.53
225 0.2 5.43 0.3 5.58 0.5 5.82 0.7 6.14 0.9 6.53
230 0.1 5.43 0.3 5.58 0.5 5.82 0.6 6.14 0.8 6.53
235 0.1 5.43 0.2 5.58 0.4 5.82 0.6 6.14 0.7 6.53
240 0.1 5.43 0.2 5.58 0.3 5.82 0.5 6.14 0.6 6.53
245 0.1 5.43 0.2 5.58 0.3 5.82 0.4 6.14 0.5 6.53
250 0.1 5.43 0.1 5.58 0.2 5.82 0.3 6.14 0.4 6.53
20 180 0.4 5.43 0.7 5.58 1.1 5.82 1.5 6.14185 0.3 5.43 0.7 5.58 1.0 5.82 1.4 6.14
190 0.3 5.43 0.6 5.58 1.0 5.82 1.3 6.14
195 0.3 5.43 0.6 5.58 0.9 5.82 1.2 6.14
200 0.3 5.43 0.6 5.58 0.9 5.82 1.2 6.14
205 0.3 5.43 0.5 5.58 0.8 5.82 1.1 6.14
210 0.2 5.43 0.5 5.58 0.8 5.82 1.0 6.14
215 0.2 5.43 0.4 5.58 0.7 5.82 0.9 6.14
220 0.2 5.43 0.4 5.58 0.6 5.82 0.9 6.14
225 0.2 5.43 0.4 5.58 0.6 5.82 0.8 6.14
230 0.2 5.43 0.3 5.58 0.5 5.82 0.7 6.14
235 0.1 5.43 0.3 5.58 0.5 5.82 0.6 6.14
240 0.1 5.43 0.3 5.58 0.4 5.82 0.5 6.14

8/10/2019 n We a 2011 Norms Report
http://slidepdf.com/reader/full/n-we-a-2011-norms-report 233/268
N W E A 2 0 1 1 R I T S c a l e N o r m s | 217
Table C.38. Means (M) and Standard Deviations (sd ) of Academic Growth by Starting RIT Score and Starting Instructi onal Week for VariousEnding Instru ctional Weeks - GENERAL SCIENCE, GRADE 9
Ending Instruction al Weeks
Start Prior Grd Focal Grade
Inst. Start 36 4 8 12 16 20 24 28 32 36
Wk RIT M sd M sd M sd M sd M sd M sd M sd M sd M sd M sd
245 0.1 5.43 0.2 5.58 0.3 5.82 0.5 6.14
250 0.1 5.43 0.2 5.58 0.3 5.82 0.4 6.14

8/10/2019 n We a 2011 Norms Report
http://slidepdf.com/reader/full/n-we-a-2011-norms-report 234/268
218 | N W E A 2 0 1 1 R I T S c a l e N o r m s
Table C.39. Means (M) and Standard Deviations (sd) of Academic Growth by Starting RIT Score and Starting Instructi onal Week forVarious Ending Instructional Weeks - GENERAL SCIENCE, GRADE 10
Table C.39. Means (M) and Standard Deviations (sd) of Academic Growt h by Starti ng RIT Score and Startin g Instruc tional Week for Various EndingInstruct ional Weeks - GENERAL SCIENCE, GRADE 10
Ending Instruction al Weeks
Start Prior Grd Focal Grade
Inst. Start 36 4 8 12 16 20 24 28 32 36
Wk RIT M sd M sd M sd M sd M sd M sd M sd M sd M sd M sd
32(Gd 9)
180 0.4 5.44 0.8 5.65 1.3 5.98 1.9 6.41 2.4 6.93 3.0 7.51 3.5 8.14 4.1 8.82 4.6 9.52 5.0 10.26
1850.3 5.44 0.7 5.65 1.2 5.98 1.7 6.41 2.2 6.93 2.7 7.51 3.2 8.14 3.7 8.82 4.1 9.52 4.6 10.26190 0.3 5.44 0.7 5.65 1.1 5.98 1.5 6.41 1.9 6.93 2.4 7.51 2.9 8.14 3.3 8.82 3.7 9.52 4.1 10.26
195 0.3 5.44 0.6 5.65 0.9 5.98 1.3 6.41 1.7 6.93 2.1 7.51 2.5 8.14 2.9 8.82 3.3 9.52 3.6 10.26
200 0.2 5.44 0.5 5.65 0.8 5.98 1.1 6.41 1.5 6.93 1.8 7.51 2.2 8.14 2.6 8.82 2.9 9.52 3.1 10.26
205 0.2 5.44 0.4 5.65 0.6 5.98 0.9 6.41 1.2 6.93 1.6 7.51 1.9 8.14 2.2 8.82 2.4 9.52 2.7 10.26
210 0.1 5.44 0.3 5.65 0.5 5.98 0.7 6.41 1.0 6.92 1.3 7.51 1.5 8.14 1.8 8.82 2.0 9.52 2.2 10.26
215 0.1 5.44 0.2 5.65 0.3 5.98 0.5 6.41 0.8 6.92 1.0 7.51 1.2 8.14 1.4 8.82 1.6 9.52 1.7 10.26
220 0.0 5.44 0.1 5.65 0.2 5.98 0.3 6.41 0.5 6.92 0.7 7.51 0.9 8.14 1.0 8.82 1.2 9.52 1.2 10.26
225 0.0 5.44 0.0 5.65 0.1 5.98 0.2 6.41 0.3 6.93 0.4 7.51 0.5 8.14 0.7 8.82 0.7 9.52 0.8 10.26
230 -0.1 5.44 -0.1 5.65 -0.1 5.98 0.0 6.41 0.0 6.93 0.1 7.51 0.2 8.14 0.3 8.82 0.3 9.52 0.3 10.26
235 -0.1 5.44 -0.2 5.65 -0.2 5.98 -0.2 6.41 -0.2 6.93 -0.2 7.51 -0.1 8.14 -0.1 8.82 -0.1 9.52 -0.2 10.26
240 -0.2 5.44 -0.3 5.65 -0.4 5.98 -0.4 6.41 -0.4 6.93 -0.4 7.51 -0.5 8.14 -0.5 8.82 -0.5 9.52 -0.7 10.26
245 -0.2 5.44 -0.4 5.65 -0.5 5.98 -0.6 6.41 -0.7 6.93 -0.7 7.51 -0.8 8.14 -0.9 8.82 -1.0 9.52 -1.1 10.26
250 -0.3 5.44 -0.5 5.65 -0.7 5.98 -0.8 6.41 -0.9 6.93 -1.0 7.51 -1.1 8.14 -1.2 8.82 -1.4 9.52 -1.6 10.26
36(Gd 9)
180 0.5 5.44 0.9 5.65 1.5 5.98 2.0 6.41 2.6 6.93 3.1 7.51 3.7 8.14 4.2 8.82 4.6 9.52
185 0.4 5.44 0.9 5.65 1.3 5.98 1.8 6.41 2.4 6.93 2.9 7.51 3.3 8.14 3.8 8.82 4.2 9.52
190 0.4 5.44 0.8 5.65 1.2 5.98 1.6 6.41 2.1 6.93 2.6 7.51 3.0 8.14 3.4 8.82 3.8 9.52
195 0.3 5.44 0.7 5.65 1.1 5.98 1.5 6.41 1.9 6.93 2.3 7.51 2.7 8.14 3.0 8.82 3.4 9.52
200 0.3 5.44 0.6 5.65 0.9 5.98 1.3 6.41 1.6 6.93 2.0 7.51 2.4 8.14 2.7 8.82 2.9 9.52205 0.2 5.44 0.5 5.65 0.8 5.98 1.1 6.41 1.4 6.93 1.7 7.51 2.0 8.14 2.3 8.82 2.5 9.52
210 0.2 5.44 0.4 5.65 0.6 5.98 0.9 6.41 1.2 6.92 1.4 7.51 1.7 8.14 1.9 8.82 2.1 9.52
215 0.1 5.44 0.3 5.65 0.5 5.98 0.7 6.41 0.9 6.92 1.2 7.51 1.4 8.14 1.5 8.82 1.7 9.52
220 0.1 5.44 0.2 5.65 0.3 5.98 0.5 6.41 0.7 6.92 0.9 7.51 1.0 8.14 1.2 8.82 1.2 9.52
225 0.0 5.44 0.1 5.65 0.2 5.98 0.3 6.41 0.5 6.92 0.6 7.51 0.7 8.14 0.8 8.82 0.8 9.52
230 0.0 5.44 0.0 5.65 0.1 5.98 0.1 6.41 0.2 6.93 0.3 7.51 0.4 8.14 0.4 8.82 0.4 9.52
235 -0.1 5.44 -0.1 5.65 -0.1 5.98 -0.1 6.41 0.0 6.93 0.0 7.51 0.0 8.14 0.0 8.82 0.0 9.52
240 -0.1 5.44 -0.2 5.65 -0.2 5.98 -0.3 6.41 -0.3 6.93 -0.3 7.51 -0.3 8.14 -0.4 8.82 -0.5 9.52
245 -0.2 5.44 -0.3 5.65 -0.4 5.98 -0.4 6.41 -0.5 6.93 -0.6 7.51 -0.6 8.14 -0.7 8.82 -0.9 9.52
250 -0.2 5.44 -0.4 5.65 -0.5 5.98 -0.6 6.41 -0.7 6.93 -0.8 7.51 -1.0 8.14 -1.1 8.82 -1.3 9.52
4 180 0.5 5.44 1.0 5.65 1.6 5.98 2.1 6.41 2.7 6.93 3.2 7.51 3.7 8.14 4.2 8.82
185 0.5 5.44 0.9 5.65 1.4 5.98 1.9 6.41 2.5 6.93 2.9 7.51 3.4 8.14 3.8 8.82

8/10/2019 n We a 2011 Norms Report
http://slidepdf.com/reader/full/n-we-a-2011-norms-report 235/268
N W E A 2 0 1 1 R I T S c a l e N o r m s | 219
Table C.39. Means (M) and Standard Deviations (sd) of Academic Growt h by Starti ng RIT Score and Startin g Instruc tional Week for Various EndingInstruct ional Weeks - GENERAL SCIENCE, GRADE 10
Ending Instruction al Weeks
Start Prior Grd Focal Grade
Inst. Start 36 4 8 12 16 20 24 28 32 36
Wk RIT M sd M sd M sd M sd M sd M sd M sd M sd M sd M sd
190 0.4 5.44 0.8 5.65 1.3 5.98 1.8 6.41 2.2 6.93 2.7 7.51 3.1 8.14 3.4 8.82
195 0.4 5.44 0.7 5.65 1.2 5.98 1.6 6.41 2.0 6.93 2.4 7.51 2.7 8.14 3.1 8.82
200 0.3 5.44 0.7 5.65 1.0 5.98 1.4 6.41 1.7 6.93 2.1 7.51 2.4 8.14 2.7 8.82
205 0.3 5.44 0.6 5.65 0.9 5.98 1.2 6.41 1.5 6.93 1.8 7.51 2.1 8.14 2.3 8.82
210 0.2 5.44 0.5 5.65 0.7 5.98 1.0 6.41 1.3 6.92 1.5 7.51 1.7 8.14 1.9 8.82
215 0.2 5.44 0.4 5.65 0.6 5.98 0.8 6.41 1.0 6.92 1.2 7.51 1.4 8.14 1.5 8.82
220 0.1 5.44 0.3 5.65 0.4 5.98 0.6 6.41 0.8 6.92 1.0 7.51 1.1 8.14 1.2 8.82
225 0.1 5.44 0.2 5.65 0.3 5.98 0.4 6.41 0.6 6.92 0.7 7.51 0.8 8.14 0.8 8.82
230 0.0 5.44 0.1 5.65 0.2 5.98 0.2 6.41 0.3 6.93 0.4 7.51 0.4 8.14 0.4 8.82
235 0.0 5.44 0.0 5.65 0.0 5.98 0.1 6.41 0.1 6.93 0.1 7.51 0.1 8.14 0.0 8.82
240 -0.1 5.44 -0.1 5.65 -0.1 5.98 -0.1 6.41 -0.2 6.93 -0.2 7.51 -0.2 8.14 -0.4 8.82
245 -0.1 5.44 -0.2 5.65 -0.3 5.98 -0.3 6.41 -0.4 6.93 -0.5 7.51 -0.6 8.14 -0.7 8.82
250 -0.2 5.44 -0.3 5.65 -0.4 5.98 -0.5 6.41 -0.6 6.93 -0.8 7.51 -0.9 8.14 -1.1 8.82
8 180 0.5 5.44 1.1 5.65 1.6 5.98 2.2 6.41 2.7 6.93 3.2 7.51 3.7 8.14
185 0.5 5.44 1.0 5.65 1.5 5.98 2.0 6.41 2.5 6.93 3.0 7.51 3.4 8.14
190 0.4 5.44 0.9 5.65 1.4 5.98 1.8 6.41 2.3 6.93 2.7 7.51 3.0 8.14
195 0.4 5.44 0.8 5.65 1.2 5.98 1.6 6.41 2.0 6.93 2.4 7.51 2.7 8.14
200 0.3 5.44 0.7 5.65 1.1 5.98 1.4 6.41 1.8 6.93 2.1 7.51 2.4 8.14
205 0.3 5.44 0.6 5.65 0.9 5.98 1.3 6.41 1.6 6.93 1.8 7.51 2.0 8.14
210 0.3 5.44 0.5 5.65 0.8 5.98 1.1 6.41 1.3 6.92 1.5 7.51 1.7 8.14
215 0.2 5.44 0.4 5.65 0.7 5.98 0.9 6.41 1.1 6.92 1.3 7.51 1.4 8.14
220 0.2 5.44 0.3 5.65 0.5 5.98 0.7 6.41 0.8 6.92 1.0 7.51 1.1 8.14225 0.1 5.44 0.2 5.65 0.4 5.98 0.5 6.41 0.6 6.92 0.7 7.51 0.7 8.14
230 0.1 5.44 0.1 5.65 0.2 5.98 0.3 6.41 0.4 6.93 0.4 7.51 0.4 8.14
235 0.0 5.44 0.0 5.65 0.1 5.98 0.1 6.41 0.1 6.93 0.1 7.51 0.1 8.14
240 0.0 5.44 -0.1 5.65 -0.1 5.98 -0.1 6.41 -0.1 6.93 -0.2 7.51 -0.3 8.14
245 -0.1 5.44 -0.2 5.65 -0.2 5.98 -0.3 6.41 -0.4 6.93 -0.5 7.51 -0.6 8.14
250 -0.1 5.44 -0.2 5.65 -0.4 5.98 -0.5 6.41 -0.6 6.93 -0.7 7.51 -0.9 8.14
12 180 0.6 5.44 1.1 5.65 1.7 5.98 2.2 6.41 2.7 6.93 3.2 7.51
185 0.5 5.44 1.0 5.65 1.5 5.98 2.0 6.41 2.5 6.93 2.9 7.51
190 0.5 5.44 0.9 5.65 1.4 5.98 1.8 6.41 2.2 6.93 2.6 7.51
195 0.4 5.44 0.8 5.65 1.2 5.98 1.6 6.41 2.0 6.93 2.3 7.51
200 0.4 5.44 0.7 5.65 1.1 5.98 1.4 6.41 1.8 6.93 2.0 7.51
205 0.3 5.44 0.6 5.65 1.0 5.98 1.3 6.41 1.5 6.93 1.8 7.51

8/10/2019 n We a 2011 Norms Report
http://slidepdf.com/reader/full/n-we-a-2011-norms-report 236/268
220 | N W E A 2 0 1 1 R I T S c a l e N o r m s
Table C.39. Means (M) and Standard Deviations (sd) of Academic Growt h by Starti ng RIT Score and Startin g Instruc tional Week for Various EndingInstruct ional Weeks - GENERAL SCIENCE, GRADE 10
Ending Instruction al Weeks
Start Prior Grd Focal Grade
Inst. Start 36 4 8 12 16 20 24 28 32 36
Wk RIT M sd M sd M sd M sd M sd M sd M sd M sd M sd M sd
210 0.3 5.44 0.5 5.65 0.8 5.98 1.1 6.41 1.3 6.92 1.5 7.51
215 0.2 5.44 0.5 5.65 0.7 5.98 0.9 6.41 1.1 6.92 1.2 7.51
220 0.2 5.44 0.4 5.65 0.5 5.98 0.7 6.41 0.8 6.92 0.9 7.51
225 0.1 5.44 0.3 5.65 0.4 5.98 0.5 6.41 0.6 6.92 0.6 7.51
230 0.1 5.44 0.2 5.65 0.2 5.98 0.3 6.41 0.3 6.93 0.3 7.51
235 0.0 5.44 0.1 5.65 0.1 5.98 0.1 6.41 0.1 6.93 0.1 7.51
240 0.0 5.44 0.0 5.65 0.0 5.98 -0.1 6.41 -0.1 6.93 -0.2 7.51
245 -0.1 5.44 -0.1 5.65 -0.2 5.98 -0.3 6.41 -0.4 6.93 -0.5 7.51
250 -0.1 5.44 -0.2 5.65 -0.3 5.98 -0.5 6.41 -0.6 6.93 -0.8 7.51
16 180 0.6 5.44 1.1 5.65 1.7 5.98 2.2 6.41 2.6 6.93
185 0.5 5.44 1.0 5.65 1.5 5.98 2.0 6.41 2.4 6.93
190 0.5 5.44 0.9 5.65 1.4 5.98 1.8 6.41 2.1 6.93
195 0.4 5.44 0.8 5.65 1.2 5.98 1.6 6.41 1.9 6.93
200 0.4 5.44 0.7 5.65 1.1 5.98 1.4 6.41 1.7 6.93
205 0.3 5.44 0.6 5.65 0.9 5.98 1.2 6.41 1.4 6.93
210 0.3 5.44 0.6 5.65 0.8 5.98 1.0 6.41 1.2 6.92
215 0.2 5.44 0.5 5.65 0.7 5.98 0.8 6.41 1.0 6.92
220 0.2 5.44 0.4 5.65 0.5 5.98 0.6 6.41 0.7 6.92
225 0.1 5.44 0.3 5.65 0.4 5.98 0.5 6.41 0.5 6.93
230 0.1 5.44 0.2 5.65 0.2 5.98 0.3 6.41 0.3 6.93
235 0.0 5.44 0.1 5.65 0.1 5.98 0.1 6.41 0.0 6.93
240 0.0 5.44 0.0 5.65 -0.1 5.98 -0.1 6.41 -0.2 6.93245 -0.1 5.44 -0.1 5.65 -0.2 5.98 -0.3 6.41 -0.5 6.93
250 -0.1 5.44 -0.2 5.65 -0.3 5.98 -0.5 6.41 -0.7 6.93
20 180 0.6 5.44 1.1 5.65 1.6 5.98 2.1 6.41
185 0.5 5.44 1.0 5.65 1.5 5.98 1.9 6.41
190 0.5 5.44 0.9 5.65 1.3 5.98 1.7 6.41
195 0.4 5.44 0.8 5.65 1.2 5.98 1.5 6.41
200 0.4 5.44 0.7 5.65 1.0 5.98 1.3 6.41
205 0.3 5.44 0.6 5.65 0.9 5.98 1.1 6.41
210 0.3 5.44 0.5 5.65 0.7 5.98 0.9 6.41
215 0.2 5.44 0.4 5.65 0.6 5.98 0.7 6.41
220 0.2 5.44 0.3 5.65 0.5 5.98 0.5 6.41
225 0.1 5.44 0.2 5.65 0.3 5.98 0.4 6.41

8/10/2019 n We a 2011 Norms Report
http://slidepdf.com/reader/full/n-we-a-2011-norms-report 237/268
N W E A 2 0 1 1 R I T S c a l e N o r m s | 221
Table C.39. Means (M) and Standard Deviations (sd) of Academic Growt h by Starti ng RIT Score and Startin g Instruc tional Week for Various EndingInstruct ional Weeks - GENERAL SCIENCE, GRADE 10
Ending Instruction al Weeks
Start Prior Grd Focal Grade
Inst. Start 36 4 8 12 16 20 24 28 32 36
Wk RIT M sd M sd M sd M sd M sd M sd M sd M sd M sd M sd
230 0.1 5.44 0.1 5.65 0.2 5.98 0.2 6.41
235 0.0 5.44 0.1 5.65 0.0 5.98 0.0 6.41
240 0.0 5.44 0.0 5.65 -0.1 5.98 -0.2 6.41
245 -0.1 5.44 -0.1 5.65 -0.3 5.98 -0.4 6.41
250 -0.1 5.44 -0.2 5.65 -0.4 5.98 -0.6 6.41

8/10/2019 n We a 2011 Norms Report
http://slidepdf.com/reader/full/n-we-a-2011-norms-report 238/268
222 | N W E A 2 0 1 1 R I T S c a l e N o r m s
Table C.40. Means (M) and Standard Deviations (sd) o f Academic Growth by Starting RIT Score and Starting Instruc tional Week forVarious Ending Inst ruc tional Weeks - SCIENCE CONCEPTS & PROCESSES, GRADE 3
Table C.40. Means (M) and Standard Deviations (sd ) of Academic Growth by Starting RIT Score and Starting Instr ucti onal Week forVarious Ending Instructi onal Weeks - SCIENCE CONCEPTS & PROCESSES, GRADE 3
Ending Instruction al Weeks
Start Prior Grd Focal Grade
Inst. Start 36 4 8 12 16 20 24 28 32 36
Wk RIT M sd M sd M sd M sd M sd M sd M sd M sd M sd M sd
32(Gd 2)
155 1.3 5.40 2.9 5.49 4.6 5.63 6.3 5.83 8.1 6.07 9.9 6.35 11.6 6.67 13.1 7.01 14.5 7.39 15.5 7.79
1601.2 5.40 2.7 5.49 4.3 5.63 5.9 5.83 7.6 6.07 9.3 6.35 10.9 6.67 12.3 7.01 13.5 7.39 14.5 7.79165 1.1 5.40 2.5 5.49 4.0 5.63 5.5 5.83 7.1 6.07 8.7 6.35 10.2 6.67 11.5 7.01 12.6 7.39 13.5 7.79
170 1.0 5.40 2.3 5.49 3.6 5.63 5.1 5.83 6.6 6.07 8.1 6.35 9.4 6.67 10.7 7.01 11.7 7.39 12.4 7.78
175 0.9 5.40 2.1 5.49 3.3 5.63 4.7 5.83 6.1 6.07 7.4 6.35 8.7 6.67 9.8 7.01 10.8 7.39 11.4 7.78
180 0.8 5.40 1.9 5.49 3.0 5.63 4.3 5.83 5.6 6.07 6.8 6.35 8.0 6.67 9.0 7.01 9.8 7.39 10.4 7.78
185 0.7 5.40 1.6 5.49 2.7 5.63 3.9 5.83 5.1 6.07 6.2 6.35 7.3 6.67 8.2 7.01 8.9 7.39 9.4 7.78
190 0.6 5.40 1.4 5.49 2.4 5.63 3.5 5.83 4.5 6.07 5.6 6.35 6.6 6.67 7.4 7.01 8.0 7.39 8.3 7.78
195 0.5 5.40 1.2 5.49 2.1 5.63 3.1 5.83 4.0 6.07 5.0 6.35 5.8 6.67 6.6 7.01 7.1 7.39 7.3 7.78
200 0.4 5.40 1.0 5.49 1.8 5.63 2.6 5.83 3.5 6.07 4.4 6.35 5.1 6.67 5.7 7.01 6.1 7.39 6.3 7.78
205 0.3 5.40 0.8 5.49 1.5 5.63 2.2 5.83 3.0 6.07 3.7 6.35 4.4 6.67 4.9 7.01 5.2 7.39 5.3 7.78
210 0.2 5.40 0.6 5.49 1.2 5.63 1.8 5.83 2.5 6.07 3.1 6.35 3.7 6.67 4.1 7.01 4.3 7.39 4.2 7.79
215 0.1 5.40 0.4 5.49 0.9 5.63 1.4 5.83 2.0 6.07 2.5 6.35 3.0 6.67 3.3 7.01 3.4 7.39 3.2 7.79
36(Gd 2)
155 1.5 5.40 3.2 5.49 5.0 5.63 6.8 5.83 8.6 6.07 10.3 6.35 11.8 6.67 13.1 7.01 14.2 7.39
160 1.4 5.40 3.0 5.49 4.7 5.63 6.4 5.83 8.1 6.07 9.6 6.35 11.1 6.67 12.3 7.01 13.3 7.39
165 1.3 5.40 2.8 5.49 4.4 5.63 6.0 5.83 7.5 6.07 9.0 6.35 10.4 6.67 11.5 7.01 12.3 7.39
170 1.2 5.40 2.6 5.49 4.1 5.63 5.6 5.83 7.0 6.07 8.4 6.35 9.6 6.67 10.7 7.01 11.4 7.39
175 1.1 5.40 2.4 5.49 3.8 5.63 5.2 5.83 6.5 6.07 7.8 6.35 8.9 6.67 9.8 7.01 10.5 7.39
180 1.0 5.40 2.2 5.49 3.5 5.63 4.7 5.83 6.0 6.07 7.2 6.35 8.2 6.67 9.0 7.01 9.6 7.39
185 0.9 5.40 2.0 5.49 3.2 5.63 4.3 5.83 5.5 6.07 6.6 6.35 7.5 6.67 8.2 7.01 8.6 7.39190 0.8 5.40 1.8 5.49 2.8 5.63 3.9 5.83 5.0 6.07 5.9 6.35 6.8 6.67 7.4 7.01 7.7 7.39
195 0.7 5.40 1.6 5.49 2.5 5.63 3.5 5.83 4.5 6.07 5.3 6.35 6.0 6.67 6.5 7.01 6.8 7.39
200 0.6 5.40 1.4 5.49 2.2 5.63 3.1 5.83 4.0 6.07 4.7 6.35 5.3 6.67 5.7 7.01 5.9 7.39
205 0.5 5.40 1.2 5.49 1.9 5.63 2.7 5.83 3.4 6.07 4.1 6.35 4.6 6.67 4.9 7.01 4.9 7.39
210 0.4 5.40 1.0 5.49 1.6 5.63 2.3 5.83 2.9 6.07 3.5 6.35 3.9 6.67 4.1 7.01 4.0 7.39
215 0.3 5.40 0.8 5.49 1.3 5.63 1.9 5.83 2.4 6.07 2.9 6.35 3.2 6.67 3.3 7.01 3.1 7.39
4 160 1.6 5.40 3.3 5.49 5.0 5.63 6.6 5.83 8.2 6.07 9.6 6.35 10.9 6.67 11.8 7.01
165 1.5 5.40 3.1 5.49 4.6 5.63 6.2 5.83 7.7 6.07 9.0 6.35 10.1 6.67 11.0 7.01
170 1.4 5.40 2.8 5.49 4.3 5.63 5.8 5.83 7.2 6.07 8.4 6.35 9.4 6.67 10.2 7.01
175 1.3 5.40 2.6 5.49 4.0 5.63 5.4 5.83 6.7 6.07 7.8 6.35 8.7 6.67 9.4 7.01
180 1.2 5.40 2.4 5.49 3.7 5.63 5.0 5.83 6.1 6.07 7.2 6.35 8.0 6.67 8.5 7.01
185 1.1 5.40 2.2 5.49 3.4 5.63 4.6 5.83 5.6 6.07 6.6 6.35 7.3 6.66 7.7 7.01

8/10/2019 n We a 2011 Norms Report
http://slidepdf.com/reader/full/n-we-a-2011-norms-report 239/268
N W E A 2 0 1 1 R I T S c a l e N o r m s | 223
Table C.40. Means (M) and Standard Deviations (sd ) of Academic Growth by Starting RIT Score and Starting Instr ucti onal Week forVarious Ending Instructi onal Weeks - SCIENCE CONCEPTS & PROCESSES, GRADE 3
Ending Instruction al Weeks
Start Prior Grd Focal Grade
Inst. Start 36 4 8 12 16 20 24 28 32 36
Wk RIT M sd M sd M sd M sd M sd M sd M sd M sd M sd M sd
190 1.0 5.40 2.0 5.49 3.1 5.63 4.2 5.83 5.1 6.07 5.9 6.35 6.5 6.66 6.9 7.01
195 0.9 5.40 1.8 5.49 2.8 5.63 3.7 5.83 4.6 6.07 5.3 6.35 5.8 6.67 6.1 7.01
200 0.8 5.40 1.6 5.49 2.5 5.63 3.3 5.83 4.1 6.07 4.7 6.35 5.1 6.67 5.3 7.01
205 0.7 5.40 1.4 5.49 2.2 5.63 2.9 5.83 3.6 6.07 4.1 6.35 4.4 6.67 4.4 7.01
210 0.6 5.40 1.2 5.49 1.9 5.63 2.5 5.83 3.1 6.07 3.5 6.35 3.7 6.67 3.6 7.01
215 0.5 5.40 1.0 5.49 1.6 5.63 2.1 5.83 2.6 6.07 2.9 6.35 3.0 6.67 2.8 7.01
220 0.4 5.40 0.8 5.49 1.3 5.63 1.7 5.83 2.0 6.07 2.2 6.35 2.2 6.67 2.0 7.01
8 160 1.7 5.40 3.4 5.49 5.0 5.63 6.6 5.83 8.1 6.07 9.3 6.35 10.2 6.67
165 1.6 5.40 3.2 5.49 4.7 5.63 6.2 5.83 7.5 6.07 8.7 6.35 9.5 6.67
170 1.5 5.40 3.0 5.49 4.4 5.63 5.8 5.83 7.0 6.07 8.0 6.35 8.8 6.67
175 1.4 5.40 2.8 5.49 4.1 5.63 5.4 5.83 6.5 6.07 7.4 6.35 8.1 6.67
180 1.3 5.40 2.6 5.49 3.8 5.63 5.0 5.83 6.0 6.07 6.8 6.35 7.4 6.67
185 1.2 5.40 2.3 5.49 3.5 5.63 4.6 5.83 5.5 6.07 6.2 6.35 6.7 6.66
190 1.1 5.40 2.1 5.49 3.2 5.63 4.2 5.83 5.0 6.07 5.6 6.35 5.9 6.66
195 1.0 5.40 1.9 5.49 2.9 5.63 3.7 5.83 4.5 6.07 5.0 6.35 5.2 6.66
200 0.9 5.40 1.7 5.49 2.6 5.63 3.3 5.83 3.9 6.07 4.3 6.35 4.5 6.67
205 0.7 5.40 1.5 5.49 2.3 5.63 2.9 5.83 3.4 6.07 3.7 6.35 3.8 6.67
210 0.6 5.40 1.3 5.49 2.0 5.63 2.5 5.83 2.9 6.07 3.1 6.35 3.1 6.67
215 0.5 5.40 1.1 5.49 1.6 5.63 2.1 5.83 2.4 6.07 2.5 6.35 2.3 6.67
220 0.4 5.40 0.9 5.49 1.3 5.63 1.7 5.83 1.9 6.07 1.9 6.35 1.6 6.67
12 160 1.7 5.40 3.4 5.49 5.0 5.63 6.4 5.83 7.6 6.07 8.6 6.35
165 1.6 5.40 3.2 5.49 4.6 5.63 6.0 5.83 7.1 6.07 8.0 6.35170 1.5 5.40 3.0 5.49 4.3 5.63 5.6 5.83 6.6 6.07 7.3 6.35
175 1.4 5.40 2.8 5.49 4.0 5.63 5.2 5.83 6.1 6.07 6.7 6.35
180 1.3 5.40 2.5 5.49 3.7 5.63 4.7 5.83 5.6 6.07 6.1 6.35
185 1.2 5.40 2.3 5.49 3.4 5.63 4.3 5.83 5.0 6.07 5.5 6.35
190 1.1 5.40 2.1 5.49 3.1 5.63 3.9 5.83 4.5 6.07 4.9 6.35
195 1.0 5.40 1.9 5.49 2.8 5.63 3.5 5.83 4.0 6.07 4.3 6.35
200 0.9 5.40 1.7 5.49 2.5 5.63 3.1 5.83 3.5 6.07 3.6 6.35
205 0.8 5.40 1.5 5.49 2.2 5.63 2.7 5.83 3.0 6.07 3.0 6.35
210 0.7 5.40 1.3 5.49 1.9 5.63 2.3 5.83 2.5 6.07 2.4 6.35
215 0.6 5.40 1.1 5.49 1.6 5.63 1.9 5.83 2.0 6.07 1.8 6.35
220 0.5 5.40 0.9 5.49 1.3 5.63 1.5 5.83 1.4 6.07 1.2 6.35
16 165 1.6 5.40 3.0 5.49 4.4 5.63 5.5 5.83 6.4 6.07

8/10/2019 n We a 2011 Norms Report
http://slidepdf.com/reader/full/n-we-a-2011-norms-report 240/268
224 | N W E A 2 0 1 1 R I T S c a l e N o r m s
Table C.40. Means (M) and Standard Deviations (sd ) of Academic Growth by Starting RIT Score and Starting Instr ucti onal Week forVarious Ending Instructi onal Weeks - SCIENCE CONCEPTS & PROCESSES, GRADE 3
Ending Instruction al Weeks
Start Prior Grd Focal Grade
Inst. Start 36 4 8 12 16 20 24 28 32 36
Wk RIT M sd M sd M sd M sd M sd M sd M sd M sd M sd M sd
170 1.5 5.40 2.8 5.49 4.1 5.63 5.1 5.83 5.9 6.07
175 1.4 5.40 2.6 5.49 3.8 5.63 4.7 5.83 5.3 6.07
180 1.3 5.40 2.4 5.49 3.5 5.63 4.3 5.83 4.8 6.07
185 1.2 5.40 2.2 5.49 3.1 5.63 3.9 5.83 4.3 6.07
190 1.1 5.40 2.0 5.49 2.8 5.63 3.4 5.83 3.8 6.07
195 1.0 5.40 1.8 5.49 2.5 5.63 3.0 5.83 3.3 6.07
200 0.9 5.40 1.6 5.49 2.2 5.63 2.6 5.83 2.8 6.07
205 0.7 5.40 1.4 5.49 1.9 5.63 2.2 5.83 2.3 6.07
210 0.6 5.40 1.2 5.49 1.6 5.63 1.8 5.83 1.7 6.07
215 0.5 5.40 1.0 5.49 1.3 5.63 1.4 5.83 1.2 6.07
220 0.4 5.40 0.8 5.49 1.0 5.63 1.0 5.83 0.7 6.07
20 165 1.5 5.40 2.8 5.49 3.9 5.63 4.8 5.83
170 1.4 5.40 2.6 5.49 3.6 5.63 4.4 5.83
175 1.3 5.40 2.4 5.49 3.3 5.63 4.0 5.83
180 1.2 5.40 2.2 5.49 3.0 5.63 3.6 5.83
185 1.1 5.40 2.0 5.49 2.7 5.63 3.2 5.83
190 1.0 5.40 1.8 5.49 2.4 5.63 2.7 5.83
195 0.9 5.40 1.6 5.49 2.1 5.63 2.3 5.83
200 0.8 5.40 1.4 5.49 1.8 5.63 1.9 5.83
205 0.7 5.40 1.2 5.49 1.5 5.63 1.5 5.83
210 0.6 5.40 1.0 5.49 1.2 5.63 1.1 5.83
215 0.5 5.40 0.8 5.49 0.9 5.63 0.7 5.83220 0.4 5.40 0.6 5.49 0.5 5.63 0.3 5.83

8/10/2019 n We a 2011 Norms Report
http://slidepdf.com/reader/full/n-we-a-2011-norms-report 241/268
N W E A 2 0 1 1 R I T S c a l e N o r m s | 225
Table C.41. Means (M) and Standard Deviations (sd) o f Academic Growth by Starting RIT Score and Starting Instruc tional Week forVarious Ending Inst ruct ional Weeks - SCIENCE CONCEPTS & PROCESSES, GRADE 4
Table C.41. Means (M) and Standard Deviations (sd) of Academic Grow th by Starting RIT Score and Starting Inst ruct ional Week forVarious Ending Instru ctional Weeks - SCIENCE CONCEPTS & PROCESSES, GRADE 4
Ending Instruction al Weeks
Start Prior Grd Focal Grade
Inst. Start 36 4 8 12 16 20 24 28 32 36
Wk RIT M sd M sd M sd M sd M sd M sd M sd M sd M sd M sd
32(Gd 3)
165 0.9 5.40 1.8 5.47 2.8 5.59 3.8 5.76 4.9 5.97 5.9 6.21 6.9 6.48 7.9 6.79 8.8 7.12 9.6 7.47
1700.8 5.40 1.7 5.47 2.6 5.59 3.6 5.76 4.6 5.97 5.6 6.21 6.6 6.48 7.5 6.79 8.3 7.12 9.1 7.47175 0.7 5.40 1.6 5.47 2.5 5.59 3.4 5.76 4.3 5.97 5.3 6.21 6.2 6.48 7.0 6.79 7.8 7.12 8.5 7.47
180 0.7 5.40 1.5 5.47 2.3 5.59 3.2 5.76 4.1 5.97 5.0 6.21 5.8 6.48 6.6 6.79 7.3 7.12 8.0 7.47
185 0.6 5.40 1.4 5.47 2.1 5.59 3.0 5.76 3.8 5.97 4.6 6.21 5.4 6.48 6.2 6.79 6.9 7.12 7.4 7.46
190 0.6 5.40 1.2 5.47 2.0 5.59 2.7 5.76 3.5 5.97 4.3 6.21 5.1 6.48 5.7 6.79 6.4 7.12 6.9 7.46
195 0.5 5.40 1.1 5.47 1.8 5.59 2.5 5.76 3.3 5.97 4.0 6.21 4.7 6.48 5.3 6.79 5.9 7.11 6.3 7.46
200 0.5 5.40 1.0 5.47 1.7 5.59 2.3 5.76 3.0 5.97 3.7 6.21 4.3 6.48 4.9 6.79 5.4 7.12 5.8 7.46
205 0.4 5.40 0.9 5.47 1.5 5.59 2.1 5.76 2.7 5.97 3.3 6.21 3.9 6.48 4.4 6.79 4.9 7.12 5.3 7.46
210 0.4 5.40 0.8 5.47 1.3 5.59 1.9 5.76 2.4 5.97 3.0 6.21 3.5 6.48 4.0 6.79 4.4 7.12 4.7 7.47
215 0.3 5.40 0.7 5.47 1.2 5.59 1.7 5.76 2.2 5.97 2.7 6.21 3.2 6.48 3.6 6.79 3.9 7.12 4.2 7.47
220 0.3 5.40 0.6 5.47 1.0 5.59 1.4 5.76 1.9 5.97 2.4 6.21 2.8 6.48 3.1 6.79 3.4 7.12 3.6 7.47
225 0.2 5.40 0.5 5.47 0.8 5.59 1.2 5.76 1.6 5.97 2.0 6.21 2.4 6.48 2.7 6.79 3.0 7.12 3.1 7.47
36(Gd 3)
165 0.9 5.40 1.9 5.47 3.0 5.59 4.0 5.76 5.1 5.97 6.1 6.21 7.1 6.48 8.0 6.79 8.7 7.12
170 0.9 5.40 1.8 5.47 2.8 5.59 3.8 5.76 4.8 5.97 5.8 6.21 6.7 6.48 7.5 6.79 8.3 7.12
175 0.8 5.40 1.7 5.47 2.7 5.59 3.6 5.76 4.5 5.97 5.4 6.21 6.3 6.48 7.1 6.79 7.8 7.12
180 0.8 5.40 1.6 5.47 2.5 5.59 3.4 5.76 4.3 5.97 5.1 6.21 5.9 6.48 6.7 6.79 7.3 7.12
185 0.7 5.40 1.5 5.47 2.3 5.59 3.2 5.76 4.0 5.97 4.8 6.21 5.5 6.48 6.2 6.79 6.8 7.12
190 0.7 5.40 1.4 5.47 2.2 5.59 2.9 5.76 3.7 5.97 4.5 6.21 5.2 6.48 5.8 6.79 6.3 7.12
195 0.6 5.40 1.3 5.47 2.0 5.59 2.7 5.76 3.5 5.97 4.1 6.21 4.8 6.48 5.4 6.79 5.8 7.11200 0.6 5.40 1.2 5.47 1.8 5.59 2.5 5.76 3.2 5.97 3.8 6.21 4.4 6.48 4.9 6.79 5.3 7.11
205 0.5 5.40 1.1 5.47 1.7 5.59 2.3 5.76 2.9 5.97 3.5 6.21 4.0 6.48 4.5 6.79 4.8 7.12
210 0.5 5.40 1.0 5.47 1.5 5.59 2.1 5.76 2.6 5.97 3.2 6.21 3.7 6.48 4.1 6.79 4.4 7.12
215 0.4 5.40 0.9 5.47 1.4 5.59 1.9 5.76 2.4 5.97 2.8 6.21 3.3 6.48 3.6 6.79 3.9 7.12
220 0.3 5.40 0.7 5.47 1.2 5.59 1.6 5.76 2.1 5.97 2.5 6.21 2.9 6.48 3.2 6.79 3.4 7.12
225 0.3 5.40 0.6 5.47 1.0 5.59 1.4 5.76 1.8 5.97 2.2 6.21 2.5 6.48 2.8 6.79 2.9 7.12
4 165 1.0 5.40 2.0 5.47 3.1 5.59 4.1 5.76 5.2 5.97 6.1 6.21 7.0 6.48 7.8 6.79
170 0.9 5.40 1.9 5.47 2.9 5.59 3.9 5.76 4.9 5.97 5.8 6.21 6.6 6.48 7.4 6.79
175 0.9 5.40 1.8 5.47 2.8 5.59 3.7 5.76 4.6 5.97 5.5 6.21 6.3 6.48 6.9 6.79
180 0.8 5.40 1.7 5.47 2.6 5.59 3.5 5.76 4.3 5.97 5.2 6.21 5.9 6.48 6.5 6.79
185 0.8 5.40 1.6 5.47 2.4 5.59 3.3 5.76 4.1 5.97 4.8 6.21 5.5 6.48 6.1 6.79
190 0.7 5.40 1.5 5.47 2.3 5.59 3.1 5.76 3.8 5.97 4.5 6.21 5.1 6.48 5.6 6.79

8/10/2019 n We a 2011 Norms Report
http://slidepdf.com/reader/full/n-we-a-2011-norms-report 242/268
226 | N W E A 2 0 1 1 R I T S c a l e N o r m s
Table C.41. Means (M) and Standard Deviations (sd) of Academic Grow th by Starting RIT Score and Starting Inst ruct ional Week forVarious Ending Instru ctional Weeks - SCIENCE CONCEPTS & PROCESSES, GRADE 4
Ending Instruction al Weeks
Start Prior Grd Focal Grade
Inst. Start 36 4 8 12 16 20 24 28 32 36
Wk RIT M sd M sd M sd M sd M sd M sd M sd M sd M sd M sd
195 0.7 5.40 1.4 5.47 2.1 5.59 2.8 5.76 3.5 5.97 4.2 6.21 4.7 6.48 5.2 6.79
200 0.6 5.40 1.3 5.47 2.0 5.59 2.6 5.76 3.3 5.97 3.9 6.21 4.4 6.48 4.8 6.79
205 0.6 5.40 1.2 5.47 1.8 5.59 2.4 5.76 3.0 5.97 3.5 6.21 4.0 6.48 4.3 6.79
210 0.5 5.40 1.1 5.47 1.6 5.59 2.2 5.76 2.7 5.97 3.2 6.21 3.6 6.48 3.9 6.79
215 0.5 5.40 1.0 5.47 1.5 5.59 2.0 5.76 2.5 5.97 2.9 6.21 3.2 6.48 3.5 6.79
220 0.4 5.40 0.8 5.47 1.3 5.59 1.8 5.76 2.2 5.97 2.6 6.21 2.8 6.48 3.0 6.79
225 0.4 5.40 0.7 5.47 1.1 5.59 1.5 5.76 1.9 5.97 2.2 6.21 2.5 6.48 2.6 6.79
8 165 1.0 5.40 2.1 5.47 3.1 5.59 4.2 5.76 5.1 5.97 6.0 6.21 6.8 6.48
170 1.0 5.40 2.0 5.47 3.0 5.59 3.9 5.76 4.9 5.97 5.7 6.21 6.4 6.48
175 0.9 5.40 1.9 5.47 2.8 5.59 3.7 5.76 4.6 5.97 5.4 6.21 6.1 6.48
180 0.9 5.40 1.8 5.47 2.7 5.59 3.5 5.76 4.3 5.97 5.0 6.21 5.7 6.48
185 0.8 5.40 1.7 5.47 2.5 5.59 3.3 5.76 4.0 5.97 4.7 6.21 5.3 6.48
190 0.8 5.40 1.6 5.47 2.3 5.59 3.1 5.76 3.8 5.97 4.4 6.21 4.9 6.48
195 0.7 5.40 1.4 5.47 2.2 5.59 2.9 5.76 3.5 5.97 4.1 6.21 4.5 6.48
200 0.7 5.40 1.3 5.47 2.0 5.59 2.6 5.76 3.2 5.97 3.7 6.21 4.2 6.48
205 0.6 5.40 1.2 5.47 1.8 5.59 2.4 5.76 3.0 5.97 3.4 6.21 3.8 6.48
210 0.6 5.40 1.1 5.47 1.7 5.59 2.2 5.76 2.7 5.97 3.1 6.21 3.4 6.48
215 0.5 5.40 1.0 5.47 1.5 5.59 2.0 5.76 2.4 5.97 2.8 6.21 3.0 6.48
220 0.4 5.40 0.9 5.47 1.4 5.59 1.8 5.76 2.2 5.97 2.4 6.21 2.6 6.48
225 0.4 5.40 0.8 5.47 1.2 5.59 1.6 5.76 1.9 5.97 2.1 6.21 2.3 6.48
12 170 1.0 5.40 2.0 5.47 3.0 5.59 3.9 5.76 4.7 5.97 5.5 6.21
175 1.0 5.40 1.9 5.47 2.8 5.59 3.7 5.76 4.4 5.97 5.1 6.21180 0.9 5.40 1.8 5.47 2.6 5.59 3.4 5.76 4.2 5.97 4.8 6.21
185 0.8 5.40 1.7 5.47 2.5 5.59 3.2 5.76 3.9 5.97 4.5 6.21
190 0.8 5.40 1.6 5.47 2.3 5.59 3.0 5.76 3.6 5.97 4.2 6.21
195 0.7 5.40 1.5 5.47 2.2 5.59 2.8 5.76 3.4 5.97 3.8 6.21
200 0.7 5.40 1.3 5.47 2.0 5.59 2.6 5.76 3.1 5.97 3.5 6.21
205 0.6 5.40 1.2 5.47 1.8 5.59 2.4 5.76 2.8 5.97 3.2 6.21
210 0.6 5.40 1.1 5.47 1.7 5.59 2.1 5.76 2.5 5.97 2.9 6.21
215 0.5 5.40 1.0 5.47 1.5 5.59 1.9 5.76 2.3 5.97 2.5 6.21
220 0.5 5.40 0.9 5.47 1.3 5.59 1.7 5.76 2.0 5.97 2.2 6.21
225 0.4 5.40 0.8 5.47 1.2 5.59 1.5 5.76 1.7 5.97 1.9 6.21
16 170 1.0 5.40 2.0 5.47 2.9 5.59 3.7 5.76 4.5 5.97
175 0.9 5.40 1.9 5.47 2.7 5.59 3.5 5.76 4.2 5.97

8/10/2019 n We a 2011 Norms Report
http://slidepdf.com/reader/full/n-we-a-2011-norms-report 243/268
N W E A 2 0 1 1 R I T S c a l e N o r m s | 227
Table C.41. Means (M) and Standard Deviations (sd) of Academic Grow th by Starting RIT Score and Starting Inst ruct ional Week forVarious Ending Instru ctional Weeks - SCIENCE CONCEPTS & PROCESSES, GRADE 4
Ending Instruction al Weeks
Start Prior Grd Focal Grade
Inst. Start 36 4 8 12 16 20 24 28 32 36
Wk RIT M sd M sd M sd M sd M sd M sd M sd M sd M sd M sd
180 0.9 5.40 1.7 5.47 2.6 5.59 3.3 5.76 3.9 5.97
185 0.8 5.40 1.6 5.47 2.4 5.59 3.1 5.76 3.6 5.97
190 0.8 5.40 1.5 5.47 2.2 5.59 2.8 5.76 3.4 5.97
195 0.7 5.40 1.4 5.47 2.1 5.59 2.6 5.76 3.1 5.97
200 0.7 5.40 1.3 5.47 1.9 5.59 2.4 5.76 2.8 5.97
205 0.6 5.40 1.2 5.47 1.7 5.59 2.2 5.76 2.6 5.97
210 0.6 5.40 1.1 5.47 1.6 5.59 2.0 5.76 2.3 5.97
215 0.5 5.40 1.0 5.47 1.4 5.59 1.8 5.76 2.0 5.97
220 0.5 5.40 0.9 5.47 1.3 5.59 1.5 5.76 1.7 5.97
225 0.4 5.40 0.8 5.47 1.1 5.59 1.3 5.76 1.5 5.97
20 170 1.0 5.40 1.9 5.47 2.7 5.59 3.5 5.76
175 0.9 5.40 1.8 5.47 2.6 5.59 3.2 5.76
180 0.9 5.40 1.7 5.47 2.4 5.59 3.0 5.76
185 0.8 5.40 1.6 5.47 2.2 5.59 2.8 5.76
190 0.8 5.40 1.4 5.47 2.1 5.59 2.6 5.76
195 0.7 5.40 1.3 5.47 1.9 5.59 2.4 5.76
200 0.6 5.40 1.2 5.47 1.7 5.59 2.2 5.76
205 0.6 5.40 1.1 5.47 1.6 5.59 1.9 5.76
210 0.5 5.40 1.0 5.47 1.4 5.59 1.7 5.76
215 0.5 5.40 0.9 5.47 1.3 5.59 1.5 5.76
220 0.4 5.40 0.8 5.47 1.1 5.59 1.3 5.76
225 0.4 5.40 0.7 5.47 0.9 5.59 1.1 5.76

8/10/2019 n We a 2011 Norms Report
http://slidepdf.com/reader/full/n-we-a-2011-norms-report 244/268
228 | N W E A 2 0 1 1 R I T S c a l e N o r m s
Table C.42. Means (M) and Standard Deviations (sd) o f Academic Growth by Starting RIT Score and Starting Instru ctional Week forVarious Ending Inst ruct ional Weeks - SCIENCE CONCEPTS & PROCESSES, GRADE 5
Table C.42. Means (M) and Standard Deviations (sd) of Academic Grow th by Starting RIT Score and Starting Inst ruct ional Week forVarious Ending Instru ctional Weeks - SCIENCE CONCEPTS & PROCESSES, GRADE 5
Ending Instruction al Weeks
Start Prior Grd Focal Grade
Inst. Start 36 4 8 12 16 20 24 28 32 36
Wk RIT M sd M sd M sd M sd M sd M sd M sd M sd M sd M sd
32(Gd 4)
170 0.7 5.40 1.4 5.49 2.2 5.63 3.0 5.83 3.8 6.07 4.5 6.35 5.2 6.66 5.8 7.01 6.3 7.38 6.7 7.78
1750.7 5.40 1.4 5.49 2.1 5.63 2.9 5.83 3.6 6.07 4.4 6.35 5.0 6.66 5.6 7.01 6.1 7.38 6.4 7.78180 0.6 5.40 1.3 5.49 2.1 5.63 2.8 5.83 3.5 6.07 4.2 6.35 4.9 6.66 5.4 7.01 5.9 7.38 6.2 7.78
185 0.6 5.40 1.3 5.49 2.0 5.63 2.7 5.83 3.4 6.07 4.1 6.35 4.7 6.66 5.2 7.01 5.6 7.38 5.9 7.78
190 0.6 5.40 1.2 5.49 1.9 5.63 2.6 5.83 3.3 6.07 3.9 6.35 4.5 6.66 5.0 7.01 5.4 7.38 5.7 7.78
195 0.6 5.40 1.2 5.49 1.8 5.63 2.5 5.83 3.2 6.06 3.8 6.35 4.3 6.66 4.8 7.01 5.2 7.38 5.4 7.78
200 0.5 5.40 1.1 5.49 1.8 5.63 2.4 5.83 3.0 6.06 3.6 6.35 4.2 6.66 4.6 7.01 5.0 7.38 5.2 7.78
205 0.5 5.40 1.1 5.49 1.7 5.63 2.3 5.83 2.9 6.06 3.5 6.35 4.0 6.66 4.4 7.01 4.8 7.38 5.0 7.78
210 0.5 5.40 1.0 5.49 1.6 5.63 2.2 5.83 2.8 6.06 3.3 6.35 3.8 6.66 4.2 7.01 4.5 7.38 4.7 7.78
215 0.5 5.40 1.0 5.49 1.5 5.63 2.1 5.83 2.7 6.07 3.2 6.35 3.7 6.66 4.0 7.01 4.3 7.38 4.5 7.78
220 0.4 5.40 0.9 5.49 1.5 5.63 2.0 5.83 2.5 6.07 3.0 6.35 3.5 6.66 3.8 7.01 4.1 7.38 4.2 7.78
225 0.4 5.40 0.9 5.49 1.4 5.63 1.9 5.83 2.4 6.07 2.9 6.35 3.3 6.66 3.6 7.01 3.9 7.38 4.0 7.78
230 0.4 5.40 0.8 5.49 1.3 5.63 1.8 5.83 2.3 6.07 2.7 6.35 3.1 6.66 3.4 7.01 3.6 7.38 3.7 7.78
36(Gd 4)
170 0.7 5.40 1.5 5.49 2.3 5.63 3.1 5.83 3.8 6.07 4.5 6.35 5.1 6.66 5.6 7.01 6.0 7.38
175 0.7 5.40 1.5 5.49 2.2 5.63 3.0 5.83 3.7 6.07 4.4 6.35 5.0 6.66 5.4 7.01 5.8 7.38
180 0.7 5.40 1.4 5.49 2.2 5.63 2.9 5.83 3.6 6.07 4.2 6.35 4.8 6.66 5.2 7.01 5.6 7.38
185 0.7 5.40 1.4 5.49 2.1 5.63 2.8 5.83 3.5 6.07 4.1 6.35 4.6 6.66 5.0 7.01 5.3 7.38
190 0.6 5.40 1.3 5.49 2.0 5.63 2.7 5.83 3.3 6.06 3.9 6.35 4.4 6.66 4.8 7.01 5.1 7.38
195 0.6 5.40 1.3 5.49 1.9 5.63 2.6 5.83 3.2 6.06 3.8 6.35 4.3 6.66 4.7 7.01 4.9 7.38
200 0.6 5.40 1.2 5.49 1.9 5.63 2.5 5.83 3.1 6.06 3.6 6.35 4.1 6.66 4.5 7.01 4.7 7.38205 0.6 5.40 1.2 5.49 1.8 5.63 2.4 5.83 3.0 6.06 3.5 6.35 3.9 6.66 4.3 7.01 4.5 7.38
210 0.5 5.40 1.1 5.49 1.7 5.63 2.3 5.83 2.9 6.06 3.3 6.35 3.8 6.66 4.1 7.01 4.2 7.38
215 0.5 5.40 1.1 5.49 1.6 5.63 2.2 5.83 2.7 6.07 3.2 6.35 3.6 6.66 3.9 7.01 4.0 7.38
220 0.5 5.40 1.0 5.49 1.6 5.63 2.1 5.83 2.6 6.07 3.1 6.35 3.4 6.66 3.7 7.01 3.8 7.38
225 0.5 5.40 1.0 5.49 1.5 5.63 2.0 5.83 2.5 6.07 2.9 6.35 3.2 6.66 3.5 7.01 3.6 7.38
230 0.4 5.40 0.9 5.49 1.4 5.63 1.9 5.83 2.4 6.07 2.8 6.35 3.1 6.66 3.3 7.01 3.3 7.38
4 170 0.8 5.40 1.6 5.49 2.4 5.63 3.1 5.83 3.8 6.07 4.4 6.35 4.9 6.66 5.3 7.01
175 0.8 5.40 1.5 5.49 2.3 5.63 3.0 5.83 3.7 6.07 4.3 6.35 4.7 6.66 5.1 7.01
180 0.7 5.40 1.5 5.49 2.2 5.63 2.9 5.83 3.5 6.07 4.1 6.35 4.6 6.66 4.9 7.01
185 0.7 5.40 1.4 5.49 2.1 5.63 2.8 5.83 3.4 6.07 4.0 6.35 4.4 6.66 4.7 7.01
190 0.7 5.40 1.4 5.49 2.1 5.63 2.7 5.83 3.3 6.06 3.8 6.35 4.2 6.66 4.5 7.01
195 0.7 5.40 1.3 5.49 2.0 5.63 2.6 5.83 3.2 6.06 3.7 6.35 4.0 6.66 4.3 7.01

8/10/2019 n We a 2011 Norms Report
http://slidepdf.com/reader/full/n-we-a-2011-norms-report 245/268
N W E A 2 0 1 1 R I T S c a l e N o r m s | 229
Table C.42. Means (M) and Standard Deviations (sd) of Academic Grow th by Starting RIT Score and Starting Inst ruct ional Week forVarious Ending Instru ctional Weeks - SCIENCE CONCEPTS & PROCESSES, GRADE 5
Ending Instruction al Weeks
Start Prior Grd Focal Grade
Inst. Start 36 4 8 12 16 20 24 28 32 36
Wk RIT M sd M sd M sd M sd M sd M sd M sd M sd M sd M sd
200 0.6 5.40 1.3 5.49 1.9 5.63 2.5 5.83 3.1 6.06 3.5 6.35 3.9 6.66 4.1 7.01
205 0.6 5.40 1.2 5.49 1.8 5.63 2.4 5.83 2.9 6.06 3.4 6.35 3.7 6.66 3.9 7.01
210 0.6 5.40 1.2 5.49 1.8 5.63 2.3 5.83 2.8 6.06 3.2 6.35 3.5 6.66 3.7 7.01
215 0.6 5.40 1.1 5.49 1.7 5.63 2.2 5.83 2.7 6.07 3.1 6.35 3.3 6.66 3.5 7.01
220 0.5 5.40 1.1 5.49 1.6 5.63 2.1 5.83 2.6 6.07 2.9 6.35 3.2 6.66 3.3 7.01
225 0.5 5.40 1.0 5.49 1.5 5.63 2.0 5.83 2.4 6.07 2.8 6.35 3.0 6.66 3.1 7.01
230 0.5 5.40 1.0 5.49 1.5 5.63 1.9 5.83 2.3 6.07 2.6 6.35 2.8 6.66 2.9 7.01
8 175 0.8 5.40 1.5 5.49 2.3 5.63 2.9 5.83 3.5 6.07 4.0 6.35 4.3 6.66
180 0.7 5.40 1.5 5.49 2.2 5.63 2.8 5.83 3.4 6.07 3.8 6.35 4.1 6.66
185 0.7 5.40 1.4 5.49 2.1 5.63 2.7 5.83 3.3 6.07 3.7 6.35 4.0 6.66
190 0.7 5.40 1.4 5.49 2.0 5.63 2.6 5.83 3.1 6.06 3.5 6.35 3.8 6.66
195 0.7 5.40 1.3 5.49 2.0 5.63 2.5 5.83 3.0 6.06 3.4 6.35 3.6 6.66
200 0.6 5.40 1.3 5.49 1.9 5.63 2.4 5.83 2.9 6.06 3.2 6.35 3.5 6.66
205 0.6 5.40 1.2 5.49 1.8 5.63 2.3 5.83 2.8 6.06 3.1 6.35 3.3 6.66
210 0.6 5.40 1.2 5.49 1.7 5.63 2.2 5.83 2.6 6.06 2.9 6.35 3.1 6.66
215 0.6 5.40 1.1 5.49 1.7 5.63 2.1 5.83 2.5 6.07 2.8 6.35 2.9 6.66
220 0.5 5.40 1.1 5.49 1.6 5.63 2.0 5.83 2.4 6.07 2.6 6.35 2.8 6.66
225 0.5 5.40 1.0 5.49 1.5 5.63 1.9 5.83 2.3 6.07 2.5 6.35 2.6 6.66
230 0.5 5.40 1.0 5.49 1.4 5.63 1.8 5.83 2.1 6.07 2.3 6.35 2.4 6.66
12 175 0.8 5.40 1.5 5.49 2.1 5.63 2.7 5.83 3.2 6.07 3.6 6.35
180 0.7 5.40 1.4 5.49 2.1 5.63 2.6 5.83 3.1 6.07 3.4 6.35
185 0.7 5.40 1.4 5.49 2.0 5.63 2.5 5.83 3.0 6.07 3.3 6.35190 0.7 5.40 1.3 5.49 1.9 5.63 2.4 5.83 2.8 6.06 3.1 6.35
195 0.7 5.40 1.3 5.49 1.9 5.63 2.3 5.83 2.7 6.06 3.0 6.35
200 0.6 5.40 1.2 5.49 1.8 5.63 2.2 5.83 2.6 6.06 2.8 6.35
205 0.6 5.40 1.2 5.49 1.7 5.63 2.1 5.83 2.5 6.06 2.7 6.35
210 0.6 5.40 1.1 5.49 1.6 5.63 2.0 5.83 2.3 6.06 2.5 6.35
215 0.6 5.40 1.1 5.49 1.6 5.63 1.9 5.83 2.2 6.06 2.4 6.35
220 0.5 5.40 1.0 5.49 1.5 5.63 1.8 5.83 2.1 6.07 2.2 6.35
225 0.5 5.40 1.0 5.49 1.4 5.63 1.7 5.83 2.0 6.07 2.1 6.35
230 0.5 5.40 0.9 5.49 1.3 5.63 1.6 5.83 1.8 6.07 1.9 6.35
16 175 0.7 5.40 1.4 5.49 2.0 5.63 2.4 5.83 2.8 6.07
180 0.7 5.40 1.3 5.49 1.9 5.63 2.4 5.83 2.7 6.07
185 0.7 5.40 1.3 5.49 1.8 5.63 2.3 5.83 2.5 6.07

8/10/2019 n We a 2011 Norms Report
http://slidepdf.com/reader/full/n-we-a-2011-norms-report 246/268
230 | N W E A 2 0 1 1 R I T S c a l e N o r m s
Table C.42. Means (M) and Standard Deviations (sd) of Academic Grow th by Starting RIT Score and Starting Inst ruct ional Week forVarious Ending Instru ctional Weeks - SCIENCE CONCEPTS & PROCESSES, GRADE 5
Ending Instruction al Weeks
Start Prior Grd Focal Grade
Inst. Start 36 4 8 12 16 20 24 28 32 36
Wk RIT M sd M sd M sd M sd M sd M sd M sd M sd M sd M sd
190 0.7 5.40 1.2 5.49 1.8 5.63 2.2 5.83 2.4 6.06
195 0.6 5.40 1.2 5.49 1.7 5.63 2.1 5.83 2.3 6.06
200 0.6 5.40 1.1 5.49 1.6 5.63 2.0 5.83 2.2 6.06
205 0.6 5.40 1.1 5.49 1.5 5.63 1.9 5.83 2.1 6.06
210 0.6 5.40 1.0 5.49 1.5 5.63 1.8 5.83 1.9 6.06
215 0.5 5.40 1.0 5.49 1.4 5.63 1.7 5.83 1.8 6.07
220 0.5 5.40 0.9 5.49 1.3 5.63 1.6 5.83 1.7 6.07
225 0.5 5.40 0.9 5.49 1.2 5.63 1.5 5.83 1.6 6.07
230 0.5 5.40 0.8 5.49 1.2 5.63 1.4 5.83 1.4 6.07
20 175 0.7 5.40 1.3 5.49 1.7 5.63 2.1 5.83
180 0.6 5.40 1.2 5.49 1.7 5.63 2.0 5.83
185 0.6 5.40 1.2 5.49 1.6 5.63 1.9 5.83
190 0.6 5.40 1.1 5.49 1.5 5.63 1.8 5.83
195 0.6 5.40 1.1 5.49 1.4 5.63 1.7 5.83
200 0.5 5.40 1.0 5.49 1.4 5.63 1.6 5.83
205 0.5 5.40 1.0 5.49 1.3 5.63 1.5 5.83
210 0.5 5.40 0.9 5.49 1.2 5.63 1.4 5.83
215 0.5 5.40 0.9 5.49 1.1 5.63 1.3 5.83
220 0.4 5.40 0.8 5.49 1.1 5.63 1.2 5.83
225 0.4 5.40 0.8 5.49 1.0 5.63 1.1 5.83
230 0.4 5.40 0.7 5.49 0.9 5.63 1.0 5.83

8/10/2019 n We a 2011 Norms Report
http://slidepdf.com/reader/full/n-we-a-2011-norms-report 247/268
N W E A 2 0 1 1 R I T S c a l e N o r m s | 231
Table C.43. Means (M) and Standard Deviations (sd) o f Academic Growth by Starting RIT Score and Starting Instru ctional Week forVarious Ending Inst ruc tional Weeks - SCIENCE CONCEPTS & PROCESSES, GRADE 6
Table C.43. Means (M) and Standard Deviations (sd) of Academic Grow th by Starting RIT Score and Starting Inst ruct ional Week forVarious Ending Instru ctional Weeks - SCIENCE CONCEPTS & PROCESSES, GRADE 6
Ending Instruction al Weeks
Start Prior Grd Focal Grade
Inst. Start 36 4 8 12 16 20 24 28 32 36
Wk RIT M sd M sd M sd M sd M sd M sd M sd M sd M sd M sd
32(Gd 5)
175 0.5 5.41 1.0 5.50 1.7 5.65 2.3 5.86 3.0 6.12 3.7 6.42 4.3 6.76 5.0 7.13 5.6 7.52 6.1 7.94
1800.4 5.41 1.0 5.50 1.5 5.65 2.2 5.86 2.8 6.12 3.4 6.42 4.1 6.76 4.6 7.13 5.2 7.52 5.7 7.94185 0.4 5.41 0.9 5.50 1.4 5.65 2.0 5.86 2.6 6.12 3.2 6.42 3.8 6.76 4.3 7.12 4.8 7.52 5.2 7.94
190 0.4 5.41 0.8 5.50 1.3 5.65 1.8 5.86 2.4 6.12 2.9 6.42 3.5 6.76 4.0 7.12 4.4 7.52 4.8 7.94
195 0.3 5.41 0.7 5.50 1.2 5.65 1.6 5.86 2.2 6.12 2.7 6.42 3.2 6.76 3.6 7.12 4.0 7.52 4.4 7.94
200 0.3 5.41 0.6 5.50 1.0 5.65 1.5 5.86 1.9 6.12 2.4 6.42 2.9 6.76 3.3 7.12 3.7 7.52 4.0 7.94
205 0.2 5.41 0.5 5.50 0.9 5.65 1.3 5.86 1.7 6.12 2.2 6.42 2.6 6.76 3.0 7.12 3.3 7.52 3.6 7.94
210 0.2 5.41 0.5 5.50 0.8 5.65 1.1 5.86 1.5 6.12 1.9 6.42 2.3 6.76 2.6 7.12 2.9 7.52 3.1 7.94
215 0.1 5.41 0.4 5.50 0.6 5.65 1.0 5.86 1.3 6.12 1.7 6.42 2.0 6.76 2.3 7.12 2.5 7.52 2.7 7.94
220 0.1 5.41 0.3 5.50 0.5 5.65 0.8 5.86 1.1 6.12 1.4 6.42 1.7 6.76 1.9 7.12 2.1 7.52 2.3 7.94
225 0.1 5.41 0.2 5.50 0.4 5.65 0.6 5.86 0.9 6.12 1.1 6.42 1.4 6.76 1.6 7.12 1.8 7.52 1.9 7.94
230 0.0 5.41 0.1 5.50 0.3 5.65 0.5 5.86 0.7 6.12 0.9 6.42 1.1 6.76 1.3 7.13 1.4 7.52 1.4 7.94
235 0.0 5.41 0.0 5.50 0.1 5.65 0.3 5.86 0.5 6.12 0.6 6.42 0.8 6.76 0.9 7.13 1.0 7.52 1.0 7.94
36(Gd 5)
175 0.6 5.41 1.2 5.50 1.8 5.65 2.5 5.86 3.2 6.12 3.9 6.42 4.5 6.76 5.1 7.13 5.6 7.52
180 0.5 5.41 1.1 5.50 1.7 5.65 2.3 5.86 3.0 6.12 3.6 6.42 4.2 6.76 4.8 7.13 5.2 7.52
185 0.5 5.41 1.0 5.50 1.6 5.65 2.2 5.86 2.8 6.12 3.4 6.42 3.9 6.76 4.4 7.12 4.8 7.52
190 0.4 5.41 0.9 5.50 1.5 5.65 2.0 5.86 2.6 6.12 3.1 6.42 3.6 6.76 4.1 7.12 4.5 7.52
195 0.4 5.41 0.8 5.50 1.3 5.65 1.8 5.86 2.4 6.12 2.9 6.42 3.3 6.76 3.7 7.12 4.1 7.52
200 0.4 5.41 0.8 5.50 1.2 5.65 1.7 5.86 2.1 6.12 2.6 6.42 3.0 6.76 3.4 7.12 3.7 7.52
205 0.3 5.41 0.7 5.50 1.1 5.65 1.5 5.86 1.9 6.12 2.3 6.42 2.7 6.76 3.1 7.12 3.3 7.52210 0.3 5.41 0.6 5.50 0.9 5.65 1.3 5.86 1.7 6.12 2.1 6.42 2.4 6.76 2.7 7.12 2.9 7.52
215 0.2 5.41 0.5 5.50 0.8 5.65 1.2 5.86 1.5 6.12 1.8 6.42 2.1 6.76 2.4 7.12 2.6 7.52
220 0.2 5.41 0.4 5.50 0.7 5.65 1.0 5.86 1.3 6.12 1.6 6.42 1.8 6.76 2.0 7.12 2.2 7.52
225 0.1 5.41 0.3 5.50 0.6 5.65 0.8 5.86 1.1 6.12 1.3 6.42 1.5 6.76 1.7 7.12 1.8 7.52
230 0.1 5.41 0.2 5.50 0.4 5.65 0.7 5.86 0.9 6.12 1.1 6.42 1.2 6.76 1.4 7.13 1.4 7.52
235 0.1 5.41 0.2 5.50 0.3 5.65 0.5 5.86 0.7 6.12 0.8 6.42 1.0 6.76 1.0 7.13 1.0 7.52
4 175 0.6 5.41 1.3 5.50 2.0 5.65 2.6 5.86 3.3 6.12 3.9 6.42 4.5 6.76 5.1 7.13
180 0.6 5.41 1.2 5.50 1.8 5.65 2.5 5.86 3.1 6.12 3.7 6.42 4.2 6.76 4.7 7.13
185 0.5 5.41 1.1 5.50 1.7 5.65 2.3 5.86 2.9 6.12 3.4 6.42 3.9 6.76 4.4 7.12
190 0.5 5.41 1.0 5.50 1.6 5.65 2.1 5.86 2.7 6.12 3.2 6.42 3.6 6.76 4.0 7.12
195 0.5 5.41 0.9 5.50 1.4 5.65 2.0 5.86 2.5 6.12 2.9 6.42 3.3 6.76 3.7 7.12
200 0.4 5.41 0.9 5.50 1.3 5.65 1.8 5.86 2.3 6.12 2.7 6.42 3.1 6.76 3.4 7.12

8/10/2019 n We a 2011 Norms Report
http://slidepdf.com/reader/full/n-we-a-2011-norms-report 248/268
232 | N W E A 2 0 1 1 R I T S c a l e N o r m s
Table C.43. Means (M) and Standard Deviations (sd) of Academic Grow th by Starting RIT Score and Starting Inst ruct ional Week forVarious Ending Instru ctional Weeks - SCIENCE CONCEPTS & PROCESSES, GRADE 6
Ending Instruction al Weeks
Start Prior Grd Focal Grade
Inst. Start 36 4 8 12 16 20 24 28 32 36
Wk RIT M sd M sd M sd M sd M sd M sd M sd M sd M sd M sd
205 0.4 5.41 0.8 5.50 1.2 5.65 1.6 5.86 2.0 6.12 2.4 6.42 2.8 6.76 3.0 7.12
210 0.3 5.41 0.7 5.50 1.1 5.65 1.5 5.86 1.8 6.12 2.2 6.42 2.5 6.76 2.7 7.12
215 0.3 5.41 0.6 5.50 0.9 5.65 1.3 5.86 1.6 6.12 1.9 6.42 2.2 6.76 2.3 7.12
220 0.2 5.41 0.5 5.50 0.8 5.65 1.1 5.86 1.4 6.12 1.7 6.42 1.9 6.76 2.0 7.12
225 0.2 5.41 0.4 5.50 0.7 5.65 0.9 5.86 1.2 6.12 1.4 6.42 1.6 6.76 1.7 7.12
230 0.2 5.41 0.3 5.50 0.6 5.65 0.8 5.86 1.0 6.12 1.2 6.42 1.3 6.76 1.3 7.13
235 0.1 5.41 0.3 5.50 0.4 5.65 0.6 5.86 0.8 6.12 0.9 6.42 1.0 6.76 1.0 7.13
8 175 0.7 5.41 1.3 5.50 2.0 5.65 2.7 5.86 3.3 6.12 3.9 6.42 4.4 6.76
180 0.6 5.41 1.3 5.50 1.9 5.65 2.5 5.86 3.1 6.12 3.7 6.42 4.1 6.76
185 0.6 5.41 1.2 5.50 1.8 5.65 2.4 5.86 2.9 6.12 3.4 6.42 3.8 6.76
190 0.5 5.41 1.1 5.50 1.6 5.65 2.2 5.86 2.7 6.12 3.2 6.42 3.5 6.76
195 0.5 5.41 1.0 5.50 1.5 5.65 2.0 5.86 2.5 6.12 2.9 6.42 3.2 6.76
200 0.5 5.41 0.9 5.50 1.4 5.65 1.8 5.86 2.3 6.12 2.6 6.42 3.0 6.76
205 0.4 5.41 0.8 5.50 1.3 5.65 1.7 5.86 2.1 6.12 2.4 6.42 2.7 6.76
210 0.4 5.41 0.7 5.50 1.1 5.65 1.5 5.86 1.8 6.12 2.1 6.42 2.4 6.76
215 0.3 5.41 0.7 5.50 1.0 5.65 1.3 5.86 1.6 6.12 1.9 6.42 2.1 6.76
220 0.3 5.41 0.6 5.50 0.9 5.65 1.2 5.86 1.4 6.12 1.6 6.42 1.8 6.76
225 0.2 5.41 0.5 5.50 0.8 5.65 1.0 5.86 1.2 6.12 1.4 6.42 1.5 6.76
230 0.2 5.41 0.4 5.50 0.6 5.65 0.8 5.86 1.0 6.12 1.1 6.42 1.2 6.76
235 0.2 5.41 0.3 5.50 0.5 5.65 0.7 5.86 0.8 6.12 0.9 6.42 0.9 6.76
12 175 0.7 5.41 1.4 5.50 2.0 5.65 2.7 5.86 3.3 6.12 3.8 6.42
180 0.6 5.41 1.3 5.50 1.9 5.65 2.5 5.86 3.0 6.12 3.5 6.42185 0.6 5.41 1.2 5.50 1.8 5.65 2.3 5.86 2.8 6.12 3.3 6.42
190 0.6 5.41 1.1 5.50 1.7 5.65 2.2 5.86 2.6 6.12 3.0 6.42
195 0.5 5.41 1.0 5.50 1.5 5.65 2.0 5.86 2.4 6.12 2.8 6.42
200 0.5 5.41 0.9 5.50 1.4 5.65 1.8 5.86 2.2 6.12 2.5 6.42
205 0.4 5.41 0.9 5.50 1.3 5.65 1.7 5.86 2.0 6.12 2.3 6.42
210 0.4 5.41 0.8 5.50 1.1 5.65 1.5 5.86 1.8 6.12 2.0 6.42
215 0.3 5.41 0.7 5.50 1.0 5.65 1.3 5.86 1.6 6.12 1.7 6.42
220 0.3 5.41 0.6 5.50 0.9 5.65 1.1 5.86 1.4 6.12 1.5 6.42
225 0.3 5.41 0.5 5.50 0.8 5.65 1.0 5.86 1.1 6.12 1.2 6.42
230 0.2 5.41 0.4 5.50 0.6 5.65 0.8 5.86 0.9 6.12 1.0 6.42
235 0.2 5.41 0.4 5.50 0.5 5.65 0.6 5.86 0.7 6.12 0.7 6.42
16 175 0.7 5.41 1.4 5.50 2.0 5.65 2.6 5.86 3.1 6.12
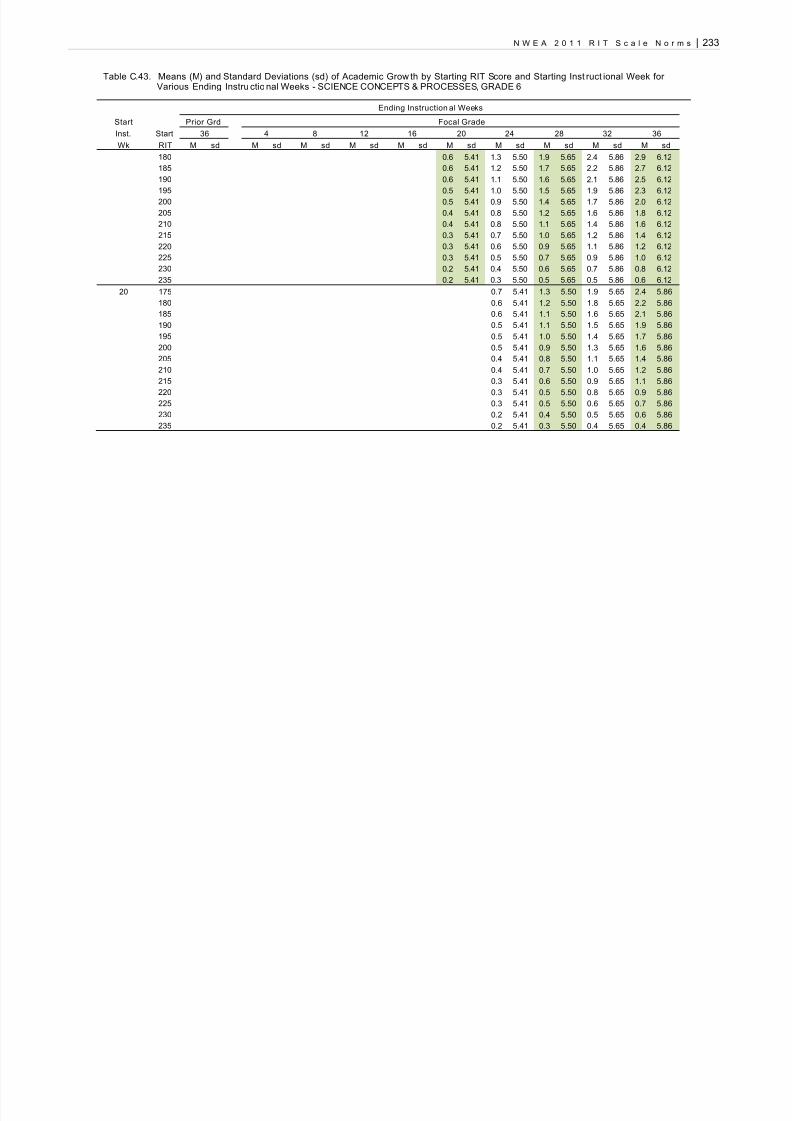
8/10/2019 n We a 2011 Norms Report
http://slidepdf.com/reader/full/n-we-a-2011-norms-report 249/268
N W E A 2 0 1 1 R I T S c a l e N o r m s | 233
Table C.43. Means (M) and Standard Deviations (sd) of Academic Grow th by Starting RIT Score and Starting Inst ruct ional Week forVarious Ending Instru ctional Weeks - SCIENCE CONCEPTS & PROCESSES, GRADE 6
Ending Instruction al Weeks
Start Prior Grd Focal Grade
Inst. Start 36 4 8 12 16 20 24 28 32 36
Wk RIT M sd M sd M sd M sd M sd M sd M sd M sd M sd M sd
180 0.6 5.41 1.3 5.50 1.9 5.65 2.4 5.86 2.9 6.12
185 0.6 5.41 1.2 5.50 1.7 5.65 2.2 5.86 2.7 6.12
190 0.6 5.41 1.1 5.50 1.6 5.65 2.1 5.86 2.5 6.12
195 0.5 5.41 1.0 5.50 1.5 5.65 1.9 5.86 2.3 6.12
200 0.5 5.41 0.9 5.50 1.4 5.65 1.7 5.86 2.0 6.12
205 0.4 5.41 0.8 5.50 1.2 5.65 1.6 5.86 1.8 6.12
210 0.4 5.41 0.8 5.50 1.1 5.65 1.4 5.86 1.6 6.12
215 0.3 5.41 0.7 5.50 1.0 5.65 1.2 5.86 1.4 6.12
220 0.3 5.41 0.6 5.50 0.9 5.65 1.1 5.86 1.2 6.12
225 0.3 5.41 0.5 5.50 0.7 5.65 0.9 5.86 1.0 6.12
230 0.2 5.41 0.4 5.50 0.6 5.65 0.7 5.86 0.8 6.12
235 0.2 5.41 0.3 5.50 0.5 5.65 0.5 5.86 0.6 6.12
20 175 0.7 5.41 1.3 5.50 1.9 5.65 2.4 5.86
180 0.6 5.41 1.2 5.50 1.8 5.65 2.2 5.86
185 0.6 5.41 1.1 5.50 1.6 5.65 2.1 5.86
190 0.5 5.41 1.1 5.50 1.5 5.65 1.9 5.86
195 0.5 5.41 1.0 5.50 1.4 5.65 1.7 5.86
200 0.5 5.41 0.9 5.50 1.3 5.65 1.6 5.86
205 0.4 5.41 0.8 5.50 1.1 5.65 1.4 5.86
210 0.4 5.41 0.7 5.50 1.0 5.65 1.2 5.86
215 0.3 5.41 0.6 5.50 0.9 5.65 1.1 5.86
220 0.3 5.41 0.5 5.50 0.8 5.65 0.9 5.86225 0.3 5.41 0.5 5.50 0.6 5.65 0.7 5.86
230 0.2 5.41 0.4 5.50 0.5 5.65 0.6 5.86
235 0.2 5.41 0.3 5.50 0.4 5.65 0.4 5.86

8/10/2019 n We a 2011 Norms Report
http://slidepdf.com/reader/full/n-we-a-2011-norms-report 250/268
234 | N W E A 2 0 1 1 R I T S c a l e N o r m s
Table C.44. Means (M) and Standard Deviations (sd) o f Academic Growth by Starting RIT Score and Starting Instru ctional Week forVarious Ending Inst ruc tional Weeks - SCIENCE CONCEPTS & PROCESSES, GRADE 7
Table C.44. Means (M) and Standard Deviations (sd ) of Academic Growth by Starting RIT Score and Starting Instr ucti onal Week for VariousEnding Instructional Weeks - SCIENCE CONCEPTS & PROCESSES, GRADE 7
Ending Instruction al Weeks
Start Prior Grd Focal Grade
Inst. Start 36 4 8 12 16 20 24 28 32 36
Wk RIT M sd M sd M sd M sd M sd M sd M sd M sd M sd M sd
32(Gd 6)
175 0.6 5.41 1.2 5.51 2.0 5.68 2.7 5.90 3.5 6.18 4.3 6.50 5.1 6.86 5.9 7.25 6.6 7.68 7.3 8.12
1800.5 5.41 1.1 5.51 1.8 5.68 2.5 5.90 3.2 6.18 4.0 6.50 4.7 6.86 5.4 7.25 6.1 7.68 6.7 8.12185 0.5 5.41 1.0 5.51 1.6 5.68 2.3 5.90 3.0 6.18 3.6 6.50 4.3 6.86 5.0 7.25 5.6 7.68 6.1 8.12
190 0.4 5.41 0.9 5.51 1.4 5.68 2.0 5.90 2.7 6.18 3.3 6.50 3.9 6.86 4.5 7.25 5.1 7.68 5.6 8.12
195 0.4 5.41 0.8 5.51 1.3 5.68 1.8 5.90 2.4 6.18 2.9 6.50 3.5 6.86 4.0 7.25 4.5 7.68 5.0 8.12
200 0.3 5.41 0.7 5.51 1.1 5.68 1.6 5.90 2.1 6.18 2.6 6.50 3.1 6.86 3.6 7.25 4.0 7.68 4.4 8.12
205 0.2 5.41 0.5 5.51 0.9 5.68 1.3 5.90 1.8 6.18 2.2 6.50 2.7 6.86 3.1 7.25 3.5 7.68 3.8 8.12
210 0.2 5.41 0.4 5.51 0.7 5.68 1.1 5.90 1.5 6.18 1.9 6.50 2.3 6.86 2.6 7.25 3.0 7.68 3.2 8.12
215 0.1 5.41 0.3 5.51 0.6 5.68 0.9 5.90 1.2 6.18 1.5 6.50 1.9 6.86 2.2 7.25 2.4 7.68 2.6 8.12
220 0.1 5.41 0.2 5.51 0.4 5.68 0.6 5.90 0.9 6.18 1.2 6.50 1.5 6.86 1.7 7.25 1.9 7.68 2.0 8.12
225 0.0 5.41 0.1 5.51 0.2 5.68 0.4 5.90 0.6 6.18 0.8 6.50 1.1 6.86 1.2 7.25 1.4 7.68 1.5 8.12
230 -0.1 5.41 -0.1 5.51 0.0 5.68 0.2 5.90 0.3 6.18 0.5 6.50 0.6 6.86 0.8 7.25 0.9 7.68 0.9 8.12
235 -0.1 5.41 -0.2 5.51 -0.1 5.68 -0.1 5.90 0.0 6.18 0.1 6.50 0.2 6.86 0.3 7.25 0.3 7.68 0.3 8.12
240 -0.2 5.41 -0.3 5.51 -0.3 5.68 -0.3 5.90 -0.3 6.18 -0.2 6.50 -0.2 6.86 -0.2 7.25 -0.2 7.68 -0.3 8.12
36(Gd 6)
175 0.7 5.41 1.4 5.51 2.2 5.68 3.0 5.90 3.8 6.18 4.6 6.50 5.3 6.86 6.1 7.25 6.7 7.68
180 0.6 5.41 1.3 5.51 2.0 5.68 2.7 5.90 3.5 6.18 4.2 6.50 4.9 6.86 5.6 7.25 6.2 7.68
185 0.5 5.41 1.2 5.51 1.8 5.68 2.5 5.90 3.2 6.18 3.9 6.50 4.5 6.86 5.1 7.25 5.7 7.68
190 0.5 5.41 1.0 5.51 1.6 5.68 2.3 5.90 2.9 6.18 3.5 6.50 4.1 6.86 4.7 7.25 5.2 7.68
195 0.4 5.41 0.9 5.51 1.5 5.68 2.0 5.90 2.6 6.18 3.2 6.50 3.7 6.86 4.2 7.25 4.6 7.68
200 0.4 5.41 0.8 5.51 1.3 5.68 1.8 5.90 2.3 6.18 2.8 6.50 3.3 6.86 3.7 7.25 4.1 7.68205 0.3 5.41 0.7 5.51 1.1 5.68 1.6 5.90 2.0 6.18 2.5 6.50 2.9 6.86 3.3 7.25 3.6 7.68
210 0.3 5.41 0.6 5.51 0.9 5.68 1.3 5.90 1.7 6.18 2.1 6.50 2.5 6.86 2.8 7.25 3.0 7.68
215 0.2 5.41 0.5 5.51 0.8 5.68 1.1 5.90 1.4 6.18 1.8 6.50 2.1 6.86 2.3 7.25 2.5 7.68
220 0.1 5.41 0.3 5.51 0.6 5.68 0.9 5.90 1.1 6.18 1.4 6.50 1.7 6.86 1.9 7.25 2.0 7.68
225 0.1 5.41 0.2 5.51 0.4 5.68 0.6 5.90 0.8 6.18 1.1 6.50 1.2 6.86 1.4 7.25 1.5 7.68
230 0.0 5.41 0.1 5.51 0.2 5.68 0.4 5.90 0.5 6.18 0.7 6.50 0.8 6.86 0.9 7.25 0.9 7.68
235 0.0 5.41 0.0 5.51 0.1 5.68 0.2 5.90 0.3 6.18 0.4 6.50 0.4 6.86 0.5 7.25 0.4 7.68
240 -0.1 5.41 -0.1 5.51 -0.1 5.68 -0.1 5.90 0.0 6.18 0.0 6.50 0.0 6.86 0.0 7.25 -0.1 7.68
4 175 0.7 5.41 1.5 5.51 2.3 5.68 3.1 5.90 3.9 6.18 4.7 6.50 5.4 6.86 6.1 7.25
180 0.7 5.41 1.4 5.51 2.1 5.68 2.9 5.90 3.6 6.18 4.3 6.50 5.0 6.86 5.6 7.25
185 0.6 5.41 1.3 5.51 1.9 5.68 2.6 5.90 3.3 6.18 4.0 6.50 4.6 6.86 5.1 7.25
190 0.6 5.41 1.1 5.51 1.8 5.68 2.4 5.90 3.0 6.18 3.6 6.50 4.2 6.86 4.7 7.25
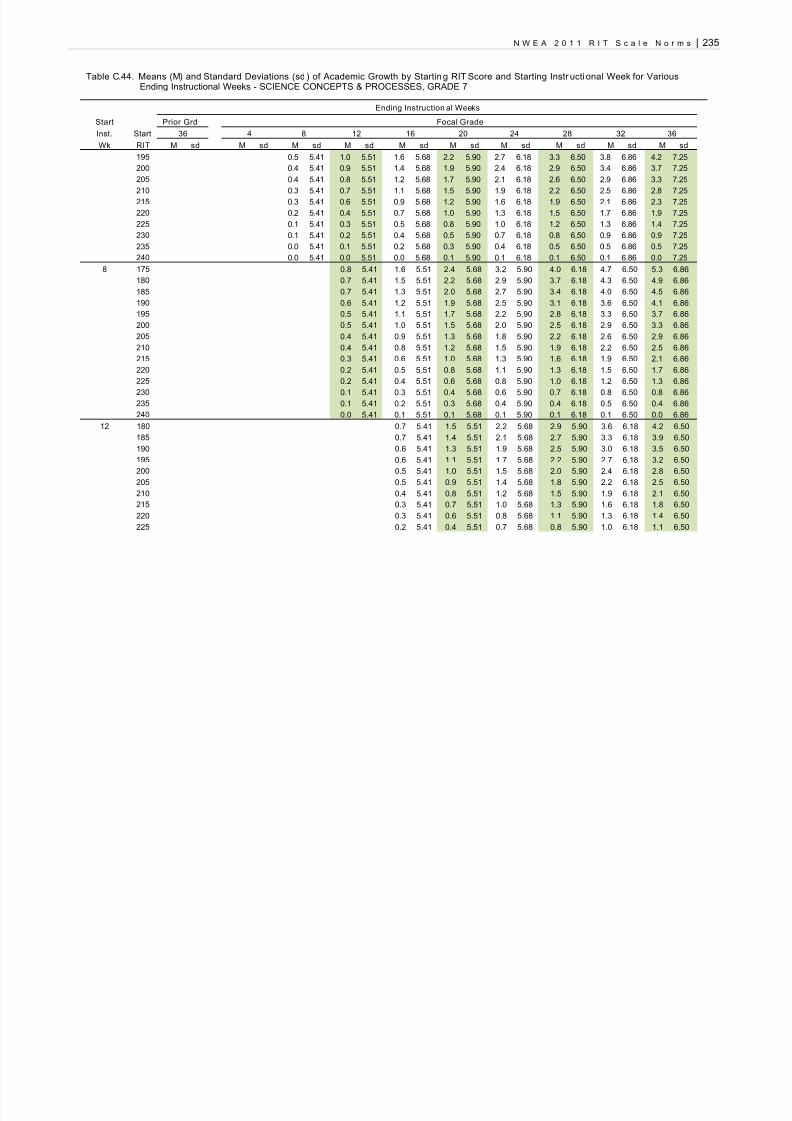
8/10/2019 n We a 2011 Norms Report
http://slidepdf.com/reader/full/n-we-a-2011-norms-report 251/268
N W E A 2 0 1 1 R I T S c a l e N o r m s | 235
Table C.44. Means (M) and Standard Deviations (sd ) of Academic Growth by Starting RIT Score and Starting Instr ucti onal Week for VariousEnding Instructional Weeks - SCIENCE CONCEPTS & PROCESSES, GRADE 7
Ending Instruction al Weeks
Start Prior Grd Focal Grade
Inst. Start 36 4 8 12 16 20 24 28 32 36
Wk RIT M sd M sd M sd M sd M sd M sd M sd M sd M sd M sd
195 0.5 5.41 1.0 5.51 1.6 5.68 2.2 5.90 2.7 6.18 3.3 6.50 3.8 6.86 4.2 7.25
200 0.4 5.41 0.9 5.51 1.4 5.68 1.9 5.90 2.4 6.18 2.9 6.50 3.4 6.86 3.7 7.25
205 0.4 5.41 0.8 5.51 1.2 5.68 1.7 5.90 2.1 6.18 2.6 6.50 2.9 6.86 3.3 7.25
210 0.3 5.41 0.7 5.51 1.1 5.68 1.5 5.90 1.9 6.18 2.2 6.50 2.5 6.86 2.8 7.25
215 0.3 5.41 0.6 5.51 0.9 5.68 1.2 5.90 1.6 6.18 1.9 6.50 2.1 6.86 2.3 7.25
220 0.2 5.41 0.4 5.51 0.7 5.68 1.0 5.90 1.3 6.18 1.5 6.50 1.7 6.86 1.9 7.25
225 0.1 5.41 0.3 5.51 0.5 5.68 0.8 5.90 1.0 6.18 1.2 6.50 1.3 6.86 1.4 7.25
230 0.1 5.41 0.2 5.51 0.4 5.68 0.5 5.90 0.7 6.18 0.8 6.50 0.9 6.86 0.9 7.25
235 0.0 5.41 0.1 5.51 0.2 5.68 0.3 5.90 0.4 6.18 0.5 6.50 0.5 6.86 0.5 7.25
240 0.0 5.41 0.0 5.51 0.0 5.68 0.1 5.90 0.1 6.18 0.1 6.50 0.1 6.86 0.0 7.25
8 175 0.8 5.41 1.6 5.51 2.4 5.68 3.2 5.90 4.0 6.18 4.7 6.50 5.3 6.86
180 0.7 5.41 1.5 5.51 2.2 5.68 2.9 5.90 3.7 6.18 4.3 6.50 4.9 6.86
185 0.7 5.41 1.3 5.51 2.0 5.68 2.7 5.90 3.4 6.18 4.0 6.50 4.5 6.86
190 0.6 5.41 1.2 5.51 1.9 5.68 2.5 5.90 3.1 6.18 3.6 6.50 4.1 6.86
195 0.5 5.41 1.1 5.51 1.7 5.68 2.2 5.90 2.8 6.18 3.3 6.50 3.7 6.86
200 0.5 5.41 1.0 5.51 1.5 5.68 2.0 5.90 2.5 6.18 2.9 6.50 3.3 6.86
205 0.4 5.41 0.9 5.51 1.3 5.68 1.8 5.90 2.2 6.18 2.6 6.50 2.9 6.86
210 0.4 5.41 0.8 5.51 1.2 5.68 1.5 5.90 1.9 6.18 2.2 6.50 2.5 6.86
215 0.3 5.41 0.6 5.51 1.0 5.68 1.3 5.90 1.6 6.18 1.9 6.50 2.1 6.86
220 0.2 5.41 0.5 5.51 0.8 5.68 1.1 5.90 1.3 6.18 1.5 6.50 1.7 6.86
225 0.2 5.41 0.4 5.51 0.6 5.68 0.8 5.90 1.0 6.18 1.2 6.50 1.3 6.86
230 0.1 5.41 0.3 5.51 0.4 5.68 0.6 5.90 0.7 6.18 0.8 6.50 0.8 6.86235 0.1 5.41 0.2 5.51 0.3 5.68 0.4 5.90 0.4 6.18 0.5 6.50 0.4 6.86
240 0.0 5.41 0.1 5.51 0.1 5.68 0.1 5.90 0.1 6.18 0.1 6.50 0.0 6.86
12 180 0.7 5.41 1.5 5.51 2.2 5.68 2.9 5.90 3.6 6.18 4.2 6.50
185 0.7 5.41 1.4 5.51 2.1 5.68 2.7 5.90 3.3 6.18 3.9 6.50
190 0.6 5.41 1.3 5.51 1.9 5.68 2.5 5.90 3.0 6.18 3.5 6.50
195 0.6 5.41 1.1 5.51 1.7 5.68 2.2 5.90 2.7 6.18 3.2 6.50
200 0.5 5.41 1.0 5.51 1.5 5.68 2.0 5.90 2.4 6.18 2.8 6.50
205 0.5 5.41 0.9 5.51 1.4 5.68 1.8 5.90 2.2 6.18 2.5 6.50
210 0.4 5.41 0.8 5.51 1.2 5.68 1.5 5.90 1.9 6.18 2.1 6.50
215 0.3 5.41 0.7 5.51 1.0 5.68 1.3 5.90 1.6 6.18 1.8 6.50
220 0.3 5.41 0.6 5.51 0.8 5.68 1.1 5.90 1.3 6.18 1.4 6.50
225 0.2 5.41 0.4 5.51 0.7 5.68 0.8 5.90 1.0 6.18 1.1 6.50

8/10/2019 n We a 2011 Norms Report
http://slidepdf.com/reader/full/n-we-a-2011-norms-report 252/268
236 | N W E A 2 0 1 1 R I T S c a l e N o r m s
Table C.44. Means (M) and Standard Deviations (sd ) of Academic Growth by Starting RIT Score and Starting Instr ucti onal Week for VariousEnding Instructional Weeks - SCIENCE CONCEPTS & PROCESSES, GRADE 7
Ending Instruction al Weeks
Start Prior Grd Focal Grade
Inst. Start 36 4 8 12 16 20 24 28 32 36
Wk RIT M sd M sd M sd M sd M sd M sd M sd M sd M sd M sd
230 0.2 5.41 0.3 5.51 0.5 5.68 0.6 5.90 0.7 6.18 0.7 6.50
235 0.1 5.41 0.2 5.51 0.3 5.68 0.4 5.90 0.4 6.18 0.4 6.50
240 0.0 5.41 0.1 5.51 0.1 5.68 0.1 5.90 0.1 6.18 0.0 6.50
16 1800.8 5.41 1.5 5.51 2.2 5.68 2.9 5.90 3.5 6.18185 0.7 5.41 1.4 5.51 2.0 5.68 2.6 5.90 3.2 6.18
190 0.6 5.41 1.3 5.51 1.9 5.68 2.4 5.90 2.9 6.18
195 0.6 5.41 1.1 5.51 1.7 5.68 2.2 5.90 2.6 6.18
200 0.5 5.41 1.0 5.51 1.5 5.68 1.9 5.90 2.3 6.18
205 0.5 5.41 0.9 5.51 1.3 5.68 1.7 5.90 2.0 6.18
210 0.4 5.41 0.8 5.51 1.2 5.68 1.5 5.90 1.7 6.18
215 0.3 5.41 0.7 5.51 1.0 5.68 1.2 5.90 1.4 6.18
220 0.3 5.41 0.6 5.51 0.8 5.68 1.0 5.90 1.1 6.18
225 0.2 5.41 0.4 5.51 0.6 5.68 0.8 5.90 0.9 6.18
230 0.2 5.41 0.3 5.51 0.5 5.68 0.5 5.90 0.6 6.18
235 0.1 5.41 0.2 5.51 0.3 5.68 0.3 5.90 0.3 6.18
240 0.1 5.41 0.1 5.51 0.1 5.68 0.1 5.90 0.0 6.18
20 180 0.7 5.41 1.5 5.51 2.1 5.68 2.7 5.90
185 0.7 5.41 1.3 5.51 2.0 5.68 2.5 5.90
190 0.6 5.41 1.2 5.51 1.8 5.68 2.3 5.90
195 0.6 5.41 1.1 5.51 1.6 5.68 2.0 5.90
200 0.5 5.41 1.0 5.51 1.4 5.68 1.8 5.90
205 0.5 5.41 0.9 5.51 1.3 5.68 1.6 5.90210 0.4 5.41 0.8 5.51 1.1 5.68 1.3 5.90
215 0.3 5.41 0.6 5.51 0.9 5.68 1.1 5.90
220 0.3 5.41 0.5 5.51 0.7 5.68 0.9 5.90
225 0.2 5.41 0.4 5.51 0.6 5.68 0.6 5.90
230 0.2 5.41 0.3 5.51 0.4 5.68 0.4 5.90
235 0.1 5.41 0.2 5.51 0.2 5.68 0.2 5.90
240 0.0 5.41 0.1 5.51 0.0 5.68 -0.1 5.90

8/10/2019 n We a 2011 Norms Report
http://slidepdf.com/reader/full/n-we-a-2011-norms-report 253/268
N W E A 2 0 1 1 R I T S c a l e N o r m s | 237
Table C.45. Means (M) and Standard Deviations (sd) o f Academic Growth by Starting RIT Score and Starting Instru ctional Week forVarious Ending Inst ruc tional Weeks - SCIENCE CONCEPTS & PROCESSES, GRADE 8
Table C.45. Means (M) and Standard Deviations (sd) of Academic Grow th by Starting RIT Score and Starting Inst ruct ional Week forVarious Ending Instructional Weeks - SCIENCE CONCEPTS & PROCESSES, GRADE 8
Ending Instructio nal Weeks
Start Prior Grd Focal Grade
Inst. Start 36 4 8 12 16 20 24 28 32 36
Wk RIT M sd M sd M sd M sd M sd M sd M sd M sd M sd M sd
32(Gd 7)
180 0.6 5.42 1.2 5.55 1.9 5.76 2.6 6.04 3.2 6.38 3.9 6.78 4.5 7.22 5.0 7.70 5.4 8.21 5.8 8.74
1850.5 5.42 1.1 5.55 1.7 5.76 2.4 6.04 3.0 6.38 3.6 6.78 4.2 7.22 4.6 7.70 5.0 8.21 5.3 8.74190 0.5 5.42 1.0 5.55 1.6 5.76 2.2 6.04 2.8 6.38 3.3 6.78 3.8 7.22 4.3 7.70 4.6 8.21 4.8 8.74
195 0.4 5.42 0.9 5.55 1.5 5.76 2.0 6.04 2.5 6.38 3.1 6.78 3.5 7.22 3.9 7.70 4.2 8.20 4.4 8.74
200 0.4 5.42 0.8 5.55 1.3 5.76 1.8 6.04 2.3 6.38 2.8 6.78 3.2 7.22 3.5 7.70 3.8 8.20 3.9 8.74
205 0.4 5.42 0.8 5.55 1.2 5.76 1.6 6.04 2.1 6.38 2.5 6.78 2.9 7.22 3.2 7.70 3.4 8.20 3.5 8.74
210 0.3 5.42 0.7 5.55 1.1 5.76 1.5 6.04 1.9 6.38 2.2 6.78 2.5 7.22 2.8 7.70 3.0 8.20 3.0 8.74
215 0.3 5.42 0.6 5.55 0.9 5.76 1.3 6.04 1.6 6.38 2.0 6.78 2.2 7.22 2.4 7.70 2.5 8.20 2.5 8.74
220 0.2 5.42 0.5 5.55 0.8 5.76 1.1 6.04 1.4 6.38 1.7 6.78 1.9 7.22 2.1 7.70 2.1 8.20 2.1 8.74
225 0.2 5.42 0.4 5.55 0.6 5.76 0.9 6.04 1.2 6.38 1.4 6.78 1.6 7.22 1.7 7.70 1.7 8.20 1.6 8.74
230 0.1 5.42 0.3 5.55 0.5 5.76 0.7 6.04 0.9 6.38 1.1 6.78 1.3 7.22 1.3 7.70 1.3 8.21 1.2 8.74
235 0.1 5.42 0.2 5.55 0.4 5.76 0.5 6.04 0.7 6.38 0.8 6.78 0.9 7.22 1.0 7.70 0.9 8.21 0.7 8.74
240 0.0 5.42 0.1 5.55 0.2 5.76 0.4 6.04 0.5 6.38 0.6 6.78 0.6 7.22 0.6 7.70 0.5 8.21 0.2 8.74
36(Gd 7)
180 0.6 5.42 1.3 5.55 2.0 5.76 2.7 6.04 3.3 6.38 3.9 6.78 4.4 7.22 4.9 7.70 5.2 8.21
185 0.6 5.42 1.2 5.55 1.8 5.76 2.5 6.04 3.1 6.38 3.6 6.78 4.1 7.22 4.5 7.70 4.8 8.21
190 0.5 5.42 1.1 5.55 1.7 5.76 2.3 6.04 2.8 6.38 3.3 6.78 3.8 7.22 4.1 7.70 4.4 8.21
195 0.5 5.42 1.0 5.55 1.6 5.76 2.1 6.04 2.6 6.38 3.1 6.78 3.5 7.22 3.8 7.70 3.9 8.20
200 0.5 5.42 0.9 5.55 1.4 5.76 1.9 6.04 2.4 6.38 2.8 6.78 3.1 7.22 3.4 7.70 3.5 8.20
205 0.4 5.42 0.8 5.55 1.3 5.76 1.7 6.04 2.2 6.38 2.5 6.78 2.8 7.22 3.0 7.70 3.1 8.20
210 0.4 5.42 0.8 5.55 1.2 5.76 1.6 6.04 1.9 6.38 2.2 6.78 2.5 7.22 2.7 7.70 2.7 8.20215 0.3 5.42 0.7 5.55 1.0 5.76 1.4 6.04 1.7 6.38 2.0 6.78 2.2 7.22 2.3 7.70 2.3 8.20
220 0.3 5.42 0.6 5.55 0.9 5.76 1.2 6.04 1.5 6.38 1.7 6.78 1.9 7.22 1.9 7.70 1.9 8.20
225 0.2 5.42 0.5 5.55 0.7 5.76 1.0 6.04 1.2 6.38 1.4 6.78 1.5 7.22 1.5 7.70 1.5 8.20
230 0.2 5.42 0.4 5.55 0.6 5.76 0.8 6.04 1.0 6.38 1.1 6.78 1.2 7.22 1.2 7.70 1.0 8.21
235 0.1 5.42 0.3 5.55 0.5 5.76 0.6 6.04 0.8 6.38 0.9 6.78 0.9 7.22 0.8 7.70 0.6 8.21
240 0.1 5.42 0.2 5.55 0.3 5.76 0.5 6.04 0.5 6.38 0.6 6.78 0.6 7.22 0.4 7.70 0.2 8.21
4 180 0.7 5.42 1.4 5.55 2.0 5.76 2.7 6.04 3.3 6.38 3.8 6.78 4.2 7.22 4.5 7.70
185 0.6 5.42 1.3 5.55 1.9 5.76 2.5 6.04 3.0 6.38 3.5 6.78 3.9 7.22 4.2 7.70
190 0.6 5.42 1.2 5.55 1.8 5.76 2.3 6.04 2.8 6.38 3.2 6.78 3.6 7.22 3.8 7.70
195 0.5 5.42 1.1 5.55 1.6 5.76 2.1 6.04 2.6 6.38 3.0 6.78 3.3 7.22 3.4 7.70
200 0.5 5.42 1.0 5.55 1.5 5.76 1.9 6.04 2.3 6.38 2.7 6.78 2.9 7.22 3.1 7.70
205 0.4 5.42 0.9 5.55 1.3 5.76 1.8 6.04 2.1 6.38 2.4 6.78 2.6 7.22 2.7 7.70
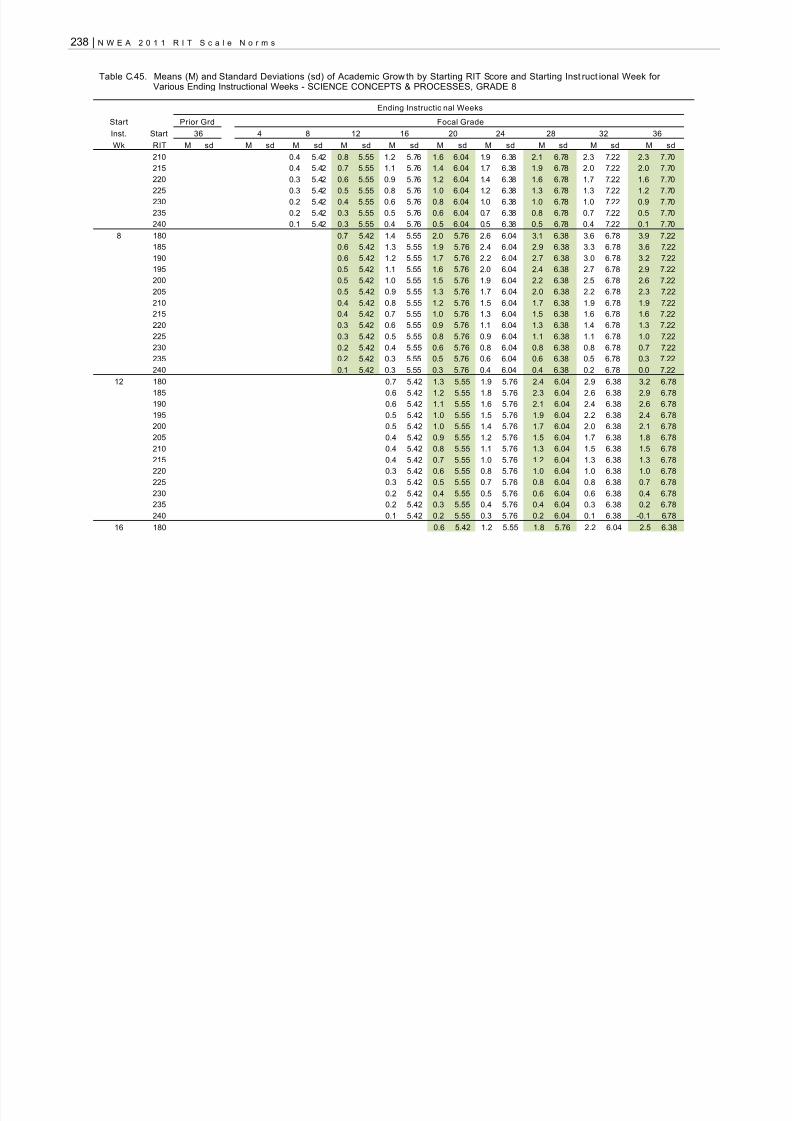
8/10/2019 n We a 2011 Norms Report
http://slidepdf.com/reader/full/n-we-a-2011-norms-report 254/268
238 | N W E A 2 0 1 1 R I T S c a l e N o r m s
Table C.45. Means (M) and Standard Deviations (sd) of Academic Grow th by Starting RIT Score and Starting Inst ruct ional Week forVarious Ending Instructional Weeks - SCIENCE CONCEPTS & PROCESSES, GRADE 8
Ending Instructio nal Weeks
Start Prior Grd Focal Grade
Inst. Start 36 4 8 12 16 20 24 28 32 36
Wk RIT M sd M sd M sd M sd M sd M sd M sd M sd M sd M sd
210 0.4 5.42 0.8 5.55 1.2 5.76 1.6 6.04 1.9 6.38 2.1 6.78 2.3 7.22 2.3 7.70
215 0.4 5.42 0.7 5.55 1.1 5.76 1.4 6.04 1.7 6.38 1.9 6.78 2.0 7.22 2.0 7.70
220 0.3 5.42 0.6 5.55 0.9 5.76 1.2 6.04 1.4 6.38 1.6 6.78 1.7 7.22 1.6 7.70
225 0.3 5.42 0.5 5.55 0.8 5.76 1.0 6.04 1.2 6.38 1.3 6.78 1.3 7.22 1.2 7.70
230 0.2 5.42 0.4 5.55 0.6 5.76 0.8 6.04 1.0 6.38 1.0 6.78 1.0 7.22 0.9 7.70
235 0.2 5.42 0.3 5.55 0.5 5.76 0.6 6.04 0.7 6.38 0.8 6.78 0.7 7.22 0.5 7.70
240 0.1 5.42 0.3 5.55 0.4 5.76 0.5 6.04 0.5 6.38 0.5 6.78 0.4 7.22 0.1 7.70
8 180 0.7 5.42 1.4 5.55 2.0 5.76 2.6 6.04 3.1 6.38 3.6 6.78 3.9 7.22
185 0.6 5.42 1.3 5.55 1.9 5.76 2.4 6.04 2.9 6.38 3.3 6.78 3.6 7.22
190 0.6 5.42 1.2 5.55 1.7 5.76 2.2 6.04 2.7 6.38 3.0 6.78 3.2 7.22
195 0.5 5.42 1.1 5.55 1.6 5.76 2.0 6.04 2.4 6.38 2.7 6.78 2.9 7.22
200 0.5 5.42 1.0 5.55 1.5 5.76 1.9 6.04 2.2 6.38 2.5 6.78 2.6 7.22
205 0.5 5.42 0.9 5.55 1.3 5.76 1.7 6.04 2.0 6.38 2.2 6.78 2.3 7.22
210 0.4 5.42 0.8 5.55 1.2 5.76 1.5 6.04 1.7 6.38 1.9 6.78 1.9 7.22
215 0.4 5.42 0.7 5.55 1.0 5.76 1.3 6.04 1.5 6.38 1.6 6.78 1.6 7.22
220 0.3 5.42 0.6 5.55 0.9 5.76 1.1 6.04 1.3 6.38 1.4 6.78 1.3 7.22
225 0.3 5.42 0.5 5.55 0.8 5.76 0.9 6.04 1.1 6.38 1.1 6.78 1.0 7.22
230 0.2 5.42 0.4 5.55 0.6 5.76 0.8 6.04 0.8 6.38 0.8 6.78 0.7 7.22
235 0.2 5.42 0.3 5.55 0.5 5.76 0.6 6.04 0.6 6.38 0.5 6.78 0.3 7.22
240 0.1 5.42 0.3 5.55 0.3 5.76 0.4 6.04 0.4 6.38 0.2 6.78 0.0 7.22
12 180 0.7 5.42 1.3 5.55 1.9 5.76 2.4 6.04 2.9 6.38 3.2 6.78
185 0.6 5.42 1.2 5.55 1.8 5.76 2.3 6.04 2.6 6.38 2.9 6.78190 0.6 5.42 1.1 5.55 1.6 5.76 2.1 6.04 2.4 6.38 2.6 6.78
195 0.5 5.42 1.0 5.55 1.5 5.76 1.9 6.04 2.2 6.38 2.4 6.78
200 0.5 5.42 1.0 5.55 1.4 5.76 1.7 6.04 2.0 6.38 2.1 6.78
205 0.4 5.42 0.9 5.55 1.2 5.76 1.5 6.04 1.7 6.38 1.8 6.78
210 0.4 5.42 0.8 5.55 1.1 5.76 1.3 6.04 1.5 6.38 1.5 6.78
215 0.4 5.42 0.7 5.55 1.0 5.76 1.2 6.04 1.3 6.38 1.3 6.78
220 0.3 5.42 0.6 5.55 0.8 5.76 1.0 6.04 1.0 6.38 1.0 6.78
225 0.3 5.42 0.5 5.55 0.7 5.76 0.8 6.04 0.8 6.38 0.7 6.78
230 0.2 5.42 0.4 5.55 0.5 5.76 0.6 6.04 0.6 6.38 0.4 6.78
235 0.2 5.42 0.3 5.55 0.4 5.76 0.4 6.04 0.3 6.38 0.2 6.78
240 0.1 5.42 0.2 5.55 0.3 5.76 0.2 6.04 0.1 6.38 -0.1 6.78
16 180 0.6 5.42 1.2 5.55 1.8 5.76 2.2 6.04 2.5 6.38

8/10/2019 n We a 2011 Norms Report
http://slidepdf.com/reader/full/n-we-a-2011-norms-report 255/268
N W E A 2 0 1 1 R I T S c a l e N o r m s | 239
Table C.45. Means (M) and Standard Deviations (sd) of Academic Grow th by Starting RIT Score and Starting Inst ruct ional Week forVarious Ending Instructional Weeks - SCIENCE CONCEPTS & PROCESSES, GRADE 8
Ending Instructio nal Weeks
Start Prior Grd Focal Grade
Inst. Start 36 4 8 12 16 20 24 28 32 36
Wk RIT M sd M sd M sd M sd M sd M sd M sd M sd M sd M sd
185 0.6 5.42 1.2 5.55 1.6 5.76 2.0 6.04 2.3 6.38
190 0.6 5.42 1.1 5.55 1.5 5.76 1.8 6.04 2.1 6.38
195 0.5 5.42 1.0 5.55 1.4 5.76 1.7 6.04 1.8 6.38
200 0.5 5.42 0.9 5.55 1.2 5.76 1.5 6.04 1.6 6.38
205 0.4 5.42 0.8 5.55 1.1 5.76 1.3 6.04 1.4 6.38
210 0.4 5.42 0.7 5.55 0.9 5.76 1.1 6.04 1.1 6.38
215 0.3 5.42 0.6 5.55 0.8 5.76 0.9 6.04 0.9 6.38
220 0.3 5.42 0.5 5.55 0.7 5.76 0.7 6.04 0.7 6.38
225 0.2 5.42 0.4 5.55 0.5 5.76 0.5 6.04 0.5 6.38
230 0.2 5.42 0.3 5.55 0.4 5.76 0.4 6.04 0.2 6.38
235 0.1 5.42 0.2 5.55 0.3 5.76 0.2 6.04 0.0 6.38
240 0.1 5.42 0.1 5.55 0.1 5.76 0.0 6.04 -0.2 6.38
20 180 0.6 5.42 1.1 5.55 1.6 5.76 1.9 6.04
185 0.6 5.42 1.0 5.55 1.4 5.76 1.7 6.04
190 0.5 5.42 0.9 5.55 1.3 5.76 1.5 6.04
195 0.5 5.42 0.8 5.55 1.1 5.76 1.3 6.04
200 0.4 5.42 0.8 5.55 1.0 5.76 1.1 6.04
205 0.4 5.42 0.7 5.55 0.9 5.76 1.0 6.04
210 0.3 5.42 0.6 5.55 0.7 5.76 0.8 6.04
215 0.3 5.42 0.5 5.55 0.6 5.76 0.6 6.04
220 0.2 5.42 0.4 5.55 0.5 5.76 0.4 6.04
225 0.2 5.42 0.3 5.55 0.3 5.76 0.2 6.04230 0.1 5.42 0.2 5.55 0.2 5.76 0.0 6.04
235 0.1 5.42 0.1 5.55 0.0 5.76 -0.2 6.04
240 0.0 5.42 0.0 5.55 -0.1 5.76 -0.3 6.04
245 0.0 5.42 -0.1 5.55 -0.2 5.76 -0.5 6.04

8/10/2019 n We a 2011 Norms Report
http://slidepdf.com/reader/full/n-we-a-2011-norms-report 256/268
240 | N W E A 2 0 1 1 R I T S c a l e N o r m s
Table C.46. Means (M) and Standard Deviations (sd) o f Academic Growth by Starting RIT Score and Starting Instru ctional Week forVarious Ending Inst ruc tional Weeks - SCIENCE CONCEPTS & PROCESSES, GRADE 9
Table C.46. Means (M) and Standard Deviations (sd) of Academic Grow th by Starting RIT Score and Starting Inst ruct ional Week for VariousEnding Instructional Weeks - SCIENCE CONCEPTS & PROCESSES, GRADE 9
Ending Instruction al Weeks
Start Prior Grd Focal Grade
Inst. Start 36 4 8 12 16 20 24 28 32 36
Wk RIT M sd M sd M sd M sd M sd M sd M sd M sd M sd M sd
32(Gd 8)
180 0.1 5.43 0.2 5.58 0.4 5.82 0.6 6.14 0.9 6.53 1.2 6.98 1.6 7.48 2.0 8.01 2.3 8.57 2.7 9.16
1850.1 5.43 0.2 5.58 0.3 5.82 0.6 6.14 0.8 6.53 1.1 6.98 1.5 7.48 1.8 8.01 2.2 8.57 2.5 9.16190 0.0 5.43 0.1 5.58 0.3 5.82 0.5 6.14 0.7 6.53 1.0 6.98 1.3 7.48 1.7 8.01 2.0 8.57 2.3 9.16
195 0.0 5.43 0.1 5.58 0.2 5.82 0.4 6.14 0.6 6.53 0.9 6.98 1.2 7.48 1.5 8.01 1.8 8.57 2.1 9.16
200 0.0 5.43 0.0 5.58 0.2 5.82 0.3 6.14 0.5 6.53 0.8 6.98 1.1 7.47 1.3 8.01 1.6 8.57 1.9 9.16
205 0.0 5.43 0.0 5.58 0.1 5.82 0.3 6.14 0.4 6.53 0.7 6.98 0.9 7.47 1.2 8.01 1.5 8.57 1.8 9.16
210 -0.1 5.43 0.0 5.58 0.0 5.82 0.2 6.14 0.3 6.53 0.5 6.98 0.8 7.47 1.0 8.01 1.3 8.57 1.6 9.16
215 -0.1 5.43 -0.1 5.58 0.0 5.82 0.1 6.14 0.2 6.53 0.4 6.98 0.6 7.47 0.9 8.01 1.1 8.57 1.4 9.16
220 -0.1 5.43 -0.1 5.58 -0.1 5.82 0.0 6.14 0.1 6.53 0.3 6.98 0.5 7.47 0.7 8.01 0.9 8.57 1.2 9.16
225 -0.1 5.43 -0.2 5.58 -0.1 5.82 -0.1 6.14 0.1 6.53 0.2 6.98 0.4 7.47 0.6 8.01 0.8 8.57 1.0 9.16
230 -0.1 5.43 -0.2 5.58 -0.2 5.82 -0.1 6.14 -0.1 6.53 0.1 6.98 0.2 7.48 0.4 8.01 0.6 8.57 0.8 9.16
235 -0.2 5.43 -0.2 5.58 -0.3 5.82 -0.2 6.14 -0.2 6.53 0.0 6.98 0.1 7.48 0.3 8.01 0.4 8.57 0.6 9.16
240 -0.2 5.43 -0.3 5.58 -0.3 5.82 -0.3 6.14 -0.3 6.53 -0.2 6.98 0.0 7.48 0.1 8.01 0.2 8.57 0.4 9.16
245 -0.2 5.43 -0.3 5.58 -0.4 5.82 -0.4 6.14 -0.3 6.53 -0.3 6.98 -0.2 7.48 -0.1 8.01 0.1 8.57 0.2 9.16
250 -0.2 5.43 -0.3 5.58 -0.4 5.82 -0.5 6.14 -0.4 6.53 -0.4 6.98 -0.3 7.48 -0.2 8.01 -0.1 8.57 0.0 9.16
36(Gd 8)
180 0.1 5.43 0.3 5.58 0.6 5.82 0.9 6.14 1.2 6.53 1.5 6.98 1.9 7.48 2.3 8.01 2.7 8.57
185 0.1 5.43 0.3 5.58 0.5 5.82 0.8 6.14 1.1 6.53 1.4 6.98 1.8 7.48 2.1 8.01 2.5 8.57
190 0.1 5.43 0.3 5.58 0.5 5.82 0.7 6.14 1.0 6.53 1.3 6.98 1.6 7.48 2.0 8.01 2.3 8.57
195 0.1 5.43 0.2 5.58 0.4 5.82 0.6 6.14 0.9 6.53 1.2 6.98 1.5 7.48 1.8 8.01 2.1 8.57
200 0.1 5.43 0.2 5.58 0.3 5.82 0.5 6.14 0.8 6.53 1.1 6.98 1.4 7.47 1.7 8.01 2.0 8.57205 0.0 5.43 0.1 5.58 0.3 5.82 0.5 6.14 0.7 6.53 0.9 6.98 1.2 7.47 1.5 8.01 1.8 8.57
210 0.0 5.43 0.1 5.58 0.2 5.82 0.4 6.14 0.6 6.53 0.8 6.98 1.1 7.47 1.3 8.01 1.6 8.57
215 0.0 5.43 0.1 5.58 0.2 5.82 0.3 6.14 0.5 6.53 0.7 6.98 0.9 7.47 1.2 8.01 1.4 8.57
220 0.0 5.43 0.0 5.58 0.1 5.82 0.2 6.14 0.4 6.53 0.6 6.98 0.8 7.47 1.0 8.01 1.3 8.57
225 0.0 5.43 0.0 5.58 0.0 5.82 0.2 6.14 0.3 6.53 0.5 6.98 0.7 7.47 0.9 8.01 1.1 8.57
230 -0.1 5.43 -0.1 5.58 0.0 5.82 0.1 6.14 0.2 6.53 0.4 6.98 0.5 7.48 0.7 8.01 0.9 8.57
235 -0.1 5.43 -0.1 5.58 -0.1 5.82 0.0 6.14 0.1 6.53 0.2 6.98 0.4 7.48 0.6 8.01 0.7 8.57
240 -0.1 5.43 -0.1 5.58 -0.1 5.82 -0.1 6.14 0.0 6.53 0.1 6.98 0.3 7.48 0.4 8.01 0.6 8.57
245 -0.1 5.43 -0.2 5.58 -0.2 5.82 -0.2 6.14 -0.1 6.53 0.0 6.98 0.1 7.48 0.3 8.01 0.4 8.57
4 180 0.2 5.43 0.4 5.58 0.7 5.82 1.0 6.14 1.4 6.53 1.8 6.98 2.1 7.48 2.5 8.01
185 0.2 5.43 0.4 5.58 0.7 5.82 1.0 6.14 1.3 6.53 1.6 6.98 2.0 7.48 2.4 8.01
190 0.2 5.43 0.4 5.58 0.6 5.82 0.9 6.14 1.2 6.53 1.5 6.98 1.9 7.48 2.2 8.01

8/10/2019 n We a 2011 Norms Report
http://slidepdf.com/reader/full/n-we-a-2011-norms-report 257/268
N W E A 2 0 1 1 R I T S c a l e N o r m s | 241
Table C.46. Means (M) and Standard Deviations (sd) of Academic Grow th by Starting RIT Score and Starting Inst ruct ional Week for VariousEnding Instructional Weeks - SCIENCE CONCEPTS & PROCESSES, GRADE 9
Ending Instruction al Weeks
Start Prior Grd Focal Grade
Inst. Start 36 4 8 12 16 20 24 28 32 36
Wk RIT M sd M sd M sd M sd M sd M sd M sd M sd M sd M sd
195 0.1 5.43 0.3 5.58 0.6 5.82 0.8 6.14 1.1 6.53 1.4 6.98 1.7 7.48 2.1 8.01
200 0.1 5.43 0.3 5.58 0.5 5.82 0.7 6.14 1.0 6.53 1.3 6.98 1.6 7.47 1.9 8.01
205 0.1 5.43 0.2 5.58 0.4 5.82 0.7 6.14 0.9 6.53 1.2 6.98 1.5 7.47 1.7 8.01
210 0.1 5.43 0.2 5.58 0.4 5.82 0.6 6.14 0.8 6.53 1.1 6.98 1.3 7.47 1.6 8.01
215 0.1 5.43 0.2 5.58 0.3 5.82 0.5 6.14 0.7 6.53 0.9 6.98 1.2 7.47 1.4 8.01
220 0.0 5.43 0.1 5.58 0.3 5.82 0.4 6.14 0.6 6.53 0.8 6.98 1.1 7.47 1.3 8.01
225 0.0 5.43 0.1 5.58 0.2 5.82 0.3 6.14 0.5 6.53 0.7 6.98 0.9 7.47 1.1 8.01
230 0.0 5.43 0.1 5.58 0.1 5.82 0.3 6.14 0.4 6.53 0.6 6.98 0.8 7.48 1.0 8.01
235 0.0 5.43 0.0 5.58 0.1 5.82 0.2 6.14 0.3 6.53 0.5 6.98 0.6 7.48 0.8 8.01
240 0.0 5.43 0.0 5.58 0.0 5.82 0.1 6.14 0.2 6.53 0.4 6.98 0.5 7.48 0.7 8.01
245 -0.1 5.43 -0.1 5.58 0.0 5.82 0.0 6.14 0.1 6.53 0.2 6.98 0.4 7.48 0.5 8.01
8 180 0.2 5.43 0.5 5.58 0.9 5.82 1.2 6.14 1.6 6.53 2.0 6.98 2.3 7.48
185 0.2 5.43 0.5 5.58 0.8 5.82 1.1 6.14 1.5 6.53 1.8 6.98 2.2 7.48
190 0.2 5.43 0.5 5.58 0.7 5.82 1.0 6.14 1.4 6.53 1.7 6.98 2.1 7.48
195 0.2 5.43 0.4 5.58 0.7 5.82 1.0 6.14 1.3 6.53 1.6 6.98 1.9 7.48
200 0.2 5.43 0.4 5.58 0.6 5.82 0.9 6.14 1.2 6.53 1.5 6.98 1.8 7.47
205 0.2 5.43 0.3 5.58 0.6 5.82 0.8 6.14 1.1 6.53 1.4 6.98 1.7 7.47
210 0.1 5.43 0.3 5.58 0.5 5.82 0.7 6.14 1.0 6.53 1.3 6.98 1.5 7.47
215 0.1 5.43 0.3 5.58 0.4 5.82 0.7 6.14 0.9 6.53 1.1 6.98 1.4 7.47
220 0.1 5.43 0.2 5.58 0.4 5.82 0.6 6.14 0.8 6.53 1.0 6.98 1.2 7.47
225 0.1 5.43 0.2 5.58 0.3 5.82 0.5 6.14 0.7 6.53 0.9 6.98 1.1 7.47
230 0.1 5.43 0.1 5.58 0.3 5.82 0.4 6.14 0.6 6.53 0.8 6.98 1.0 7.48235 0.0 5.43 0.1 5.58 0.2 5.82 0.3 6.14 0.5 6.53 0.7 6.98 0.8 7.48
240 0.0 5.43 0.1 5.58 0.2 5.82 0.3 6.14 0.4 6.53 0.6 6.98 0.7 7.48
245 0.0 5.43 0.0 5.58 0.1 5.82 0.2 6.14 0.3 6.53 0.4 6.98 0.6 7.48
12 180 0.3 5.43 0.6 5.58 1.0 5.82 1.3 6.14 1.7 6.53 2.1 6.98
185 0.3 5.43 0.6 5.58 0.9 5.82 1.3 6.14 1.6 6.53 2.0 6.98
190 0.3 5.43 0.5 5.58 0.8 5.82 1.2 6.14 1.5 6.53 1.9 6.98
195 0.2 5.43 0.5 5.58 0.8 5.82 1.1 6.14 1.4 6.53 1.7 6.98
200 0.2 5.43 0.5 5.58 0.7 5.82 1.0 6.14 1.3 6.53 1.6 6.98
205 0.2 5.43 0.4 5.58 0.7 5.82 0.9 6.14 1.2 6.53 1.5 6.98
210 0.2 5.43 0.4 5.58 0.6 5.82 0.9 6.14 1.1 6.53 1.4 6.98
215 0.2 5.43 0.3 5.58 0.6 5.82 0.8 6.14 1.0 6.53 1.3 6.98
220 0.1 5.43 0.3 5.58 0.5 5.82 0.7 6.14 0.9 6.53 1.2 6.98

8/10/2019 n We a 2011 Norms Report
http://slidepdf.com/reader/full/n-we-a-2011-norms-report 258/268
242 | N W E A 2 0 1 1 R I T S c a l e N o r m s
Table C.46. Means (M) and Standard Deviations (sd) of Academic Grow th by Starting RIT Score and Starting Inst ruct ional Week for VariousEnding Instructional Weeks - SCIENCE CONCEPTS & PROCESSES, GRADE 9
Ending Instruction al Weeks
Start Prior Grd Focal Grade
Inst. Start 36 4 8 12 16 20 24 28 32 36
Wk RIT M sd M sd M sd M sd M sd M sd M sd M sd M sd M sd
225 0.1 5.43 0.3 5.58 0.4 5.82 0.6 6.14 0.8 6.53 1.0 6.98
230 0.1 5.43 0.2 5.58 0.4 5.82 0.6 6.14 0.7 6.53 0.9 6.98
235 0.1 5.43 0.2 5.58 0.3 5.82 0.5 6.14 0.6 6.53 0.8 6.98
240 0.1 5.43 0.1 5.58 0.3 5.82 0.4 6.14 0.5 6.53 0.7 6.98
245 0.0 5.43 0.1 5.58 0.2 5.82 0.3 6.14 0.4 6.53 0.6 6.98
250 0.0 5.43 0.1 5.58 0.1 5.82 0.2 6.14 0.3 6.53 0.5 6.98
16 180 0.3 5.43 0.7 5.58 1.0 5.82 1.4 6.14 1.8 6.53
185 0.3 5.43 0.6 5.58 1.0 5.82 1.3 6.14 1.7 6.53
190 0.3 5.43 0.6 5.58 0.9 5.82 1.3 6.14 1.6 6.53
195 0.3 5.43 0.6 5.58 0.9 5.82 1.2 6.14 1.5 6.53
200 0.2 5.43 0.5 5.58 0.8 5.82 1.1 6.14 1.4 6.53
205 0.2 5.43 0.5 5.58 0.8 5.82 1.0 6.14 1.3 6.53
210 0.2 5.43 0.4 5.58 0.7 5.82 1.0 6.14 1.2 6.53
215 0.2 5.43 0.4 5.58 0.6 5.82 0.9 6.14 1.1 6.53
220 0.2 5.43 0.4 5.58 0.6 5.82 0.8 6.14 1.0 6.53
225 0.2 5.43 0.3 5.58 0.5 5.82 0.7 6.14 0.9 6.53
230 0.1 5.43 0.3 5.58 0.5 5.82 0.6 6.14 0.8 6.53
235 0.1 5.43 0.2 5.58 0.4 5.82 0.6 6.14 0.7 6.53
240 0.1 5.43 0.2 5.58 0.3 5.82 0.5 6.14 0.6 6.53
245 0.1 5.43 0.2 5.58 0.3 5.82 0.4 6.14 0.5 6.53
250 0.1 5.43 0.1 5.58 0.2 5.82 0.3 6.14 0.4 6.53
20 180 0.4 5.43 0.7 5.58 1.1 5.82 1.5 6.14185 0.3 5.43 0.7 5.58 1.0 5.82 1.4 6.14
190 0.3 5.43 0.6 5.58 1.0 5.82 1.3 6.14
195 0.3 5.43 0.6 5.58 0.9 5.82 1.2 6.14
200 0.3 5.43 0.6 5.58 0.9 5.82 1.2 6.14
205 0.3 5.43 0.5 5.58 0.8 5.82 1.1 6.14
210 0.2 5.43 0.5 5.58 0.8 5.82 1.0 6.14
215 0.2 5.43 0.4 5.58 0.7 5.82 0.9 6.14
220 0.2 5.43 0.4 5.58 0.6 5.82 0.9 6.14
225 0.2 5.43 0.4 5.58 0.6 5.82 0.8 6.14
230 0.2 5.43 0.3 5.58 0.5 5.82 0.7 6.14
235 0.1 5.43 0.3 5.58 0.5 5.82 0.6 6.14
240 0.1 5.43 0.3 5.58 0.4 5.82 0.5 6.14

8/10/2019 n We a 2011 Norms Report
http://slidepdf.com/reader/full/n-we-a-2011-norms-report 259/268
N W E A 2 0 1 1 R I T S c a l e N o r m s | 243
Table C.46. Means (M) and Standard Deviations (sd) of Academic Grow th by Starting RIT Score and Starting Inst ruct ional Week for VariousEnding Instructional Weeks - SCIENCE CONCEPTS & PROCESSES, GRADE 9
Ending Instruction al Weeks
Start Prior Grd Focal Grade
Inst. Start 36 4 8 12 16 20 24 28 32 36
Wk RIT M sd M sd M sd M sd M sd M sd M sd M sd M sd M sd
245 0.1 5.43 0.2 5.58 0.3 5.82 0.5 6.14
250 0.1 5.43 0.2 5.58 0.3 5.82 0.4 6.14
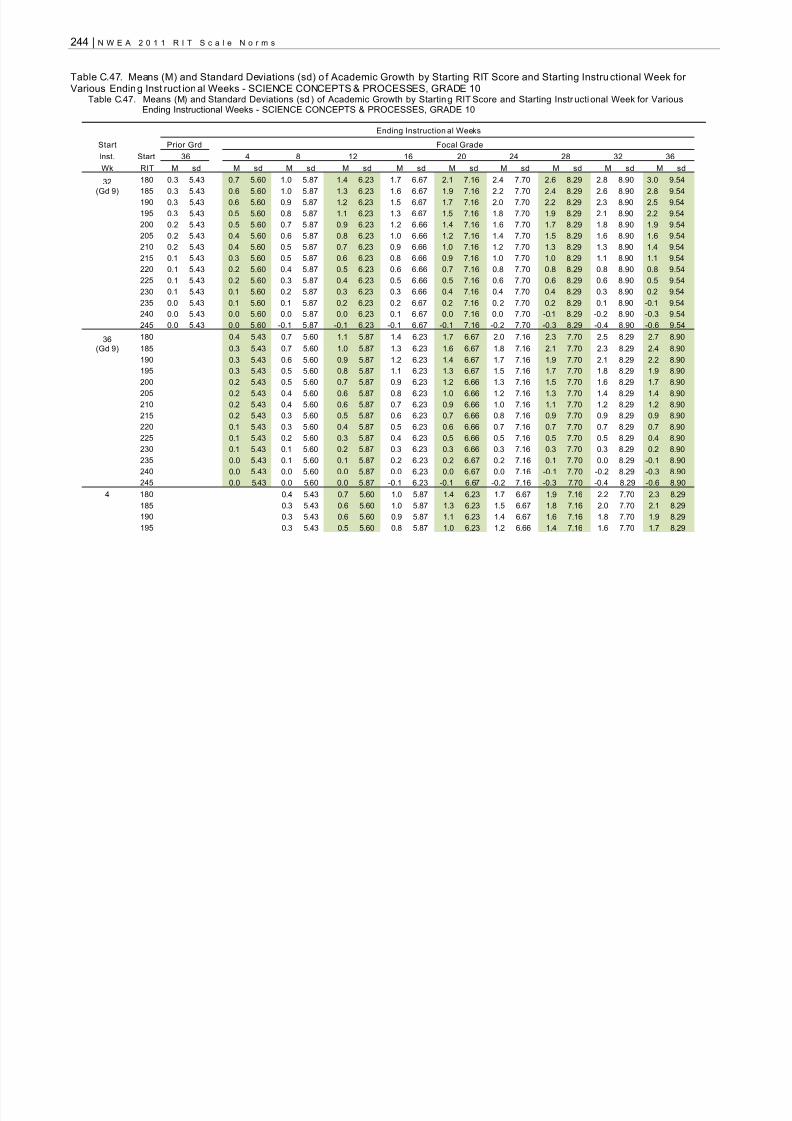
8/10/2019 n We a 2011 Norms Report
http://slidepdf.com/reader/full/n-we-a-2011-norms-report 260/268
244 | N W E A 2 0 1 1 R I T S c a l e N o r m s
Table C.47. Means (M) and Standard Deviations (sd) o f Academic Growth by Starting RIT Score and Starting Instru ctional Week forVarious Ending Inst ruct ional Weeks - SCIENCE CONCEPTS & PROCESSES, GRADE 10
Table C.47. Means (M) and Standard Deviations (sd ) of Academic Growth by Starting RIT Score and Starting Instr ucti onal Week for VariousEnding Instructional Weeks - SCIENCE CONCEPTS & PROCESSES, GRADE 10
Ending Instruction al Weeks
Start Prior Grd Focal Grade
Inst. Start 36 4 8 12 16 20 24 28 32 36
Wk RIT M sd M sd M sd M sd M sd M sd M sd M sd M sd M sd
32(Gd 9)
180 0.3 5.43 0.7 5.60 1.0 5.87 1.4 6.23 1.7 6.67 2.1 7.16 2.4 7.70 2.6 8.29 2.8 8.90 3.0 9.54
1850.3 5.43 0.6 5.60 1.0 5.87 1.3 6.23 1.6 6.67 1.9 7.16 2.2 7.70 2.4 8.29 2.6 8.90 2.8 9.54190 0.3 5.43 0.6 5.60 0.9 5.87 1.2 6.23 1.5 6.67 1.7 7.16 2.0 7.70 2.2 8.29 2.3 8.90 2.5 9.54
195 0.3 5.43 0.5 5.60 0.8 5.87 1.1 6.23 1.3 6.67 1.5 7.16 1.8 7.70 1.9 8.29 2.1 8.90 2.2 9.54
200 0.2 5.43 0.5 5.60 0.7 5.87 0.9 6.23 1.2 6.66 1.4 7.16 1.6 7.70 1.7 8.29 1.8 8.90 1.9 9.54
205 0.2 5.43 0.4 5.60 0.6 5.87 0.8 6.23 1.0 6.66 1.2 7.16 1.4 7.70 1.5 8.29 1.6 8.90 1.6 9.54
210 0.2 5.43 0.4 5.60 0.5 5.87 0.7 6.23 0.9 6.66 1.0 7.16 1.2 7.70 1.3 8.29 1.3 8.90 1.4 9.54
215 0.1 5.43 0.3 5.60 0.5 5.87 0.6 6.23 0.8 6.66 0.9 7.16 1.0 7.70 1.0 8.29 1.1 8.90 1.1 9.54
220 0.1 5.43 0.2 5.60 0.4 5.87 0.5 6.23 0.6 6.66 0.7 7.16 0.8 7.70 0.8 8.29 0.8 8.90 0.8 9.54
225 0.1 5.43 0.2 5.60 0.3 5.87 0.4 6.23 0.5 6.66 0.5 7.16 0.6 7.70 0.6 8.29 0.6 8.90 0.5 9.54
230 0.1 5.43 0.1 5.60 0.2 5.87 0.3 6.23 0.3 6.66 0.4 7.16 0.4 7.70 0.4 8.29 0.3 8.90 0.2 9.54
235 0.0 5.43 0.1 5.60 0.1 5.87 0.2 6.23 0.2 6.67 0.2 7.16 0.2 7.70 0.2 8.29 0.1 8.90 -0.1 9.54
240 0.0 5.43 0.0 5.60 0.0 5.87 0.0 6.23 0.1 6.67 0.0 7.16 0.0 7.70 -0.1 8.29 -0.2 8.90 -0.3 9.54
245 0.0 5.43 0.0 5.60 -0.1 5.87 -0.1 6.23 -0.1 6.67 -0.1 7.16 -0.2 7.70 -0.3 8.29 -0.4 8.90 -0.6 9.54
36(Gd 9)
180 0.4 5.43 0.7 5.60 1.1 5.87 1.4 6.23 1.7 6.67 2.0 7.16 2.3 7.70 2.5 8.29 2.7 8.90
185 0.3 5.43 0.7 5.60 1.0 5.87 1.3 6.23 1.6 6.67 1.8 7.16 2.1 7.70 2.3 8.29 2.4 8.90
190 0.3 5.43 0.6 5.60 0.9 5.87 1.2 6.23 1.4 6.67 1.7 7.16 1.9 7.70 2.1 8.29 2.2 8.90
195 0.3 5.43 0.5 5.60 0.8 5.87 1.1 6.23 1.3 6.67 1.5 7.16 1.7 7.70 1.8 8.29 1.9 8.90
200 0.2 5.43 0.5 5.60 0.7 5.87 0.9 6.23 1.2 6.66 1.3 7.16 1.5 7.70 1.6 8.29 1.7 8.90
205 0.2 5.43 0.4 5.60 0.6 5.87 0.8 6.23 1.0 6.66 1.2 7.16 1.3 7.70 1.4 8.29 1.4 8.90210 0.2 5.43 0.4 5.60 0.6 5.87 0.7 6.23 0.9 6.66 1.0 7.16 1.1 7.70 1.2 8.29 1.2 8.90
215 0.2 5.43 0.3 5.60 0.5 5.87 0.6 6.23 0.7 6.66 0.8 7.16 0.9 7.70 0.9 8.29 0.9 8.90
220 0.1 5.43 0.3 5.60 0.4 5.87 0.5 6.23 0.6 6.66 0.7 7.16 0.7 7.70 0.7 8.29 0.7 8.90
225 0.1 5.43 0.2 5.60 0.3 5.87 0.4 6.23 0.5 6.66 0.5 7.16 0.5 7.70 0.5 8.29 0.4 8.90
230 0.1 5.43 0.1 5.60 0.2 5.87 0.3 6.23 0.3 6.66 0.3 7.16 0.3 7.70 0.3 8.29 0.2 8.90
235 0.0 5.43 0.1 5.60 0.1 5.87 0.2 6.23 0.2 6.67 0.2 7.16 0.1 7.70 0.0 8.29 -0.1 8.90
240 0.0 5.43 0.0 5.60 0.0 5.87 0.0 6.23 0.0 6.67 0.0 7.16 -0.1 7.70 -0.2 8.29 -0.3 8.90
245 0.0 5.43 0.0 5.60 0.0 5.87 -0.1 6.23 -0.1 6.67 -0.2 7.16 -0.3 7.70 -0.4 8.29 -0.6 8.90
4 180 0.4 5.43 0.7 5.60 1.0 5.87 1.4 6.23 1.7 6.67 1.9 7.16 2.2 7.70 2.3 8.29
185 0.3 5.43 0.6 5.60 1.0 5.87 1.3 6.23 1.5 6.67 1.8 7.16 2.0 7.70 2.1 8.29
190 0.3 5.43 0.6 5.60 0.9 5.87 1.1 6.23 1.4 6.67 1.6 7.16 1.8 7.70 1.9 8.29
195 0.3 5.43 0.5 5.60 0.8 5.87 1.0 6.23 1.2 6.66 1.4 7.16 1.6 7.70 1.7 8.29

8/10/2019 n We a 2011 Norms Report
http://slidepdf.com/reader/full/n-we-a-2011-norms-report 261/268
N W E A 2 0 1 1 R I T S c a l e N o r m s | 245
Table C.47. Means (M) and Standard Deviations (sd ) of Academic Growth by Starting RIT Score and Starting Instr ucti onal Week for VariousEnding Instructional Weeks - SCIENCE CONCEPTS & PROCESSES, GRADE 10
Ending Instruction al Weeks
Start Prior Grd Focal Grade
Inst. Start 36 4 8 12 16 20 24 28 32 36
Wk RIT M sd M sd M sd M sd M sd M sd M sd M sd M sd M sd
200 0.2 5.43 0.5 5.60 0.7 5.87 0.9 6.23 1.1 6.66 1.3 7.16 1.4 7.70 1.4 8.29
205 0.2 5.43 0.4 5.60 0.6 5.87 0.8 6.23 1.0 6.66 1.1 7.16 1.2 7.70 1.2 8.29
210 0.2 5.43 0.4 5.60 0.5 5.87 0.7 6.23 0.8 6.66 0.9 7.16 1.0 7.70 1.0 8.29
215 0.2 5.43 0.3 5.60 0.5 5.87 0.6 6.23 0.7 6.66 0.8 7.16 0.8 7.70 0.8 8.29
220 0.1 5.43 0.3 5.60 0.4 5.87 0.5 6.23 0.5 6.66 0.6 7.16 0.6 7.70 0.6 8.29
225 0.1 5.43 0.2 5.60 0.3 5.87 0.4 6.23 0.4 6.66 0.4 7.16 0.4 7.70 0.3 8.29
230 0.1 5.43 0.1 5.60 0.2 5.87 0.2 6.23 0.3 6.66 0.2 7.16 0.2 7.70 0.1 8.29
235 0.0 5.43 0.1 5.60 0.1 5.87 0.1 6.23 0.1 6.67 0.1 7.16 0.0 7.70 -0.1 8.29
240 0.0 5.43 0.0 5.60 0.0 5.87 0.0 6.23 0.0 6.67 -0.1 7.16 -0.2 7.70 -0.4 8.29
245 0.0 5.43 0.0 5.60 -0.1 5.87 -0.1 6.23 -0.2 6.67 -0.3 7.16 -0.4 7.70 -0.6 8.29
8 180 0.4 5.43 0.7 5.60 1.0 5.87 1.3 6.23 1.6 6.67 1.8 7.16 2.0 7.70
185 0.3 5.43 0.6 5.60 0.9 5.87 1.2 6.23 1.4 6.67 1.6 7.16 1.8 7.70
190 0.3 5.43 0.6 5.60 0.8 5.87 1.1 6.23 1.3 6.67 1.5 7.16 1.6 7.70
195 0.3 5.43 0.5 5.60 0.8 5.87 1.0 6.23 1.2 6.66 1.3 7.16 1.4 7.70
200 0.2 5.43 0.5 5.60 0.7 5.87 0.9 6.23 1.0 6.66 1.1 7.16 1.2 7.70
205 0.2 5.43 0.4 5.60 0.6 5.87 0.8 6.23 0.9 6.66 1.0 7.16 1.0 7.70
210 0.2 5.43 0.4 5.60 0.5 5.87 0.6 6.23 0.7 6.66 0.8 7.16 0.8 7.70
215 0.2 5.43 0.3 5.60 0.4 5.87 0.5 6.23 0.6 6.66 0.6 7.16 0.6 7.70
220 0.1 5.43 0.2 5.60 0.3 5.87 0.4 6.23 0.5 6.66 0.5 7.16 0.4 7.70
225 0.1 5.43 0.2 5.60 0.3 5.87 0.3 6.23 0.3 6.66 0.3 7.16 0.2 7.70
230 0.1 5.43 0.1 5.60 0.2 5.87 0.2 6.23 0.2 6.66 0.1 7.16 0.0 7.70
235 0.0 5.43 0.1 5.60 0.1 5.87 0.1 6.23 0.0 6.67 -0.1 7.16 -0.2 7.70240 0.0 5.43 0.0 5.60 0.0 5.87 0.0 6.23 -0.1 6.67 -0.2 7.16 -0.4 7.70
245 0.0 5.43 0.0 5.60 -0.1 5.87 -0.2 6.23 -0.3 6.67 -0.4 7.16 -0.6 7.70
12 180 0.3 5.43 0.7 5.60 1.0 5.87 1.2 6.23 1.5 6.67 1.6 7.16
185 0.3 5.43 0.6 5.60 0.9 5.87 1.1 6.23 1.3 6.67 1.5 7.16
190 0.3 5.43 0.6 5.60 0.8 5.87 1.0 6.23 1.2 6.67 1.3 7.16
195 0.3 5.43 0.5 5.60 0.7 5.87 0.9 6.23 1.0 6.66 1.1 7.16
200 0.2 5.43 0.4 5.60 0.6 5.87 0.8 6.23 0.9 6.66 1.0 7.16
205 0.2 5.43 0.4 5.60 0.5 5.87 0.7 6.23 0.8 6.66 0.8 7.16
210 0.2 5.43 0.3 5.60 0.5 5.87 0.6 6.23 0.6 6.66 0.6 7.16
215 0.1 5.43 0.3 5.60 0.4 5.87 0.4 6.23 0.5 6.66 0.5 7.16
220 0.1 5.43 0.2 5.60 0.3 5.87 0.3 6.23 0.3 6.66 0.3 7.16
225 0.1 5.43 0.2 5.60 0.2 5.87 0.2 6.23 0.2 6.66 0.1 7.16

8/10/2019 n We a 2011 Norms Report
http://slidepdf.com/reader/full/n-we-a-2011-norms-report 262/268
246 | N W E A 2 0 1 1 R I T S c a l e N o r m s
Table C.47. Means (M) and Standard Deviations (sd ) of Academic Growth by Starting RIT Score and Starting Instr ucti onal Week for VariousEnding Instructional Weeks - SCIENCE CONCEPTS & PROCESSES, GRADE 10
Ending Instruction al Weeks
Start Prior Grd Focal Grade
Inst. Start 36 4 8 12 16 20 24 28 32 36
Wk RIT M sd M sd M sd M sd M sd M sd M sd M sd M sd M sd
230 0.1 5.43 0.1 5.60 0.1 5.87 0.1 6.23 0.1 6.66 0.0 7.16
235 0.0 5.43 0.0 5.60 0.0 5.87 0.0 6.23 -0.1 6.67 -0.2 7.16
240 0.0 5.43 0.0 5.60 -0.1 5.87 -0.1 6.23 -0.2 6.67 -0.4 7.16
245 0.0 5.43 -0.1 5.60 -0.1 5.87 -0.2 6.23 -0.4 6.67 -0.6 7.16
16 180 0.3 5.43 0.6 5.60 0.9 5.87 1.1 6.23 1.3 6.67
185 0.3 5.43 0.6 5.60 0.8 5.87 1.0 6.23 1.2 6.67
190 0.3 5.43 0.5 5.60 0.7 5.87 0.9 6.23 1.0 6.67
195 0.2 5.43 0.5 5.60 0.6 5.87 0.8 6.23 0.9 6.67
200 0.2 5.43 0.4 5.60 0.6 5.87 0.7 6.23 0.7 6.66
205 0.2 5.43 0.3 5.60 0.5 5.87 0.6 6.23 0.6 6.66
210 0.2 5.43 0.3 5.60 0.4 5.87 0.4 6.23 0.5 6.66
215 0.1 5.43 0.2 5.60 0.3 5.87 0.3 6.23 0.3 6.66
220 0.1 5.43 0.2 5.60 0.2 5.87 0.2 6.23 0.2 6.66
225 0.1 5.43 0.1 5.60 0.1 5.87 0.1 6.23 0.0 6.66
230 0.0 5.43 0.1 5.60 0.1 5.87 0.0 6.23 -0.1 6.66
235 0.0 5.43 0.0 5.60 0.0 5.87 -0.1 6.23 -0.2 6.67
240 0.0 5.43 -0.1 5.60 -0.1 5.87 -0.2 6.23 -0.4 6.67
245 0.0 5.43 -0.1 5.60 -0.2 5.87 -0.3 6.23 -0.5 6.67
20 180 0.3 5.43 0.6 5.60 0.8 5.87 1.0 6.23
185 0.3 5.43 0.5 5.60 0.7 5.87 0.9 6.23
190 0.2 5.43 0.5 5.60 0.6 5.87 0.8 6.23
195 0.2 5.43 0.4 5.60 0.5 5.87 0.6 6.23200 0.2 5.43 0.3 5.60 0.5 5.87 0.5 6.23
205 0.2 5.43 0.3 5.60 0.4 5.87 0.4 6.23
210 0.1 5.43 0.2 5.60 0.3 5.87 0.3 6.23
215 0.1 5.43 0.2 5.60 0.2 5.87 0.2 6.23
220 0.1 5.43 0.1 5.60 0.1 5.87 0.1 6.23
225 0.1 5.43 0.1 5.60 0.0 5.87 0.0 6.23
230 0.0 5.43 0.0 5.60 -0.1 5.87 -0.1 6.23
235 0.0 5.43 -0.1 5.60 -0.1 5.87 -0.3 6.23
240 0.0 5.43 -0.1 5.60 -0.2 5.87 -0.4 6.23
245 -0.1 5.43 -0.2 5.60 -0.3 5.87 -0.5 6.23

8/10/2019 n We a 2011 Norms Report
http://slidepdf.com/reader/full/n-we-a-2011-norms-report 263/268
N W E A 2 0 1 1 R I T S c a l e N o r m s | 247
Appendix D - Technical Details of Obtaining Statusand Conditional Growth Norms Using aMulti-level Growth Model
A Polynomial Growth Model
Suppose that student i took a test on weekit
W after instruction began in the grade prior to his focal
grade level. Further suppose we wish to benchmark performance at week 0W . To bring in the information
about instructional and testing schedules, we propose using the polynomial equation
Level 1:2 3
0 1 0 2 0 3 0( ) ( ) ( )it i i it i it i it it y b b W W b W W b W W e= + × − + × − + × − + (1)
to describe scores of student i as a function of instructional time. Initial explorations of the model
suggested that the residuals [ ]1 2, ,...i ie e are uncorrelated over time. In this equation, 0ˆ
ib is the estimated
performance status after 0W weeks of instruction and 1 2 3, ,ˆ ˆ ˆi i ib b b
are the linear, quadratic, and cubic
terms in the polynomial growth model. If the polynomial takes a non-linear form, the growth rate is not a
constant that is independent of time but is now contingent on when the observation is made. The
student’s instantaneous growth rate may be estimated as
2 31 0 2 0 3 0ˆ ˆ ˆ( ) .) ( ( )
i it i it i it b W W b W W b W W × − + × − + × −
If we believe that students learn at different rates, we may extend the above model to allow student
growth coefficients 0 1 2 3, , ,ˆ ˆ ˆ ˆi i i ib b b b
to vary in the population, as in
Level 2: 0 00 0 1 10 1 2 20 2 3 30 3, , , and .i i i i i i i ib u b u b u b uγ γ γ γ = + = + = + = + (2)
We have employed a model for which ( ) ( )2 3 0i i
Var u Var u= = instead, because we have found little
evidence that the quadratic and cubic components in the polynomial vary across students during the span
of the “growth window” considered. Thus, the Level 2 model employed in the study is
0 00 0 1 10 1 2 20 3 30, , , andi i i i i ib u b u b bγ γ γ γ = + = + = = (3)
instead. The random effects [ ]0 1,i iu u are assumed to be distributed bi-variate normal with means [ ]0,0
and variance-covariance matrix 00 01
10 11
τ τ
τ τ
=
T . Under this model, student growth rate continues to vary
with time, but differences in shape between growth trajectories will be more muted. The functional form of

8/10/2019 n We a 2011 Norms Report
http://slidepdf.com/reader/full/n-we-a-2011-norms-report 264/268
248 | N W E A 2 0 1 1 R I T S c a l e N o r m s
the above model appears to describe achievement scores over instructional days well, and showed only
minor to moderate variations in parameter estimates, across grade levels and subject matter. See
Huttenlocher, Haight, Bryk, Seltzer, & Lyons (1991) for a simple application of a multi-level growth curve
for describing child vocabulary development. A more complete treatment is found in Raudenbush and
Bryk (2002, Chapter 4).
Using Observed Scores as Outcomes
NWEA’s MAP test scores, like those provided by many other testing programs, are reported along with
estimates of their standard errors of measurement (SEMs). SEMs provide users with some indication of
score reliability. SEMs are important to the interpretation of observed performance because the observed
test score is an estimate of a student’s “true” score, a fact that is commonly ignored when test scores are
evaluated. Consequences of this practice may be substantial. For example, a simple comparison, such as
whether an observed test score exceeds a passing score (as represented by cut-score on the same
scale) has strong support when the observed score is more than 2 SEMs higher than the cut-score.
Concluding that the student exceeds the criterion just because his observed score is greater than the cut-
score is hard to defend because the decision ignores the information provided by the SEM of the score.
Note that an observed score that is at the cut-score represents passing at no better than chance level;
i.e., only 50% of the scores the student received under repeated testing can be expected to meet or
exceed the passing score.
In more complex analyses, such as estimating the average score for students in a classroom, the result of
treating the observed score as the true score itself is that errors of measurement are ignored and
inferences are then based only on sampling error. The problem is compounded when scores entering into
an aggregate are estimated with different levels of precision. Depending on the relative magnitudes of
measurement errors and their joint distribution with observed scores, such misspecification in the error
structure of the model may result in biased estimates and poor estimates of precision (Thum & Xiang,
2010, Appendix A).
To address this issue, the following adjustment to Equation (1) presents a solution. If the model describes
changes well enough in that only measurement error remains, then it is plausible to assume that the
square of the SEM, 2
it s , for an observed score it y is a good estimate of the residual variance ( )it Var e .
This suggests that we weigh Equation (1) for the observed scores in the growth model by their individual
levels of precision. Specifically, Equation (1) is re-scaled by1 it s , resulting in
2 30 0 0
0 1 2 3
( ) ( ) (1 ),it it i
it it it
t it it i i i
it it
i
it s s s s
y W W W W W W eb b
s sb b
−+
− −= + + + (3)

8/10/2019 n We a 2011 Norms Report
http://slidepdf.com/reader/full/n-we-a-2011-norms-report 265/268
N W E A 2 0 1 1 R I T S c a l e N o r m s | 249
where, ( ) 2 1.0it it Var e s = . The re-scaling does not affect other components of the model as given by
Equation Error! Reference source not found.. However, estimation would require the ability to constrain
the residual error variance in the multilevel model to a fixed value.
EstimationGrilli and Pratesi (2004, Appendix A) advised that student-level (our level 2) population weights obtained
from our post-stratification analysis may be effected using the REPLICATE statement of PROC
NLMIXED. Because that REPLICATE statement accepts only positive integer values, weights are first
scaled by a sufficiently large positive multiplier k . This “trick” relies on the fact that multiplying the level 2
weights by a constant does not affect point estimates, only their sampling variance-covariance matrix
(and so their standard errors). The correct sampling variance-covariance matrix may be easily recovered,
however, by multiplying it by the constant k .
Achievement Norms
Combining the Level 1 and 2 models, given by Equations (3) and Error! Reference source not found.
above, results in the SEM-scaled mixed-effects equation
( ) ( ) ( ) ( ) ( )
2 3
0 0 0
00 0 10 1 20 30 ,1 it it it
it it
it i
it it it t
t
i
i is s s
W W W W W W y eu
su
s sγ γ γ γ
− − − = + + + + + +
(4)
from which the predicted mean status at instructional weekit
W may be given as
( ) ( ) ( )2 3
00 10 0 20 30 0 0ˆ ˆE( ˆ ˆ)|it it it it it y W W W W W W W γ γ γ γ = × ×+ − + × − + − (5)
with sampling variance of the predicted score,
( ) ( )* *2 *3 * *2 *3ˆVar E | 1 Var 1 ,it it it it it it it i t y W W W W W W W
′ = γ (6)
after re-writing*
0it it W W W =− . ( )ˆVar γ is the sampling variance-covariance matrix of the fixed-effects
estimates [ ]00 10 20 30ˆ ˆ ˆ ˆ, , , ,γ γ γ γ . The sampling variance of the predicted score can be made arbitrarily small,
as it is a function of sample size. The predicted variance of an observed score atit
W is much larger,
however,
( ) ( ) * * 2ˆVar | Var E | 1 1it it it it it it i t
y W y W W W s′ = + + T (7)
as it takes into account both its conditional sampling variance about the mean as well as its (known)
measurement error variance 2
it s .

8/10/2019 n We a 2011 Norms Report
http://slidepdf.com/reader/full/n-we-a-2011-norms-report 266/268
250 | N W E A 2 0 1 1 R I T S c a l e N o r m s
As it is clear from Equation (7) above, the results for the predicted variance of an observed score atit
W
depended not only onit
W but also on its SEM, it s . We denote the predicted standard deviation of a
student’s observed score, the square-root of its predicted variance, as
( ) ( )SD | = Var | .it it it it y W y W (8)
The predicted percentile for a student’s observed score and SEM ( , )it it y s may then be computed from the
normal cumulative distribution function ( )it d Φ , where
( )
( )
E |.
SD |it it it
it
it it
y y W d
y W
−= (9)
As compared with norm reports in the past, the present approach provides the relevant information for a
student’s observed performance characterized not only by his observed score it y at
it W but also by the
known standard error of measurement, it s . As a consequence, it is somewhat unwieldy to convey the
clearly richer information from this approach by tabulations alone. A spreadsheet has been coded to
estimate the true status of a student based on his observed performance, the SEM for the observed
score, and the point in the instructional calendar at which testing occurred.
Conditional Growth Norms
Under the model, the achievement level from the first test 0ib and the linear term of the polynomial growth
curve 1ib co-vary as
0 00 00 01
1 10 10 11
, .i
i
b MVN
b
γ τ τ
γ τ τ
A description of “true” growth in relation to “true” initial status, both being latent variables in the model,
may be expressed as a latent variable regression (LVR) model
* *1 10 11 0 00 1( ,)i i ib a a b uγ
°= + × − + (10)
where it is easily shown that ( )101 10 0 00
00
i ib bτ
γ γ
τ
∗ = + − and2
* 101 11 11
00
( )iVar b τ
τ τ
τ
∗= = − . From the above
equations, we deduce that 10 10a γ = and 11 10 00/a τ τ = . Note further that the residual error*1i
u in the LVR
model measures that portion of the linear term not predicted from knowing the student’s true status at
Week 30.*1i
u is distributed ( )*110, N τ , and the covariance between 0iu and
*1i
u is now 0. See Raudenbush
and Bryk (2002, Chapter 11) for a more complete treatment. More complex LVR investigations between
initial status and growth rates are found in Thum (2002) and Seltzer, Choi, and Thum (2003).

8/10/2019 n We a 2011 Norms Report
http://slidepdf.com/reader/full/n-we-a-2011-norms-report 267/268
N W E A 2 0 1 1 R I T S c a l e N o r m s | 251
The approach employed here supports inferences about a student’s expected “true” learning growth
between any two points on the instructional calendar based on a rather conventional multilevel
description of changes in achievement over time. Furthermore, the description would also take into
account the initial performance status, as well as the standard errors of measurement accompanying the
observed scores. We begin by noting that the learning gain as measured between the initial time point,
it W , on the instructional calendar by the status performance ( , )it it y s and the follow-up time point, , 1i t W + ,
on the instructional calendar by the second status measurement , 1 , 1( , )i t i t y s+ + has expectation given by
( ) ( ) ( )
( ) ( )
* *, 1 0 , 1 10 11 0 00 ,
20 30
1 ,
*2 *2 *3 *3, 1 , , 1 ,
| ,
ˆ ˆ
ˆˆ ˆE ,
,
i t it i it i t i i t i t
i t i t i t i t
y y b W W a a b W W
W W W W
γ
γ γ
+ + +
+ +
− = + × − × −
+ × − + × −
(11)
with sampling variance for the predicted gain given by
( ) ( ), 1 0 , 1 10 11 20 30ˆ ˆˆ ˆVar E , Var , , ,| ,,i t it i it i t i i y y b W W a a γ γ + +
′= − z z
(12)
where ( ) ( )* * * * *2 *2 *3 *3, 1 , 0 00 , 1 , , 1 , , 1 ,
ˆ .i i t i t i i t i t i t i t i t i t W W b W W W W W W γ + + + + = − − × − − − z
Finally, the predicted
variance of an observed gain, ( ), 1 , 1Var | ,i t it it i t y y W W + +− , is given by
( ) ( ) ( )2* * * 2 2
0, 1 , 11 , 1 1 , 1ˆVar E | , , .i t it it i t i i t i t it i t b W y y sW W sW τ + + + +
− + − × + + (13)
Just as for achievement status norms, we may now define the conditional growth norms for a student who
scored ( , )it it y s at the initial time pointit
W and , 1 , 1( , )i t i t y s+ + at a later time , 1i t W + . Setting it y as your best
estimate of the student’s “true” score from the first evaluation, i.e., assuming that 0i it b y=, we obtain an
estimate of the predicted conditional growth standard deviation, given by
( ) ( ), 1 , 1 , 1 , 1SD | , , Var | , , ,i t it i t it i t i t it i t it i t y y y W W y y y W W + + + +− = − (14)
and the conditional growth percentile for the student is obtained from the normal cumulative distribution
function ( )it gΦ , where
( ) ( )( )
, 1 , 1 , 1
, 1 , 1
E | , ,
SD | , ,
i t it i t it it it i t
it
i t it it it i t
y y y y y W W g
y y y W W
+ + +
+ +
− − −=
− (15)

8/10/2019 n We a 2011 Norms Report
http://slidepdf.com/reader/full/n-we-a-2011-norms-report 268/268
252 | N W E A 2 0 1 1 R I T S c a l e N o r m s
is the conditional growth index (CGI), measuring the normative gain made by a typical student with pre-
test information as characterized by [ ],,it i t t i y s W and post-test information as characterized by
, 1 , 1 , 1,,i it t t i W y s + ++ . it g is also the point-growth effect-size in Thum &and Bowe (2009) and in Thum &