N Recommended Carbon Dioxide and Relative Humidity · PDF file · 2011-05-15N...
36
DuGC FILE COPY AFOEHI REPORT 90-169CAOOI1I1IKGA N Recommended Carbon Dioxide and Relative Humidity Levels for Maintaining Acceptable Indoor Air Quality DAVID CARPENTER, Capt, USAF, BSC BRUCE J. POITRAST, Col, USAF, MC, FS OCTOBER 1990 DTIC E 027 .U Final Report Distribution Is unlimited; approved for public relese AF Occupational and Environmental Health Laboratory (AFSC) Human Systems Division Brooks Air Force Base, Texas 78235-5501 90) 12 26 084
-
Upload
nguyenhanh -
Category
Documents
-
view
218 -
download
1
Transcript of N Recommended Carbon Dioxide and Relative Humidity · PDF file · 2011-05-15N...
DuGC FILE COPY
AFOEHI REPORT 90-169CAOOI1I1IKGA
N Recommended Carbon Dioxide andRelative Humidity Levels for
Maintaining Acceptable Indoor Air Quality
DAVID CARPENTER, Capt, USAF, BSCBRUCE J. POITRAST, Col, USAF, MC, FS
OCTOBER 1990 DTICE027 .U
Final Report
Distribution Is unlimited; approved for public relese
AF Occupational and Environmental Health Laboratory (AFSC)Human Systems Division
Brooks Air Force Base, Texas 78235-5501
90) 12 26 084
NOTICES
When Government drawings, specifications, or other data are used for any purposeother than a definitely related Government procurement operation, the Governmentincurs no responsibility or any obligation whatsoever. The fact that theGovernment may have formulated, or in any way supplied the drawing, specifica-tions, or other data, is not to be regarded by implication, or otherwise, as inany manner licensing the holder or any other person or corporation; or conveyingany rights or permission to manufacture, use, or sell any patented inventionthat may in any way be related thereto.
The mention of trade names or commercial products in this publication is forillustration purposes and does not constitute endorsement or recommendation foruse by the United States Air Force.
The Public Affairs Office has reviewed this report, and It is releasable to theNational Technical Information Service, where it will be available to thegeneral public, including foreign nations.
This report has been reviewed and is approved for publication.
Air Force installations may direct requests for copies of this report to: AirForce Occupational and Environmental Health Laboratory (AFCEHL) Library, BrooksAFB TX 78235-5501.
Other Government agencies and their contractors registered with the DTIC shoulddirect requests for copies of this report to: Defense Technical InformationCenter (DTIC), Cameron Station, Alexandria VA 22304-6145.
Non-Government agencies may purchase copies of this report from: NationalTechnical Information Service (NTIS), 5285 Port Royal Road, Springfield VA 22161
DAVID CARPENTER, Capt, USAF, BSC BRUCE J. POITRAST, Col, USAF, MC, FSChief, Exposure Assessment Function Chief, Scientist
Form Approved
REPORT DOCUMENTATION PAGE OMB No 0740788
Puthic eoor,- tiv de f-QC ti, n )f nto-rat.an ~stif~ t~m t-o .hPi- ," "0 -- 1r .O i",fl -, PA .11 110,ti , C)n s -r' V S " data Soutr.$gathe 9 nlInd t he Jtta needed i, end 5. n . "" .fle'' .> " mit m' ,rmmia mont rPjdn n l De10! .*m te )f f t '- th e t i t of -This(oltecton I' ,n 'rma I On nmluaing suggest ns',, edru,ng'tmas Di ,m' A isn tin caoq t.ttPS ,w".e,, 0 mO'oiat " ,rn'''tatmn r)O'itt(Pt j'iQ ico ,. 25 etiersonDa~s 4 h aa Suite i204 tir"9ton,A 222024102 ted tot-
)' O'if i m' M a mno nd hudget Pmprc. Rdu, tin 1 ' T !Ir4 0185) r, 't C it 20503
1. AGENCY USE ONLY (Leave blank) 2. REPORT DATE 3. REPORT TYPE AND DATES COVERED
Final4. TITLE AND SUBTITLE 5. FUNDING NUMBERS
Recommended Carbon Dioxide and RelativeHumidity Levels for Maintaining AcceptableIndoor Air Quality
6. AUTHOR(S)
David Carpenter, Capt, USAF, BSC
7. PERFORMING ORGANIZATION NAME(S) AND ADDRESS(ES) 8. PERFORMING ORGANIZATIONREPORT NUMBER
AF Occupational and Environmental Health Laboratory " AFOEHL ReportBrooks AFB TX 78235-5501 90-169CA00111KGA
9. SPONSORING/MONITORING AGENCY NAME(S) AND ADDRESS(ES) 10. SPONSORING, MONITORINGAGENCY REPORT NUMBER
Same as Blk 7
11. SUPPLEMENTARY NOTES
12a. DISTRIBUTION AVAILABILITY STATEMENT 12b. DISTRIBUTION CODE
Statement A. Unlimited, approved for public release
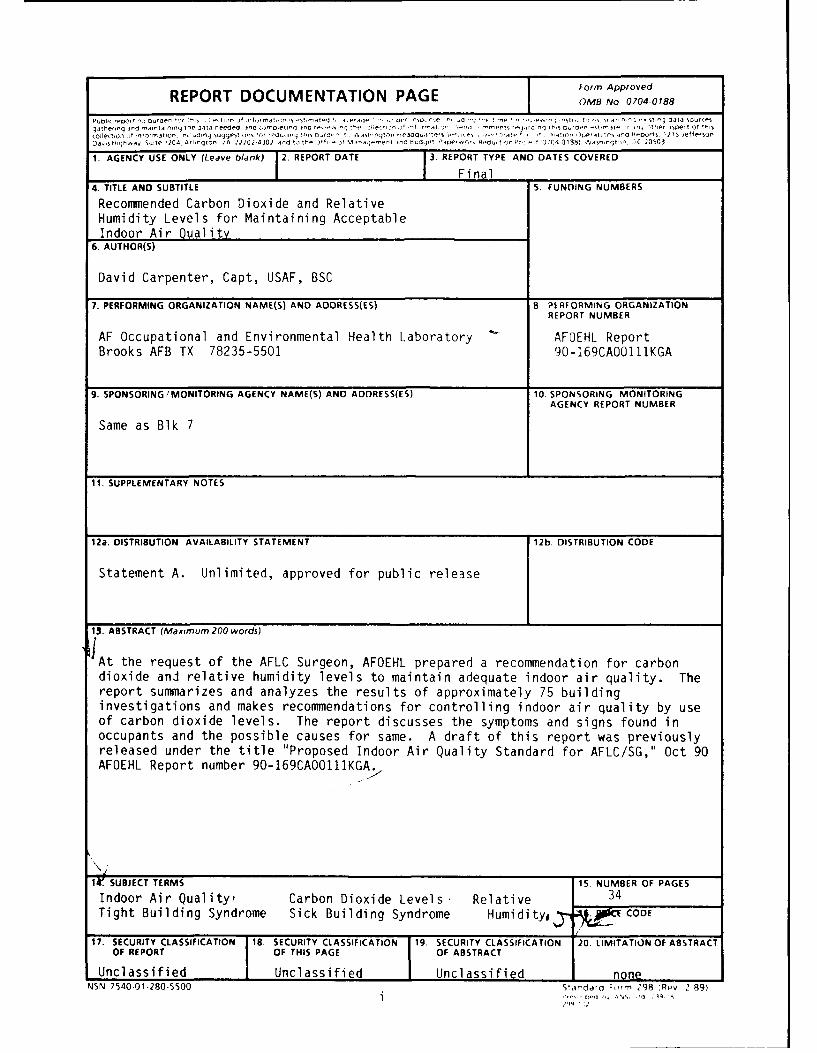
13. ABSTRACT (Maximum 200 words)IAt the request of the AFLC Surgeon, AFOEHL prepared a recommendation for carbondioxide and relative humidity levels to maintain adequate indoor air quality. Thereport summarizes and analyzes the results of approximately 75 buildinginvestigations and makes recommendations for controlling indoor air quality by useof carbon dioxide levels. The report discusses the symptoms and signs found inoccupants and the possible causes for same. A draft of this report was previouslyreleased under the title "Proposed Indoor Air Quality Standard for AFLC/SG," Oct 90AFOEHL Report number 90-169CAOO111KGA.
W SUBJECT TERMS 15. NUMBER OF PAGES
Indoor Air Quality, Carbon Dioxide Levels. Relative 34Tight Building Syndrome Sick Building Syndrome Humidity X -U CODE
17. SECURITY CLASSIFICATION 18. SECURITY CLASSIFICATION 19. SECURITY CLASSIFICATION 20. LIMITATION OF ABSTRACTOF REPORT OF THIS PAGE OF ABSTRACT
Unclassified Unclassified Unclassified noneNSN 7540-01-280-5500 Star'dard P-rm 298 (Rpv 2 89)

(This page left blank)
ii

Preface
The Air Force Occupational and Environmental Health Laboratory has beeninvestigating indoor air quality complaints for four years. We have establisheda data base which includes measures of carbon dioxide, relative humidity,organic vapors, and physical agents and the s mptoms associated with them. Wehave also measured fresh and total air flow rates in these facilities. As aresult of our findings we have recommended indoor air quality standards for theAir Force and developed a standardized method of investigation and management ofindoor air quality problems.
We will discuss our standard approach and our findings to date, including atrend analysis of the causes of indoor air quality complaints. Our approachconsists of simultaneous assessments by a health care provider, public healthofficer and industrial hygienist. The protocol allows the complete assessmentof most buildings in less than two days. The cornerstone of our method involvesthe use of a standardized questionnaire which is analyzed on site with the useof Epi Info software provided by CDC. We have found that the trend of acombination of symptoms relates to levels of carbon dioxide and relativehumidity. djusting these levels usually eliminates the complaints. In themajority oi instances we have not found chemical or biological sampling to be ofany value. Eliminating these two requirements, except where symptoms warrantthem, greatly decreases the cost and time involved in doing investigations.
DTIC TAB 1Unannounced (Justifioetle-
ByDistrlbutlon/
Availability Co6..Avail aneor
Dist SpeoirI"

Contents
Page
SF 298 iPreface iii
I. Introduction 1
II. Discussion 2
III. Conclusions 12
IV. Recommendantions 13
Bibliography 15
Appendix
A Statistical Analysis of Survey Data 17
B Calculation of Minimum Fresh Air Flow 21
C Questionnaire 25
Distribution List 29
iv

I. INTRODUCTION
A. American Society of Heating, Refrigeration and Air ConditioningEgineers (ASHRAE) Standard 62-1989 defines acceptable indoor air quality as,"Air in which there are no known contaminants at harmful concentrations asdetermined by cognizant authorities and with which a substantial majority (80%or more) of the people exposed do not express dissatisfaction" (ASHRAEStandard 62-1989, paragraph 3). This statement sets the air qualitystandard. The standard set is qualitative, that is, it is not dependent onany particular measured level of any substance. It defines acceptable air asthat air which does not promote ill health and, beyond simply not causingillness, it must be acceptable to 80% or more of the population exposed. Inanother section, paragraph 6.1.3, the statement is made that "Comfort (odor)criteria are likely to be satisfied if the ventilation rate is set so that1000 ppm CO2 is not exceeded." We believe the standard as stated by ASHRAE iswell done, and have no difference of opinion whatever with its goals andobjectives - healthy, comfortable and productive human beings. The secondstatement is not standard setting. It is a statement of belief, based onengineering experience, that comfort criteria and odor criteria are likely tobe met if the level of carbon dioxide is kept at abo--ut 1000 ppm. Thisstatement does not reflect on health, nor does it set 1000 ppm as a criterionto be adhered to. It says it is a guide to be used as a rough measure ofappropriate ventilation rates. A number this loosely set is not a definitivedesign criterion. It is with this number that we do not agree. We do notbelieve that health, comfort or optimum productivity are served when carbondioxide is at that level. This report provides health, productivity and costinformation which we believe justifies using ventilation rates which will keepthe carbon dioxide level at 600 ppm or lower. It has been our experiencethat buildings run at 1000 ppm do not satisfy anything like 80% of thepopulation. They appear to satisfy 20% or less. The purpose of this reportis to refine the level of carbon dioxide used as a guide for adequateventilation.
B. Indoor air quality has been a problem for centuries. The followingquote is attributed to Benjamin Franklin by Woods and Morey.(1)
"I considered (fresh air) an enemy, and closed withextreme care every crevice in the room I inhabited.Experience has convinced me of my error. I am persuadedthat no common air from without is so unwholesome as theair within a close room that has been often breathed andnot changed. You physicians have of late happilydiscovered, after a contrary opinion had prevailed someages, that fresh and cool air does good to persons in thesmallpox and other fevers. It is hoped that, in anothercentury or two we may find out that it is not bad even forpeople in health."
The two centuries have passed. It is time for physicians to remember, andengineers and architects to learn the lesson that Franklin learned thosecenturies ago. Fresh air is good for people and stale air is bad. The resultof poor air quality is lost productivity, and in some cases, frank illnessamong employees. It is estimated that the number of buildings affected bypoor indoor air quality may be as high as 50% of all buildings and that these
1
buildings effect 25% to 40% of all employed persons in the United States.This is a large public health problem.(3) Many heating, ventilating and airconditioning systems in the Air Force are presently reaching the end of theiruseful life. There is an immediate need for guidelines for air quality whichcan be used to estimate design and operational requirements so that we canpurchase replacement equipment which will better meet our needs.
C. The indoor air quality (IAQ) problem has accelerated since the middle1970s. The problcm became noticeable coincident with the inception of the oilprice ioduced energy conservation program. As a result of that program,design and operational parameters for ventilation have focused too narrowly onbuilding temperature and energy consumption and not enough on providing bothadequate air quality and comfort control. As the ASHRAE Standard states,engineering efforts should be used to optimize health, comfort andproductivity factors. Only then can we know if energy is being appropriatelyconsumed.
II. DISCUSSION
A. The recommended amount of outside air per person has fluctuatedconsiderably over the years. Originally it was based on the amount of airnecessary to control odor from human effluent. In the early 1900s, therecommendation was for 30 cubic feet per minute (cfm) per person of outsideair depending on room volume. In the 1970s, energy based considerations drovethe recommended rate of ventilation as low as 5 cfm. Apparently, it wasforgotten that this rate had been shown to be too low to control odor.(22)The present standard published by the American Society of Heating,Refrigeration and Air-Conditioning Engineers (ASHRAE) calls for a minimum of15 cfm per person. As noted above, it is also stated that a CO2 level of 1000ppm or lower is a guide, not a design criterion, to adequate ventilation.Higher rates are recommended by ASHRAE for conditions where air is poorlymixed in the interior space, or where unusual conditions exist. The standardappears to have been constructed on experience, the fact that the AmericanConference of Industrial Hygienists (ACGIH) published TLV for CO is 5000 ppm,and engineering calculations based on mets as to what amount of CO? isproduced by the average diet. No measured data or studies supporting therecommended 1000 ppm level appear to have been utilized. Without agreement asto what constitutes adequate air quality from a health, comfort, andproductivity perspective, inappropriate focus on energy savings as the primedriving force behind air handler design and operation will continue. Wepropose using as guidelines consistently measurable human responses which canbe interpreted as a disease, illness or sickness response to theenvironment. We also favor active use of the ASHRAE criterion ofacceptability to 80% of the exposed population.
B. Many health standards are based on projections. The number of peoplemade ill by high level exposure is projected by varying mechanisms to the lowlevel exposure regime. The allowable exposure level is set at a number whichcoincides with a certain level of risk of acquiring disease. Generally, theallowable risk is set in the range of 1/100,000 to 1/10,000,000, risks farless than many commonly experienced risks in everyday life. This proceduremay result in allowable exposure levels which are costly to attain and, in theview of some, questionable with regard to value in preventing disease. This
2

approach was developed as the result of the discovery of chemicals, such asvinyl chloride, which were found to L- carcinogenic at low levels of exposure.The method has the advantages of controlling irritant effects as well asdecreasing the chance that any disease will result from the exposuresallowed. Prior to this, standards were developed by setting levels whichseemed reasonable based on current knowledge and lowering them if the needbecame apparent. The disadvantages of this method are that it tends to ignoreirritant levels, and allows some measure of physiological change to take placeproviding the change is reversible. It assumes no permanent adverse effecthas occurred as the result of the temporary physiological change, a fact whichis sometimes not possible to know without long exposure histories. It doesnot prevent the occurrence of disease which may be caused by quantitativelylow exposure levels. Indeed, it uses disease occurrence as a signal thatchange is needed. This method is still used in setting occupational exposurelimits as the recent paper by Roach and Rappaport clearly shows.(21) Somemiddle ground is required between these extremes. The alternative we proposeuses measurable health effects as the guide, and elimination of measurableeffects as the goal. As health parameters we propose using any consistentlymeasurable human response which can be interpreted as a disease, illness orsickness response to the environment. In this context the definitions ofdisease, illness and sickness are defined as follows:
1. Disease is any psychological/physiological change which results inan illness.
2. Illness is the subjective state of a person who is aware of notfeeling well as the result of a physiological or psychological change.
3. Sickness is a state of social dysfunction. It is the role theindividual assumes when ill.
For example, a cold results in physiological and psychological changes inducedby the infecting organism. Awareness of the state of changed physiologyconstitutes the illness. The sickness is the change in behavior induced bythe cold which results in the social consequence of reduced productivity. Byanalogy stale air generates physiological changes which result in sensationsof fatigue and uncomfortable warmth. Awareness of the state of increasedfatigue and warmth constitutes the illness. The persons expression of his/hersubjective state and resulting loss of productivity is the sickness as seenfrom the social perspective. Based on the above definitions, this report willsuggest indoor air quality guidance for current use. We hope it will serve asa catalyst for continuing refinement of these guidelines.
C. Building air quality problems can be categorized by origin of thesource of the problem. NIOSH does this in a pamphlet entitled Indoor AirQuality, Selected References.(2) The following is a summary of theirfindings.
Total of 446 IAQ investigations
1. Inadequate Ventilation - 52%
a. Insufficient fresh air
3

b. Poor air distribution and mixing
c. Draftiness and pressure differentials between office spaces
d. Temperature and humidity extremes and fluctuations
e. Improper or no maintenance on ventilation systems
2. Inside contamination - 17%
a. Chemicals from office machines such as copiers, signaturemachines and blueprint copiers
b. Improper use of pesticides and cleaning agents
3. Outside contamination - 11%
a. Improperly located exhausts and intakes resulting in
(1) Entrainment of exhaust air
(2) Intake of automobile exhaust
b. Odors and gases entering from sewers
c. Products from construction projects in the area
4. Microbiological contamination - 5%
a. Bacterial, fungal and protozoal products from the ventilationsystem and furnishings damaged by water
5. Building fabric contamination - 3%
a. Dermatitis from ventilation duct lining, glues and adhesives
b. Off-gassing of formaldehyde and other products fromfurnishings and building materials
The pamphlet concludes that there are three general categories of problemswhich are, with decreasing frequency, inadequate ventilation, chemical, andmicrobial contamination. Our experience, summarized below, is largely inagreement with that of NIOSH. We differ in that the NIOSH pamphlet, in thereprinted article by Dr Melius, et al, says they have not found anyenvironmental measurement useful as an indicator of inadequate ventilation,b~t others have found CO2 useful. We have found CO2 to be a very usefulindicator of the adequacy of ventilation.
D. Our Experience
1. The following information is drawn from surveys conducted by ourorganization over the past four years. These surveys were conducted to solveoperational problems. This is a series in which the same people conducted themajority of the studies using the same techniques and equipment. Therefore,
4

the data has value as a case series study. Medical interviews were conductedin all cases. A standardized questionnaire was used in eight uf thebuildings. In the remainder, a standard medical interview waz conducted. Thediscussion of our data reduction methods can be found in Appendix A. Based onthis data reduction, we conclude that the symptoms of ratigue, drowsiness,feeling of temperature extremes, dizziness, increased ear, nose and throatproblems are correlated with increased C02 and decreased humidity. Ouranalysis also indicates a tendency for increased headaches and problemsbreathing with increased CO2 and decreased RH.
2. We use a model to clarify our observations. Our model is based onthe following assumptions. First, there is a no effect threshold (A) forexposure to C02 ; second, there is an equilibrium ,onstunt st t)lished amongthe blood, lung and alveolar space (K); third, the p xlJI ,i!e percentageof complaints is 100 percent; fourth, in a lart.j (!,0L6-: >, : re willalways be an individual that experiences no , ,,yt. .. t..nsproduced the following model for predicting perct,!,t:iji c i.,1, ff fatiguebased on measured CO2 concentration;
Complaints = iO0(l-e - (CO -A))
By using the SAS computer statistical software pock, w t ,
Mean 95,', confidence levclA 470 600 34,,)K 0.0012 0.0017 U.0008i
We conclude from this that at 600 ppm, some part (if re upc;aLirn willexperience some level of fatigue. This is in keepin ,it me findings ofothers.(8,24) The following Figure is a graph of this predictive model withour actual complaint rates at varying CO2 levels superir, so(.
E. The illnesses and symptoms resulting froUI 1;,C r. re alsodiscussed in the NIOSH pamphlet. NIOSH says, ".. tht- , ris and healthcomplaints ... have been diverse and not specific to -ny pirticular diagnosisor readily associated with a causative agent. A typical spectrum of symptomshas included headaches, varying degrees of itching or burning eyes,irritations of the skin including rashes, sinus problems, dry and irritatedthroats and other respiratory irritations." The pamphlet also namesallergies, humidifier fever, hypersensitivity pn,1umo)nitis, and conjunctivitisas diseases resulting from microbial contamination. ,)nl -e ,,gain we have goodagreement with NIOSH but would add aggravation of asthma and fatigue to thelist. We also believe the symptoms are quite specific t the stimulipresent. We believe the symptoms found in tight buildirgs in many cases arethe direct result of RH outside the range of 40 to o5 , and (.02 above 600ppm. We begin the discussion with "human pollution" and ('0,.
1. Controlled tests of human dissatisfaction with air polluted byhuman effluent alone have given some interesting results.(19,?u) People wereexposed to air polluted only by human effluent and asked to give immediatejudgments of the air quality. The judgments were based on a standardizedadjectival questionnaire with a gamut reflecting satisfaction -dissatisfaction. The air was subjected to ventilation at a -ate equivalent to
5

0. 00
li
0&
040
00 6
00 0 .
0 - 9: 0 0
C, O %0 0 q

21 cubic feet per minute per person (cfm/p) of 100% unpolluted air. The testsituation was run for only 20 minutes when the test subjects were introducedand the judgments were made. Even with this high rate of fresh air, lowhuman-only pollution loading and measuring only immediate response, 15% of thepopulation found the air unacceptable. This makes it very unlikely thatacceptable indoor air quality will be attained by air that is subjected toother sources of pollution as well as human pollution when a rate of 15 cfm/por even 20 cfm/p is maintained. Moreover, many symptoms would not be apparenton immediate exposure. The CO2 effects require time to become fully apparentas do many of the low RH effec s. When CO levels rise above 600 ppm thefollowing symptoms will be experienced by 5uilding inhabitants with increasingintensity as the level climbs: sleepiness and fatigue; poor concentration; asensation of stuffiness and awareness of breathing; a sense of increasingwarmth even though temperature does not change. The intensity of the symptomsand the number of people experiencing them is correlated with the level ofCO2 •
a. Both our own experience and that of others confirms this.(8,24)In general, between 15% and 33% of the population will have symptoms when thelevel is between 600 and 800 ppm. Between one-third and one-half becomesymptomatic between 800 and 1000 ppm, and virtually everyone will have some orall the symptoms when the level is above 1500 ppm. The sensation ofincreasing warmth has been shown to be related to CO2 levels in a study whichaddressed the subjective response to changes in ventilation.(6) Effectivetemperature (ET) was held constant and the subject's appreciation of roomtemperature was gauged with a standard adjectival test ranging from minus fourto plus four on a cool - warm gamut. There was an obvious, incrementalincrease in subjective temperature which correlated with increase in CO2 . Therange of CO2 involved was from 500 ppm to 1500 ppm. The sensitivity of thephysiological response to low level CO2 is made obvious by this study. Apossible mechanism for this effect is vasodilation by CO2. The temperaturesensors in the skin would detect an increase in ter .rature due to increasedperipheral blood flow through expanded capillary b is. The vasomotor and CO2respiratory control centers are close together and receive signals from manyof the same areas of the brain and body at the same time. They areinterrelated as well. There is little that will affect one that does notaffect the other.
b. Undersea Biomedical Research published a supplement in 1979 whichdealt extensively with physiological response to increased levels of CO . Anumber of interesting findings are detailed in this volume. The body takesless time to maximally adapt to high level CO than to low level. With CO inthe range of 3% to 20% adjustment takes five ays. With CO in the range from1/ to 1.5%,, adjustment took three weeks.(7) The same artic~e demonstrated agreater increase in measures of lung ventilation at concentrations of CO inthe range of 0.8% (8000 ppm) to 1% (10,000 ppm) than at 1.5% (15,000 ppmT.Respiratory minute volume increased 37% when CO2 was held at 1.5. for 42days. Between days 1 and 24 the rate at 1.5% peaked at 39% and remainedessentially unchanged thereafter. When the level was held between 0.8%Z and 1",the rate continued to rise for 56 days ending at 62"",. In the 42 day timeframe, it was at 52%. The increases were due to increases in tidal volume andnot an increase in respiratory rate. The reason for this apparently reversedphenomenon is believed to be due to different adaptive mechanisms at higherand lower levels of CO2. The speed of adaptation at high levels is believed
7

to be due to buffering by bone calcium. The calcium is readily mobilized atthe pH induced by the higher CO2 levels. At lower levels the adaptation isdue to kidney adjustment of ion excretion and absorption and by ventilationmechanisms. The kidney mechanism takes longer to develop effective controlthan the bone mechanism. The respiratory mechanism serves both an interim andsupporting role. The author notes that ventilatory loading effects, thoughdifficult to measure, continue below 2000 ppm.
c. Other sources (11) indicate that an increase in arterial CO2pressure of 1 mm Hg, the approximate equivalent of an added 1000 ppm ofambient CO9 , can increase the basal ventilation rate by 25%. The ambientlevel of CO2 which will produce this effect will depend on where on the curveof alveolar and arterial CO2 a given individual falls. Persons less wellcompensated by reason of disease or other consideration, and who are near, ator even above the higher end of the normal curve will respond at lower levelsof additional CO The normal range for alveolar CO2 pressure is from 35 to45 mm Hg. As wiih all such distributions, the upper one third will be moresusceptible to effects, the lower third will be resistant and the remainderwill fall in the middle. This may well account for the distribution ofsubjective effects found in tight buildings as CO2 rises. CO2 has othereffects which must be considered. Two studies (9,10) show that kidneycalcification and ultra-structural lung changes, the latter persisting atleast four weeks post experiment, were present in animals when CO was heldconstant at 1% (10,000 ppm). The lung changes disappeared when sfudies weredone holding CO2 at 5000 ppm. The kidney calcification remained a problem.Plasma calcium also continued significantly elevated at 5000 ppm.
d. Normally, our least conservative method for risk reduction usesthe no observable effect level and divides that concentration by at least tento obtain a level which will have no effect. Were we to do this with C02 , wewould set a TLV no greater than 500 ppm, one-tenth of the current level. Suchconsiderations can help bring CO2 into perspective with other substances weregulate. While it is true we encounter CO2 everyday, it serves manyphysiological functions. Relatively small changes in body concentrationrapidly bring about efforts at compensation. It should not surprise anyonethat small changes produce detectable effects. Other stimuli to respirationare present in the average office environment. Anxiety is frequentlypresent. It is usually generated by not knowing what is causing the symptomsand the almost invariable conflict between those managing the air handler andthe building occupants. Frequently, it is believed that the problem is beingcaused by some unknown chemical toxin in the environment. Anxiety activatesthe as yet incompletely defined cortical respiratory drivers. These are veryefficient and can increase basal respiratory minute volume as much as 12times. Increased temperature causes an increase in the activity of thereapiratory center. Irritative effects from accumulated dust, body effluentsanl ambient chemicals also affect respiratory minute volume. Some havesuggested that the fact that submarines can operate at 8000 to 10,000 ppmshould make it permissible for buildings to operate at 1000 ppm. We believethe analogy to be odious. Given that soldiers engaged in trench warfare canlive in trenches for months, should we all rush out and dig trenches for ouremployees on the basis that it costs less than constructing a building? Wecould save a lot of construction and energy costs that way. Considering theyouth, good health and mission of the average submariner and the widevariation in the health, age and mission of people in public buildings, we
8

believe the subject warrants no further discussion. If the building is toowarm, the air too dry, and the CO2 too high, sensations of stuffiness,difficulty breathing and fatigue are not hard to understand.
2. The level of CO2 reflects air change rates in the building.Therefore it is a relative measure of the increase in concentration of alleffluents in the building which are produced at a steady rate. Theopportunity for odorants to increase in an underventilated environment isobvious. The sense of smell is extremely sensitive. It functions primarilyas a go, no-go system when compared to other senses. The detection level forsome substances is below the part per billion range. The increase inconcentration necessary to maximize response is as little as ten timesthreshold. This means that a barely perceptible odor at one part perbillion becomes overwhelming at one part per hundred million. This is inmarked contrast to the range covered by other senses. The eye has a range of500,000 to one and the ear a trillion to one.(11) Odors were the originalreason for ventilation standards. Smell has heavy emotional loading. Manytimes strong odors are the triggering agent for severe problem both in andout of buildings.(12-18) The literature in bibliography item ?-18 describesmass psychogenic illnesses. In all cases there was some pre-existing sourceof tension. The literature is replete with examples of individuals who havehad similar symptoms established on a chronic basis due to a one-time exposureto odorants. Reference 21 describes some of these cases. Anyone who has beeninvolved in IAQ problems is fully aware of the tremendous tension theseproblems can cause, not only between management and employees, but amongemployees as well. Psychological responses are a fact of life. We all havethem every day. When tension is high, suspicion is high. The externalenvironment is sifted in detail. People become more aware of their ownbodies. Events that might otherwise be ignored may be endowed with meaningsthey do not possess. This is not a minor detail in the cost of theseevents. The effect that this has on morale and productivity is large as someof the more extreme cases in the references make readily apparent. These arerormal responses. The responses are never the cause. The cause is whateveris causing the underlying tension. The responses are merely triggered by someevent, often an odor. In our experience, there is always an element of thesesymptoms present in IAQ situations; however, it is never the cause of theproblem. The symptoms in IAQ situations are real and are responses to realconditions in the building. The responses that can be classed as resultingfrom misinterpretation of bodily sensations are real and are responses to theoften tense social environment of the workplace.
3. In our experience, the symptoms which result from low RH are: dryand sore nose and throat; bleeding nose, sinus and tracheal irritation, dryscratchy eyes, inability to wear contact lenses; and dry, itchy, flakingskin. These complaints increase with RH below 40%. We believe that therespiratory tract irritation which results from too low humidity, incombination with the recirculation of air, leads to an increase in respiratoryillness. The increase may be as much as two to three times what would haveoccurred if the humidity had been in a better range and the addition ofoutside air had been appropriate. There are many examples in the literaturewhich support the increased opportunity for infection inside buildings.Diseases not ordinarily communicable have been reported as epidemics inspecialized buildings such as hospitals and laboratories.(3) Q fever has beenspread through ventilation systems in buildings where sick animals are housed
9
or the organism is cultured. Tuberculosis was demonstrated to have spread ina factory far more aggressively than in the community around the factory (33%of all plant employees vs. 10.7% of the community, about three to one).(4)The building ventilation was considered to he responsible for the aggressivespread. The rate of transmission of respiratory disease in new, airtight,army barracks was shown to be elevated between 51% and 250% compared to oldstyle barracks which were much more open and better ventilated.(5)
a. When humidity is low enough, irritated sinuses and bleedingmucous membranes are a problem. There is little doubt that a bleedingmembrane is a less effective barrier to disease than an intact one. Combinethis with increased exposure to infecting agents due to recirculation and itseems only reasonable to expect an increase in respiratory disease.
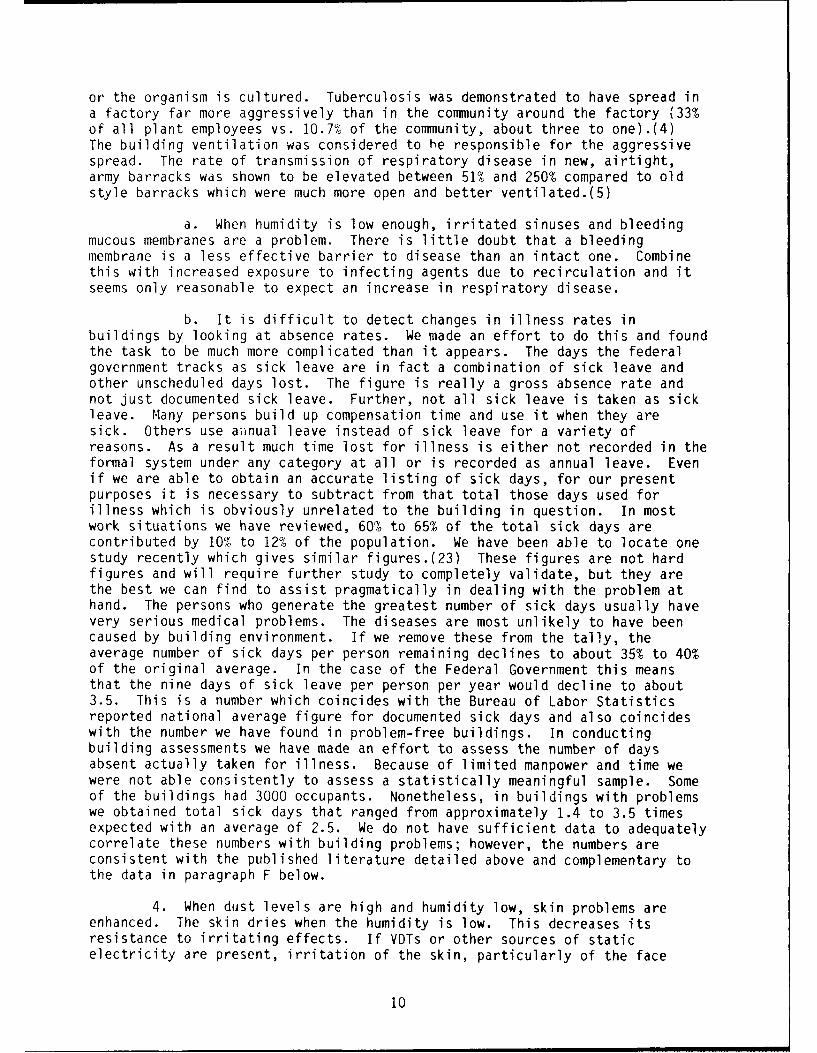
b. It is difficult to detect changes in illness rates inbuildings by looking at absence rates. We made an effort to do this and foundthe task to be much more complicated than it appears. The days the federalgovernment tracks as sick leave are in fact a combination of sick leave andother unscheduled days lost. The figure is really a gross absence rate andnot just documented sick leave. Further, not all sick leave is taken as sickleave. Many persons build up compensation time and use it when they aresick. Others use ainual leave instead of sick leave for a variety ofreasons. As a result much time lost for illness is either not recorded in theformal system under any category at all or is recorded as annual leave. Evenif we are able to obtain an accurate listing of sick days, for our presentpurposes it is necessary to subtract from that total those days used forillness which is obviously unrelated to the building in question. In mostwork situations we have reviewed, 60% to 65% of the total sick days arecontributed by 10% to 12% of the population. We have been able to locate onestudy recently which gives similar figures.(23) These figures are not hardfigures and will require further study to completely validate, but they arethe best we can find to assist pragmatically in dealing with the problem athand. The persons who generate the greatest number of sick days usually havevery serious medical problems. The diseases are most unlikely to have beencaused by building environment. If we remove these from the tally, theaverage number of sick days per person remaining declines to about 35% to 40%of the original average. In the case of the Federal Government this meansthat the nine days of sick leave per person per year would decline to about3.5. This is a number which coincides with the Bureau of Labor Statisticsreported national average figure for documented sick days and also coincideswith the number we have found in problem-free buildings. In conductingbuilding assessments we have made an effort to assess the number of daysabsent actually taken for illness. Because of limited manpower and time wewere not able consistently to assess a statistically meaningful sample. Someof the buildings had 3000 occupants. Nonetheless, in buildings with problemswe obtained total sick days that ranged from approximately 1.4 to 3.5 timesexpected with an average of 2.5. We do not have sufficient data to adequatelycorrelate these numbers with building problems; however, the numbers areconsistent with the published literature detailed above and complementary tothe data in paragraph F below.
4. When dust levels are high and humidity low, skin problems areenhanced. The skin dries when the humidity is low. This decreases itsresistance to irritating effects. If VDTs or other sources of staticelectricity are present, irritation of the skin, particularly of the face
10

around the eyes, is often a finding. This is severe at times. We have seeneyes swollen shut and skin weeping from this effect. The problem resultsfrom the dust settling on the skin or being propelled by static charge at theface or other body part and irritating the skin. Some people seem completelyimmune to this problem while others are more sensitive. Fair skinned femalesare most susceptible while dark skinned males are most resistant.
5. The inability to wear contact lenses in a dry building resultsfrom the loss of fluid from the surface of the eye to the too dryatmosphere. The loss of lubrication which results causes irritation andirritative conjunctivitis. This enhances the possibility of infection. Evenwithout contact lenses the eyes burn, feel dry, irritated, and itchy. It isnot difficult to understand the development of concern that chemicals arerampant in the environment. This belief generates more than a littleconcern. We have seen the chemical causation hypothesis enhanced by the factthat plants were dying in the office. The air was so dry that the plants weredying of thirst and salty soil. It was necessary to water so frequently thatsalts built up in the soil to the lethal level.
6. Inadequate balancing of ventilation systems often leads to markedvariations in temperature over short distances in a building. Poor or nomaintenance of equipment responsible for directing air flow often createsclosed loops in systems which are unresponsive to central control. Worse, thetemperature may vary so widely in the same location over short periods of timethat the dnticipation of the next cold blast after a hot period detracts fromattention to work. All too frequently, little consideration is given toactual occupant and equipment load on the ventilating system. Temperature andodor then become problems. The tendency to increase the density of equipmentand people is driven by the cost of space. This tactic leads to increasedtotal costs per square foot of space because of increasing personnel persquare foot. The cost is then translated to the occupants health andproductivity with increasing inefficiency as the cost per square foot rises.Because of increased equipment density, heat load is often too great andadequate temperature control is lost. In these conditions the cost of arelatively cheap resource, energy, is translated to the cost of the mostexpensive resource, people. This is a no win situation.
F. In reference to the discussion in paragraph II D 6, it is fortunatethat by increasing the amount of added outside air when it is inadequate wecan improve health and productivity as well as save money. The followingdiscussion is an economic analysis of energy conservation versus adequatefresh air. Annual energy, maintenance and personnel costs are discussed.
The cost of personnel in the Air Force averages about $250.00 persquare foot per year. The maintenance and energy costs for all operations ina building rarely exceed $7.00 per square foot per year. Of the $7.00, nomore than $2.00 are energy costs. If the unlikely proved true and we savedhalf of all energy costs by running closed or minimum fresh air cycles, thatwould be $1.00/sq ft/yr. This is the equivalent of seven hours per squarefoot of personnel time. This is less than two minutes per day per year. Ifonly two minutes per day productive time is lost, then all energy savings arewiped out. Respiratory disease is at least 1.5 to 3 times more likely in atight environment. Common respiratory infection episodes last eight to tendays with one to two days of absence being usual. The average number of
11
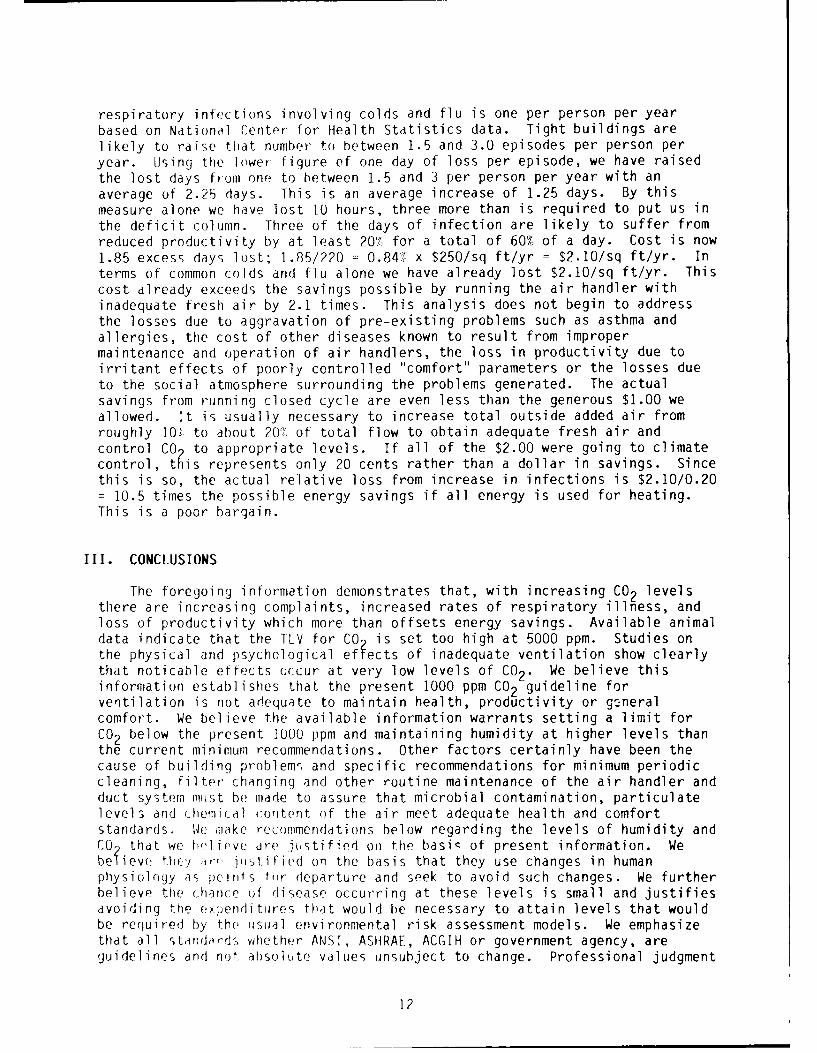
respiratory infections involving colds and flu is one per person per yearbased on National Center for Health Statistics data. Tight buildings arelikely to raise that number to between 1.5 and 3.0 episodes per person peryear. Using the lowe figure of one day of loss per episode, we have raisedthe lost days from one to between 1.5 and 3 per person per year with anaverage of 2.25 days. This is an average increase of 1.25 days. By thismeasure alone we have lost 10 hours, three more than is required to put us inthe deficit column. Three of the days of infection are likely to suffer fromreduced productivity by at least 20. for a total of 60% of a day. Cost is now1.85 excess days lost; 1.85/220 = 0.84%'s x $250/sq ft/yr = $2.10/sq ft/yr. Interms of common colds and flu alone we have already lost $2.10/sq ft/yr. Thiscost already exceeds the savings possible by running the air handler withinadequate fresh air by 2.1 times. This analysis does not begin to addressthe losses due to aggravation of pre-existing problems such as asthma andallergies, the cost of other diseases known to result from impropermaintenance and operation of air handlers, the loss in productivity due toirritant effects of poorly controlled "comfort" parameters or the losses dueto the social atmosphere surrounding the problems generated. The actualsavings from running closed cycle are even less than the generous $1.00 weallowed. It is usually necessary to increase total outside added air fromroughly 10' to about 20"5 of total flow to obtain adequate fresh air andcontrol CO to appropriate levels. If all of the $2.00 were going to climatecontrol, t~is represents only 20 cents rather than a dollar in savings. Sincethis is so, the actual relative loss from increase in infections is $2.10/0.20= 10.5 times the possible energy savings if all energy is used for heating.This is a poor bargain.
III. CONCLUSIONS
The foregoing information demonstrates that, with increasing CO2 levelsthere are increasing complaints, increased rates of respiratory illness, andloss of productivity which more than offsets energy savings. Available animaldata indicate that the TLV for CO is set too high at 5000 ppm. Studies onthe physical and psychological effects of inadequate ventilation show clearlythat noticable effects occur at very low levels of CO2 . We believe thisinformation establishes that the present 1000 ppm C02 guideline forventilation is not adequate to maintain health, productivity or generalcomfort. We believe the available information warrants setting a limit forCO2 below the present 1000 ppm and maintaining humidity at higher levels thanthe current minimum recommendations. Other factors certainly have been thecause of building problem- and specific recommendations for minimum periodiccleaning, filter changing and other routine maintenance of the air handler andduct system must be made to assure that microbial contamination, particulatelevels and chemical content of the air meet adequate health and comfortstandards. We make recommendations below regarding the levels of humidity andCO, that we ho Iic, are i ustified on the basiz of present information. Webe~ievc, th -y r- Justified on the basis that they use changes in humanphysiology as, pcirifs fur departure and seek to avoid such changes. We furtherbelieve the chance of disease occurring at these levels is small and justifiesavoiding the expenditures that would be necessary to attain levels that wouldbe required by the usual environmental risk assessment models. We emphasizethdt all standards, whether ANSI, ASHRAE, ACGIH or government agency, areguidelines and nut absolute values unsubject to change. Professional judgment
12
must supersede any number that is proving to be inadequate. The ultimatebaseline, as ASHRAE states, is human health and acceptability.
IV. RECOMMENDATIONS
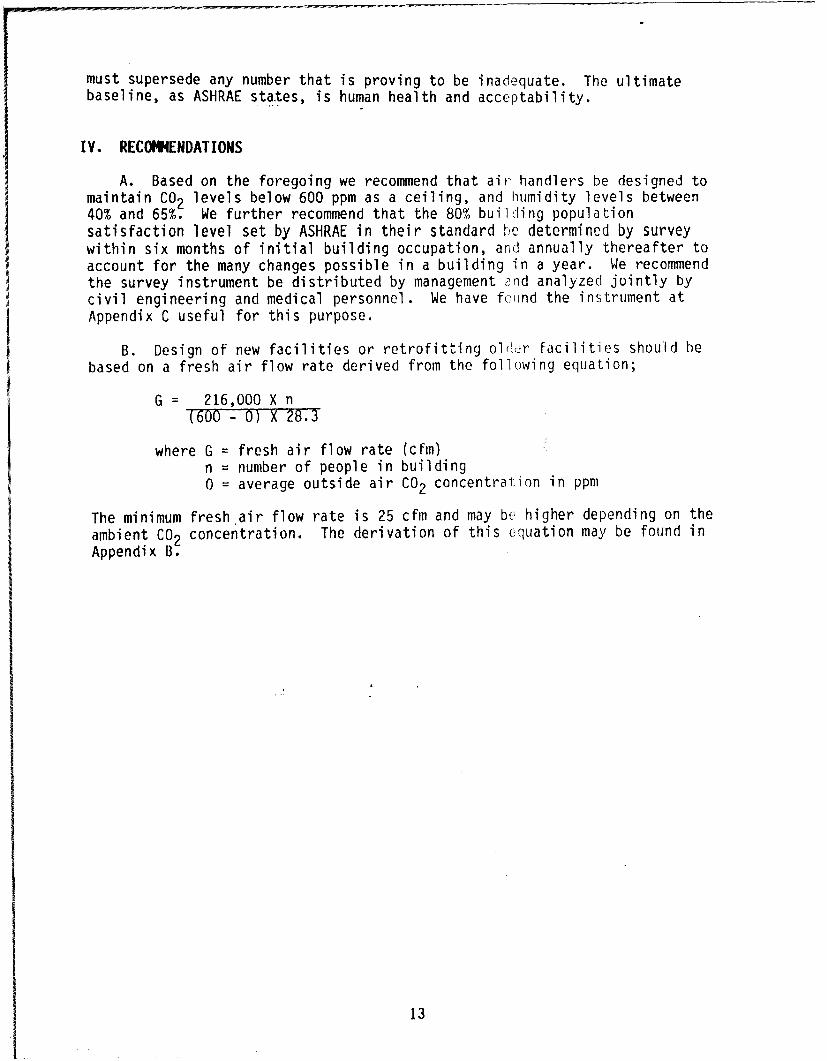
A. Based on the foregoing we recommend that air handlers be designed tomaintain CO2 levels below 600 ppm as a ceiling, and humidity levels between40% and 65%. We further recommend that the 80% building populationsatisfaction level set by ASHRAE in their standard he determined by surveywithin six months of initial building occupation, and annually thereafter toaccount for the many changes possible in a building in a year. We recommendthe survey instrument be distributed by management and analyzed jointly bycivil engineering and medical personnel. We have fetind the instrument atAppendix C useful for this purpose.
B. Design of new facilities or retrofitting ol! r facilities should hebased on a fresh air flow rate derived from the following equation;
G = 216,000 X n(600 - 0) X 28.3
where G = fresh air flow rate (cfm)n = number of people in building0 = average outside air CO2 concentration in ppm
The minimum fresh air flow rate is 25 cfm and may be higher depending on theambient CO2 concentration. The derivation of this eqluation may be found inAppendix B.
13

(This page left blank)
14
BIBLIOGRAPHY
1. Morey, PR; Woods, JE; Indoor Air Quality in Health Care Facilities. Occ.Med. State Art Rev.; 2:547-563, 1987.
2. Indoor Air Quality, Selected References. DHHS-NIOSH May 1989.
3. Kreiss, K; The Epidemiology of Building Related Complaints and Illness.Occ. Med. State Art Rev.; 4:575-592, 1989.
4. Mosher, C. et al; Unusually Aggressive Transmission Tuberculosis in aFactory. J. Occ. Med.; 29:29-31, 1987.
5. Brundage, JF; Scott, R; Lednar, W et al.; Building Associated Risk ofFebrile Acute Respiratory Diseases in Army Trainees. JAMA; 259: 2108-2112, 1988.
6. Janssen, J; Wolff, A; Subjective Response to Ventilation. Proceedings ofthe ASHRAE Indoor Air Quality Conference '86. 161-170.
7. Schaefer, K; Physiological Stresses Related to Hypercapnia During Patrolsin Submarines. Undersea Biomedical Research; 6: S15-S48, 1979.
8. Rajhans, G; Indoor Air Quality and CO2 Levels. Occupational Health inOntario.; 4:160-167, 1983.
9. Douglas, W. et al; Proliferation of Pneumocyte II Cells in ProlongedExposure to 1% CO2 . Undersea Biomedical Research; 6:S135, 1979.
10. Schaefer, K. et al; Effect of Prolonged Exposure to 0.5% CO& on KidneyCalcification and Lung Ultrastructure. Undersea Biomedical Research;6:S-155, 1979.
11. Guyton, AC; Textbook of Medical Physiology; 7th ed. W.B. Saunders Co.Philadelphia, 1986 pg 508.
12. Alexander, RW; Nedords, MJ; Epidemic Psychogenic Illness in a TelephoneOperator's Building. J. Occ. Med.; 28:42-45, 1986.
13. Bardena, EJ; Office Epidemics. The Sciences; Nov/Dec 1986.
14. Boxer, PA; Occupational Mass Psychogenic Illness. J. Occ. Med.;27:867-872, 1985.
15. Landrigan, PJ; Miller, B; The Arenyattah Epidemic. The Lancet; Dec 24/31,1983, 1474-75.
16. Modan, B. et al; The Arenyattah Epidemic. The Lancet; Dec 24/31, 1983,1472-74.
17. Pfeffer, JM; Hyperventilation and the Hyperventilation Syndrome.Postgraduate Med. J.; 60(supp 2):12-15, 1984.
15
18. Travis, C; Loping with Anxiety. Science Digest; February 1986, 46-51,80-81.
19. Fanger, PO; Introduction of the Olf and Decipol Units to Quantify AirPollution Per(eived by Humans Indoors and Outdoors. Energy and Buildings;12:1-6, 1988.
20. Fanger, P. et al; Air Pollution Sources in Assembly Halls Quantified bythe 01f Unit. Energy and Buildings; 12:7-19, 1988.
21. Roach. SA; Rapport. SM; But They Are Not Thresholds: A Critical Analysisof the Documentation of Threshold Limit Values. Am. J. Ind. Med.;11 - -:, '17 1,1 lc , 11)uP '
22. Morey, 'R4; '-,hatti,c',, DE; Role of Ventilation in Building AssociatedIllness. Ofc. .od. State Art Rev.; 4:625-642, 1989.
23. Lairson, DR; et al; Identifying Families at High Risk of CardiovascularDisease: Pltprnative Worksite Approaches. J. Occ. Med.; 32:586-593, July1q90.
24. Rajh~i.n -. fli; The Findings nf The Ontario Inter-Ministerial Committee OnIndo0y AiY )uai ity. Proceedings of the ASHRAE/SOEH Conference IAQ 1989,The Human Fi,,atinor Health and Comfort, 195-223.
16
APPENDIX A
STATISTICAL ANALYSIS OF SURVEY DATA
17
(This page left blank)
18
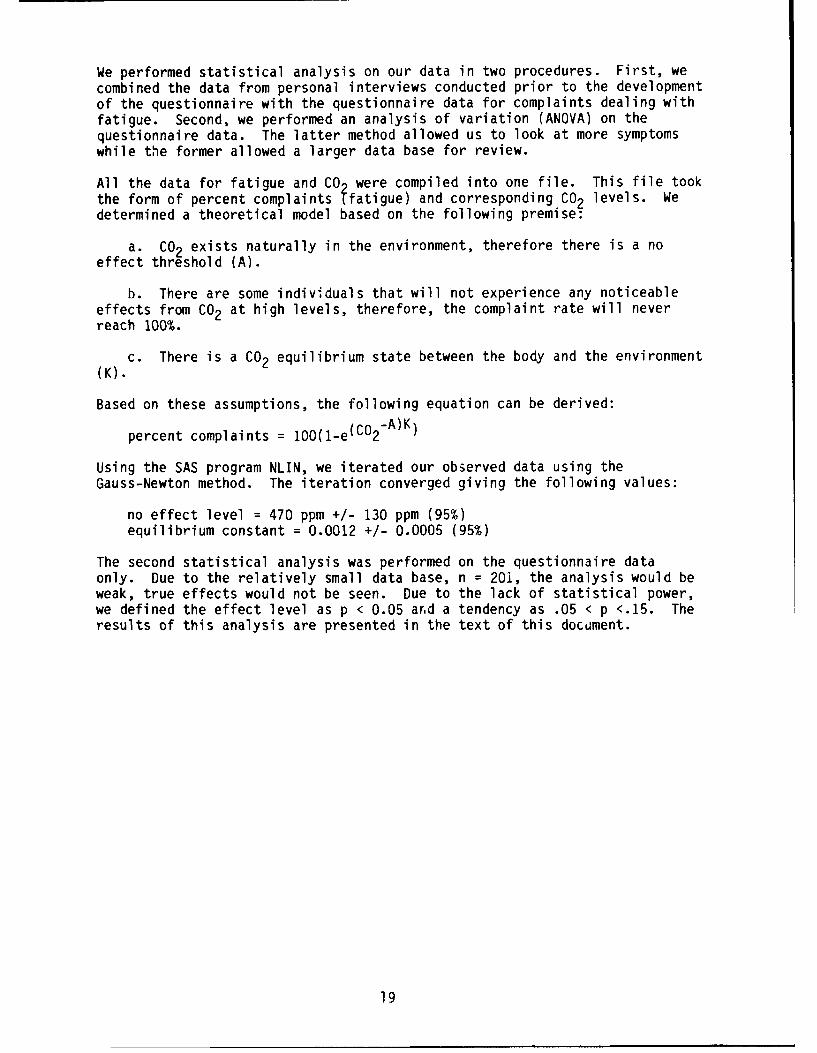
We performed statistical analysis on our data in two procedures. First, wecombined the data from personal interviews conducted prior to the developmentof the questionnaire with the questionnaire data for complaints dealing withfatigue. Second, we performed an analysis of variation (ANOVA) on thequestionnaire data. The latter method allowed us to look at more symptomswhile the former allowed a larger data base for review.
All the data for fatigue and CO were compiled into one file. This file tookthe form of percent complaints ffatigue) and corresponding CO2 levels. Wedetermined a theoretical model based on the following premise:
a. CO2 exists naturally in the environment, therefore there is a noeffect threshold (A).
b. There are some individuals that will not experience any noticeableeffects from CO2 at high levels, therefore, the complaint rate will neverreach 100%.
c. There is a CO2 equilibrium state between the body and the environment(K).
Based on these assumptions, the following equation can be derived:
percent complaints = 100(1-e(C02- A))
Using the SAS program NLIN, we iterated our observed data using theGauss-Newton method. The iteration converged giving the following values:
no effect level = 470 ppm +/- 130 ppm (95%)equilibrium constant = 0.0012 +/- 0.0005 (95%)
The second statistical analysis was performed on the questionnaire dataonly. Due to the relatively small data base, n = 201, the analysis would beweak, true effects would not be seen. Due to the lack of statistical power,we defined the effect level as p < 0.05 and a tendency as .05 < p <.15. Theresults of this analysis are presented in the text of this docdment.
19

(This oage left blank)
20
APPENDIX B
CALCULATION OF MINIMUM FRESH AIR FLOW
21

(This page left blank)
22

1. There are several methods for determining the required building fresh airflow rate. In our medical judgment, based on the information contained inthis monograph and its references, the method most suited to optimizing humanhealth, productivity and comfort utilizes CO2 production and normalrespiratory rates.
2. The following assumptions are used in determining fresh air flow rates;
average respiratory rate = 6 liter/minaverage CO2 concentration in expired breath = 3.6% (36,000 ppm)concentration of CO2 in building in morning = concentration outdoors
ul C02 = 36,000 ppm X I ul/L X 6 L = 216,000 ul CO2 = Pmin person ppm min person min person
ul in building at time = 0 = Y
Y = CO2 (outdoors) X lul/L X Volume of buildingppm
ul of CO2 in fresh air = T where G = flow rate (L/min)
T = CO2 outdoors X lul/L X G
ppm
The change in the C02 , C' = CO2 in building - CO2 leaving the building
C'(t) = (P+T) - G X C(t)V
C(t) = (P+T) X V + ce- (G/V) X t where c is a constant
G
at t = 0
C(O) = (P + T) X V + cG
Therefore c = C(O) - (P + T) X VG
23
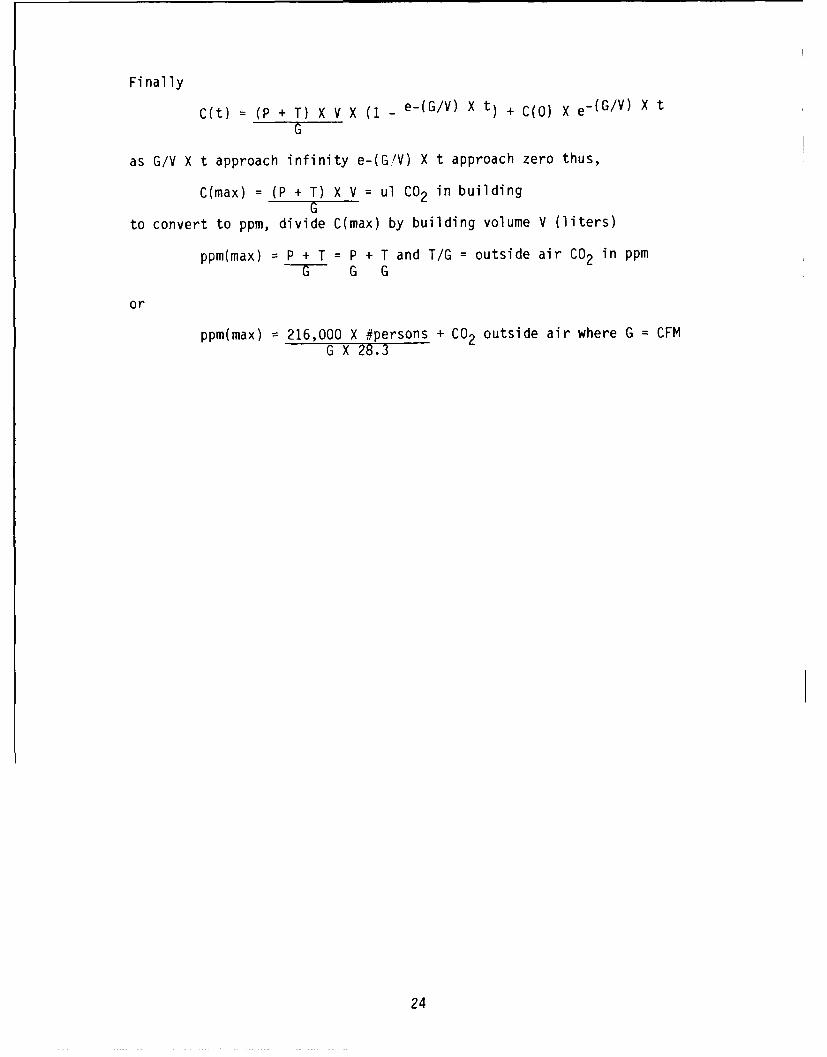
Finally
C(t) = (P + T) X V X (1 - e-(G/V) X t) + C(O) X e- (G/V) X t
as G/V X t approach infinity e-(G/V) X t approach zero thus,
C(max) = (P + T) X V = ul CO2 in buildingG
to convert to ppm, divide C(max) by building volume V (liters)
ppm(max) = P + T = P + T and T/G = outside air CO2 in ppmG G G
or
ppm(max) = 216,000 X #persons + CO2 outside air where G = CFMG X 28.3
24

APPENDIX C
QUESTIONNAIRE
25

(This page left blank)
26
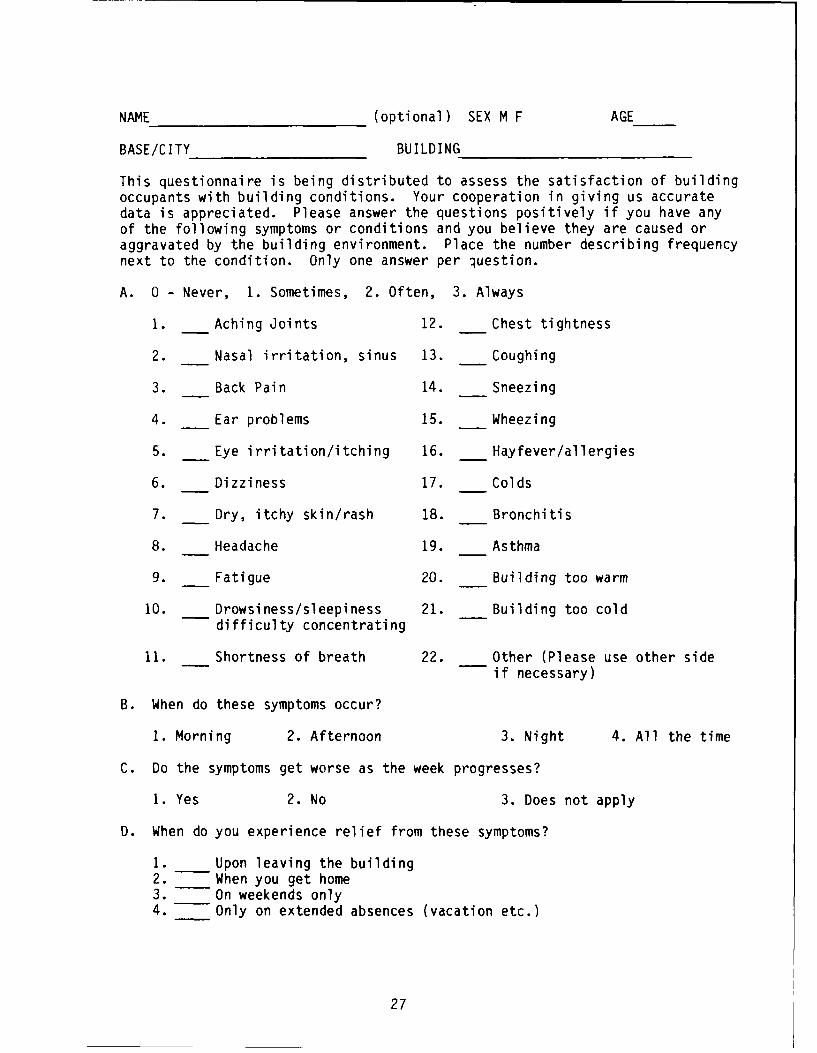
NAME (optional) SEX M F AGE
BASE/CITY BUILDING
This questionnaire is being distributed to assess the satisfaction of buildingoccupants with building conditions. Your cooperation in giving us accuratedata is appreciated. Please answer the questions positively if you have anyof the following symptoms or conditions and you believe they are caused oraggravated by the building environment. Place the number describing frequencynext to the condition. Only one answer per question.
A. 0 - Never, 1. Sometimes, 2. Often, 3. Always
1. Aching Joints 12. Chest tightness
2. Nasal irritation, sinus 13. Coughing
3. Back Pain 14. Sneezing
4. Ear problems 15. Wheezing
5. Eye irritation/itching 16. Hayfever/allergies
6. Dizziness 17. Colds
7. Dry, itchy skin/rash 18. Bronchitis
8. Headache 19. Asthma
9. Fatigue 20. Building too warm
10. Drowsiness/sleepiness 21. Building too colddifficulty concentrating
11. Shortness of breath 22. Other (Please use other sideif necessary)
B. When do these symptoms occur?
1. Morning 2. Afternoon 3. Night 4. All the time
C. Do the symptoms get worse as the week progresses?
1. Yes 2. No 3. Does not apply
D. When do you experience relief from these symptoms?
1. Upon leaving the building2. When you get home3. On weekends only4. Only on extended absences (vacation etc.)
27
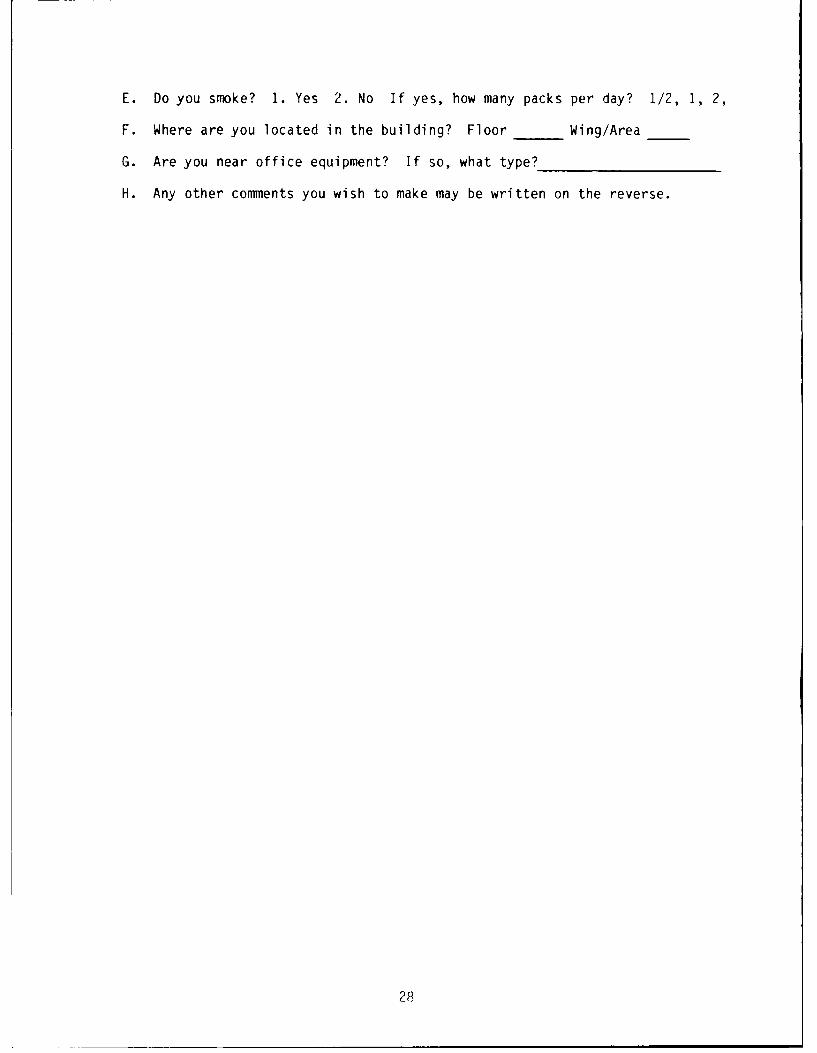
E. Do you smoke? 1. Yes 2. No If yes, how many packs per day? 1/2, 1, 2,
F. Where are you located in the building? Floor Wing/Area
G. Are you near office equipment? If so, what type?
H. Any other comments you wish to make may be written on the reverse.
28

Distribution List
Copies
HQ AFSC/SGPAndrews AFB DC 20334-5000 1
HQ USAF/SGPABoiling AFB DC 20332-6188 1
7100 CSW Med Cen/SGBAPO New York 09220-5300 1
Det 1, AFOEHLAPO San Francisco 96274-5000 1
Defense Technical Information Center (DTIC)Cameron StationAlexandria VA 22304-6145 2
HQ AFLC/SG/SGPWright-Patterson AFB OH 45433-5001 1ea
HQ AAC/SGPBElmendorf AFB AK 99506-5001 1
HQ AU/SGPBMaxwell AFB AL 36112-5304 1
HQ USAF Academy/SGPBColorado Springs CO 80840-5470 1
HQ AFLC/SGBEWright-Patterson AFB OH 45433-5001 1
HQ ATC/SGPBRandolph AFB TX 78150-5001 1
HQ MAC/SGPBScott AFB IL 62225-5001 1
HO TAC/SGPBLangley AFB VA 23665-5578 1
HQ SAC/SGPBOffutt AFB NE 68113-5001 1
HQ SPACECOM/SGBPeterson AFB CO 80914-5001 1
HQ PACAF/SGPBHickam AFB HI 96853-5001 1

Distribution List Cont'd
Copies
HQ USAFE/SGPAAP0 New York 09094-50011
HQ AFRES/SGBRobins AFB GA 31098-60011
HQ ANGSC/SGBMail Stop 18Andrews AFB DC 20331-60081
US AFSAM! TSK /ED /EDH /ED ZBrooks AFB TX 78235-5301 1ea
HQ HSD/XABrooks AFB TX 78235-50001
SAF/RQWashington DC 20330-10001
HQ AFESC/RDVTyndall AFB FL 32403-50001
*t~ 4r . h FFr F~ III -'-S
30