Станислав Кизима Эксперт МСЭ, Доктор технических наук Stanislav Kizima
Upload
emory-jenkinsCategory
view
215download
1

N. Keith Tovey, M.A. PhD, C.Eng MICE Н.К.Тови М.А., д-р технических наук
Energy Science Director
Low Carbon Innovation CentreUniversity of East Anglia, Norwich
22nd February 2005
The changing face of the Electricity Market in the UKИзменяющееся лицо рынка электроэнергии в Британии
Университета Восточной
Англии

The changing face of the Electricity Market in the UK
A brief review of the UK Electricity Industry prior to 1990.
Краткий обзор состояния британской электроэнергетики перед приватизацией в 1990 г
The Electricity Markets in the 1990s after Privatisation Рынки электроэнергии в 1990 г после приватизации
The New Electricity Trading Arrangements Новая система оптовой торговли НЕТА
The Supply of Electricity since 1990 Сбыт электроэнергии с 1990

A brief review of the UK Electricity Industry prior to 1990.
Краткий обзор состояния британской электроэнергетики перед приватизацией в 1990 г
The changing face of the Electricity Market in the UK
Electricity Generation and Supply differences in approach between England / Wales and Scotland.
Генерация и сбыт - раличия между регионами
Fuels used for generation
Топливо, используемой для генерации
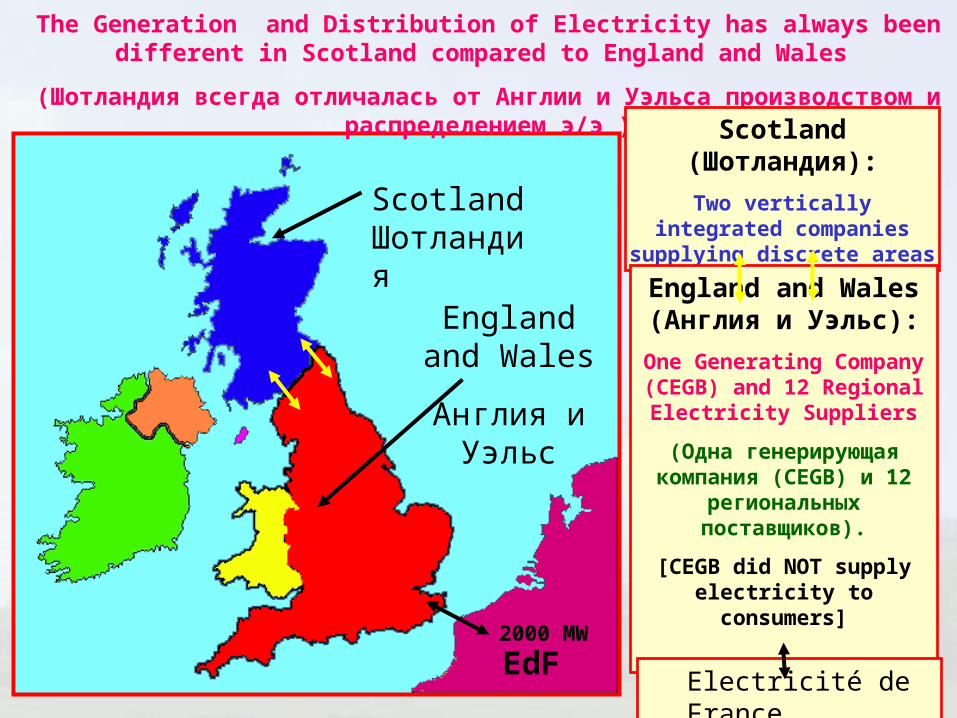
The Generation and Distribution of Electricity has always been different in Scotland compared to England and Wales
(Шотландия всегда отличалась от Англии и Уэльса производством и распределением э/э )
Scotland Шотландия
Scotland (Шотландия):
Two vertically integrated companies supplying discrete
areas
England and Wales
Англия и Уэльс
England and Wales (Англия и Уэльс):
One Generating Company (CEGB) and 12 Regional
Electricity Suppliers
(Одна генерирующая компания (CEGB) и 12
региональных поставщиков).
[CEGB did NOT supply electricity to consumers]
EdFElectricité de France
2000 MW

Scottish Hydro
Scottish Power
Northern
Yorkshire
Eastern
London
East Midlands
SEEBOARDSWEB Southern
NORWEB
MANWEB
Midlands
SWALEC
Scotland
Шотландия
England & Wales
Англия
и Уэльс
Structure of Electricity Supply before and immediately after
Privatisation in 1990
Scotland
Vertical Integration
• two companies
England and Wales
12 Regional Supply Companies
also Distributed Network Operators.
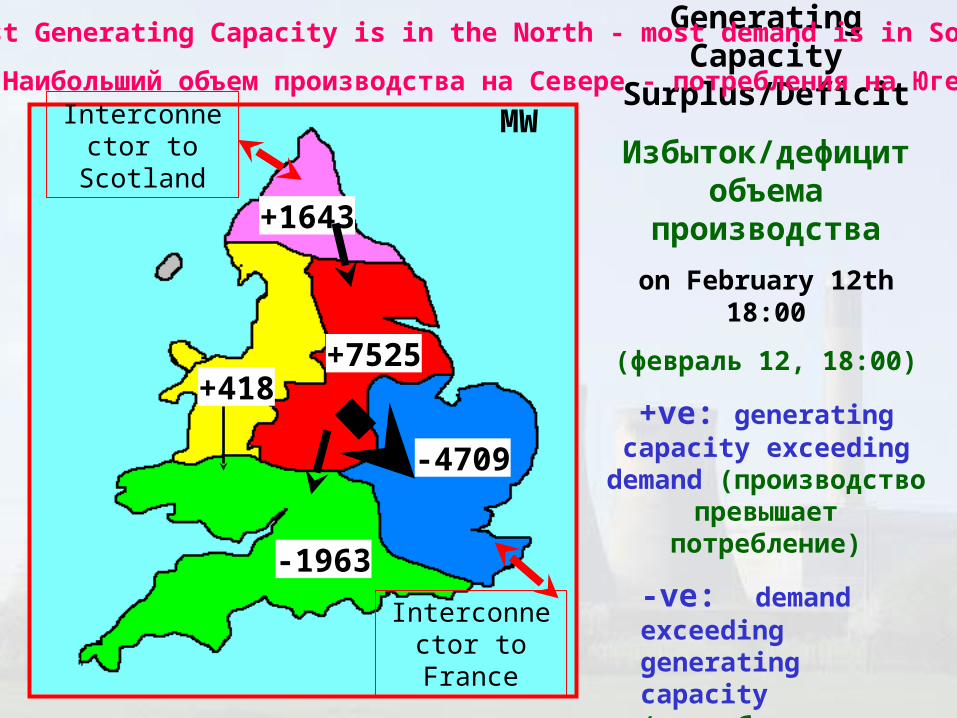
+1643
+7525
-4709
-1963
+418
Generating Capacity Surplus/Deficit
Избыток/дефицит объема производства
on February 12th 18:00
(февраль 12, 18:00)
+ve: generating capacity exceeding demand
(производство превышает потребление)
-ve: demand exceeding generating capacity (потребление превышает производство)
Most Generating Capacity is in the North - most demand is in South
Наибольший объем производства на Севере - потребления на Юге
MWInterconnector to Scotland
Interconnector to France
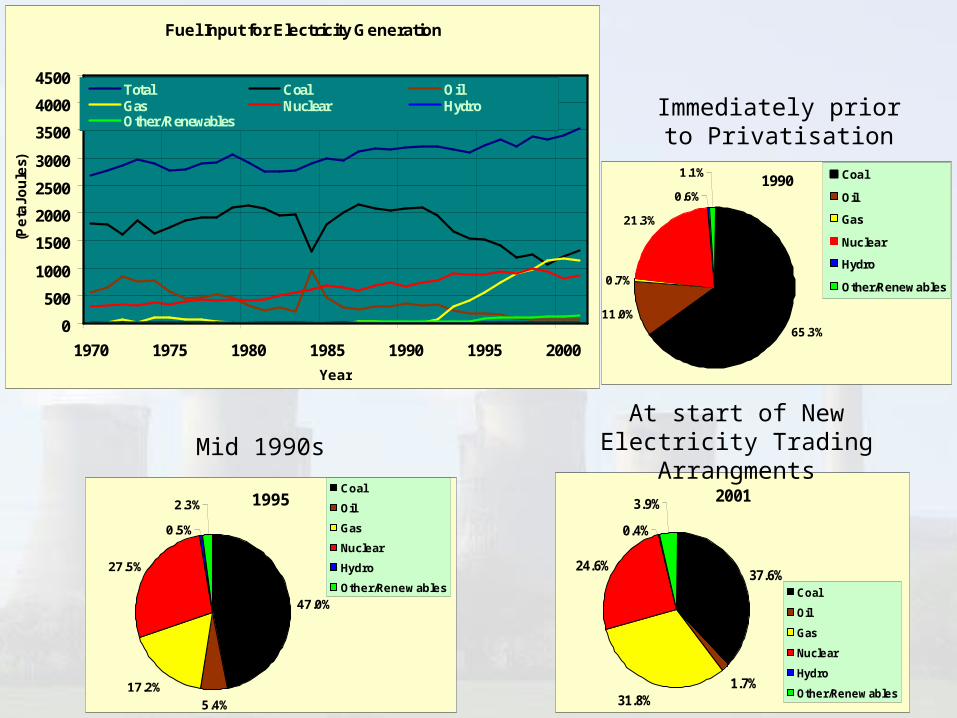
Fuel Input for Electricity Generation
0
500
1000
1500
2000
2500
3000
3500
4000
4500
1970 1975 1980 1985 1990 1995 2000
Year
(Pe
taJo
ule
s)
Total Coal OilGas Nuclear HydroOther/Renewables
2001
37.6%
1.7%31.8%
24.6%
0.4%
3.9%
Coal
Oil
Gas
Nuclear
Hydro
Other/Renewables
1995
47.0%
5.4%
17.2%
27.5%
0.5%
2.3%Coal
Oil
Gas
Nuclear
Hydro
Other/Renewables
Immediately prior to Privatisation
Mid 1990sAt start of New Electricity
Trading Arrangments
1990
65.3%
11.0%
0.7%
0.6%
1.1%
21.3%
Coal
Oil
Gas
Nuclear
Hydro
Other/Renewables

Изменяющееся лицо рынка электроэнергии в Британии
0
50
100
150
200
250
300
350
400
1970 1975 1980 1985 1990 1995 2000
Year
TW
h
Coal & Oil CCGTNuclear RenewablesTotal
• Demand has risen by 50% since 1970 (Потребление возросло с 1970 на 50 %)
• Large rise in output from CCGT since 1993 (Большой рост CCGT производства с 1993)
• Nuclear output increased steadily but is set to decline (Производство ядерной э/э возрастало постепенно, но пошло на убыль)
• Coal [Oil] generation has fallen rapidly since Privatisation (Производство угля (нефти) резко сократилось после приватизации)
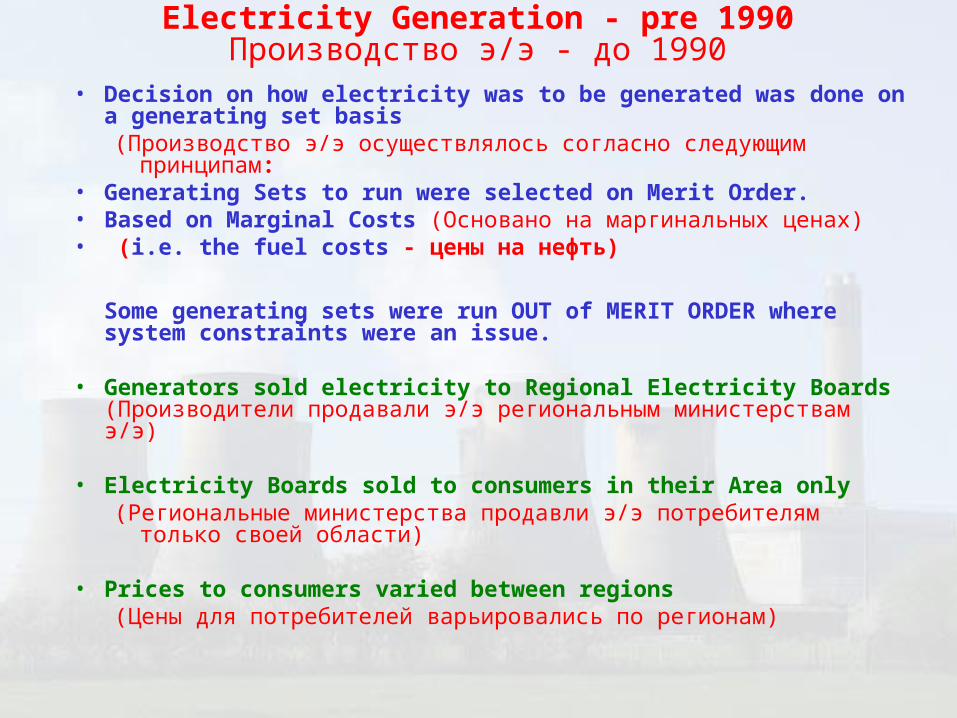
• Decision on how electricity was to be generated was done on a generating set basis (Производство э/э осуществлялось согласно следующим принципам:
• Generating Sets to run were selected on Merit Order.• Based on Marginal Costs (Основано на маргинальных ценах)• (i.e. the fuel costs - цены на нефть)
Some generating sets were run OUT of MERIT ORDER where system constraints were an issue.
• Generators sold electricity to Regional Electricity Boards
(Производители продавали э/э региональным министерствам э/э)
• Electricity Boards sold to consumers in their Area only (Региональные министерства продавли э/э потребителям только своей
области)
• Prices to consumers varied between regions (Цены для потребителей варьировались по регионам)
Electricity Generation - pre 1990Производство э/э - до 1990

•Most Generating Capacity in North (Наибольший объем производства на Севере)
•Most coal-fired stations in North (Большинство угольных станций на Севере)
•Most Oil-fired stations in South (Большинство нефтяных станций на Юге)
•Nuclear stations - distributed around coast (Атомные станции рассредоточены по побережью)
•Most Hydro stations are in Scotland (Большинство ГЭС в Шотландии)
Изменяющееся лицо рынка электроэнергии в Британии
Significant power flows North > South

Central Electricity Generating BoardЦентральное
12 Regional Electricity Companies 12 Региональных э/э компаний
•Coal (Угольные) Fired Power Stations
•Oil (Нефтяные) Fired Power stations
•Gas Turbine (Газовы турбины) Stations
• Hydro Stations (ГЭС)
•Nuclear Stations (Атомные)
•Transmission (Трансмиссия)
National PowerНациональная
энергетика
PowerGen
Nuclear Electric
National Grid Company Национальная сетевая компания
12 Regional Electricity Companies (12 Региональных э/э компаний)
Privatisation of Electricity Supply Industry 1990 Приватизация в области энергетики в 1990

Typical UK Electricity Demand in Winter
2003 and 2005
0
10
20
30
40
50
60
0 24 48 72 96 120 144 168
GW
4th - 10th January 2003
11th - 17th January 2003
12th - 18th February 2005
Sat Sun Mon Tues Wed Thurs Fri
0
10
20
30
40
50
60
0 3 6 9 12 15 18 21 24
Hours
GW
4th January 2003
11th January 2003
16th February 2005
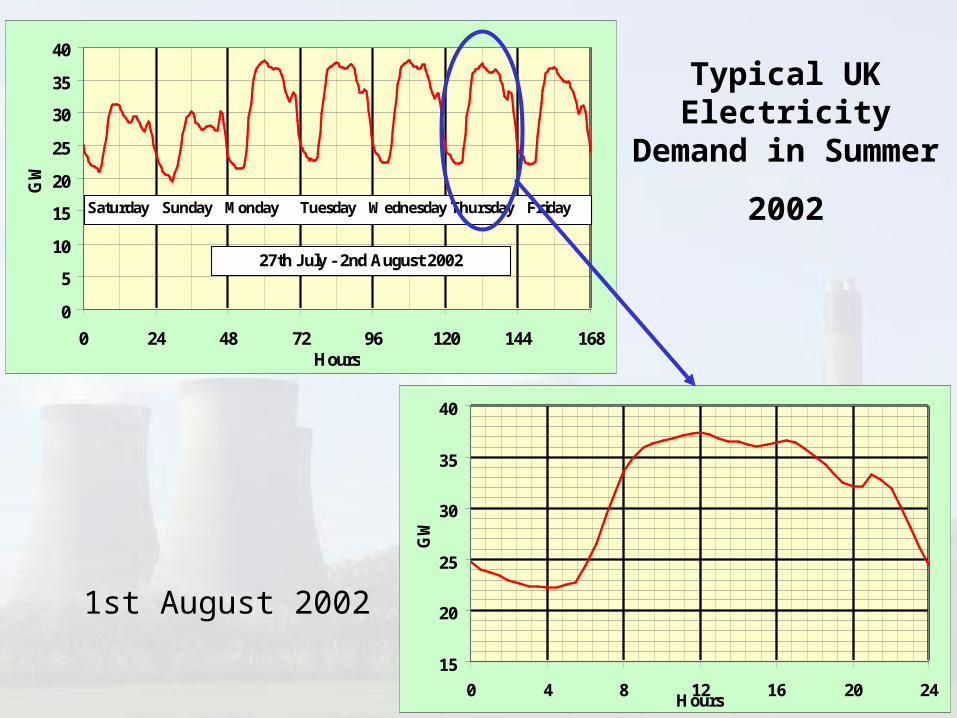
0
5
10
15
20
25
30
35
40
0 24 48 72 96 120 144 168Hours
GW
27th July - 2nd August 2002
Saturday Sunday Monday Tuesday Wednesday Thursday Friday
15
20
25
30
35
40
0 4 8 12 16 20 24Hours
GW
Typical UK Electricity Demand in Summer
2002
1st August 2002
The changing face of the Electricity Market in the UK
A brief review of the UK Electricity Industry prior to 1990. Краткий обзор состояния британской электроэнергетики перед
приватизацией в 1990 г
The Electricity Markets in the 1990s after Privatisation Рынки электроэнергии в 1990 г после приватизации
The New Electricity Trading Arrangements Новая система оптовой торговли НЕТА
The Supply of Electricity since 1990 Сбыт электроэнергии с 1990

The Electricity Markets in the 1990s after Privatisation
Рынки электроэнергии в 1990 г после приватизации
The changing face of the Electricity Market in the UK
The bidding process - Pool Input and Pool Output
Процесс подачи заявок в системе пула
The Electricity Pool
Электрический пул

Eastern **
Industry-Промышленность
Independents-Независимые
Electricité de France
Innogy
Nuclear Electric *
BNFL (Magnox)
PowerGen
RECs
Licensed Suppliers
Лицензированные
поставщики
Consumers
Потребители
Second Tier
Consumers
Вторичные потребители
The
Pool
Пул
Scottish Nuclear
(Атомная) *
ConsumersПотребители
Scottish Hydro
Scottish PowerScotland
England and Wales

• Only the Generators (>100 MW) bid into the POOL to supply electricity e.g. National Power (now Innogy), PowerGen etc (В торгах POOL принимали участие только производители (>100 MW), таки как Национальная Энергетика (теперь Innogy), Powergen и т.д.)
• The National Grid Company published projected demands for the following day and invited bids (Национальная сетевая Компания выдавала данные по спросу на следующий день и инициировала торги)
• The Generators supplied bids for each generating set in each station for each half-hour period of the following day (Производители снабжали заявки на каждой станции для каждого получасового периода следующего дня)
• The NGC sorted bids to determine which generating sets would be used for each particular period, and which ones would have capacity made available (NGC классифицировало заявки по каждому периоду
The Operation of The Electricity Pool: 1990 – 2001
Функционирование Электрического Пула: 1990-2001

Bid from company B £19.31 per MWh
Bid from company A £19.20 per MWh (0.96R / kWh)
Bid from company D £19.40 per MWhBid from company E £19.50 per MWh
Bid from company C £19.32 per MWh
Range of bids from companies in range £18 - £19 per MWh
0.90 - 0.95 Roubles per kWh
Range of bids from companies in range £15 - £18 per MWh
0.75 - 0.9 Roubles per kWh
Range of bids from companies in range <£15 per MWh
0.75 Roubles per kWh
10000 MW
10000 MW
10000 MW
1250 MW1250 MW
1250 MW1250 MW1250 MW
32500 MW
System Marginal
Price
= £19.31
SMP
Companies up to and
including B successful
£1 ~ 50 Roubles

• All Companies who were successful were paid the SMP for all units generated irrespective of what their bid was
(Все Компании, успешно оплатившие SMP независимо от цели заявки )
• The bids were for the single half-hour period and fresh bids were required for all half hour periods
• (Заявки были на отдельные получасовые периоды и новый запрос делался каждые пол часа)
• It was possible for companies to bid £0 and this would guarantee that they generated and paid SMP
• (Было достаточно подать нулевую заявку и это гарантировало выработку и выплату SMP)
– However, if all Companies did the same they would have to generate electricity for nothing (Хотя если бы так поступали все компании электричество вырабатывалось бы в пустую)
• In addition to the SMP, there was also a capacity charge relating to the generating capacity which was requested to be available
The Operation of The Electricity PoolРабота электрического Пула
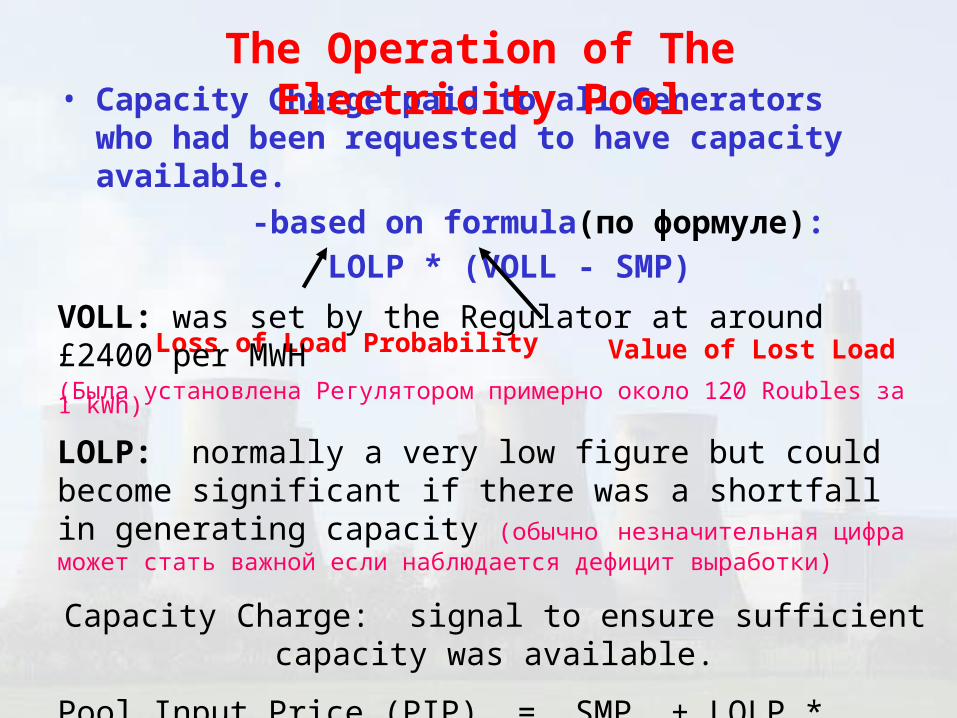
• Capacity Charge paid to all Generators who had been requested to have capacity available.
-based on formula(по формуле):
LOLP * (VOLL - SMP)
Loss of Load Probability
The Operation of The Electricity Pool
VOLL: was set by the Regulator at around £2400 per MWH (Была установлена Регулятором примерно около 120 Roubles за 1 kWh)
LOLP: normally a very low figure but could become significant if there was a shortfall in generating capacity (обычно незначительная цифра может стать важной если наблюдается дефицит выработки)
Capacity Charge: signal to ensure sufficient capacity was available.
Pool Input Price (PIP) = SMP + LOLP * (VOLL - SMP)
Value of Lost Load

•Some Power Stations constrained “ON” to ensure security of supply even when their bid was more expensive
(Некоторые электростанции constrained “ON” обеспечить снабжение, даже в случае более дорогих заявок)
•Some Power Stations constrained “OFF” even when their bid was cheaper (-excess of capacity in one region)
(Некоторые электростанции constrained “OFF” обеспечить снабжение, даже в случае более дешевых заявок)
•Constrained Stations paid their “Bid” Price (уплачивали их «заявочную» цену)
•POOL Output Price: (POP) = Pool Input Price + Uplift
•Uplift represented the additional charges incurred to National Grid Company because of System Constraints
•Suppliers purchased Electricity at Pool Output Price (Поставщики закупают э/э на Пуле по цене производителя)
Электрический пулSystem Constraints (Система давления):
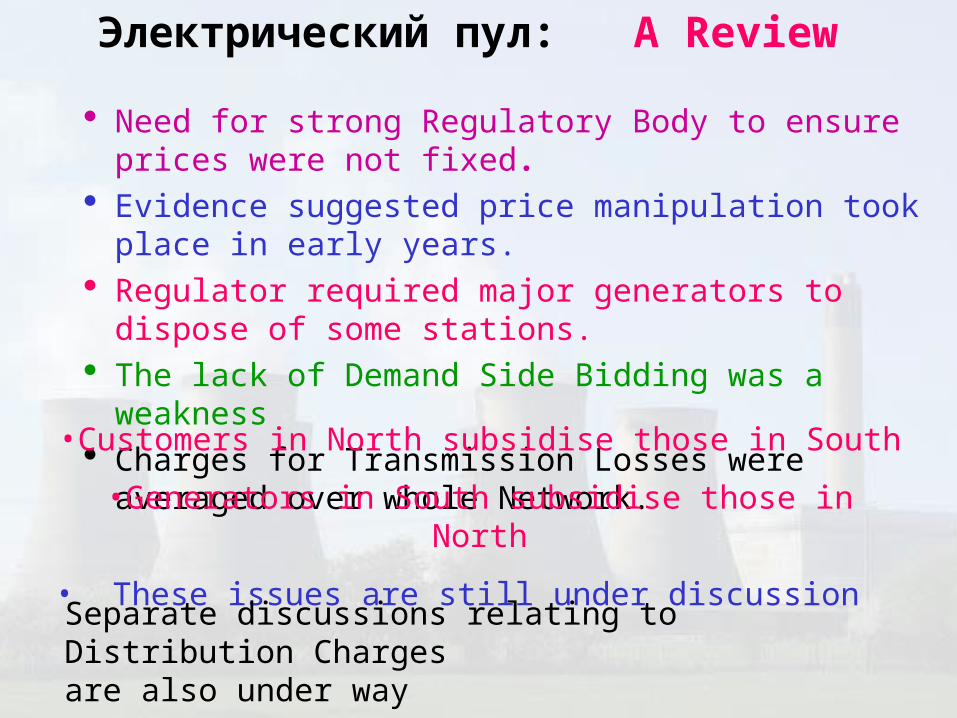
Электрический пул: A Review
Need for strong Regulatory Body to ensure prices were not fixed.
Evidence suggested price manipulation took place in early years. Regulator required major generators to dispose of some stations. The lack of Demand Side Bidding was a weakness Charges for Transmission Losses were averaged over whole
Network.
•Customers in North subsidise those in South
•Generators in South subsidise those in North
• These issues are still under discussion
Separate discussions relating to Distribution Charges are also under way

Changes in Regional Electricity Companies in the 1990s
• Mergers Scottish Hydro & Southern
become Scottish & Southern
• Take-over Scottish Power takes over MANWEB
• Vertical Integration• nPower acquire Midlands
• PowerGen acquire East Midlands
• United Utilities formed– in NORWEB area
PowerGen
nPower
United Utilities
Scottish & Southern
Scottish & Southern
Scottish
Power
Scottish
Power
1990
c. 1998

A brief review of the UK Electricity Industry prior to 1990. Краткий обзор состояния британской электроэнергетики перед
приватизацией в 1990 г The Electricity Markets in the 1990s after Privatisation Рынки электроэнергии в 1990 г после приватизации
The New Electricity Trading Arrangements Новая система оптовой торговли НЕТА
The Supply of Electricity since 1990 Сбыт электроэнергии с 1990
The changing face of the Electricity Market in the UK

The New Electricity Trading Arrangements
Новая система оптовой торговли НЕТА
The changing face of the Electricity Market in the UK
The basic principles
Основные принципы
Gate Closure and Final Physical Notification
Закрытие периода и окончательная физическая нотификация
The Balancing Mechanism
Балансирующий механизм

The basic principles [Основные принципы]
Новая система оптовой торговли НЕТА
How does it differ from the Pool?
• Both Generating and Demand Side Bidding Takes Place
• Most Electricity (>90%) is traded outside NETA Balancing Mechanism
NETA favours generators and suppliers who can guarantee specific levels of generation/supply in advance.
NETA favours generators and suppliers who can guarantee flexibility in output / demand at short notice.

The basic principles [Основные принципы]
Новая система оптовой торговли НЕТА
How does it differ from the Pool? - continued
• Generators and Suppliers are penalised if they deviate from their agreed level of generation / supply.
• System security is maintained via the Balancing Mechanism [Балансирующий механизм]
• Renewable Generators e.g. Wind and small CHP (~10 MW) can be adversely affected.

The basic principles [Основные принципы]
Generation and Supply focuses on
Новая система оптовой торговли НЕТА
• Balancing Mechanism [Балансирующий механизм]
(BM) Units
Generating BM Units may be a single generating set or a
collection of small generating sets.
Demand BM Units may be a single large demand consumer or a
collection of small consumers.
• Trading can take place between Generating and Demand BM Units
• Only the volume traded ( not price) has to be notified.

The New Electricity Trading Arrangements
• Each Generating or Demand BM Unit notifies System Operator of the projected Volume of Electricity to be Traded for each half hour period by 11:00 on preceding day.
Initial Physical Notification (IPN)
System Operator checks sufficient capacity is available.
Initially 3.5 hours before REAL Time - later reduced to 1 hour.
Final agreed Volumes to be traded noted before Gate Closure.
Final Physical Notification (FPN)
окончательная физическая нотификация
Gate Closure and Final Physical Notification
Закрытие периода и окончательная физическая нотификация
GATE CLOSURE : Закрытие периода

The Balancing Mechanism Балансирующий механизм
Day Before Current Day
IPN FPN
Gate Closure
Real
Time
30
mins3.5 hours 1 hour
Operation of Balancing Mechanism
Summary
• Changes to contract position cannot be made after Gate Closure
• The Balancing Mechanism is operated after Gate Closure to provide System Security

The Balancing Mechanism Балансирующий механизм
The New Electricity Trading Arrangements
Новая система оптовой торговли НЕТА
• To allow system to remain stable
• Too little electricity on the system
– Generators can OFFER to INCREASE output
– Suppliers can OFFER to REDUCE consumption
Time
FPNOFFER
Time
FPNOFFER
• If OFFER is agreed then Generators / Suppliers are PAID for any electricity increased / reduced under the OFFER.
The Balancing Mechanism Балансирующий механизм
The New Electricity Trading Arrangements
Новая система оптовой торговли НЕТА
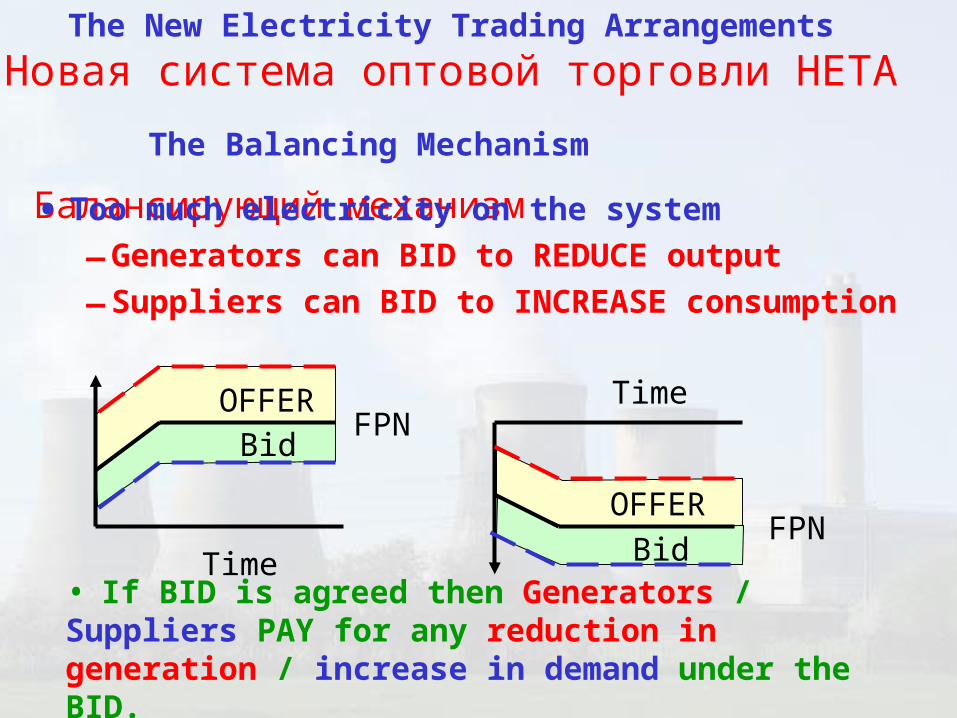
• Too much electricity on the system
– Generators can BID to REDUCE output
– Suppliers can BID to INCREASE consumption
• If BID is agreed then Generators / Suppliers PAY for any reduction in generation / increase in demand under the BID.
Time
FPNOFFER
Bid
FPNOFFER
Bid
Time

The Balancing Mechanism Балансирующий механизм
Generators / Suppliers may submit OFFERs or BIDs which differ for different levels of deviation from the Final Physical Notification
National Grid Company normally accepts OFFERS / BIDS which are cheapest unless System Constraints prevent this.
25 - 50 MW: £30 per MWh (1.5 Roubles per kWh)
50 - 100 MW: £50 per MWh (2.5 Roubles per kWh)
0 - 25 MW: £20 per MWh (1 Rouble per kWh) FPN окончательная физическая нотификация
Example of Differential Offers from a Generator

The Balancing Mechanism Балансирующий механизм
What happens if System Operator has got it wrong?
• OFFERs / BIDs cannot be cancelled
• UNDO BID removes an OFFER and is usually less than the OFFER
• UNDO OFFER removes a BID and is usually more than the BID
• OFFERs / UNDO BIDs [ or BIDs / UNDO OFFERs] are submitted in pairs
OFFER / UNDO BID: Pair +2
OFFER / UNDO BID: Pair +1
BID / UNDO OFFER: Pair -1
BID / UNDO OFFER: Pair -2
FPN

Новая система оптовой торговли НЕТАWhat happens if a Generator / Supplier is out of balance?
• Unexpected changes in Demand• Equipment Failure
Generator / Supplier has too much electricity on the system [too much generation / too little demand]
* charged for imbalance at System Sell Price
Generator / Supplier has too little electricity on the system [too little generation / too much demand]
* charged for imbalance at System Buy Price
Example from February0
10
20
30
40
50
60
70
80
90
0 3 6 9 12 15 18 21 24 3 6 9 12 15 18 21 24Time (hours)
(£ p
er M
Wh)
Sell Price
Buy Price
February 14th 2005 February 15th 2005

Новая система оптовой торговли НЕТАHow well has it performed since starting on 27th March 2001?
In last 18 months wholesale prices have risen and are now higher than at start of NETA
Wholesale Contact Prices since start of NETA
10
15
20
25
30
35
40
£ pe
r M
wh
base load
peak
Apr
01
Apr
03
Apr
02
Apr
04
Jul 0
1
Jul 0
3
Jul 0
4
Jul 0
2
Oct
01
Oct
04
Oct
03
Oct
02
Jan
02
Jan
03
Jan
04

Новая система оптовой торговли НЕТАHow well has it performed since starting on 27th March 2001?
From ELEXON Web Site: 18th February 2005
0
20
40
60
80
100
120
140
160
180
£ p
er M
Wh
System Sell Price
System Buy Price
2001 2002 2003 2004

The changing face of the Electricity Market in the UK
A brief review of the UK Electricity Industry prior to 1990. Краткий обзор состояния британской электроэнергетики перед
приватизацией в 1990 г The Electricity Markets in the 1990s after Privatisation Рынки электроэнергии в 1990 г после приватизации The New Electricity Trading Arrangements Новая система оптовой торговли НЕТА
The Supply of Electricity since 1990 Сбыт электроэнергии с 1990

The Supply of Electricity since 1990Сбыт электроэнергии с 1990
Large Consumers (> 1 MW)
Крупные потребители
Before privatisation:
• Could only purchase from the Local\Regional Electricity Company (REC) supplier in their region
After privatisation
• Consumers > 1MW could purchase from ANY REC not just their own regional Company (second tier RECs).
0
10
20
30
40
50
60
70
80
90
90/91 94/95 96/97 97/98 98/99 99/00
Un
its
Su
ppli
ed (
TWH
)
Licensed Suppliers
Second Tier
First T ier
• From 1994 Consumers > 100 kW were included in Deregulation
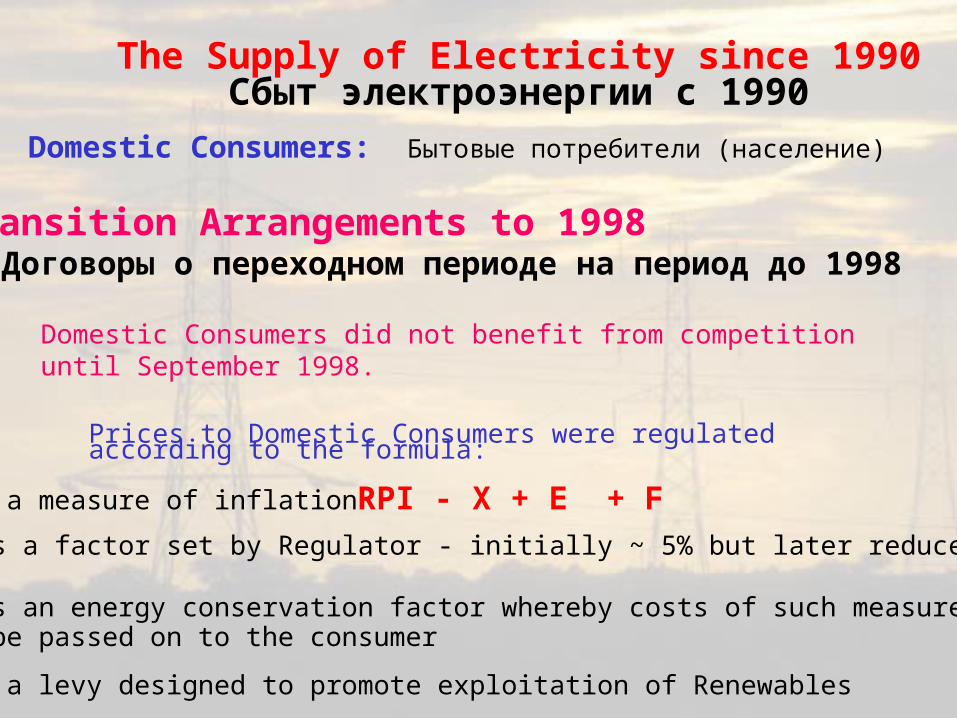
Domestic Consumers: Бытовые потребители (население)
The Supply of Electricity since 1990Сбыт электроэнергии с 1990
Domestic Consumers did not benefit from competition until September 1998.
Prices to Domestic Consumers were regulated according to the formula:
RPI - X + E + F
Transition Arrangements to 1998Договоры о переходном периоде на период до 1998
RPI is a measure of inflation
X was a factor set by Regulator - initially ~ 5% but later reduced.
E was an energy conservation factor whereby costs of such measures could be passed on to the consumer
F was a levy designed to promote exploitation of Renewables

Domestic Consumers: Бытовые потребители (население)
September 1998 - June 1999
The Supply of Electricity since 1990Сбыт электроэнергии с 1990
Regions of England and Wales were progressively Deregulated so that Domestic Consumers could purchase their electricity from any supplier.
Implementation of Deregulation in stages: allowed any initial problems encountered to be sorted out.
After Deregulation, the RPI - X + E + F formula no longer applied.
To allow new suppliers to gain a foothold, the existing suppliers could not reduce their prices in their own area for a further transition period of a few years.

The unit charge to the consumer has three components.
• The actual unit charge as determined by the Supplier
• A distribution charge (payable to local REC as distributing company) which is same for all suppliers in a region
• A meter reading charge.
The domestic consumer does not see these different component parts on their bills.
Электрический пул: Supply Side
Domestic Consumers: Бытовые потребители (население)
Tariff Structure: Структура тарификации

Domestic Fuel Prices in Real Terms
0
20
40
60
80
100
120
140
1970 1980 1990 2000 2010
Inde
x (1
990
- 100
)
Electricity
Gas Privatisation
Deregulation
NETA
Effects of Privatisation and Deregulation on Energy Prices
•Deregulation in Domestic Market
•1996 - 1998 for Gas
•1998 - 1999 for Electricity
Industrial Prices in Real Terms
0
20
40
60
80
100
120
140
160
180
200
1960 1970 1980 1990 2000 2010
Ind
ex
(19
90 =
100
)
Electricity
Gas
Large Consumers (> 1 MW)Крупные потребители
Domestic Consumers:
Бытовые потребители (население) [Восточной Англии]
1998: 7.48p (3.74 Roubles) per kWh
2002: 5.62p (2.81 Roubles) per kWh
Jan 2004: 6.30p (3.05 Roubles) per kWh
Oct 2004: 7.50p (3.75 Roubles) per kWh
PrivatisationNETA
Source: Energy Sector Indicators: Department of Trade and Industry

Changes in Structure of Supplies Companies in last 4 years
Electricité de France (EDF) acquire London and SEEBOARD
Only in Scotland has their been no change in ownership
PowerGen acquires Eastern (TXU)
EDF acquire SWEB
nPower acquires Yorkshire
Scottish and Southern acquire SWALEC
nPower acquire Northern
PowerGen acquire NORWEB

Distributed Network
Ownership
Regional Supply
Ownership
Scottish & SouthernScottish Power
United Utilities
Mid American
PowerGen
Electricité de France
Aquila
Western Power
Scottish & SouthernScottish Power
nPowerPowerGen
Electricité de France
Distributed Network Ownership in 2004

Since April 1st 2002, all suppliers must provide a minimum percentage of electricity from renewable sources.
• The percentage is set to increase each year to 10.4% by 2010.
• Compliance is indicated by Renewable Obligation Certificates. Failure to meet this requirement incurs a fine at the “Buy-out” price - initial 3p per kWh (1.5 Roubles per kWh) and rising in line with inflation - currently 3.129p per kWh.
• “But-out” fines are recycled to companies in proportion to ROCs they hold - thus trading is occuring in ROCs at a surcharge price as high as 4.8p per kWh (2.4 Roubles).
• Domestic prices are set to rise slightly because of this Renewable Obligation.
Электрический пул: Supply SideImpact on Suppliers of Renewables Obligation Certificates (ROCs)
Воздействие Сертификатов обязательства по использованию возобновляемых источников

Conclusions (1)Key Changes in Electricity Market in UK
• April 1st 1990: Privatisation: Electricity POOL Established
• Large Consumers benefit from Deregulation
• 1994: Intermediate Consumers benefit from Deregulation
• 1998 + All Consumers benefit from Deregulation
• 27th March 2001: NETA replaced POOL• 1st April 2002: Renewable Obligation comes into force
• The POOL and NETA were not used in Scotland
The Future
BETTA (British Electricity Transmission and Trading Arrangements). It is planned to extend NETA to include Scotland in April 2005 (recently put back from October 2004)

• Key Changes in Electricity Market in UK
• Prices to consumers fell as a result of Deregulation (up to 20% in some cases but have returned to pre-Deregulation levels)
• Wholesale prices of Electricity fell by 20% after NETA, but have risen significantly in last 18 months.
• Prices to consumers changed little after introduction of NETA - but have recently risen in response to wholsesale price changes.
• Most electricity >> 90% is traded outside Balancing Mechanism Trading
• NETA favours Generators / Suppliers who can guarantee output / supply in advance
• NETA favours Generators / Suppliers who can be flexible to make adjustments during Balancing Mechanism Trading.
Conclusions (2)
Conclusions (3)
There is a need for
• A strong Regulator with Powers to curtail malpractice
• A Consumer Watchdog to deal with Complaints etc.
New companies are emerging in the market
•Metering Companies
•Distribution only Companies
•Significant changes in structure
•Mergers / Demergers
•Vertical Integration / Splitting of functions

The changing face of the Electricity Market in the UKИзменяющееся лицо рынка электроэнергии в Британии
Some Useful WEB Sites
•www.bmreports.com/ : Up to date information of NETA Market
•www.ofgem.gov.uk/ : The UK Regulator
•www.elexon.co.uk/ : Documents and Modifications to NETA
•www.nationalgrid.com/uk/ : The System Operator
•www.energywatch.org.uk/ : Energy Watch
•www2.env.uea.ac.uk/gmmc/energy/enpoint.htm
the Energy Web Page at UEA giving links to many Energy Web Sites in UK and overseas.
This presentation is available over Internet atwww2.env.uea.ac.uk/gmmc/neta/NETA.htm

Н.К.Тови М.А., д-р технических наук
Факультет экологических исследований Университета Восточной Англии
School of Environmental SciencesUniversity of East Anglia
Norwich NR4 7TJ
Energy Science Director
Low Carbon Innovation Centre