N COURT-APPOINTED SPECIAL ADVOCATE PROGRAM · A CASA volunteer may also be a GAL or work in...
93
NATIONAL COURT-APPOINTED SPECIAL ADVOCATE PROGRAM U.S. Department of Justice Office of the Inspector General Audit Division Audit Report 07-04 December 2006
-
Upload
vuongthuan -
Category
Documents
-
view
214 -
download
0
Transcript of N COURT-APPOINTED SPECIAL ADVOCATE PROGRAM · A CASA volunteer may also be a GAL or work in...

NATIONAL COURT-APPOINTED SPECIAL ADVOCATE PROGRAM
U.S. Department of Justice Office of the Inspector General
Audit Division
Audit Report 07-04 December 2006

NATIONAL COURT-APPOINTED SPECIAL ADVOCATE ASSOCIATION
EXECUTIVE SUMMARY
As required by Congress, the U.S. Department of Justice Office (DOJ)
of the Inspector General (OIG) conducted an audit of the National Court-Appointed Special Advocate Association (NCASAA).1 The objectives of this audit, as mandated by Congress, were to determine: (1) the types of activities NCASAA has funded since 1993, and (2) the outcomes in cases where court-appointed special advocate (CASA) volunteers are involved as compared to cases where CASA volunteers are not involved, including:
• the length of time a child spends in foster care;2
• the extent to which there is an increased provision of services;
• the percentage of cases permanently closed;3 and
• achievement of the permanent plan for reunification or adoption.4
1 Pub. L. No. 109-162 (2006) 2 Generally, prior studies of the CASA program and the data tracked by the
U.S. Department of Health and Human Services (HHS) on children in the state and local child protective services (CPS) system reported on children in out-of-home care rather than children in foster care. The information reported on children in out-of-home care includes all children in foster care, as well as children placed with a relative or legal guardian, who was not a qualified foster parent. Since the prior studies and available HHS data did not include information on only those children in foster care, in this report we considered all children in out-of-home care to be in “foster care” for the purposes of addressing this objective.
3 All state and local CPS cases are eventually permanently closed because even in those cases for which permanent placement of the child was not achieved, the case is closed when the child reaches the age of majority, is incarcerated, or dies. As a result, for the purposes of this audit we defined permanent closure as those cases that had been closed by CPS, whether due to permanent placement or any other reason, and the child had not reentered the Child Welfare System (CWS) at anytime prior to the date the case data was collected for this audit.
4 For each child in the CWS, a permanent plan for the placement of the child is developed. The permanent plan outlines what will happen to the child upon resolution of the cases. Generally, the permanent plan is either reunification with the parents or adoption.

- ii -
Background
In 1976, Superior Court Judge David Soukup of Seattle, Washington, concluded that he was not obtaining sufficient relevant facts during case hearings necessary to ensure that the long-term welfare of the child was being represented. To address this concern, he developed the concept of recruiting and training community volunteers to represent the best interest of the child in court proceedings. In 1977, the first CASA pilot program was implemented in Seattle. The purpose of the CASA program is to ensure that abused and neglected children receive high-quality, sensitive, effective, and timely representation in court hearings to determine their guardianship.
In 1978, the National Center for State Courts selected the Seattle CASA program as the best national example of citizens participating in juvenile justice, resulting in the replication of the program in courts across the country. By 1982, it was clear that a national association was needed to coordinate the 54 existing state and local CASA programs and provide training and technical assistance. As a result, in 1984 NCASAA was incorporated and its headquarters office was opened in Seattle.
At the time NCASAA was incorporated, there were 107 state and local CASA programs in 26 states.5 As of 2005, there were 948 state, local, and tribal CASA programs in 49 states that served an estimated 226,204 children.6 Statistics on Child Abuse in the United States
According to the U.S. Department of Health and Human Services (HHS), in fiscal year (FY) 2004, an estimated 3 million children were alleged to have been neglected or abused and were the subject of investigation or assessment by state or local child protective services (CPS) agencies.7 Additionally, in FY 2004:
• Approximately 872,000 children were identified as victims of maltreatment.
5 These programs include both CASA volunteers and guardian ad litem (GAL)
volunteers, who are generally lawyers appointed by the court to represent children in abuse or neglect cases. A CASA volunteer may also be a GAL or work in conjunction with a GAL.
6 North Dakota is the only state with a CASA program that is not a member of NCASAA because it uses paid advocates rather than volunteers.
7 U.S. Department of Health and Human Services, Administration for Children, Youth and Families, Children’s Bureau, Child Maltreatment 2004, (Washington, D.C.: U.S. Government Printing Office, 2006).

- iii -
• An estimated 1,490 children died as a result of child abuse or neglect.
• More than 80 percent of the children who died were 4 years old or younger.
An HHS report, The Adoption and Foster Care Analysis and Reporting
System (AFCARS) Report No. 13, Preliminary FY 2005 Estimates, September 2006 (2005 AFCARS report), estimated that as of September 30, 2005:8
• An estimated 513,000 children were in foster care. • The average age of children in foster care was 10 years old and the
average length of stay in foster care was 28.6 months.
• 118,000 children were awaiting adoption.
Further, according to the 2005 AFCARS report, in FY 2005 approximately 311,000 children entered foster care, while 287,000 exited foster care. Office of Justice Programs
Since 1984, DOJ Office of Justice Programs (OJP) has worked to improve the juvenile justice systems and assist crime victims. The Victims of Child Abuse Act of 1990, as amended, authorized the OJP Office of Juvenile Justice and Delinquency Prevention (OJJDP) to administer a newly created CASA grant program.
The OJP Office for Victims of Crime (OVC) also provides funding
through the Tribal Court CASA Program, which assists in developing and enhancing programs that provide volunteer advocacy for abused or neglected Native American children. Additionally, CASA programs are also eligible to receive Victims of Crime Act (VOCA) funding at the state level, which provides support services to crime victims.
OJP partners with NCASAA to administer the CASA grant program and provide funding, training, and technical assistance to state, local, and tribal CASA programs. Since 1993, OJP has awarded NCASAA 15 grants totaling
8 U.S. Department of Health and Human Services, Administration for Children, Youth
and Families, Children’s Bureau, The AFCARS Report No.13, Preliminary FY 2005 Estimates, September 2006.

- iv -
$100.4 million, including 12 OJJDP grants totaling $98.52 million and 3 OVC grants totaling $1.88 million. Summary of Findings and Recommendations Activities Funded by NCASAA
To determine the types of activities funded by NCASAA since 1993, as mandated by Congress, we requested that NCASAA provide accounting data from January 1, 1993, through June 30, 2006, for all expenditures from both federal and non-federal funding sources. We found that NCASAA did not retain any accounting records or supporting documentation for expenditures occurring prior to 1995. Additionally, although NCASAA retained some of the accounting records and supporting documentation for 1995 through 1997, the information was incomplete. According to federal regulations (28 C.F.R. § 70), grantees are only required to retain financial records, supporting documents, statistical records, and all other records pertinent to Department of Justice grants for a period of 3 years from the date of submission of the final financial report. Because NCASAA was not required to and did not retain the accounting records and supporting documentation for its expenditures occurring prior to 1998, we cannot provide information regarding activities funded by NCASAA prior to that time in this report.
However, we were able to obtain information related to the activities
funded by NCASAA from January 1, 1998, through June 30, 2006. As shown in Table 1, from January 1, 1998, through June 30, 2006, NCASAA expended $88.86 million in funds received through OJP grant programs and $14.24 million in funds received from all other sources including foundations.

- v -
TABLE 1. NCASAA EXPENDITURES BY ACTIVITY, JANUARY 1, 1998, THROUGH JUNE 30, 2006 (MILLIONS)9
ACTIVITIES FUNDED
TOTAL
FEDERAL
FUNDING
PERCENT OF
TOTAL
FEDERAL
FUNDING
TOTAL FUNDING
NON-FEDERAL
SOURCES
PERCENT OF TOTAL
FUNDING NON-FEDERAL
SOURCES DIRECT ACTIVITIES
Awards to Subgrantees $ 57.16 64.33% $ 3.29 23.10% Training & Technical
Assistance 13.63 15.34% 4.71 33.08% Membership & Public Outreach 11.98 13.48% 4.36 30.62% Subtotal $82.77 93.15% $12.36 86.80%
SUPPORT ACTIVITIES General & Administrative $ 6.09 6.85% $ 0.91 6.39% Fundraising 0.0 0.00% 0.97 6.81%
Subtotal $ 6.09 6.85% $ 1.88 13.20% TOTAL ACTIVITIES
FUNDED10 $88.86 100% $14.24 100%
Source: NCASAA general ledgers
We also found that: • NCASAA expended $82.77 million (93.15 percent) of its OJP grant
funding on activities that directly supported CASA programs. The direct activities funded by NCASAA include: (1) awards to subgrantees to support state and local CASA programs, (2) training and technical assistance for state and local CASA programs, and (3) membership and public outreach.
• NCASAA expended $6.09 million (6.85 percent) of its OJP grant
funding on general and administrative support activities, which is significantly less than the 16.3 percent average administrative costs for human services non-profit organizations.11
9 The amounts reported in this table reflect the activities funded by NCASAA as
determined by our audit. 10 Differences in total amounts are due to rounding, e.g., the sum of individual
numbers prior to rounding may differ from the sum of the individual numbers rounded. 11 Thomas H. Pollak and Mark Hager, The Urban Institute, and Patrick Rooney,
Indiana University, “Understanding Management and General Expenses of Non-profits,” an Overhead Cost Study Working Paper presented at the 2001 Annual Meeting of the Association for Research on Non-profit Organizations and Voluntary Actions, New Orleans, LA, 2001.

- vi -
During our review of NCASAA’s accounting records, we found that from 1999 through 2006 NCASAA recorded that it allocated $1.23 million of its OJP grant funds to fundraising activities. However, we determined that this was the result of an accounting error and that NCASAA did not use OJP grant funds for fundraising activities. We also found that in 1998 and 1999 NCASAA failed to input a program accounting code identifying the program activity for expenses totaling about $1.5 million. We informed NCASAA of these errors during our review, and they have since been corrected. Court-Appointed Special Advocate Program Outcomes We found that with the exception of the length of time a child spends in foster care, HHS does not require state and local CPS programs to report data that specifically addresses the outcome measures mandated by Congress for this audit. NCASAA also does not request that its CASA program members provide data that specifically addresses the outcome measures required for this audit. As a result, although we obtained data for the state and local CASA programs that we used to address the audit objectives, we were not always able to obtain comparison data for cases that did not involve a CASA volunteer.
We also found that OJP had established outcome measures for its CASA grant programs. However, the outcome measures established by OJP do not address the effectiveness of the programs in meeting the needs of children in the CWS. Additionally, none of the outcome measures established by OJP address the outcome measures mandated for this audit. In our judgment, OJP should develop outcome performance measures for the CASA grant programs to determine the effectiveness of the programs in meeting the needs of children in the CWS. As appropriate, these outcome measures should correspond with the data required by HHS for state and local CPS agencies, so that OJP has a basis for comparing the effectiveness of its CASA grant programs.
Because of the lack of data on the objectives mandated for this audit, to determine the outcomes in cases where CASA volunteers are involved as compared to cases where CASA volunteers are not involved, we relied on the following:
• prior studies of the NCASAA program; • data on (1) the length of time a child spends in foster care, (2) the
extent to which there is an increased provision of services, (3) the percentage of cases permanently closed, and (4) achievement of the

- vii -
permanent plan for reunification or adoption from the state and local CASA program case-tracking databases (CASA Data Request), which we compared to national data on the same measures maintained by HHS for all CPS cases, including both CASA and non-CASA cases;
• data from an OIG survey distributed to all state, local, and tribal CASA
program offices; and
• the most recent AFCARS data available at the time our analysis was conducted on all children in the state and local CPS for comparison purposes.12
We identified two studies of the CASA program that in our judgment
provided the most comprehensive and current information related to this objective.
• Youngclarke, Davin M. and Kathleen Ramos and Lorraine
Granger-Merkle. "A Systematic Review of the Impact of Court-Appointed Special Advocates," Journal of the Center for Families, Children and the Courts, Vol. 5, 2004, pp. 109-126 (Youngclarke Review). The Youngclarke Review summarized the findings of 20 prior studies that assessed the impact of CASA programs. In conducting the review, almost 70 prior studies of CASA programs were analyzed, but only 20 met the criteria for inclusion in the results of the Youngclarke Review. The review compares the combined average outcome measures reported in the prior studies for cases involving a CASA volunteer to those for which a CASA volunteer was not appointed.
• Caliber Associates, Evaluation of CASA Representation, 2004, (Caliber
Study).13 The Caliber Study combines data from NCASAA’s management information systems and data collected through the National Survey of Child and Adolescent Well-Being, a federally sponsored national survey of children and their families. The study compares outcome measures for cases involving a CASA volunteer to those for which a CASA volunteer was not appointed.
12 It should be noted that HHS does not collect separate data on CASA cases.
Rather, the AFCARS data includes all CASA and non-CASA cases related to children in the state and local CPS.
13 It should be noted that the Caliber Study was funded in part by NCASAA. Funding was also provided by the Packard Foundation.

- viii -
For the CASA Data Request, NCASAA distributed our request for data on the four outcome measures from the case management systems to 731 state, local, and tribal CASA programs. We received data related to time in foster care, permanent case closure, and the case outcomes including adoption and reunification from 192 respondents representing 339 programs. However, we generally did not receive data on the number of services ordered by the courts and received by children and their parents because it was not generally tracked in the case management systems.
Additionally, we distributed a nationwide survey to state, local, and
tribal CASA programs offices requesting information on the four outcome measures, as well as additional information on the: (1) basis for the responses related to the four outcome measures in our survey, (2) effectiveness of NCASAA, and (3) data reported in the Caliber Study, which was the most recent study available related to the outcome measures. Out of the 945 CASA programs to which the OIG survey was sent, we received 491 responses. The consolidated results of the OIG survey are detailed in Appendix II.
The results of our audit related to the outcomes in cases where CASA
volunteers are involved as compared to cases where CASA volunteers are not involved for (1) the length of time a child spends in foster care, (2) the extent to which there is an increased provision of services, (3) the percentage of cases permanently closed, and (4) achievement of the permanent plan for reunification or adoption, are discussed in the following sections.
Length of Time in Foster Care
We found that the length of time a child spends in foster care is longer for cases involving a CASA volunteer as compared to cases that did not involve a CASA volunteer. As shown in Table 2, the Youngclarke Review and Caliber Study found that the average length of time a child spends in foster care is between 3.9 months and 1.5 months longer for cases involving a CASA volunteer.

- ix -
TABLE 2. LENGTH OF TIME IN FOSTER CARE PRIOR STUDIES TIME IN FOSTER CARE (MONTHS)
STUDY CASA NON-CASA DIFFERENCE
FOR CASA Youngclarke Review 23.9 20.0 + 3.9 Caliber Study 10.2 8.7 + 1.5
Source: Youngclarke Review and Caliber Study It should be noted that both the Youngclarke Review and Caliber Study concluded that there was no significant difference in the length of time a child spends in foster care for cases involving a CASA volunteer as compared to cases that did not involve a CASA volunteer. We also found that the length of time a child spends in foster care is longer for cases involving a CASA volunteer as compared to the national average for all CPS cases, including CASA cases.14 As shown in Table 3, based on the CASA Data Request and the OIG survey the average length of time a child spends in foster care is between 2 months and 1.2 months longer for cases involving a CASA volunteer than the national average for all CPS cases. TABLE 3. LENGTH OF TIME IN FOSTER CARE OIG ANALYSIS
TIME IN FOSTER CARE (MONTHS)
SURVEY CASA AFCARS15
DIFFERENCE
FOR CASA CASA Data Request 15.8 13.8 + 2.0 OIG Survey16 17.2 16.0 + 1.2
Source: CASA Data Request, OIG survey, 2004 and 2005 AFCARS Report
14 For the CASA program case system data request and the OIG survey, we used the
weighted average of the length of time a child spends in foster care where a CASA volunteer is involved.
15 For the CASA Data Request, we compared the weighted average of the length of time a child spends in foster care where a CASA volunteer is involved to the 2004 AFCARS data which was the most recent data available at the time our analysis was conducted. It should be noted that AFCARS data includes all CASA and non-CASA cases related to children in the state and local CPS. For the OIG survey, we compared the weighted average of the length of time a child spends in foster care where a CASA volunteer is involved to the 2005 AFCARS data.
16 The weighted average number of months in foster care that was calculated for the OIG survey is based on the number of respondents rather than children.

- x -
Although we found that children in cases involving a CASA volunteer were on average in foster care longer, this is not necessarily an indication that the CASA program is not effective. We base our conclusion on the following:
• According to the Caliber Study, cases assigned to a CASA volunteer frequently involve the most serious cases of maltreatment and these children were more at risk. As a result, for the majority of cases involving a CASA volunteer, the children were placed in foster care much more frequently than in cases not referred to a CASA program office.
• Based on the results of the OIG survey, we found that the majority of
respondents estimated that on average 81 to 100 percent of the children in cases involving a CASA volunteer were placed in foster care prior to the time that the case was referred to the CASA program office.
• As shown previously in Table 3, from the CASA Data Request and the
OIG survey, we found that in cases involving a CASA volunteer the total time the child was in foster was 2 and 1.2 months longer than in cases not involving a CASA volunteer, respectively. However, from the CASA Data Request and the responses to the OIG survey, we found that for cases involving a CASA volunteer, the child was in foster care an estimated average of 5.5 and 4.5 months, respectively, prior to the time that the case was referred to a CASA program office. Therefore, the time children spent in foster care prior to the assignment of a CASA volunteer directly affects the fact that children with a CASA volunteer were in foster care longer.
Number of Services Provided Examples of services ordered by the court for children include mental health, medical treatment, and training in independent living if children are close to the age of majority. Services ordered by the court for parents include mental health, drug, and alcohol treatment, as well as training on basic health and domestic violence.
The Youngclarke Review and Caliber Study both included the number
of services ordered for children and the parents of children in cases involving a CASA volunteer as compared to cases not involving a CASA volunteer. This information was obtained from actual CASA, CPS and court case files and through interviews of CASA and CPS officials. Based on the Youngclarke

- xi -
Review and the Caliber Study, on average between 2.1 and 3.1 additional services were ordered by the court for children and the parents of children in cases involving a CASA volunteer, as shown in Table 4. TABLE 4. NUMBER OF SERVICES ORDERED FOR CHILDREN AND
PARENTS NUMBER OF SERVICES
ORDERED STUDY OR SURVEY CASA NON-CASA
DIFFERENCE
FOR CASA Youngclarke Review 9.0 6.9 + 2.1 Caliber Study 19.1 16.0 + 3.1
Source: Youngclarke Review and Caliber Study
We were unable to verify the results of the Youngclarke Review and the Caliber Study. The number of services ordered for children and the parents of children in the CWS is not an outcome that is generally tracked by state, local, and tribal CASA programs in their case management systems. Therefore, we were unable to obtain sufficient data related to this outcome measure from the CASA Data Request.
Based on the OIG survey, we found that on average 8.1 services were ordered for the children and parents of children in cases involving a CASA volunteer. However, HHS does not require state and local CPS programs to report data on the number of services ordered. As a result, we were unable to compare the information we obtained from the OIG survey to the national average.
Percentage of Cases Permanently Closed All state and local CPS cases are eventually permanently closed, even those cases for which permanent placement of the child was not achieved, when the child reaches the age of majority, is incarcerated, or dies. As a result, for the purposes of this audit, we defined permanent closure as those cases that had been closed for any reason and the child had not reentered the CWS at anytime prior to the date the case data was collected for this audit. The Youngclarke Review found that cases involving a CASA volunteer were more likely to be “permanently closed” as compared to cases not involving a CASA volunteer. Specifically, the review found that only 9 percent of children in cases involving a CASA volunteer reentered the CWS as compared to 16 percent of children in cases not involving a CASA volunteer.
- xii -
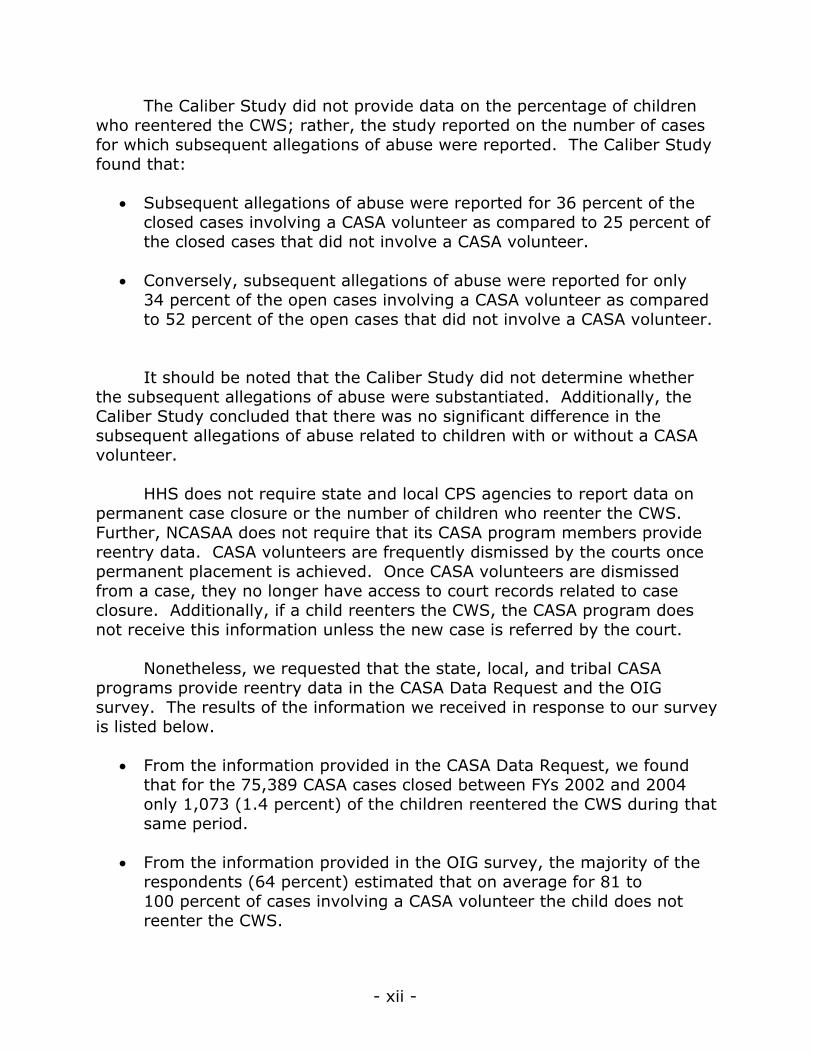
The Caliber Study did not provide data on the percentage of children who reentered the CWS; rather, the study reported on the number of cases for which subsequent allegations of abuse were reported. The Caliber Study found that:
• Subsequent allegations of abuse were reported for 36 percent of the
closed cases involving a CASA volunteer as compared to 25 percent of the closed cases that did not involve a CASA volunteer.
• Conversely, subsequent allegations of abuse were reported for only
34 percent of the open cases involving a CASA volunteer as compared to 52 percent of the open cases that did not involve a CASA volunteer.
It should be noted that the Caliber Study did not determine whether the subsequent allegations of abuse were substantiated. Additionally, the Caliber Study concluded that there was no significant difference in the subsequent allegations of abuse related to children with or without a CASA volunteer.
HHS does not require state and local CPS agencies to report data on permanent case closure or the number of children who reenter the CWS. Further, NCASAA does not require that its CASA program members provide reentry data. CASA volunteers are frequently dismissed by the courts once permanent placement is achieved. Once CASA volunteers are dismissed from a case, they no longer have access to court records related to case closure. Additionally, if a child reenters the CWS, the CASA program does not receive this information unless the new case is referred by the court.
Nonetheless, we requested that the state, local, and tribal CASA
programs provide reentry data in the CASA Data Request and the OIG survey. The results of the information we received in response to our survey is listed below.
• From the information provided in the CASA Data Request, we found
that for the 75,389 CASA cases closed between FYs 2002 and 2004 only 1,073 (1.4 percent) of the children reentered the CWS during that same period.
• From the information provided in the OIG survey, the majority of the
respondents (64 percent) estimated that on average for 81 to 100 percent of cases involving a CASA volunteer the child does not reenter the CWS.
- xiii -
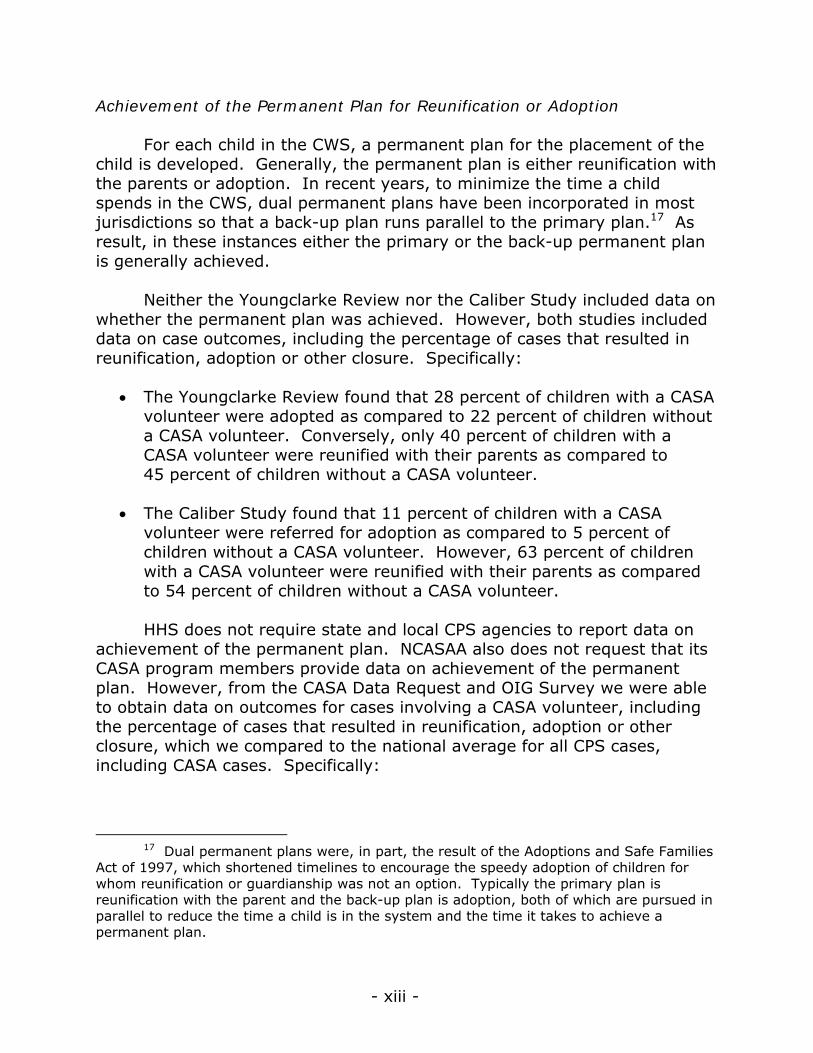
Achievement of the Permanent Plan for Reunification or Adoption For each child in the CWS, a permanent plan for the placement of the child is developed. Generally, the permanent plan is either reunification with the parents or adoption. In recent years, to minimize the time a child spends in the CWS, dual permanent plans have been incorporated in most jurisdictions so that a back-up plan runs parallel to the primary plan.17 As result, in these instances either the primary or the back-up permanent plan is generally achieved. Neither the Youngclarke Review nor the Caliber Study included data on whether the permanent plan was achieved. However, both studies included data on case outcomes, including the percentage of cases that resulted in reunification, adoption or other closure. Specifically:
• The Youngclarke Review found that 28 percent of children with a CASA volunteer were adopted as compared to 22 percent of children without a CASA volunteer. Conversely, only 40 percent of children with a CASA volunteer were reunified with their parents as compared to 45 percent of children without a CASA volunteer.
• The Caliber Study found that 11 percent of children with a CASA
volunteer were referred for adoption as compared to 5 percent of children without a CASA volunteer. However, 63 percent of children with a CASA volunteer were reunified with their parents as compared to 54 percent of children without a CASA volunteer.
HHS does not require state and local CPS agencies to report data on
achievement of the permanent plan. NCASAA also does not request that its CASA program members provide data on achievement of the permanent plan. However, from the CASA Data Request and OIG Survey we were able to obtain data on outcomes for cases involving a CASA volunteer, including the percentage of cases that resulted in reunification, adoption or other closure, which we compared to the national average for all CPS cases, including CASA cases. Specifically:
17 Dual permanent plans were, in part, the result of the Adoptions and Safe Families
Act of 1997, which shortened timelines to encourage the speedy adoption of children for whom reunification or guardianship was not an option. Typically the primary plan is reunification with the parent and the back-up plan is adoption, both of which are pursued in parallel to reduce the time a child is in the system and the time it takes to achieve a permanent plan.

- xiv -
• The CASA Data Request found that 19 percent of children in cases involving a CASA volunteer were adopted as compared to the national 2004 AFCARS average of 18.2 percent. Additionally, 40.8 percent of children in cases involving a CASA volunteer were reunified with their parents as compared to the national 2004 AFCARS average of 54 percent.
• The OIG survey found that respondents estimated that on average
20.7 percent of children in cases involving a CASA volunteer were adopted as compared to the national 2005 AFCARS average of 18.2 percent. Additionally, 44.5 percent of children in cases involving a CASA volunteer were reunified with their parents as compared to the national 2005 AFCARS average of 54 percent.
Based on the available data, we found that children in cases involving
a CASA volunteer were more likely to be adopted and less likely to be reunified with their parents than children in cases not involving a CASA volunteer. However, this may be because cases involving a CASA volunteer are typically the most serious cases of maltreatment. Therefore, children in these types of cases may be less likely to be reunified with their parents, regardless of whether or not a CASA volunteer was involved. Summary and Conclusion
From January 1, 1998, through June 30, 2006, NCASAA expended a total of $88.86 million in funds received through OJP grant programs and $14.24 million in funds received from all other sources, including private foundations. NCASAA expended 93.15 percent of its OJP grant funding on activities that directly supported CASA programs. Conversely, NCASAA expended 6.85 percent of its OJP grant funding on general and administrative support activities, which is significantly less than the 16.3 percent average administrative costs for human services non-profit organizations.
Additionally, from 1999 through 2006, as a result of an accounting
error, NCASAA recorded that it allocated $1.23 million of its OJP grant funds to fundraising activities when, in fact, these funds had not been spent for that purpose. We also found that in 1998 and 1999 NCASAA failed to input a program accounting code identifying the program activity for expenses totaling about $1.5 million. We informed NCASAA of these errors during our review and they have since been corrected.

- xv -
With respect to the questions identified by Congress, we found that OJP had established outcome measures for its CASA grant programs. However, the outcome measures established by OJP do not address the effectiveness of the programs in meeting the needs of children in the CWS. Additionally, none of the outcome measures established by OJP address the outcome measures mandated for this audit. Further, with the exception of the length of time a child spends in foster care, HHS does not require state and local CPS agencies to report data that specifically addresses the outcome measures mandated by Congress for this audit. NCASAA also does not request that its CASA program members provide data that specifically addresses the outcome measures required for this audit.
Nonetheless, based on the available data and the results of the OIG
survey, we found that in cases where CASA volunteers are involved as compared to cases where CASA volunteers are not involved:
• the children spent more time in foster care as result of the fact that the children were generally already in foster care before a CASA volunteer was assigned;
• the children and their parents were ordered by the courts to
participate in more services and received more services;
• the case was more likely to be “permanently closed,” (i.e., the children were less likely to reenter the CWS); and
• the children were more likely to be adopted and less likely to be reunified with their parents.
Although the outcomes for cases involving a CASA volunteer appear to
be less favorable in some instances than cases not involving a CASA volunteer, this may be a result of the fact that cases involving a CASA volunteer are typically the most serious cases of maltreatment. Therefore, children in these types of cases are more likely to: (1) be placed in foster care, (2) require more services, and (3) be adopted rather than reunified with their parents. However, we also found that based on the limited information available, children in cases involving a CASA volunteer were less likely to reenter the CWS after permanent placement was achieved.

- xvi -
Recommendations
Our report contains two recommendations that focus on specific steps that OJP should take to improve the CASA grant program. These recommendations include requiring that:
• NCASAA establish a methodology for allocating indirect costs so that
federal funds are not charged to unallowable cost categories. • Outcome-based performance measures are developed for its CASA
programs that determine the effectiveness of the programs in meeting the needs of children in the CWS. As appropriate, these outcome measures should correspond with the data required by HHS for state and local CPS agencies, so that OJP has a basis for comparing the effectiveness of its CASA grant programs.

NATIONAL COURT-APPOINTED SPECIAL ADVOCATE ASSOCIATION
TABLE OF CONTENTS
INTRODUCTION................................................................................ 1
Background ...................................................................................1
National Court-Appointed Special Advocate Association .................... 2
Court-Appointed Special Advocates ............................................... 4
CASA Volunteer Application, Screening, and Selection ...................... 5
CASA Volunteer Training .............................................................. 6
Statistics on Child Abuse in the United States ................................. 6
Legislation ................................................................................. 7
Office of Justice Programs ............................................................ 7
Office of Juvenile Justice and Delinquency Prevention....................... 8
Office for Victims of Crime............................................................ 9
The National Child Abuse and Neglect Data System ......................... 9
The Adoption and Foster Care Reporting and Analysis System ......... 10
Prior Reviews ..............................................................................10
FINDINGS AND RECOMMENDATIONS.............................................. 13
I. ACTIVITIES FUNDED BY NCASAA SINCE 1993 ........................13
Indirect Activities Funded by NCASAA .......................................... 16
Awards to Subgrantees.............................................................. 16
Recommendation ...................................................................... 18
II. OUTCOMES FOR CASA CASES COMPARED TO NON-CASA CASES ...................................................................................19
Length of Time in Foster Care..................................................... 21
Increased Provision of Services................................................... 26
Percentage of Cases Permanently Closed...................................... 28
Achievement of Permanent Plan.................................................. 30
Summary and Conclusion........................................................... 33
Recommendation ...................................................................... 35
STATEMENT ON INTERNAL CONTROLS............................................ 36
STATEMENT ON COMPLIANCE WITH ............................................... 37
LAWS AND REGULATIONS .............................................................. 37
APPENDIX I - OBJECTIVES, SCOPE, AND METHODOLOGY ............... 38
APPENDIX II - OIG SURVEY CONSOLIDATED RESPONSES .............. 42
APPENDIX III - OJP RESPONSE TO THE DRAFT REPORT ..................72 APPENDIX IV - NCASAA RESPONSE TO THE DRAFT REPORT ...........74
APPENDIX V - ANALYSIS AND SUMMARY OF ACTIONS NECESSARY TO CLOSE THE REPORT......................... 74

- 1 -
INTRODUCTION
As required by Congress, the U.S. Department of Justice Office of the Inspector General (OIG) conducted an audit of the National Court-Appointed Special Advocate Association (NCASAA).1 The objectives of this audit, as mandated by Congress, were to determine: (1) the types of activities the NCASAA has funded since 1993, and (2) the outcomes in cases where court-appointed special advocate (CASA) volunteers are involved as compared to cases where CASA volunteers are not involved, including:
• the length of time a child spends in foster care;2
• the extent to which there is an increased provision of services;
• the percentage of cases permanently closed;3 and
• achievement of the permanent plan for reunification or adoption.4
Background
In 1976, Superior Court Judge David Soukup of Seattle, Washington, concluded that he was not obtaining sufficient relevant facts during case hearings necessary to ensure that the long-term welfare of a child was being represented. To address this concern, he developed the concept of
1 Pub. L. No. 109-162 (2006) 2 Generally, prior studies of the CASA program and the data tracked by the
U.S. Department of Health and Human Services (HHS) on children in the state and local child protective services (CPS) system reported on children in out-of-home care rather than children in foster care. The information reported on children in out-of-home care includes all children in foster care, as well as children placed with a relative or legal guardian, who was not a qualified foster parent. Since the prior studies and available HHS data did not include information on only those children in foster care, in this report we considered all children in out-of-home care to be in “foster care” for the purposes of addressing this objective.
3 All state and local CPS cases are eventually permanently closed because even in those cases for which permanent placement of the child was not achieved, the case is closed when the child reaches the age of majority, is incarcerated, or dies. As a result, for the purposes of this audit we defined permanent closure as those cases that had been closed by CPS, whether due to permanent placement or any other reason, and the child had not reentered the Child Welfare System (CWS) at anytime prior to the date the case data was collected for this audit.
4 For each child in the CWS, a permanent plan for the placement of the child is developed. The permanent plan outlines what will happen to the child upon resolution of the cases. Generally, the permanent plan is either reunification with the parents or adoption.

- 2 -
recruiting and training community volunteers to represent the best interest of a child in court proceedings. In 1977, the first CASA pilot program was implemented in Seattle. The purpose of the CASA program is to ensure that abused and neglected children receive high-quality, sensitive, effective, and timely representation in court hearings to determine their guardianship.
In 1978, the National Center for State Courts selected the Seattle
CASA program as the best national example of citizens participating in juvenile justice, resulting in the replication of the program in courts across the country. By 1982, it was clear that a national association was needed to coordinate the 54 existing state and local CASA programs and provide training and technical assistance. National Court-Appointed Special Advocate Association In 1984, NCASAA, the national headquarters for CASA programs was opened in Seattle. According to NCASAA’s web site, together with its state and local members, its mission “is to support and promote court-appointed special advocacy for abused and neglected children so they can thrive in safe, permanent homes.” NCASAA provides leadership, training, technical assistance, and subgrants to CASA programs across the country. Additionally, NCASAA stages an annual conference, promotes CASA programs through public awareness efforts, and provides counseling and other resources to help start up new programs and to provide vital assistance to existing programs. The state, local, and tribal CASA programs are responsible for recruiting, training, and supporting volunteers in advocating for abused and neglected children.
At the time NCASAA was incorporated, there were 107 state and local CASA programs in 26 states.5 As of 2005, there were 948 state, local, and tribal CASA programs in 49 states that served an estimated 226,204 children. 6 As shown in Figure 1, CASA program coverage varies from state to state.
5 These programs include both CASA volunteers and guardian ad litem (GAL)
volunteers, who are generally lawyers appointed by the court to represent children in abuse or neglect cases. A CASA volunteer may also be a GAL or work in conjunction with a GAL.
6 North Dakota is the only state with a CASA program that is not a member of NCASAA because it uses paid advocates rather than volunteers.

- 3 -
FIGURE 1. PERCENTAGES OF COUNTIES SERVED BY CASA PROGRAMS
Source: Youngclarke Review7 According to the NCASAA Annual Local Program Survey for 2005, an estimated 226,204 children were served by an estimated 53,847 volunteers, as shown in Table 1. TABLE 1. 2005 CASA PROGRAM HIGHLIGHTS
ACTIVITY OR EVENT OUTCOME Number of CASA/GAL program offices 948 Number of volunteers 53,847 Children served 226,204 New volunteers trained 14,806 New children assigned a CASA volunteer 77,801
Source: NCASAA Annual Local Program Survey, 2005
Additionally, according to the 2005 NCASAA Annual Survey, nearly 15,000 new volunteers were trained and nearly 80,000 new children were assigned to a volunteer during 2005.
7 Youngclarke, Davin M. and Kathleen Ramos and Lorraine Granger-Merkle. "A
Systematic Review of the Impact of Court-Appointed Special Advocates," Journal of the Center for Families, Children and the Courts, Vol. 5, 2004 (Youngclarke Review) p. 111.

- 4 -
Court-Appointed Special Advocates
A number of states have legal requirements that specify whether an attorney or volunteer may be appointed as the Guardian ad Litem (GAL) to represent a child in the CWS. Other states detail the roles and responsibilities of the CASA volunteers, their qualifications and training, and their rights and powers. However, a number of states provide greater discretion to the local courts. The most common differences among states involve the role and formal status of the volunteer, the forms of attorney representation, the formal relationship between the volunteer and the attorney for the child, and types of cases accepted. There are five general activities associated with the role of a CASA volunteer:
• Fact finding and information gathering - CASA volunteers meet with and interview everyone connected with the child. They frequently visit with and observe the child, visit the homes of the child and the parent, contact caseworkers, and review case records. These activities help the advocates gain insight into what is best for a child, what kinds of services might be helpful, and what support is needed to move toward achieving the permanent plan.
• Legal representation - These activities must be performed by a
CASA volunteer who is a licensed attorney. The activities include appearances at hearings, filing motions and other legal papers, and advising the child on legal issues. In this role, the CASA volunteer may make recommendations to the court regarding the permanent plan for placement of the child, services to be provided, and visitation issues.
• Negotiation and mediation - The CASA volunteer develops
agreements and conditions between the parties as they pertain to the welfare of the child.
• Case monitoring - The CASA volunteer maintains contact with the
child and other relevant parties, monitors the child’s special needs, and follows up on court orders.
• Resource brokering – The CASA volunteer works in the community
to help children and their parents to obtain needed services.

- 5 -
Regardless of the parameters of the CASA volunteer’s activities within the court system, NCASAA has provided some guiding principles that help ensure the quality of the advocacy. Volunteers:
• must have access to legal support;
• must be independent;
• should be appointed to the case at the earliest possible time;
• should receive notice of all hearings, staffing, and other case conferences related to the child;
• should have complete access to all information related to the child and
the child’s situation; and
• should have immunity from liability for performing their role in a responsible manner.
CASA Volunteer Application, Screening, and Selection
According to NCASAA’s standards, all applicants who want to become CASA volunteers are required to:8
• Complete a written application concerning education, training, employment, and experience in working with children.
• Submit three references, of which two must not be related to the
applicant.
• Authorize federal, state, and local criminal, sex offender, and child neglect and abuse checks.
• Participate in interviews with program personnel.
To become a CASA volunteer, applicants must be at least 21 years of age and have successfully passed the application and screening process. Before volunteers are assigned to a case, all screening must be completed with written verification on file at the program office.
8 NCASAA, Standards for Local CASA/GAL Programs, 2006.

- 6 -
CASA Volunteer Training State, local, and tribal CASA programs train volunteers using the NCASAA’s national training curriculum or its equivalent. Training consists of 30 hours of required pre-service training and 12 hours of required annual in-service training. Additionally, if the court served by the CASA program allows, volunteers are required to observe an in-session abuse or neglect proceeding before appearing in court for an assigned case.
Statistics on Child Abuse in the United States
According to the U.S. Department of Health and Human Services
(HHS), in fiscal year (FY) 2004 an estimated 3 million children were alleged to have been neglected or abused and were the subject of investigation or assessment by state or local child protective services (CPS) agencies.9 Additionally, in FY 2004:
• Approximately 872,000 children were identified as victims of maltreatment.
• An estimated 1,490 children died as a result of child abuse or neglect.
• More than 80 percent of the children who died were 4 years old or
younger.
An HHS report, The Adoption and Foster Care Analysis and Reporting System (AFCARS) Report No. 13, Preliminary FY 2005 Estimates, September 2006 (2005 AFCARS Report), estimated that as of September 30, 2005:10
• An estimated 513,000 children were in foster care. • The average age of children in foster care was 10 years old and the
average length of stay in foster care was 28.6 months.
• 118,000 children were waiting adoption.
9 U.S. Department of Health and Human Services, Administration for Children, Youth
and Families, Children’s Bureau, Child Maltreatment 2004, (Washington, D.C.: U.S. Government Printing Office, 2006).
10 U.S. Department of Health and Human Services, Administration for Children, Youth and Families, Children’s Bureau, The AFCARS Report No.13, Preliminary FY 2005 Estimates, September 2006.

- 7 -
Further, according to the 2005 AFCARS report, in FY 2005 approximately 311,000 children entered foster care, while 287,000 exited foster care. Legislation Over the past 32 years, Congress has enacted the following legislation related to protecting children from abuse and neglect.
• In 1974, the Child Abuse Prevention and Treatment Act (CAPTA) formally recognized the importance of providing independent representatives for children in court proceedings by mandating that each child have a guardian ad litem.
• The Adoption Assistance and Child Welfare Act of 1980 mandated a
greater emphasis on ensuring that permanent placement is achieved for children in foster care and required that every 6 months juvenile and family courts review all cases involving abused or neglected children.
• CAPTA was amended by the Child Abuse Prevention, Adoption and
Family Services Act of 1988. This Act directed the Secretary of HHS to establish a national data collection and analysis program, which became The National Child Abuse and Neglect Data System, for state child abuse and neglect reports.
• The Victims of Child Abuse Act of 1990 required that “a CASA shall be
available to every victim of child abuse or neglect in the United States that needs such an advocate.”
• CAPTA was amended in 1996 mandating that states seeking federal
funding under the Act must create citizen review panels, which provide citizen oversight to ensure attainment of state goals for protecting children from abuse and neglect.
• The Adoptions and Safe Families Act of 1997 shortened timelines to
encourage the speedy adoption of children for whom reunification or guardianship is not an option.
Office of Justice Programs
Since 1984, DOJ Office of Justice Programs (OJP) has worked to improve the juvenile justice systems and assist crime victims. The Victims of Child Abuse Act of 1990, as amended, authorized the OJP Office of

- 8 -
Juvenile Justice and Delinquency Prevention (OJJDP) to administer a newly created CASA grant program.
The OJP Office for Victims of Crime (OVC) also provides funding
through the Tribal Court CASA Program, which assists in developing and enhancing programs that provide volunteer advocacy for abused or neglected Native American children. Additionally, CASA programs are also eligible to receive Victims of Crime Act (VOCA) funding at the state level, which provides support services to crime victims.
OJP partners with the NCASAA to administer the CASA program and provide funding, training, and technical assistance to state, local, and tribal CASA programs. Since 1993, OJP has awarded NCASAA 15 grants totaling $100.4 million, including 12 OJJDP grants totaling $98.52 million, and 3 OVC grants totaling $1.88 million, as shown in Table 2.
TABLE 2. OJP GRANTS AWARDED TO NCASAA (MILLIONS)
GRANT AGENCY BEGIN DATE END DATE TOTAL AWARD 1994CHCXK001 OJJDP 01/01/1994 12/31/1996 $ 3.50 1995CHFXK001 OJJDP 01/01/1994 02/24/1997 1.69 1995VIGXK001 OVC 01/01/1995 06/30/2001 0.56 1996CHNXK002 OJJDP 06/01/1996 05/31/1999 4.94 1997CHVXK001 OJJDP 02/01/1997 10/31/2002 10.65 1997CHVXK002 OJJDP 01/01/1997 12/31/1999 4.90 1998CHVXK001 OJJDP 01/01/1998 12/31/2000 4.88 1999CHVXK001 OJJDP 01/01/1999 12/31/2001 6.81 2000CHVXK001 OJJDP 05/01/2000 12/31/2002 7.55 2000VRGX0113 OVC 08/01/2000 06/30/2003 0.35 2001CHBXK001 OJJDP 05/01/2001 06/30/2004 7.81 2002CHBXK001 OJJDP 04/01/2002 09/30/2006 15.38 2002CHBXK002 OJJDP 05/01/2002 12/31/2004 7.81 2002VIGX0003 OVC 09/01/2002 08/31/2006 0.97 2003CHBXK005 OJJDP 05/01/2003 12/31/2006 22.60
TOTAL $100.40
Source: Office of Justice Programs Office of Juvenile Justice and Delinquency Prevention
The mission of OJJDP is to provide national leadership, coordination, and resources to prevent and respond to juvenile delinquency and victimization. OJJDP supports states and communities in their efforts to develop and implement effective and coordinated prevention and intervention programs, and to improve the juvenile justice system so that it protects public safety, holds offenders accountable, and provides treatment
- 9 -
and rehabilitative services tailored to the needs of juveniles and their families. Additionally, OJJDP administers the distribution of grants to the CASA program, authorized by the Victims of Child Abuse Act of 1990, as amended, which directs that a CASA shall be available to every victim of child abuse or neglect if needed. As stated previously, OJP partners with NCASAA to administer the distribution of grants to the CASA program. Since 1993, OJJDP has awarded NCASAA 12 grants totaling $98.52 million. In turn, NCASAA uses a portion of this funding to provide subawards to state, local, and tribal CASA programs on a competitive basis. The subgrants awarded by NCASAA are used for: (1) new program development, (2) expansion programs, (3) state organizations, (4) urban program demonstration, and (5) increasing the diversity of CASA staff and volunteers to better meet the needs of children from diverse communities. In awarding subgrants, NCASAA stated that it emphasizes increasing the availability of advocates in communities where existing services do not meet the needs of families and children. Office for Victims of Crime
The Office for Victims of Crime (OVC) was formally established in 1988 as a result of an amendment to the 1984 Victims of Crime Act. OVC provides leadership and funding on behalf of crime victims. In addition, OVC provides funding for the Tribal Court CASA Program mentioned previously, which is also administered by NCASAA. Since 1993, OVC has awarded NCASAA three grants totaling $1.88 million. CASA programs are also eligible to receive Victims of Crime Act (VOCA) funding at the state level. VOCA victim assistance grant funds support services to victims of crime. However, not all children represented by a CASA volunteer are victims of crime. The National Child Abuse and Neglect Data System The 1988 amendment to the Child Abuse Prevention and Treatment Act directed HHS to establish a national data collection and analysis program through its Children’s Bureau in the Administration for Children, Youth and Families. The data is then input into the National Child Abuse and Neglect Data System (NCANDS). The NCANDS collects case-level data on all children who are involved in an investigation or assessment by a CPS agency. The data are submitted voluntarily, and used for an annual Child Maltreatment report, which is published each spring. In addition, data are used in several efforts by the Children's Bureau to measure the impact and effectiveness of CPS agencies. The NCANDS data includes information on:

- 10 -
• the characteristics of referrals of abuse or neglect that are made to CPS agencies,
• the types of maltreatment that are alleged,
• the dispositions (or findings) of the investigations,
• the risk factors of the child and the caregivers,
• the services that are provided, and
• the perpetrators.
The Adoption and Foster Care Reporting and Analysis System The HHS Adoption and Foster Care Reporting and Analysis System (AFCARS) collects case-level information for placement, care, or supervision on all children in foster care for whom the state CWS agencies are responsible. In addition, AFCARS contains data on children who are adopted under the auspices of the state's CWS. States are required to submit AFCARS data semi-annually to the HHS’ Administration for Children, Youth and Families. The semi-annual AFCARS reports cover the periods October 1 through March 31, and April 1 through September 30. The AFCARS report provides information on the:
• number of children in foster care,
• number of children who entered foster care that year,
• number of children who exited foster care that year,
• number of children awaiting adoption at year end and months in foster care,
• number of children in foster care with parental rights terminated and the months since parental rights were terminated, and
• number of children adopted with public agency involvement. Prior Reviews
Since inception of NCASAA in 1982, over 70 reviews, studies, and surveys of the CASA program have been conducted by a wide range of institutions, agencies, individuals, or other organizations. Out of the 70 prior reports, we identified two studies of the CASA program that in our judgment
- 11 -
provided the most comprehensive and current information related to the outcome objectives mandated by Congress for this audit.
• Youngclarke, Ramos, and Granger-Merkle, A Systematic Review of the
Impact of Court-Appointed Special Advocates, 2004 (Youngclarke Review). The Youngclarke Review summarized the findings of 20 prior studies that assessed the impact of CASA programs. In conducting the review, almost 70 prior studies of CASA programs were analyzed, but only 20 met the criteria for inclusion in the Youngclarke Review.11 The review compares the combined average outcome measures reported in the prior studies for cases involving a CASA volunteer to those for which a CASA volunteer was not appointed.
• Caliber Associates, Evaluation of CASA Representation, 2004, (Caliber
Study).12 The Caliber Study combines data from the NCASAA’s management information systems and data collected through the National Survey of Child and Adolescent Well-Being, a federally sponsored national survey of children and their families. The study compares outcome measures for cases involving a CASA volunteer to those for which a CASA volunteer was not appointed.
The results reported in the Youngclarke Review and Caliber Study that
pertain to the objectives of this audit are discussed in the Findings and Recommendations sections of this report.
In addition to the Youngclarke Review and the Caliber Study, we identified two surveys that provided useful information in understanding the relationship between CASA volunteers and judges, attorneys, child welfare workers, and both biological and adoptive parents. While these surveys do not speak directly to the audit objectives, they provide useful insight into the effectiveness of CASA programs.
11 Although the findings of 20 previous studies on CASA programs were included in
the Youngclarke Review, none of the studies addressed all of the measurement outcomes. Therefore, the summary data for each outcome measure is based on a different number of studies and occasionally includes different studies altogether. Additionally, the outcome measures summarized in the Youngclarke Review are separated into two categories: the combined-all category, which includes all studies with relevant data, and the combined-levels 1 and 2 category, which includes only those studies that were determined to have the strongest levels of evidence ratings. For the purposes of this report we only used the summary outcome measures reported for the combined-level 1 and 2 category because the studies included in this analysis were determined to have the highest levels of evidence.
12 It should be noted that the Caliber Study was funded in part by NCASAA. Funding was also provided by the Packard Foundation.

- 12 -
• Pat Litzelfelner, Ph.D., University of Kentucky, College of Social Work, National CASA Consumer Satisfaction Survey, September 2003. This study found that judges and attorneys in the CWS expressed the highest overall satisfaction with CASA programs. Additionally, both the biological parents and the foster parents spoke highly of the CASA volunteers.
• Organizational Research Services, Evaluation of Court-Appointed
Special Advocates/Guardians Ad Litem Volunteer Impact, September 2005 (Organizational Research Services Study). This study found that CASA volunteers: (1) are very effective in supporting court processes through a wide range of activities, (2) perform activities that have been very useful in making decisions concerning case outcomes, (3) tend to be assigned to the most difficult cases, and (4) provide recommendations that are frequently incorporated into court orders.

- 13 -
FINDINGS AND RECOMMENDATIONS I. ACTIVITIES FUNDED BY NCASAA SINCE 1993
We found that NCASAA did not retain any accounting records or supporting documentation for expenditures occurring prior to 1995. Additionally, although NCASAA retained some of the accounting records and supporting documentation for 1995 through 1997, the information was incomplete. According to federal regulations, NCASAA was not required to retain accounting records related to grant expenditures for these periods. Because the accounting information for these periods was not retained, we are unable to provide information on the activities funding by NCASAA from calendar years 1993 through 1997. However, from January 1, 1998, through June 30, 2006, NCASAA expended a total of $88.86 million in funds received through OJP grant programs and $14.24 million in funds received from non-federal sources. NCASAA expended 93.15 percent of its OJP grant funding on activities that directly supported CASA programs. Conversely, only 6.85 percent of its OJP grant funding was for general and administrative support activities, which is significantly less than the 16.3 percent average administrative costs for human services non-profit organizations.13
To determine the types of activities funded by NCASAA since 1993, we
requested that NCASAA provide accounting data from January 1, 1993, through June 30, 2006, for all expenditures from both federal and private funding sources. We found that NCASAA did not retain any accounting records or supporting documentation for expenditures occurring prior to 1995. Additionally, although NCASAA retained some of the accounting records and supporting documentation for 1995 through 1997, the information was incomplete. According to federal regulations (28 C.F.R. § 70) grantees are only required to retain financial records, supporting documents, statistical records, and all other records pertinent to Department of Justice grants for a period of 3 years from the date of submission of the final financial report. Because, NCASAA was not required to and did not retain the accounting records and supporting documentation
13 Thomas H. Pollak and Mark Hager, The Urban Institute, and Patrick Rooney,
Indiana University, “Understanding Management and General Expenses of Non-profits,” an Overhead Cost Study Working Paper presented at the 2001 Annual Meeting of the Association for Research on Non-profit Organizations and Voluntary Actions, New Orleans, LA, 2001 (Pollak and Hager, 2001).

- 14 -
for its expenditures occurring prior to 1998, we cannot provide information regarding activities funded by NCASAA prior to that time in this report.
However, we were able to obtain information related to the activities
funded by NCASAA from January 1, 1998, through June 30, 2006. Table 3 illustrates the activities funded by NCASAA during this period from both federal and non-federal funding sources.
TABLE 3. NCASAA EXPENDITURES BY ACTIVITY, JANUARY 1, 1998
THROUGH JUNE 30, 2006 (MILLIONS)14
ACTIVITIES FUNDED
TOTAL
FEDERAL
FUNDING
PERCENT OF
TOTAL
FEDERAL
FUNDING
TOTAL FUNDING
NON-FEDERAL
SOURCES
PERCENT OF TOTAL
FUNDING NON-FEDERAL
SOURCES DIRECT ACTIVITIES
Awards to Subgrantees $ 57.16 64.33% $ 3.29 23.10% Training & Technical
Assistance 13.63 15.34% 4.71 33.08% Membership & Public Outreach 11.98 13.48% 4.36 30.62% Subtotal $82.77 93.15% $12.36 86.80%
SUPPORT ACTIVITIES General & Administrative $ 6.09 6.85% $ 0.91 6.39% Fundraising 0.0 0.00% 0.97 6.81%
Subtotal $ 6.09 6.85% $ 1.88 13.20% TOTAL ACTIVITIES
FUNDED15 $88.86 100% $14.24 100%
Source: NCASAA general ledgers
As shown in Table 3, from January 1, 1998, through June 30, 2006, NCASAA expended $88.86 million in funds received through OJP grant programs and $14.24 million in funding from non-federal sources, including private foundations. NCASAA expended $82.77 million (93.15 percent) of its OJP grant funding on activities that directly supported CASA programs. The direct activities funded by NCASAA include:
• $57.16 million (64.33 percent) on awards to subgrantees to support
state and local CASA programs, • $13.63 million (15.34 percent) on training and technical assistance for
state and local CASA programs, and
14 The amounts reported in this table reflect the activities funded by NCASAA as determined by our audit.
15 Differences in total amounts are due to rounding, e.g., the sum of individual numbers prior to rounding may differ from the sum of the individual numbers rounded.

- 15 -
• $11.98 million (13.48 percent) on membership and public outreach.
We also found that NCASAA expended $12.36 million (86.80 percent) of its funding from all non-federal sources on activities that directly supported CASA programs. Further, NCASAA only expended about $1 million on fundraising activities, which was 6.81 percent of its funding from all non-federal sources.
During our review of the accounting records, we found that from 1999 through 2006, NCASAA erroneously recorded that it had allocated $1.23 million of its OJP grant funds to fundraising activities. Table 4 illustrates the OJP grant funds that were erroneously recorded.
TABLE 4. AMOUNTS ERRONEOUSLY RECORDED AS ALLOCATED TO FUNDRAISING
CALENDAR YEAR AMOUNT 1999 $ 74,710 2000 79,240 2001 86,659 2002 147,608 2003 219,626 2004 289,113 2005 223,653 2006 110,556 TOTAL $1,231,165
Source: NCASAA general ledgers Based on our review of NCASAA’s accounting records and supporting documentation, we determined the $1.23 million recorded as spent on fundraising was the result of an accounting error and that these funds were spent on other program activities. Therefore, NCASAA did not use OJP grant funds for fundraising activities. We informed NCASAA of the error during our review, and it has since been corrected for 2006. Nonetheless, we are recommending that OJP ensure that NCASAA establishes a methodology for allocating indirect costs so that federal funds are not charged to unallowable cost categories in the future. We also found that in 1998 and 1999 NCASAA failed to input a program accounting code identifying the program activity for expenses totaling about $1.5 million. We informed NCASAA of the error during our review, and these amounts have since been reallocated to the appropriate program activities.

- 16 -
Indirect Activities Funded by NCASAA
As shown previously in Table 3, we found that NCASAA expended $6.09 million (6.85 percent) of its OJP grant funding and only $1.88 million (13.20 percent) of its funding from all non-federal sources on general and administrative support activities. NCASAA expended a total of $7.97 million (7.73 percent) of its total funding on general and administrative costs. As a result, over 90 percent of the funding received by NCASAA is expended on activities that directly supported CASA programs. We found that NCASAA’s costs related to general and administrative support activities are significantly less than average administrative costs for human services non-profit organizations. As shown in Table 5, according to Pollak and Hager, 2001, the average percentage of funds expended on indirect activities for human services non-profit organizations and all non-profit organizations were 16.3 percent and 18.1 percent respectively. TABLE 5. MANAGEMENT AND GENERAL EXPENSES FOR NON-PROFIT
ORGANIZATIONS
NON-PROFIT MISSION NUMBER
REPORTING
AVERAGE
PERCENTAGE OF
INDIRECT COSTS Arts, culture, & humanities 11,821 23.4% Education 15,481 17.7% Environment 4,066 18.5% Health 19,786 17.2% Human Services 43,988 16.3% International 1,201 16.9% Supporting 15,332 16.3% Other public/societal benefit 24,350 20.7% TOTAL 136,025 18.1%
Source: Pollak and Hager, 2001 Awards to Subgrantees
From January 1, 1998, through June 30, 2006, NCASAA expended $88.87 million in funds received through OJP grant programs, of which $57.16 million (64.3 percent) was used for awards to subgrantees in support of state and local CASA programs. Table 6 illustrates the types of grant programs funded by NCASAA through subawards of OJP funding.

- 17 -
TABLE 6. NCASAA AWARDS TO SUBGRANTEES, JANUARY 1, 1998, THROUGH JUNE 30, 2006 (MILLIONS)
GRANT PROGRAM AMOUNT AWARDED Expansion $ 47.46 Planning 3.40 State Organizations 3.34 Tribal 0.49 Start-up 0.15 Other 0.02 TOTAL $54.86
Source: NCASAA general ledgers
The subgrants funded by NCASAA included:
• $47.46 million for expansion programs to increase volunteers and expand the number of children being served by CASA programs,
• $3.4 million for planning programs to assist in the planning for new
CASA programs,
• $3.34 million for state organization programs to assist state organizations with the delivery of core services to local programs,
• $494,992 to fund tribal programs to establish new or expand existing
tribal CASA programs,
• $153,202 awarded to subgrantees for start-up programs to establish CASA programs where no program currently exists, and
• $18,000 awarded to subgrantees for other purposes, including
reimbursement for expenses related to participation in the Caliber Study and changing the CASA logo.
Table 7 illustrates the subgrantee expenditures of OJP funding received
through NCASAA subgrants.

- 18 -
TABLE 7. SUBGRANTEE EXPENDITURES JANUARY 1, 1998, THROUGH JUNE 30, 2006 (MILLIONS)
GRANT PROGRAM AMOUNT EXPENDED PERCENT OF TOTAL Personnel $ 35.26 71.7% Other 3.86 7.9% Travel 3.41 6.9% Rent & Utilities 2.19 4.4% Training 1.54 3.1% Supplies 1.06 2.2% Printing 0.96 2.0% Equipment 0.90 1.8% TOTAL16 $49.18 100%
Source: Subgrantee expenditures reported to NCASAA
As shown in Table 7, generally the subgrantees expended the OJP funding received through NCASAA subawards on direct program activities, including personnel costs, travel to meetings with children and other relevant parties, court hearings and training, and training costs. Recommendation We recommend that OJP: 1. Ensures that NCASAA establishes a methodology for allocating indirect
costs so that federal funds are not charged to unallowable cost categories.
16 The differences between the total subgrantee expenditures shown in Table 7 and
the total NCASAA subawards shown in Table 6 resulted from the fact that some of the subgrants were still open at the time of our review and not all of the funding had been expended.

- 19 -
II. OUTCOMES FOR CASA CASES COMPARED TO NON-CASA CASES We found that OJP had established outcome measures for its CASA grant programs. However, the outcome measures established by OJP do not address the effectiveness of the programs in meeting the needs of children in the CWS or the outcome measures identified by Congress. Further, with the exception of the length of time a child spends in foster care, HHS and NCASAA do not report on data that specifically addresses the outcome measures identified by Congress for this audit. Nonetheless, based on the available data and the results of an OIG survey, we found that in cases where CASA volunteers are involved as compared to cases where CASA volunteers are not involved: (1) children spent more time in foster care as result of the fact that the children were generally already in foster care before a CASA volunteer was assigned; (2) children and their parents were ordered by the courts to participate in more services and received more services; (3) the case was more likely to be “permanently closed,” i.e., the children were less likely to reenter the CPS system; and (4) children were more likely to be adopted and less likely to be reunified with their parents. Although the outcomes for cases involving a CASA volunteer appear to be less favorable in some instances than cases not involving a CASA volunteer, this may be a result of the fact that cases involving a CASA volunteer typically involve the most serious cases of maltreatment. As stated previously, Congress directed the OIG to examine the
outcomes in cases where CASA volunteers are involved as compared to cases where CASA volunteers are not involved, including:
• the length of time a child spends in foster care;
• the extent to which there is an increased provision of services;
• the percentage of cases permanently closed; and
• achievement of the permanent plan for reunification or adoption. We found that with the exception of the length of time a child spends in foster care, HHS does not require state and local CPS programs to report data that specifically addresses the outcome measures mandated by Congress for this audit. NCASAA also does not request that its CASA program members provide data that specifically addresses the outcome

- 20 -
measures required for this audit. As a result, although we obtained data for the state and local CASA programs that we used to address the audit objectives, we were not always able to obtain comparison data for cases that did not involve a CASA volunteer.
We also found that OJP had established outcome measures for its CASA grant programs. However, the outcome measures established by OJP do not address the effectiveness of the programs in meeting the needs of children in the CWS. Additionally, none of the outcome measures established by OJP address the outcome measures mandated for this audit. In our judgment, OJP should develop outcome performance measures for the CASA grant programs to determine the effectiveness of the programs in meeting the needs of children in the CWS. As appropriate, these outcome measures should correspond with the data required by HHS for state and local CPS agencies, so that OJP has a basis for comparing the effectiveness of its CASA grant programs.
Additionally, at any point in time only a small percentage of the participating state, local, and tribal CASA programs have open subgrants of OJP grant funding awarded by NCASAA. For those CASA programs that do not have subgrants, NCASAA can request, but not require, that they provide outcome data. Nonetheless, for its 2005 Annual Program Survey, NCASAA received data on children from 90 percent of its CASA program members.
Because of the lack of data on the objectives for this audit, to determine the outcomes in cases where CASA volunteers are involved as compared to cases where CASA volunteers are not involved, we relied on the following:
• prior studies of the NCASAA program, including the Youngclarke Review and the Caliber Study, which we felt provided the most comprehensive and current information related to the objectives mandated by Congress;
• data from the state and local CASA program case-tracking databases
(CASA Data Request), which we compared to national data maintained by HHS;
• data from an OIG survey distributed to all state, local, and tribal CASA
program offices; and

- 21 -
• the most recent AFCARS data available at the time our analysis was conducted on all children in the state and local CPS for comparison purposes.17
For the CASA Data Request, NCASAA distributed our request for data
on the four outcome measures from the case management systems to 731 state, local, and tribal CASA programs. We received data related to time in foster care, permanent case closure, and the case outcomes including adoption and reunification from 192 respondents representing 339 programs. However, we generally did not receive data on the number of services ordered by the courts and received by children and their parents because it was not generally tracked in the case management systems.
Additionally, we distributed a nationwide survey to state, local, and
tribal CASA programs offices requesting information on the four outcome measures, as well as additional information on the: (1) basis for the responses related to the four outcome measures in our survey, (2) effectiveness of NCASAA, and (3) data reported in the Caliber Study, which was the most recent study available related to the outcome measures. Out of the 945 CASA programs to which the OIG survey was sent, we received 491 responses. The consolidated results of the OIG survey are detailed in Appendix II. Length of Time in Foster Care
We found that the length of time a child spends in foster care is longer for cases involving a CASA volunteer as compared to cases that did not involve a CASA volunteer. As shown in Table 8, the Youngclarke Review and Caliber Study found that the average length of time a child spends in foster care is between 3.9 months and 1.5 months longer for cases involving a CASA volunteer. TABLE 8. LENGTH OF TIME IN FOSTER CARE PRIOR STUDIES
TIME IN FOSTER CARE (MONTHS)
STUDY CASA NON-CASA DIFFERENCE
FOR CASA Youngclarke Review 23.9 20.0 + 3.9 Caliber Study 10.2 8.7 + 1.5
Source: Youngclarke Review and Caliber Study
17 It should be noted that HHS does not collect separate data on CASA cases, rather
the AFCARS data includes all CASA and non-CASA cases related to children in the state and local CPS.

- 22 -
It should be noted that both the Youngclarke Review and Caliber Study concluded that there was no significant difference in the length of time a child spends in foster care for cases involving a CASA volunteer as compared to cases that did not involve a CASA volunteer. Based on the results of the CASA Data Request and the OIG survey, we also found that the length of time a child spends in foster care is longer for cases involving a CASA volunteer as compared to the national average for all CPS cases, including CASA cases.18 As shown in Table 9, based on the CASA Data Request and the OIG survey average length of time a child spends in foster care is between 2 months and 1.2 months longer for cases involving a CASA volunteer than the national average for all CPS cases. TABLE 9. LENGTH OF TIME IN FOSTER CARE OIG ANALYSIS
TIME IN FOSTER CARE (MONTHS)
SURVEY CASA AFCARS19
DIFFERENCE
FOR CASA CASA Data Request 15.8 13.8 + 2.0 OIG Survey20 17.2 16.0 + 1.2
Source: CASA Data Request, OIG survey, 2004 and 2005 AFCARS Report However, as discussed in the following sections, although children in cases involving a CASA volunteer were on average in foster care longer, in our judgment using the length of time in foster care as an outcome measure is not necessarily an indicator of the effectiveness of CASA programs. Types of Cases
According to the Caliber Study, cases assigned to a CASA volunteer frequently involve the most serious cases of maltreatment and the children
18 For the CASA program case system data request and the OIG survey, we used the
weighted average of the length of time a child spends in foster care where a CASA volunteer is involved.
19 For the CASA Data Request, we compared the weighted average of the length of time a child spends in foster care where a CASA volunteer is involved to the 2004 AFCARS data which was the most recent data available at the time our analysis was conducted. It should be noted that AFCARS data includes all CASA and non-CASA cases related to children in the state and local CPS. For the OIG survey, we compared the weighted average of the length of time a child spends in foster care where a CASA volunteer is involved to the 2005 AFCARS data.
20 The weighted average number of months in foster care that was calculated for the OIG survey is based on the number of respondents rather than children.

- 23 -
were more at risk. As a result, for the majority of cases involving a CASA volunteer, the child was placed in foster care much more frequently than for cases not referred to a CASA program, as shown in Table 10.
TABLE 10. PERCENTAGE OF CHILDREN PLACED IN FOSTER CARE PERCENT OF CHILDREN
IN FOSTER CARE
CASE STATUS WITH CASA
VOLUNTEER WITHOUT CASA
VOLUNTEER Closed Cases 89% 18% Open Cases 100% 45%
Source: Caliber Study As shown in Table 10, the Caliber Study indicates that for closed
cases, children in cases involving a CASA volunteer were almost 5 times more likely to be placed in foster care as compared to children in cases that did not involve a CASA volunteer. Further, for open cases, children in cases involving a CASA volunteer were more than twice as likely to be placed in foster care than children in cases not involving a CASA volunteer.
The Caliber Study also cited the Calkins and Millar Study, which they
felt contained the strongest study methodology related to this outcome measure because the sample was based on CASA and non-CASA children who were equivalent in the severity of their abuse histories.21 Additionally, the Calkins and Millar Study included only those children for which a CASA volunteer was assigned early in the case. The Calkins and Millar Study found that for children with similar case histories, the children in cases involving a CASA volunteer spent on average 31 months in foster care as compared to 40 months for children in cases that did not involve a CASA volunteer. The Calkins and Millar Study concluded that there was a significant reduction in the length of time in foster care (9 months) for cases involving a CASA volunteer.
Finally, The Organizational Research Services Study also concluded
there is a general consensus (over 80 percent of respondents) that judges tend to assign the most difficult cases to CASA volunteers.
21 Calkins, Cynthia A. & Murray Millar. “The Effectiveness of Court Appointed Special
Advocates to Assist in Permanency Planning,” Child and Adolescent Social Work Journal, Vol. 16, #1, February 1999, pp. 37-45 (Calkins Millar Study).

- 24 -
Time in Foster Care Prior to Assignment of a CASA Volunteer Based on the results of the OIG survey, we found that the majority of respondents (51 percent) estimated that on average 81 to 100 percent of the children in cases involving a CASA volunteer were placed in foster care at some time while in the CWS. Additionally, the majority of respondents (54 percent) estimated that on average 81 to 100 percent of the children in cases involving a CASA volunteer were placed in foster care prior to the time that the case was referred to the CASA program office by the court, as shown in Table 11. TABLE 11. ESTIMATED PERCENTAGE OF CHILDREN IN FOSTER CARE
BASED ON THE OIG SURVEY NUMBER OF RESPONDENTS % OF TOTAL RESPONDENTS
ESTIMATED
PERCENT OF
CHILDREN IN
FOSTER CARE
CHILDREN IN
FOSTER CARE
AT ANY TIME
IN THE CWS
CHILDREN IN
FOSTER CARE
PRIOR TO
CASA
CHILDREN IN
FOSTER CARE
AT ANY TIME
IN THE CWS
CHILDREN IN
FOSTER CARE
PRIOR TO
CASA 0-20 percent 48 56 12% 14% 21-40 percent 29 24 7% 6% 41-60 percent 47 43 11% 10% 61-80 percent 77 66 18% 16% 81-100 percent 209 225 51% 54% TOTAL 410 414 100% 100%
Source: OIG survey
In the CASA Data Request, we asked CASA programs nationwide to provide data from their case management systems related to the total length of time children were in foster care from the day they entered the CWS and from the time a CASA volunteer was assigned. As shown in Table 12, based on the results of the CASA Data Request, we determined that for cases involving a CASA volunteer, the child was in foster care on average 15.8 months while in the CWS. However, the child was in foster care on average 10.3 months during the time that a CASA volunteer was assigned to the case.

- 25 -
TABLE 12. COMPARISON OF CHILDREN WHO EXITED FOSTER CARE IN 2004
CASA DATA REQUEST
TIME IN FOSTER CARE
TOTAL TIME IN
FOSTER CARE
WHILE IN THE
CWS
TIME IN
FOSTER CARE
AFTER CASA
ASSIGNMENT
ALL CHILDREN (2004 AFCARS
REPORT) < 1 Month 3.2% 17.2% 18.0% 1 to 5 Months 14.1% 28.2% 16.0% 6 to 11 Months 20.8% 17.8% 16.0% 12 to 17 Months 20.5% 13.7% 12.0% 18 to 23 Months 13.5% 8.1% 9.0% Cumulative Total 72.1% 85.0% 71.0% 24 to 29 Months 8.9% 6.4% 6.0% 30 to 35 Months 5.7% 3.1% 5.0% 3 to 4 Years 5.9% 3.1% 10.0% Over 4 Years 7.4% 2.4% 8.0% WEIGHTED AVERAGE 15.8 MONTHS 10.3 MONTHS 13.8 MONTHS
Source: CASA Data Request and 2004 AFCARS report estimates Additionally, as shown in Table 12, for cases involving a CASA volunteer, the child was in foster care on average 5.5 months (15.8 months minus 10.3 months) before a CASA volunteer was assigned. The OIG survey also asked that the CASA program offices provide information related to the length of time children were in foster care from the day they entered the CWS until a CASA volunteer was assigned and from that point forward. As shown in Table 13, based on the results of the OIG survey, we determined that for cases involving a CASA volunteer, the child was in foster care on average 4.5 months prior to being assigned a CASA volunteer and 12.7 months after a CASA volunteer was assigned.

- 26 -
TABLE 13. TIME IN FOSTER CARE BASED ON THE 2006 OIG SURVEY
OIG SURVEY
TIME IN CARE
FOSTER CARE PRIOR
TO CASA ASSIGNMENT (NO. OF RESPONDENTS)
FOSTER CARE AFTER
CASA ASSIGNMENT (NO. OF RESPONDENTS)
≤ 6 months 341 37 7-12 months 50 156 13-18 months 15 146 19-24 months 6 51 > 24 months 3 18
TOTAL 415 408 WEIGHTED AVERAGE 4.4 MONTHS 12.3 MONTHS
Source: OIG survey
According to NCASAA management, reducing the amount of time in foster care is generally considered a favorable outcome. However, the actual placement outcome, i.e., adoption, reunification, permanent placement with a relative, emancipation, and guardianship, is more critical. However, NCASAA management believes that if necessary, it is better for a child to spend more time in foster care than risk a poor permanent placement.
Additionally, the respondents to the OIG survey who stated that
children in cases involving a CASA volunteer were more likely to be placed in foster care, based their conclusion on the fact that the children were already in foster care prior to being referred to the CASA program. Further, the respondents who stated that children in cases involving a CASA volunteer were more likely to be in foster care longer based their conclusion on the fact that volunteers focus on achieving permanency. Therefore, the primary focus is on a successful permanent placement, rather than on closing the case as quickly as possible. Increased Provision of Services According to NCASAA, a significant factor in determining a final placement outcome involves the availability and effectiveness of services for both the child and the parents. One of the duties of a CASA volunteer is to make recommendations to the court of services needed for both children and their parents. Examples of services ordered by the court for children include mental health, medical treatment, and training in independent living if children are close to the age of majority. Services ordered by the court for parents also include mental health, drug, and alcohol treatment, as well as training on basic health and domestic violence.

- 27 -
The Youngclarke Review and Caliber Study both included the number of services ordered for children and the parents of children in cases involving a CASA volunteer as compared to cases not involving a CASA volunteer. This information was obtained from actual CASA, CPS, and court case files and through interviews of CASA and CPS officials. Based on the Youngclarke Review and the Caliber Study, on average between 2.1 and 3.1 additional services were ordered by the court for children and the parents of children in cases involving a CASA volunteer, as shown in Table 14. TABLE 14. NUMBER OF SERVICES ORDERED FOR CHILDREN AND
PARENTS NUMBER OF SERVICES
ORDERED STUDY OR SURVEY CASA NON-CASA
DIFFERENCE
FOR CASA Youngclarke Review 9.0 6.9 + 2.1 Caliber Study 19.1 16.0 + 3.1
Source: Youngclarke Review, Caliber Study, OIG survey Based on the Youngclarke Review and Caliber Study, for cases involving a CASA volunteer, significantly more services on average were ordered by the court for children and their parents. In our judgment, this is an indication that the CASA program is effective in identifying the needs of children and parents in the CWS. The Caliber Study also reported on the types of services and percentage of services received by children and their parents for cases involving a CASA volunteer as compared to non-CASA cases. The Caliber Study found that, mental health and medical services were significantly more likely to be received by children in cases involving a CASA volunteer as compared to cases not involving a CASA volunteer. This may be an indication that the types of cases referred to CASA programs involve the most serious types of maltreatment. Additionally, the Caliber Study found that services in the areas of health care, alcohol and drug, legal, and family support were significantly more likely to be received by parents of children with a CASA volunteer than those without one. This may also be an indication that the types of cases referred to CASA programs involve the most serious types of maltreatment. The number of services ordered for children and the parents of children in the CWS is not an outcome that is generally tracked by state, local, and tribal CASA programs in their case management systems. Therefore, we were unable to obtain sufficient data related to this outcome measure from the CASA Data Request.

- 28 -
Based on the OIG survey, we found that on average 8.1 services were ordered for the children and parents of children in cases involving a CASA volunteer. However, HHS does not require state and local CPS programs to report data on the number of services ordered. As a result, we were unable to compare the information we obtained from the OIG survey to the national average.
In the OIG survey, 95 percent of the respondents stated that more
services were ordered for children in cases involving a CASA volunteer. The general comment provided by the respondents as to why more services were ordered was that the attention and time the volunteers spend with the children allows them to better identify the services needed.
Additionally, in the OIG survey 89 percent of the respondents stated that more services were ordered for parents of children in cases involving a CASA volunteer. The general comment provided by the respondents as to why more services were ordered was that it is in the best interest of the child to have more services provided to parents in order for there to be a successful reunification.
Percentage of Cases Permanently Closed All state and local CPS cases are eventually permanently closed, even those cases for which permanent placement of the child was not achieved, when the child reaches the age of majority, is incarcerated, or dies. As a result, for the purposes of this audit we defined permanent closure as those cases that had been closed for any reason and the child had not reentered the CWS at anytime prior to the date the case data was collected. The Youngclarke Review found that cases involving a CASA volunteer were more likely to be “permanently closed” as compared to cases not involving a CASA volunteer. Specifically, the review found that only 9 percent of children in cases involving a CASA volunteer reentered the CWS as compared to 16 percent of children in cases not involving a CASA volunteer.
The Caliber Study did not provide data on the percentage of children included in the study who reentered the CWS, rather the study included data on the number of cases for which subsequent allegations of abuse were reported. The Caliber Study found that:
• Subsequent allegations of abuse were reported for 36 percent of the
closed cases involving a CASA volunteer as compared to 25 percent of the closed cases that did not involve a CASA volunteer.

- 29 -
• Conversely, subsequent allegations of abuse were reported for only 34 percent of the open cases involving a CASA volunteer as compared to 52 percent of the open cases that did not involve a CASA volunteer.
However, it should be noted that the Caliber Study did not determine
whether the subsequent allegations of abuse were substantiated. Further, the Caliber Study concluded that there was no significant difference in the subsequent allegations of abuse reported for children in cases involving a CASA volunteer as compared to cases not involving a CASA volunteer. HHS does not require state and local CPS agencies to report data on reentry into the CWS. NCASAA also does not request that its CASA program members provide reentry data. Further, CASA volunteers are frequently dismissed by the courts once permanent placement is achieved. Once CASA volunteers are dismissed from a case, they no longer have access to court records related to case closure. Additionally, if the child reenters the CWS, the CASA program does not receive this information unless the new case is referred by the court.
Nonetheless, we requested the state, local, and tribal CASA programs provide reentry data from their case management systems on cases that were closed during FYs 2002 through 2004, for children in cases involving a CASA volunteer who had reentered the CWS after case closure. Based on the information provided in the CASA Data Request, we found that for the 75,389 CASA cases closed during FYs 2002 through 2004, only 1,073 (1.4 percent) of the children reentered the CWS during that same period.
Based on the OIG survey, we found that 76 percent of the respondents stated that in cases involving a CASA volunteer, the children are less likely to reenter the CWS for the following reasons:
• the volunteers ensure proper and permanent placement, and
• the needed services are provided and requirements are met.
We found that 4 percent of the respondents in the OIG survey stated
that in cases involving a CASA volunteer, the children are more likely to reenter the CWS for the following reasons:
• CASA volunteers continue to monitor cases and keep in touch with
children so they know if and when children should be removed from the parents again, and
• CASA volunteers are dealing with high-risk cases.

- 30 -
Finally, we found that 20 percent of the OIG survey respondents stated that in cases involving a CASA volunteer, the children are as likely to reenter the CWS for the following reasons:
• relapses by parents and their inability to change, and
• CASA volunteers stay in contact and often monitor the cases after they
have been closed.
Based on the Youngclarke Review and our analysis of the information obtained from the CASA Data Request and OIG survey, it appears that cases involving a CASA volunteer were more likely to be “permanently closed.” Achievement of Permanent Plan For each child in the CWS, a permanent plan for the placement of the child is developed. Generally, the permanent plan is either reunification with the parents or adoption. In recent years, to minimize the time a child spends in the CWS, dual permanent plans have been incorporated in most jurisdictions so that a back-up plan runs parallel to the primary plan. Dual permanent plans were in part the result of the Adoptions and Safe Families Act of 1997, which shortened timelines to encourage the speedy adoption of children for whom reunification or guardianship was not an option. Typically the primary plan is reunification with the parent and the back-up plan is adoption, both of which are pursued in parallel to reduce the time the child is in the system and the time it takes to achieve a permanent plan. Additionally, the permanent plan changes over time as conditions and circumstances change. For instance, the plan for an older child may change from reunification with the parents to independent living based on the length of time the child is in the CWS. As a result, in most instances the permanent plan is generally achieved. Neither the Youngclarke Review nor the Caliber Study included data on whether the permanent plan was achieved. However, both studies contained information on the percentage of cases that resulted in reunification, adoption or other closure. As shown in Table 15, based on the Youngclarke Review and the Caliber Study, children in cases involving a CASA volunteer were more likely to be adopted than children in cases not involving a CASA volunteer.

- 31 -
TABLE 15. COMPARISON OF ADOPTION OUTCOMES
STUDY ADOPTION
WITH CASA ADOPTION
NON-CASA DIFFERENCE
WITH CASA Youngclarke Review 28% 22% + 6% Caliber Study22 11% 5% + 6%
Source: Youngclarke Review and Caliber Study
However, as shown in Table 16, based on the Youngclarke Review, children in cases involving a CASA volunteer were less likely to be to be reunified with their parents, than children in cases not involving a CASA volunteer. Conversely, based on the Caliber Study, children in cases involving a CASA volunteer were more likely to be to be reunified with their parents, than children in cases not involving a CASA volunteer.
TABLE 16. COMPARISON OF REUNIFICATION OUTCOMES
STUDY REUNIFIED
WITH CASA REUNIFIED
NON-CASA DIFFERENCE
WITH CASA Youngclarke Review 40% 45% - 5% Caliber Study 63% 54% + 9%
Source: Youngclarke Review and Caliber Study Based on the available data shown in Tables 15 and 16, we found that children in cases involving a CASA volunteer were more likely to be adopted. However, this may be because cases involving a CASA volunteer are typically the most serious cases of maltreatment. Therefore, children in these types of cases may be more likely to be adopted, regardless of whether or not a CASA volunteer was involved.
HHS does not require state and local CPS agencies to report data on
achievement of the permanent plan. NCASAA also does not request that its CASA program members provide data on achievement of the permanent plan. However, from the CASA Data Request and the OIG Survey we were able to obtain data on outcomes for cases involving a CASA volunteer, including the percentage of cases that resulted in reunification, adoption or other closure, which we compared to the national average for all CPS cases, including CASA cases. Specifically:
• The CASA Data Request found that 19 percent of children in cases
involving a CASA volunteer were adopted as compared to the national
22 The Caliber Study only compared the outcomes for cases involving a CASA volunteer as compared to cases not involving a CASA volunteer for children who had been placed in foster care. There was no outcome data reported for children who had not been placed in foster care.

- 32 -
2004 AFCARS average of 18.2 percent. Additionally, 40.8 percent of children in cases involving a CASA volunteer were reunified with their parents as compared to the national 2004 AFCARS average of 54 percent.
• The OIG survey found that respondents estimated that on average
20.7 percent of children in cases involving a CASA volunteer were adopted as compared to the national 2005 AFCARS average of 18.2 percent. Additionally, 44.5 percent of children in cases involving a CASA volunteer were reunified with their parents as compared to the national 2005 AFCARS average of 54 percent. In the CASA Data Request, we asked all programs nationwide to report
on the outcomes for children exiting the system during FY 2004. As shown in Table 17, we compared the outcomes reported in the CASA Data Request to those reported in the 2004 AFCARS report for all cases. TABLE 17. COMPARISON OF OUTCOMES FY 2004 CLOSED CASES
CASA DATA REQUEST AFCARS OUTCOME NUMBER PERCENT NUMBER PERCENT
Reunification 8,098 40.8% 151,648 53.6% Adoption 3,767 19.0% 51,413 18.2% Legal Guardianship 2,776 14.0% 12,519 4.4% Emancipation 1,417 7.1% 23,121 8.2% Case Transferred 1,188 6.0% 6,126 2.2% Other23 2,604 13.1% 38,172 13.5% TOTAL 19,850 100.0% 282,999 100.0%
Source: CASA Data Request and AFCARS Report In addition to the CASA Data Request, based on the OIG survey we found that 49 percent of the respondents stated that children in cases involving a CASA volunteer were more likely to be adopted than children in cases not involving a CASA volunteer. The general comment provided by the respondents was that if reunification is not possible, adoption is sought since the goal is permanent placement of the child.
We also found that 40 percent of the respondents to the OIG survey stated that children in cases involving a CASA volunteer were as likely to be adopted as children in cases not involving a CASA volunteer. The general comment provided by the respondents was that children are as likely to be
23 The “Other” category includes: living with a relative (other than a legal guardian),
a runaway, or the death of the child.

- 33 -
adopted because CASA volunteers push for permanency, and adoption is a permanent solution.
Finally, 11 percent of the respondents to the OIG survey stated that
children in cases involving a CASA volunteer were less likely to be adopted than children in cases not involving a CASA volunteer for the following reasons:
• The number one goal of CASA volunteers is reunification and it is
usually achieved.
• When reunification is not possible, permanent placement with a relative other than the parent is utilized. Additionally, in the OIG survey, we found that 34 percent of the
respondents stated that children in cases involving a CASA volunteer were more likely to be reunited with their family than in cases not involving a CASA volunteer. The general comment provided by the respondents was that CASA volunteers advocate and monitor cases by visiting the families, recommending services, and pushing the parents to succeed.
We found that 49 percent of the respondents to the OIG survey stated that children in cases involving a CASA volunteer were as likely to be reunited with their family for the following reasons:
• Reunification is in the hands of the parents and their willingness to
change and comply with services.
• Reunification is in the best interest of the family and CASA pushes the family to succeed. Finally, 16 percent of the respondents stated that children in cases
involving a CASA volunteer were less likely to be reunited with their family. The general comment provided by the respondents was that cases involving a CASA volunteer are the most severe and difficult because they generally involve the most serious cases of maltreatment. Summary and Conclusion
We found that OJP had established outcome measures for its CASA grant programs. However, the outcome measures established by OJP do not address the effectiveness of the programs in meeting the needs of children in the CWS. Additionally, none of the outcome measures established by OJP address the outcome measures mandated by Congress for this audit.

- 34 -
Further, with the exception of the length of time a child spends in foster care, HHS does not require state and local CPS agencies to report data that specifically addresses the outcome measures mandated for this audit. NCASAA also does not request that its CASA program members provide data that specifically addresses the outcome measures required for this audit.
Nonetheless, based on the available studies, data, and the results of
the OIG survey, we found that in cases where CASA volunteers are involved as compared to cases where CASA volunteers are not involved:
• the children spent more time in foster care as result of the fact that the children were generally already in foster care before a CASA volunteer was assigned;
• the children and their parents were ordered by the courts to participate in more services and received more services;
• the case was more likely to be “permanently closed,” i.e., the children were less likely to reenter the CWS; and
• the children were more likely to be adopted and less likely to be reunified with their parents.
The Caliber Study found that the majority of cases involving a CASA
volunteer are typically the most serious cases of maltreatment. This was supported by the 2005 Organizational Research Services Study which concluded there is a general consensus (over 80 percent of respondents) that judges tend to assign the most difficult cases to CASA volunteers. Therefore, although the outcomes for cases involving a CASA volunteer appear to be less favorable in some instances than cases not involving a CASA volunteer, this may be a result of the fact that cases involving a CASA volunteer are typically the most serious cases of maltreatment. As a result, children in these types of cases are more likely to: (1) be placed in foster care, (2) require more services, and (3) be adopted rather than reunified with their parents. However, we also found that based on the limited information available, children in cases involving a CASA volunteer were less likely to reenter the CWS after permanent placement was achieved.

- 35 -
Recommendation We recommend that OJP: 2. Develop outcome-based performance measures for the CASA grant
programs to determine the effectiveness of the programs in meeting the needs of children in the CWS. As appropriate, these outcome measures should correspond with the data required by HHS for state and local CPS agencies, so that OJP has a basis for comparing the effectiveness of its CASA grant programs.

- 36 -
STATEMENT ON INTERNAL CONTROLS
In planning and performing our audit of the NCASAA Program, we considered NCASAA’s internal controls for the purpose of determining our auditing procedures. The evaluation was not made for the purpose of providing assurance on the internal control structure as a whole. However, we noted certain matters that we consider reportable conditions under generally accepted government auditing standards.24 Finding I
• From 1999 through 2006, NCASAA erroneously allocated $1.23 million
of its OJP grant funds to fundraising activities. However, we determined the $1.23 million was the result of an accounting error.
• In 1998 and 1999 NCASAA failed to input a program accounting code
identifying the program activity for expenses totaling about $1.5 million.
Because we are not expressing an opinion on the overall internal
control structure of NCASAA, this statement is intended solely for the information and use of OJP and NCASAA in administering federal grants.
24 Reportable conditions involve matters coming to our attention relating to
significant deficiencies in the design or operation of the internal control structure that, in our judgment, could adversely affect the ability of NCASAA administer its grants.

- 37 -
STATEMENT ON COMPLIANCE WITH LAWS AND REGULATIONS
As required by the Government Auditing Standards, we tested
NCASAA’s records and documentation for the period of January 1, 1998, through June 30, 2006, to obtain reasonable assurance that it complied with laws and regulations that, if not complied with, in our judgment could have a material effect on the administration of federal grant funds.
Compliance with laws and regulations applicable to the allowability and
allocability of federal grant expenditures, including subgrantee expenditures, is the responsibility of NCASAA management. An audit includes examining, on a test basis, evidence about compliance with laws and regulations. At the time of our audit, the federal regulations governing the requirements for federal grants could be found in:
• 28 C.F.R. Part 70 (updated 2006), Uniform Administrative Requirements for Grants and Agreements (including subawards) with Institutions of Higher Education, Hospitals and Other Non-profit Organizations
• OMB Circular A-110, Uniform Administrative Requirements for Grants and Agreements with Institutions of Higher Education, Hospitals, and Other Non-Profit Organizations
• OMB Circular A-122, Cost Principles for Non-Profit Organizations
• OMB Circular A-123, Management’s Responsibility for Internal Control
Except for the issues discussed in the Findings and Recommendations
section of this report, nothing came to our attention that caused us to believe that NCASAA management was not in compliance with the federal regulations governing the requirements for federal grants listed above.
- 38 -
APPENDIX I
OBJECTIVES, SCOPE, AND METHODOLOGY
We conducted an audit of NCASAA and the member CASA programs to determine: (1) the types of activities NCASAA has funded since 1993, and (2) the outcomes in cases where CASA volunteers are involved as compared to cases where CASA volunteers are not involved, including:
• the length of time a child spends in foster care;
• the extent to which there is an increased provision of services;
• the percentage of cases permanently closed; and
• achievement of the permanent plan for reunification or adoption.
We conducted our audit in accordance with Government Auditing
Standards. We included such tests as were necessary to accomplish the audit objectives. The audit generally covered, but was not limited to, the period of January 1, 1993, through June 30, 2006. Audit work was conducted at NCASAA and state, local, and tribal CASA program offices.
To determine the types of activities funded by NCASAA since 1993, we
requested that NCASAA provide accounting data from January 1, 1993, through June 30, 2006, for all expenditures from both federal and private funding sources. We found that NCASAA did not retain any accounting records or supporting documentation for expenditures occurring prior to 1995. Additionally, although NCASAA retained some of the accounting records and supporting documentation for 1995 through 1997, the information was incomplete. According to federal regulations (28 C.F.R. § 70, updated 2006) grantees are only required to retain financial records, supporting documents, statistical records, and all other records pertinent to Department of Justice grants for a period of 3 years from the date of submission of the final financial report. Therefore, NCASAA was not required to retain the accounting records and supporting documentation for its expenditures occurring prior to 1998, and we do not take exception to this practice. As a result, our analysis was limited to the period of January 1, 1998, through June 30, 2006.
To determine the types of activities funded by NCASAA from
January 1, 1998, through June 30, 2006, we sorted the expenditures reported in NCASAA’s general ledgers by program code. Additionally, we

- 39 -
requested summary accounting information for the subgrantee expenditures for the same time period, which we also sorted by type of expense.
To verify NCASAA expenses for allowability and allocability, we
judgmentally selected 25 cost accounts totaling over $1.6 million. Additionally, we randomly selected 15 transactions totaling over $500,000. We tested the supporting documentation for all expenditures included in our sample to determine if the costs were allowable, allocable, and properly supported.
To determine the outcomes in cases where CASA volunteers are involved as compared to cases where CASA volunteers are not involved, we found that with the exception of the length of time a child spends in foster care, HHS does not require state and local CPS agencies to report data that specifically addresses the outcome measures mandated by Congress for this audit. NCASAA also does not request that its CASA program members provide data that specifically addresses the outcome measures required for this audit. As a result, although we obtained data for the state and local CASA programs that we used to address the audit objectives, we were not always able to obtain comparison data for cases that did not involve a CASA volunteer. Further, OJP had not established outcome measures for any of its grant programs that provide funding to CASA programs.
Additionally, at any point in time, only a small percentage of the participating state, local, and tribal CASA programs have open subgrants of OJP grant funding awarded by NCASAA. For those CASA programs that do not have subgrants NCASAA can request, but not require, that they provide outcome data. Nonetheless, for its 2005 Annual Program Survey, NCASAA received data on children from 90 percent of its CASA program members.
Because of the lack of data on the objectives mandated for this audit, to determine the outcomes in cases where CASA volunteers are involved as compared to cases where CASA volunteers are not involved, we relied on the following:
• prior studies of the NCASAA program; • data from the state and local CASA program case-tracking databases
(CASA Data Request), which we compared to national data maintained by HHS;
• data from an OIG survey distributed to all state, local, and tribal CASA
program offices; and

- 40 -
• the most recent AFCARS data available at the time our analysis was conducted on all children in the state and local CPS for comparison purposes.25
We identified two studies of the CASA program that in our judgment
provided the most comprehensive and current information related to this objective.
• Youngclarke, Davin M. and Kathleen Ramos and Lorraine
Granger-Merkle. "A Systematic Review of the Impact of Court-Appointed Special Advocates," Journal of the Center for Families, Children and the Courts, Vol. 5, 2004, pp. 109-126 (Youngclarke Review). The Youngclarke Review summarized the findings of 20 prior studies that assessed the impact of CASA programs. In conducting the review, almost 70 prior studies of CASA programs were analyzed, but only 20 met the criteria for inclusion in the results of the Youngclarke Review. The review compares the combined average outcome measures reported in the prior studies for cases involving a CASA volunteer to those for which a CASA volunteer was not appointed.
• Caliber Associates, Evaluation of CASA Representation, 2004, (Caliber
Study).26 The Caliber Study combines data from NCASAA’s management information systems and data collected through the National Survey of Child and Adolescent Well-Being, a federally sponsored national survey of children and their families. The study compares outcome measures for cases involving a CASA volunteer to those for which a CASA volunteer was not appointed.
For the CASA Data Request, NCASAA distributed our request for data
from the case management systems to 731 state, local, and tribal CASA programs. We received data from 192 respondents representing 339 programs.
Additionally, we distributed a nationwide survey to state, local, and
tribal CASA programs offices requesting information on the four outcome measures, as well as additional information on the: (1) basis for the responses related to the four outcome measures in our survey,
25 It should be noted that HHS does not collect separate data on CASA cases, rather
the AFCARS data includes all CASA and non-CASA cases related to children in the state and local CPS.
26 It should be noted that the Caliber Study was funded in part by NCASAA. Funding was also provided by the Packard Foundation.

- 41 -
(2) effectiveness of NCASAA, and (3) data reported in the Caliber Study. Out of the 945 CASA programs to which the OIG survey was sent, we received 491 responses. The consolidated results of the OIG survey are detailed in Appendix II.

- 42 -
APPENDIX II
OIG SURVEY CONSOLIDATED RESPONSES
The following guidance was provided to the survey respondents at the beginning of the survey: We ask that you answer each question to the best of your
knowledge as it pertains to your program office. We recognize specific numbers may not be readily available; however, we would appreciate it if you would provide estimates based on your experience. As a rule, please select only one answer to each of the survey questions unless otherwise instructed and where applicable, guidance on how to interpret the question is presented in italics. Please complete the survey in an electronic format, the text boxes you are asked to write in will expand as you enter your response. (If you are unable to complete the survey electronically, please contact us for assistance.)
Four of the survey questions (2, 5, 10, and 18), allowed respondents to provide a comment to an “other” response. Nine of the survey questions ( 3, 25, 27, 29, 30, 31A and B, 32, 33, and 34), allowed respondents to provide a reason as to why they selected that answer. Additionally, one of the survey questions (35), was an open-ended question that allowed the respondents to provide a general comment on the topic of the survey. Some comments were modified slightly to correct for grammar and sentence structure. Survey Results Background 1. How long have you been the Coordinator / Director /
Administrator of your CASA/GAL program office? Of the 399 responses received, the average answer was 58 months or 5 years.

- 43 -
2. What program type is your CASA/GAL office?
Program Office Type
0%
75%
15%
4%
1%
5%
Remote
Local
Local - State Gov.
State Org. - No Direct Services
State Org. - Direct Services
Other
The respondents who said “Other” were given the opportunity to provide a comment and we received 21 comments. Eight of the 21 respondents wrote they are a local program, which was one of the options available, but they elaborated on their answers. Nine of 21 respondents indicated that they are under an umbrella agency.
3. How many jurisdictions does your program office currently
serve?
Program Office Jurisdictions
75%
11%
14%
1 Jurisdiction
2 Jurisdictions
>2 Jurisdictions
For the 14 percent of respondents that answered greater than 2 jurisdictions, the average number of jurisdictions was 5.1.

- 44 -
4. What Geographic Region is your program office located?
5. What types of funding does your program office receive?
(check all that apply)
Types of Funding Program Offices Receive
145171
257295315
050
100150200250300350
NCASAAGrants
OtherFederalGrants
StateGrants
PrivateFunding
Other
Types of Funding
Num
ber
of R
espo
nses
Some of the “Other” funding sources given by the 239 respondents who provided a comment included: • 85 of the 239 respondents received funding from foundations or
grants, • 78 of the 239 respondents received county funding,
Geographic Region of the Program Offices
13%
23%
26%
12%
16%
10% WesternMT Plains Midwest NortheastMid AtlanticSouthern Gulf

- 45 -
• 54 of the 239 respondents received funding from fundraisers or special events, and
• 30 of the 239 received funding from corporations, individuals, and
community donations. 6. How many volunteers does your program office currently have?
The average number of volunteers for a CASA program office was 78.
7. How many supervisors does your program office currently
have? The average number of supervisors for a CASA program office was 3.
8. What is the total estimated number of children referred to your
program office during the past 12 months? The total average estimated number of children referred to each CASA program office during the past 12 months was 214 for each office visit.
9. Of the children referred to your program office during the past 12 months, what is the estimated percentage of children for which a volunteer advocate was assigned?
Estimated Percentage of Children for Which a Volunteer was Assigned
5% 8%
11%
16%60%
0-20 %21-40%41-60%61-80%81-100%

- 46 -
10. If you are unable to assign an advocate to every child referred to your office, what sources are used by your state to determine which children are assigned a CASA/GAL volunteer? (Check all that apply)
Sources used to Assign a CASA/GAL Volunteer
161
43
94
33
164
0
50
100
150
200
CourtProtocol
State Statue WrittenPolicy
Gradingmatrix
Other
Sources
Num
ber
of R
espo
nses
Of the comments given by respondents who said “Other”:
• 42 respondents stated that volunteers are assigned based on priority and or severity of cases,
• 25 respondents stated that all cases assigned to a CASA office
receive a volunteer, and
• 22 respondents stated cases are assigned based on volunteer availability.
11. In your program office, what is the current number of open
cases for which an advocate has been assigned?
The average number of open cases for which an advocate had been assigned was 126.

- 47 -
12. How long is a child’s case open in your program office, from the time an advocate is appointed until the case is closed? (Please estimate the average length of time per case regardless of whether or not the same advocate worked on the case for the entire length of time.)
Average Length of Time a Child's Case is Open
1%
18%
44%
11%
27%
0%
10%
20%
30%
40%
50%
≤ 2 months 7-12 months 13-18months
19-24months
> 24 months
Time in Months
Perc
ent o
f Res
pons
es
13. On average, what is the number of hours an advocate from
your program office works on a case, from the time an advocate is assigned until it is closed?
Average Number of Hours a CASA/GAL Works on a Case
57%
21%15%6%1%
0%10%20%30%40%50%60%
≤ 25 hrs 26-50 hrs 51-75 hrs 76-100 hrs >100 hrs
Hours
Perc
ent o
f R
espo
nses

- 48 -
Foster Care Please answer the following questions based on your experience as it relates to the children for which your CASA/GAL program office assigned an advocate. 14. On average, what percentage of children with an advocate are
placed in foster care during any time that the child is in the system?
Average Percentage of Children with a CASA/GAL who are placed in Foster Care
7%18%
52%
11%12%
0%10%20%30%40%50%60%
0-20 % 21-40% 41-60% 61-80 % 81-100%
Percentage of Children
Perc
ent o
f Res
pons
es

- 49 -
15. On average, what percentage of children had already been placed in foster care prior to being referred to your program office?
Average Percentage of Children who were in Foster Care prior to being referred to a Program
Office
6%16%14%
10%
54%
0%10%20%30%40%50%60%
0-20% 21-40% 41-60% 61-80% 81-100%
Percentage of Children
Perc
ent o
f R
espo
nses
16. On average, how many months would you estimate that
children were in foster care before the child was referred to your program office?
Average Estimated Number of Months Children were in Foster Care prior to being referred to a
Program Office
12% 1%1%4%
82%
0%20%40%60%80%
100%
≤ 6 months 7-12months
13-18months
19-24months
> 24months
Number of Months
Perc
ent o
f R
espo
nses

- 50 -
17. On average, how many months would you estimate that the children are in foster care after the child was referred to your office?
Average Estimated Number of Months Children are in Foster Care after being referred to a
Program Office
4%13%
36%38%
9%
0%10%20%30%40%50%
≤ 6 months 7-12months
13-18months
19-24months
>24 months
Number of Months
Perc
ent o
f R
espo
nses

- 51 -
Services Please answer the following questions based on your experience as it relates to the number of services ordered and received for both children and parents in the cases for which your CASA/GAL program office provided advocacy services. 18. What types of services are typically ordered for the children
and parents? (check all that apply)
Types of Services Typically Ordered for Children and Parents
255 262
421 417
280383
415
139
0100200300400500
Cou
nsel
ing
Dru
g /
Alco
hol
Med
ical
Ed. P
lan
Psyc
eval
uatio
n
Pare
ntin
gcl
asse
sD
omes
ticVi
olen
cecl
asse
s
Oth
er
Services
Num
ber
of
Res
pons
es
133 respondents provided a comment as to the “Other” types of services typically ordered, including: • 36 of the 133 respondents stated anger management services are
recommended for parents. • 26 of the 133 respondents stated supervised or non-supervised
visitations for children with their parents and family are recommended.

- 52 -
19. On average what is the estimated total number of services ordered,
A. Per child?
Average Estimated Total Number of Services Ordered per Child
47%
1%0%3%
49%
0%10%20%30%40%50%60%
≤ 3 services 4-6 services 7-9 services 10-12serices
>12services
Number of Services
Perc
ent o
f R
espo
nses
B. Per parent?
Average Estimated Total Number of Services Ordered per Parent
36%
0%0%1%
63%
0%10%20%30%40%50%60%70%
≤ 5 services 6-10services
11-15services
16-20serices
>20services
Number of Services
Perc
ent o
f R
espo
nses

- 53 -
C. If the information cannot be broken out between child and parent, please estimate the total number of services ordered, on average, per family.
Question 19C was conditional on questions 19A and B. As a result, only 11 responses were received. Therefore, calculating the percentage of responses given could be misleading. The results are as follows: • 8 of the 11 respondents said that on average less than or equal to
8 services were ordered per family, and • 3 of the 11 respondents said that on average 9 to 16 services were
ordered per family. 20. On average what is the estimated percentage of ordered
services that are actually provided to the
A. Child?
Average Estimated Percentage of Ordered Services Actually Provided to the Child
63%
21%8%4%4%
0%10%20%30%40%50%60%70%
0-20 % 21-40% 41-60% 61-80 % 81-100 %
Percent of Services
Perc
ent o
f R
espo
nses

- 54 -
B. Parent?
Average Estimated Percentage of Ordered Services Actually Provided to the Parent
1%
31%
47%
16%5%
0%
10%
20%
30%
40%
50%
0-20 % 21-40% 41-60% 61-80 % 81-100 %
Percent of Services
Perc
ent o
f R
espo
nses
C. If the information cannot be broken out between child and parent, please estimate the percentage of ordered services actually provided, per family. Question 20C was conditional on questions 20A and B. As a result, only 8 responses were received. Therefore, calculating the percentage of responses given could be misleading. The results are as follows: • 1 of the 8 respondents said 21 to 40 percent of ordered services
were actually provided per family, • 1 of the 8 respondents said 41 to 60 percent of ordered services
were actually provided per family,
• 1 of the 8 respondents said 61 to 80 percent of ordered services were actually provided per family, and
• 5 of the 8 respondents said 81 to 100 percent of ordered services
were actually provided per family.

- 55 -
Permanent Plan Please answer the following questions based on your experience as it relates to the closed cases for which your CASA/GAL program office provided advocacy services. 21. On average, what is the estimated percentage of closed cases
for which the child does not reenter the child welfare system, i.e., permanently closed cases? (When we say ”permanently closed” we mean as of the date you are completing this survey, the child has not reentered the child welfare system).
Average Estimated Percentage of Permanently Closed Cases for which the Child does not
Reenter the Child Welfare System
2%17%
64%
5%12%
0%
20%
40%
60%
80%
0-20 % 21-40% 41-60% 61-80 % 81-100 %
Percentage of Closed Cases
Perc
ent o
f R
espo
nses

- 56 -
22. What is the estimated percentage of cases where the final outcome was the same as the permanent plan (includes any concurrent plan)?
Estimated Percentage of Cases where the Final Outcome Matched the Permanent Plan
58%
1% 4%11%
25%
0%10%20%30%40%50%60%70%
0-20 % 21-40% 41-60% 61-80 % 81-100 %
Percentage of Cases
Perc
ent o
f R
espo
nses
23. In your experience is the permanent plan (includes any
concurrent plan) more likely to be achieved, as likely to be achieved, or less likely to be achieved?
Achievement of the Permanent Plan for Children with a CASA/GAL
85%
14% 1%More likely to beachieved As likely to beachievedLess likely to beachieved

- 57 -
24. What is the estimated percentage of children who have had their cases closed for the following reasons (the sum of your responses for all categories should not exceed 100 percent):
REASON FOR
CLOSURE 0-20
PERCENT 21-40
PERCENT 41-60
PERCENT 61-80
PERCENT 81-100
PERCENT Reunification 17% 31% 35% 14% 3% Adoption 57% 31% 10% 2% - In kin care 50% 37% 10% 3% - Other 75% 19% 4% 2% -
25. In your experience is the permanent plan (includes any
concurrent plan) more likely to be resolved in the best interest of the child, as likely to be resolved in the best interest of the child, or less likely to be resolved in the best interest of the child?
Are Cases with a CASA/GAL Resolved in the Best Interest of the Child?
95%
5% 0%More likely to be resolvedin the best interest of thechildAs likely to be resolved inthe best interest of thechildLess likely to be resolvedin the best interest of thechild
Of the 439 respondents (95 percent) who said “more likely” to be resolved, 404 provided comments that included the following: • 67 of the 404 comments stated that the CASA volunteers’ primary
focus is the child’s best interest, and • 26 of 404 comments stated that a CASA volunteer monitors all
aspects of the case.

- 58 -
Of the 22 respondents (5 percent) who said “as likely” to be resolved, 16 provided comments that included the following: • 6 of the 16 comments indicated the best interest of the child is
ultimately in the judges’ control, whether or not they follow CASA’s recommendations.

- 59 -
National CASA Association 26. Please rank the effectiveness of the NCASAA in providing
leadership, training and technical assistance?
The Effectiveness of the NCASAA in Providing Leadership, Training and Technical Assistance
46%
42%
8%
1%
3%
4 excellent3 good2 fair1 poorno opinion
27. Do you use the COMET Database Program provided by the
NCASAA?
Use of the COMET Database Program
72%
28% Yes, I useCOMET
No, I do notuse COMET
The respondents who said “no” were given the opportunity to provide a reason as to why they do not use COMET. Of the 139 respondents (28 percent) who said “no,” 123 provided comments that included the following:

- 60 -
• 28 of the 123 respondents use either CASA Tracker or CASA manager instead of COMET,
• 28 of the 123 respondents use an alternative, simpler database
system, such as Microsoft Access or Excel, and
• 22 of the 123 comments described COMET as being too time-consuming, not user friendly, or too complex or difficult to use.
28. If you answered yes to question 27, please rank the COMET
System provided by the NCASAA?
Ranking the COMET System
25%
61%
12% 2%4 excellent
3 good
2 fair
1 poor

- 61 -
Caliber Report Please answer the following questions based on your experience as it relates to the children for whom your CASA/GAL program office provided advocacy service, as well as, your general knowledge of the child welfare system as a whole. 29. The evaluation of the CASA Representation prepared by Caliber
and Associates indicated that children who had a CASA/GAL volunteer were more likely to be placed in foster care than children without a CASA/GAL volunteer. In your opinion, are children with a CASA/GAL volunteer more likely to be placed in foster care?
Are Children with a CASA/GAL more likely to be placed in Foster Care?
50%50%
Yes
No
Of the 228 respondents (50%) who said “yes,” 220 provided comments that included the following:
• 98 of the 220 respondents stated that children are already in foster
care before the case is assigned to a CASA volunteer. • 44 of the 220 respondents stated that children with CASA/GAL
volunteers are more likely to be placed in foster care because CASA volunteers are assigned the most difficult and complex cases.
Of the 226 respondents (50 percent) who said “no,” 212 provided comments that included the following:

- 62 -
• 105 of the 212 respondents stated that the children are already placed in foster care before CASA is assigned.
Based on the comments provided by respondents who said “no,” we believe that question 29 may have been misinterpreted. The question was whether children with a CASA volunteer are more likely to be placed in foster care. The respondents who said “no” commented that the children were already in foster care.
30. The evaluation of the CASA Representation report indicated
that children who had a CASA/GAL volunteer were more likely to be placed in foster care longer than children without a CASA/GAL volunteer. In your opinion, on average, do children with a CASA/GAL volunteer spend more time in foster care?
Do Children with a CASA/GAL spend more time in Foster Care?
34%
66%
Yes
No
Of the 153 respondents (34 percent) who said “yes,” 151 provided comments that included the following:
• 54 of the 151 respondents indicated that CASA volunteers want
permanent reunification and will take more time to assure that happens, rather than just be concerned with closing the case.
• 51 of the 151 respondents said that CASA volunteers are assigned
to the most complex and difficult cases, so it may take longer for reunification to occur, if ever.
Of the 298 respondents (66 percent) who said “no,” 268 provided comments that included the following:

- 63 -
• 69 of the 268 respondents stated that CASA volunteers focus on achieving permanency faster so children do not stay in foster care too long.
31. The evaluation of the CASA Representation report indicated
that children and parents with a CASA/GAL volunteer were provided with more services on average than children without CASA/GAL volunteer. In your opinion, are more services ordered:
A. for children with a CASA/GAL volunteer?
Are more services ordered for Children with a CASA/GAL?
95%
5%
Yes
No
Of the 449 respondents (95 percent) who said “yes,” 424 provided comments that included the following:
• 182 of the 424 respondents stated that CASA volunteers give more
attention and time to the child, and therefore more services are identified.
• 21 of the 424 respondents stated that other agencies that request
services are bound by monetary constraints when considering what to recommend, whereas CASA is not.
Of the 26 respondents (5 percent) who said “no,” 18 provided comments that included the following:

- 64 -
• 8 of the 18 respondents stated that a CASA volunteer is not in control of what services are ordered, and that decisions are made before a volunteer’s involvement.
B. for the parents of children with a CASA/GAL volunteer?
Are more services orderd for Parents of Children with a CASA/GAL?
89%
11%
Yes
No
Of the 416 respondents (89 percent) who said “yes,” 381 provided comments that included the following:
• 93 of the 381 respondents stated that it is in the best interest of
the child to have more services provided for parents in order for successful reunification.
• 52 of the 381 respondents stated that more services are offered for
parents because CASA volunteers spend more time with the families and therefore have a better idea of what services are needed.
Of the 49 respondents (11 percent) who said “no,” 39 provided comments that included the following:
• 15 of the 39 respondents stated that services ordered for parents
are not assigned by a CASA volunteer. • 5 of the 39 responses stated that a CASA volunteer’s focus is on the
children, not the parents.

- 65 -
32. The evaluation of the CASA Representation report indicated that children with a CASA/GAL volunteer were more likely to have reports of subsequent abuse. However, the report does not address the number of children who actually reentered the child welfare system. In your opinion, are children with a CASA/GAL volunteer more likely to reenter the CWS, as likely to reenter the CWS, or less likely to reenter the CWS?
Are Children with a CASA/GAL likely to reenter the Child Welfare System (CWS)?
4%
20%
76%
More likely to reenter theCWS
As likely to reenter theCWS
Less likely to reenter theCWS
Of the 19 respondents (4 percent) who said “more likely,” all 19 provided comments that included the following: • 10 of the 19 respondents stated that CASA volunteers continue to
monitor cases and keep in touch with children, so the volunteers know if and when children should be removed from their parents again.
• 7 of the 19 respondents stated that children are more likely to
reenter the child welfare system because CASA volunteers are dealing with high-risk cases.
Of the 91 respondents (20 percent) who said “as likely,” 78 provided comments that included the following: • 34 of the 78 respondents stated that children are as likely to
reenter the child welfare system because of relapses by parents and their inability to change.
• 12 of the 78 respondents stated that CASA volunteers stay in
contact and often monitor cases after they have been closed.

- 66 -
• 7 of the 78 respondents stated that the CASA volunteer does not stay in contact after cases are closed.
Of the 346 respondents (76 percent) who said “less likely,” 307 provided comments that included the following: • 93 of the 307 respondents stated that children are less likely to
reenter into the child welfare system because volunteers ensure proper and permanent placement.
• 71 of the 307 respondents stated that children are less likely to
reenter into the child welfare system because the needed services are provided and requirements are met.
33. The evaluation of the CASA Representation report indicated
that children with a CASA/GAL volunteer are more likely to be referred for adoption. In your opinion, are children with a CASA/GAL volunteer more likely to be adopted, as likely to be adopted, or less likely to be adopted?
Are Children with a CASA/GAL likely to be referred for adoption?
49%
40%
11%More likely to beadoptedAs likely to beadoptedless likely to beadopted
Of the 223 respondents (49 percent) who said “more likely,” 206 provided comments that included the following: • 74 of the 206 respondents stated that if reunification is not
possible, adoption is pushed because CASA volunteers’ goal are permanency for the child.

- 67 -
Of the 185 respondents (40 percent) who said “as likely,” 141 provided comments that included the following: • 23 of the 141 respondents stated that children are as likely to be
adopted because CASA volunteers are looking out for the child’s best interest and adoption may not be it.
• 19 of the 141 respondents stated that children with a CASA
volunteer are only as likely to be adopted because children referred to CASA volunteers are the most difficult and complex cases.
• 19 of the 141 respondents stated that children are as likely to be
adopted because CASA volunteers push for permanency, and adoption is a permanent solution.
Of the 51 respondents (11 percent) who said “less likely,” 48 provided comments that included the following:
• 26 of the 48 respondents stated that the main goal of CASA
volunteers is reunification and it is usually achieved. • 14 of the 48 respondents stated that when reunification is not
possible, kinship or relative placement is utilized.
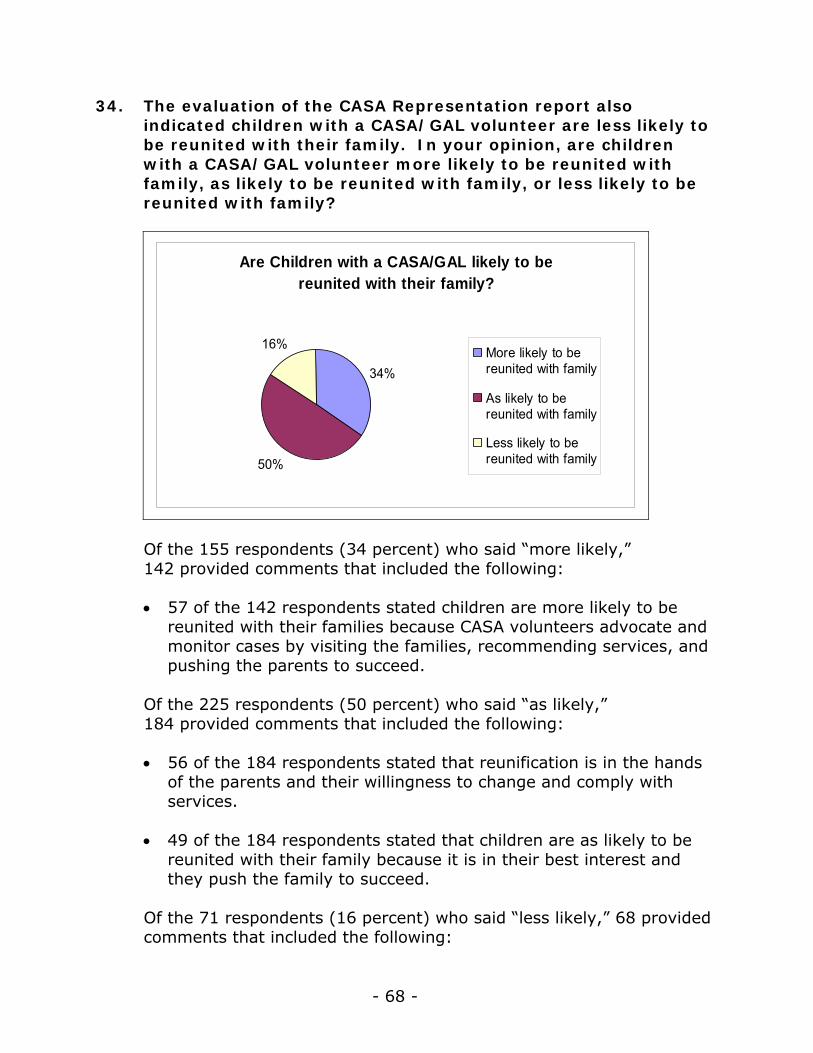
- 68 -
34. The evaluation of the CASA Representation report also indicated children with a CASA/GAL volunteer are less likely to be reunited with their family. In your opinion, are children with a CASA/GAL volunteer more likely to be reunited with family, as likely to be reunited with family, or less likely to be reunited with family?
Are Children with a CASA/GAL likely to be reunited with their family?
34%
50%
16% More likely to bereunited with family
As likely to bereunited with family
Less likely to bereunited with family
Of the 155 respondents (34 percent) who said “more likely,” 142 provided comments that included the following: • 57 of the 142 respondents stated children are more likely to be
reunited with their families because CASA volunteers advocate and monitor cases by visiting the families, recommending services, and pushing the parents to succeed.
Of the 225 respondents (50 percent) who said “as likely,” 184 provided comments that included the following: • 56 of the 184 respondents stated that reunification is in the hands
of the parents and their willingness to change and comply with services.
• 49 of the 184 respondents stated that children are as likely to be
reunited with their family because it is in their best interest and they push the family to succeed.
Of the 71 respondents (16 percent) who said “less likely,” 68 provided comments that included the following:

- 69 -
• 35 of the 68 respondents stated that children are less likely to be reunited with their family because the cases are the most severe and difficult.
35. Do you have any other comments, suggestions, or concerns
that you can offer regarding CASA/GAL programs or any of the items discussed in this survey?
239 of the 491 respondents provided comments, suggestions, and concerns that included the following: • 41 of the 239 respondents indicated that they had a problem with
the questions on the Caliber report and/or the CASA/GAL Program Office Survey.
• 40 of the 239 responses stated that CASA is a great program that
families need.
• 28 of the 239 responses stated that it is very difficult to measure CASA services with numbers because every case is unique and so many variables are immeasurable and intangible.
• 19 of the 239 respondents stated that CASA programs need
additional funding. In addition, some common trends were identified in all of the comments. The two global comment trends were: • CASA/GAL volunteers’ primary focus is on the child’s best interest. • Cases that are assigned to CASA volunteers are the most difficult
and challenging.

- 70 -
APPENDIX III

- 71 -

- 72 -
APPENDIX IV

- 73 -

- 74 -
APPENDIX V
ANALYSIS AND SUMMARY OF ACTIONS NECESSARY TO CLOSE THE REPORT
1. Resolved. This recommendation can be closed when we receive
documentation supporting that NCASAA has established a methodology for allocating indirect costs so that federal funds are not charged to unallowable cost categories.
2. Resolved. This recommendation can be closed when we receive
documentation supporting that OJP has developed outcome-based performance measures for the CASA grant programs that determine the effectiveness of the programs in meeting the needs of children in the CWS. As appropriate, these outcome measures should correspond with the data required by HHS for state and local CPS agencies, so that OJP has a basis for comparing the effectiveness of its CASA grant programs.


![UNLIMITED FIRE DESIGN · 2019. 7. 16. · 15.5 L [US] 4.0 gal / [UK] 3.3 gal 24.0 L [US] 6.34 gal / [UK] 5.28 gal 24.0 L [US] 6.34 gal / [UK] 5.28 gal 24.0 L [US] 6.34 gal / [UK]](https://static.fdocuments.in/doc/165x107/60cd4b6e3e1e6e269d46acb8/unlimited-fire-design-2019-7-16-155-l-us-40-gal-uk-33-gal-240-l-us.jpg)