N 622 - nfpahub.comnfpahub.com/wp-content/uploads/2018/01/N_622_ISO_CD_9110-1.pdf · ISO/TC 131/SC...
27
ISO/TC 131/SC 8 N 622 ISO/TC 131/SC 8 Product testing Email of secretary: [email protected] Secretariat: BSI (United Kingdom) ISO/CD ISO 9110-1 Hydraulic fluid power - Measurement techniques - Part 1: General measurement principle Document type: CD ballot Date of document: 2018-01-02 Expected action: INFO Background: Please submit your vote/comments via the Committee Internal Balloting system by 2018-02-28 Committee URL: http://isotc.iso.org/livelink/livelink/open/tc131sc8
Transcript of N 622 - nfpahub.comnfpahub.com/wp-content/uploads/2018/01/N_622_ISO_CD_9110-1.pdf · ISO/TC 131/SC...
ISO/TC 131/SC 8 N 622
ISO/TC 131/SC 8Product testing
Email of secretary: [email protected] Secretariat: BSI (United Kingdom)
ISO/CD ISO 9110-1 Hydraulic fluid power - Measurement techniques - Part 1: Generalmeasurement principle
Document type: CD ballot
Date of document: 2018-01-02
Expected action: INFO
Background: Please submit your vote/comments via the Committee InternalBalloting system by 2018-02-28
Committee URL: http://isotc.iso.org/livelink/livelink/open/tc131sc8
© ISO 9110 – All rights reserved
ISO 9110-1:####(X)
ISO TC 131/SC 8/WG 13
Secretariat: ANSI
Title Hydraulic Fluid Power — Measurement techniques Part 1: General Measurement Principles
CD Stage
Warning for WDs and CDs
This document is not an ISO International Standard. It is distributed for review and comment. It is subject to change without notice and may not be referred to as an International Standard.
Recipients of this draft are invited to submit, with their comments, notification of any relevant patent rights of which they are aware and to provide supporting documentation.

ISO 9110-1: CD
ii © ISO 9110 – All rights reserved
© ISO 2016, Published in Switzerland
All rights reserved. Unless otherwise specified, no part of this publication may be reproduced or utilized otherwise in any form or by any means, electronic or mechanical, including photocopying, or posting on the internet or an intranet, without prior written permission. Permission can be requested from either ISO at the address below or ISO’s member body in the country of the requester.
ISO copyright office Ch. de Blandonnet 8 • CP 401 CH-1214 Vernier, Geneva, Switzerland Tel. + 41 22 749 01 11 Fax + 41 22 749 09 47 [email protected] www.iso.org
ISO 9110-1: CD
© ISO 9110 – All rights reserved iii
Contents
Foreword ......................................................................................................................................................................... iv
Introduction.................................................................................................................................................................... vi
1 Normative references .................................................................................................................................... 1
2 Informative references .................................................................................................................................. 1
3 Terms and definitions.................................................................................................................................... 1
4 Uncertainty limit specifications ................................................................................................................. 2
6 Complete calibration procedure ................................................................................................................ 5
7 Instrument calibration uncertainty models .......................................................................................... 7
8 Readability Uncertainty evaluation .......................................................................................................... 9
9 Assurance control techniques ................................................................................................................. 12
10 Total measurement uncertainty ............................................................................................................. 12
Annex A (informative) Measurement system acceptance designated information sheet .............. 14
Annex B (informative) Uncertainty Propagation ............................................................................................ 15
Annex C (informative) Best Practices Tutorial .............................................................................................. 16
Bibliography ................................................................................................................................................................. 20

ISO 9110-1: CD
iv © ISO 9110 – All rights reserved
Foreword
ISO (the International Organization for Standardization) is a worldwide federation of national standards bodies (ISO member bodies). The work of preparing International Standards is normally carried out through ISO technical committees. Each member body interested in a subject for whom a technical committee has been established has the right to be represented on that committee. International organizations, governmental and non-governmental, in liaison with ISO, also take part in the work. ISO collaborates closely with the International Electrotechnical Commission (IEC) on all matters of electrotechnical standardization.
The procedures used to develop this document and those intended for its further maintenance are described in the ISO/IEC Directives, Part 1. In particular the different approval criteria needed for the different types of ISO documents should be noted. This document was drafted in accordance with the editorial rules of the ISO/IEC Directives, Part 2 (see www.iso.org/directives).
Attention is drawn to the possibility that some of the elements of this document may be the subject of patent rights. ISO shall not be held responsible for identifying any or all such patent rights. Details of any patent rights identified during the development of the document will be in the Introduction and/or on the ISO list of patent declarations received (see www.iso.org/patents).
Any trade name used in this document is information given for the convenience of users and does not constitute an endorsement.
For an explanation on the meaning of ISO specific terms and expressions related to conformity assessment, as well as information about ISO's adherence to the World Trade Organization (WTO) principles in the Technical Barriers to Trade (TBT) see the following URL: www.iso.org/iso/foreword.html.
ISO 9110 consists of the following parts, under the general title Hydraulic fluid power -Measurement techniques:
Part 1: General measurement principles
Part 2: Measurement of average steady-state pressure in a closed conduit
The committee responsible for this document is Technical Committee ISO/TC 131, Fluid power systems. Subcommittee SC 8/WG 13, Hydraulic pump testing.
This second edition cancels and replaces the first edition (ISO 9110-1:1990(E), which has been technically revised.
The main changes compared to the previous edition are as follows:
Added Normative - Informative References and updated document numbers.
Added additional definitions.
Renamed Classes of Accuracy to Measurement.
Revised and expanded Assessment of Uncertainties and renamed General Measurement Considerations. and Requirements.
Added guidance on Gravity correction.
Added Readability Uncertainty Evaluation.

ISO 9110-1: CD
© ISO 9110 – All rights reserved v
Combined Determination of Uncertainty Limits and Classification of Uncertainties and renamed Uncertainty Limit Specifications.
Revised Frequency of Calibration and renamed Assurance Control Techniques.
Added Total Measurement Uncertainty clause.
Deleted original Annex A.
Added Annex A Measurement System Acceptance Designated Information Sheet.
Added Annex B Uncertainty Propagation.
Added Annex C Best Practices Tutorial.
A list of all parts in the ISO 9110 series can be found on the ISO website.

ISO 9110-1: CD
vi © ISO 9110 – All rights reserved
Introduction
Universal measurement standards are required if meaningful comparisons are to be made and valid conclusions deduced. A fundamental aspect of fluid power technology is the need to quantify the performance characteristics of hydraulic components and systems to provide a basis for action or decision-making. The method of measurement used must be capable of reliably determining such performance characteristics.
This International Standard provides guidance for identifying uncertainty sources and magnitudes in the calibration of instruments and their use in measurement situations encountered in hydraulic fluid power testing. Methods are described for assessing the uncertainty in measurements and derived results.
It is widely recognized that no measurement, irrespective of the amount of care exercised, can ever be absolutely accurate and free of error. Different circumstances each have unique uncertainty requirements. The value of a measurement is dictated by the use that will be made of it, as well as the particular circumstance. Therefore, the maximum value of a reported measure can only be realized if it can be applied under many different circumstances, requiring that the uncertainty associated with a measure be assessed and reported.
This International Standard is intended to be used in conjunction with others that address the measurement of specific physical parameters: flow, pressure, torque, speed and temperature.
This part (ISO 9110-1) relates to general principles for the measurement of static or steady-state conditions. ISO 9110-2 deals with the measurement of average steady-stale static pressure in a closed conduit.
Identification of patent holders, None.

ISO 9110-1: CD
ISO 9110 – All rights reserved 1
Title Hydraulic Fluid Power — Measurement techniques Part 1: General Measurement Principles
Scope
This part of ISO 9110 establishes general principles for the measurement of performance parameters under static or steady-state conditions.
This standard provides guidance on the sources and magnitudes of uncertainty to be expected in the calibration of and measurements using hydraulic fluid power components. It describes practical requirements for assessing the capability of the measuring system, and hence the l e v e l of uncertainty of the measurement system, or for assisting in developing a system which will meet a prescribed level of u n c e r t a i n t y .
1 Normative references
The following documents are referred to in the text in such a way that some or all of their content constitutes requirements of this document. For dated references, only the edition cited applies. For undated references, the latest edition of the referenced document (including any amendments) applies.
ISO 80000-1, Quantities and Units Part 1: General
ISO/IEC 98-3 Guide to the Uncertainty in Measurements
ISO 5598 Fluid power systems and components – Vocabulary
JCM 200 International Vocabulary of Metrology – Basic and general concepts and associated terms (VIM)
ISO 7870-1 Control charts - Part 1: General guidelines
ISO 7870-2 Control charts - Part 2: Shewhart control charts
2 Informative references
OIML D10 International Document, ILAC- G24 Guidance Series Guidelines for the determination of calibration intervals of measuring instruments
NCSL International RP-1 Establishment and Adjustment of Calibration Intervals
3 Terms and definitions
For the purposes of this document, the following terms and definitions apply.
ISO 9110-1: CD
© ISO 9110 – All rights reserved
2
3.1 data reduction errors: Errors that stem from any processing of test data to the final result, as from digital computer resolution, numerical rounding of results, and uncertainty in model curve fitting and interpolation.
3.2 indicated value: Magnitude of the measurand and the parameter subject to measurement.
3.3 instrument uncertainty: The range within which the instrument agrees with its calibration standard.
3.4 parallax: Phenomenon responsible for reading errors when the observers eye is not perpendicular to the meter face, and is not directly in line with a pointer whose tip is not in the same plane as the instrument scale.
3.5 readability: The ability of a human observer to discern a numeric value to the quantity displayed on the readout device.
3.6 uncertainty model: A chart, graph or equation that relates the indicated value to the value of the measure and the parameter being measured.
ISO and IEC maintain terminological databases for use in standardization at the following addresses:
— ISO Online browsing platform: available at http://www.iso.org/obp
— IEC Electropedia: available at http://www.electropedia.org/
4 Uncertainty limit specifications
The problem of uncertainty is to develop measures that enable the measurement user to evaluate the full information content of the measurement. Each performance test standard that incorporates this standard as a normative reference must have its own uncertainty defined for each of the four measurement classes described herein, and instrumentation selection criteria stated.
4.1 Procedure
4.1.1 The maximum uncertainty which can be allowed in a fluid power test measurement can only be established by considering the component or system under test, the expected use of the test results, and the economics of the test program.
4.1.2 From knowledge of the component to be tested and the nature of the test, permissible uncertainty limits can be established. For example, leakage and metering tests are different. Each must be conducted using different procedures. Each must have its own uncertainty requirements and be considered individually. In some tests (for example pump overall efficiency), the uncertainty limits of more than one measured parameter are important in order to maintain reasonable limits of uncertainty in the calculated result. Uncertainty levels of calculated values should be reported per ISO/IEC 98-3.
4.1.3 The overall objective of the test program must be considered prior to establishing the maximum uncertainty permissible for each parameter measured. Where the test program is required to discriminate between design changes, the allowable uncertainty may be small. If the test is intended only to ascertain if a component was assembled correctly or if the component has failed, the allowable measurement uncertainty could be large.

ISO 9110-1: CD
ISO 9110 – All rights reserved 3
4.1.4 The purpose of conducting a test and collecting data is to provide a data base for action or decision. This leads to additional pressures to assess measurement uncertainty. However, uncertainty should not be any greater than that which is needed to decide on a course of action with reasonable confidence. It is costly to make measurements, and the cost increases as the allowable uncertainty is reduced. Economics is a factor and cannot be ignored in order to justify being accurate for uncertainty's sake.
4.1.5 Each test procedure complying with this standard should include a table of permissible uncertainty that provide the limits for each of the four measurement classes relevant to this test procedure: A, B, and C (see 4.2.1, 4.2.2, 4.2.3 and 4.2.4). The limits should be based on the maximum uncertainty allowable for each measured parameter.
4.2 Measurement classes
4.2.1 Class A is the most restrictive and is intended for those measurement situations that are scientific in nature and directed at investigating phenomena. Equipment capabilities and technical expertise required to perform class A measurements would generally be used only in the most stringent applications.
4.2.2 Class B is intended to encompass performance measurements required for selection and application of components and for quality audits. The requirements for class B measurements should be within the capabilities of most fluid power testing laboratories.
4.2.3 Class C would apply to diagnostic situations where the objective is to determine if hardware is functioning properly or has failed, and to monitor the operational status of equipment. Users with limited expertise in fluid power measurements using standard commercial instrumentation would possess the required capabilities.
5 General measurement considerations and requirements
The uncertainty inherent in a measurement system may be associated with individual elements of that system or the system as a whole. In general, calibrating and evaluating the uncertainty of the system as a whole result in smaller errors and reduced uncertainty.
5.1 Calibration
All reference standards and measuring instruments shall be calibrated utilizing traceable standards of known uncertainty and environmental influences. The reference standard must be traceable to a nationally or internationally certified calibration agency or have been derived from accepted values of natural physical constants, or have been derived by the ratio type of calibration technique. Reference standards or physical constants are those recognized by the International Committee for Weights and Measure (CIPM), the International Bureau of Weights and Measures (BIPM), or the National Standard Institute of the respective country.
The reference standard uncertainty included in the total measurement system uncertainty summation in clause 10 is obtained either from the manufacturer or certifying agency that provided certification traceable to the reference standards laboratory.
ISO 9110-1: CD
© ISO 9110 – All rights reserved
4
5.1.1 The calibration interval of reference standards is determined by:
a) consideration of usage and environmental factors;
b) manufacturer's recommendations;
c) governing contract, government regulation, or specific industry specifications.
5.1. 2 The complete calibration interval of measuring instruments is determined by using the results of intermediate calibrations per clause 9.
Class A measurements require an intermediate calibration immediately prior to instrument use, every 48 hours of continuous use, or if damage, abuse, or calibration shift is suspected.
NOTE All test results acquired in the preceding calibration interval are suspect, if at the next calibration the results fall outside the control chart limits.
5.1.3 Calibration increments for instruments with linear characteristics shall be spaced in a linear manner. For non-linear instruments, such as turbine flow meters, logarithmically spaced increments are recommended to provide better definition in the non linear range. The calibration increments selected must include the end points encountered in the measurement situation.
New instruments or those without a prior calibration history must be calibrated at no less than 10 calibration points and five repeated trials at each point.
For instruments with prior calibration history, an intermediate calibration performed at 25, 50, and 100 % of full scale with three repeated trials is sufficient.
5.1.4 Eliminate systematic standard uncertainty observed during calibration by instrument adjustment or by correcting all data obtained. If systematic standard uncertainty correction is not implemented, include the maximum value of the systematic standard uncertainty in the computation of the total measurement system uncertainty in clause 9. For example, if the calibration of an instrument reveals a 3 % deviation at mid range and 1 % at the end points, and the data obtained using the instrument is to be used without correction, the 3 % deviation must be used in the uncertainty computation.
5.1.5 Correct standard uncertainties which are the result of a physical relationship with another independent variable by using a known mathematical function. This class of uncertainties is normally due to environmental factors. The effect of temperature on a transducer strain gage bridge is an example of such an effect.
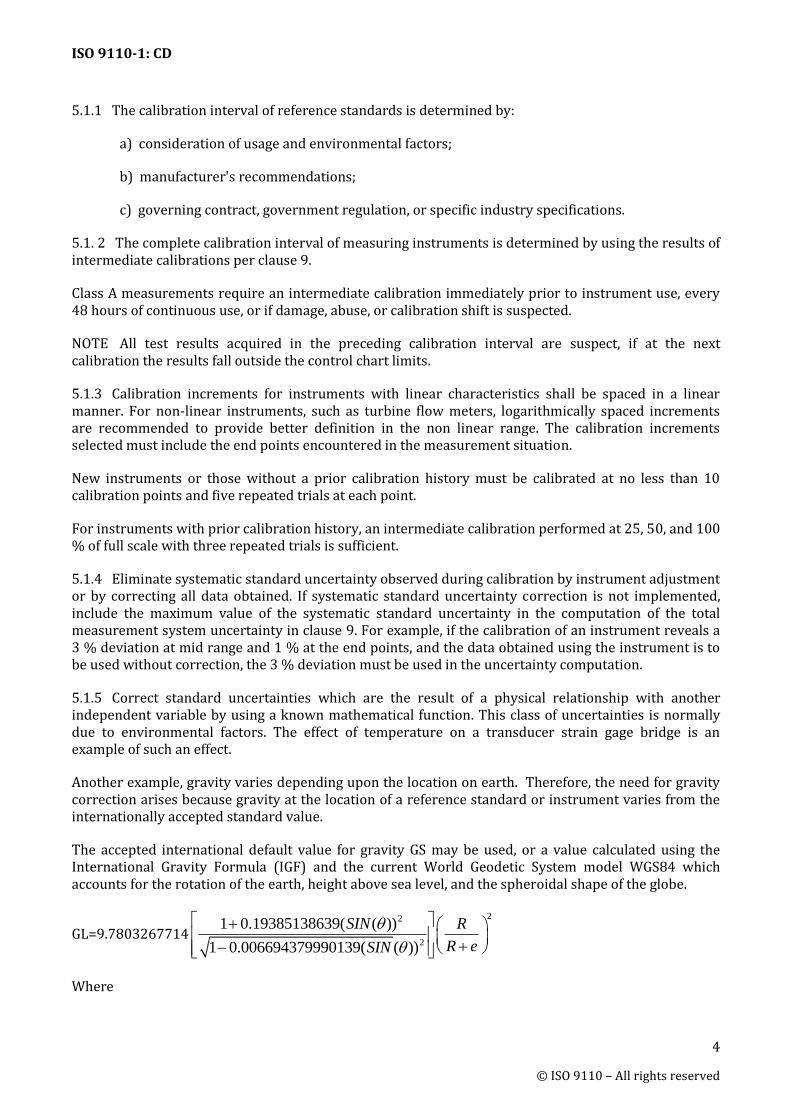
Another example, gravity varies depending upon the location on earth. Therefore, the need for gravity correction arises because gravity at the location of a reference standard or instrument varies from the internationally accepted standard value.
The accepted international default value for gravity GS may be used, or a value calculated using the International Gravity Formula (IGF) and the current World Geodetic System model WGS84 which accounts for the rotation of the earth, height above sea level, and the spheroidal shape of the globe.
GL=9.7803267714
22
2
1 0.19385138639( ( ))
1 0.006694379990139( ( ))
SIN R
R eSIN
Where

ISO 9110-1: CD
ISO 9110 – All rights reserved 5
= latitude
e = elevation above sea level
R = 6,371,000 m nominal radius of earth
Gravity correction is accomplished using a ratiometric method. For example, in torque or pressure measure calibration, which relies upon reference dead weight, the following relationship for correction applies;
Where
FC = MGl
Gs PC =
PGl
Gs
FC and PC are the corrected values for force and pressure;
M is the mass under standard conditions;
P is the pressure;
Gl is the local gravity value; and
Gs is the international standard gravity value (980.0665 2cm/s ) 9.8007 2m/s
Another example applies to fluid elevation head instruments such as manometers. Gravity correction is accomplished using the following relationship:
HtGlHC =
Gs
where
HC is the corrected values for the height of the indicating fluid.
Ht is the height of the indicating fluid.
Gl is the local gravity value; and
Gs is the international default value for gravity
If the standard uncertainty is neglected and no correction is made for its effect, the maximum value of the uncertainty must be included in the computation of total measurement system uncertainty in clause 10.
5.1.6 If a testing agency is not equipped to perform either an intermediate or a complete calibration, the instrument manufacturer or other agency may be contracted to perform these services. The testing agency and its independent contractor are not exempted from any of the requirements set forth herein.
6 Complete calibration procedure
6.1 Selection of reference standard
ISO 9110-1: CD
© ISO 9110 – All rights reserved
6
Select a reference standard which:
a) is free of physical damage, or the damage was previously noted in the calibration records and is not considered to effect it‘s function;
b) is certified and traceable per the requirement of subclause 5.1; and
c) has its total uncertainty evaluated and documented.
6.2 Procedure
6.2.1 Mount the reference standard in an attitude indicated in its calibration record or as recommended by its manufacturer.
6.2.2 Select the measuring instrument to be calibrated. Observe and note any physical damage not previously recorded.
6.2.3 Mount the measuring instrument in an attitude recommended by the manufacturer or in an attitude expected in the measurement situation.
6.2.4 Make zero value checks with the measuring instrument physically uncoupled from any possible loading effects.
6.2.5 Couple the measuring instrument to the reference standard and begin calibration data collection.
6.2.6 For instruments which are subject to hysteresis effects (e.g. material characteristics or static friction), conduct the calibration for both increasing and decreasing reference values. Evaluate the results of the first calibration trial to assess hysteresis effects.
6.2.7 Correct for systematic standard uncertainty. Take advantage of any correction charts or uncertainty models which resulted from calibration of the reference standard.
6.2.8 Correct the reference values for any other systematic standard uncertainties when the relationships with other physical variables are known and the physical variables themselves are known (measured) at the time of instrument calibration...
In circumstances where reading correction is undesirable or the reference instrument is subject to uncontrolled variations, include the maximum expected value of the systematic standard uncertainty in computing the total measurement system uncertainty in clause 10.
6.2.9 Record the reference value, after correction per 6.2.7 and 6.2.8 and the corresponding instrument indicated value for each calibration increment.
6.2.10 Develop an uncertainty model in accordance with clause 7.
6.2.11 Sign and date the calibration sheets. Record all pertinent information concerning the reference standard used for calibration, any physical damage observed to the instrument calibrated or unusual characteristics, environmental conditions, and mounting attitude of the reference standard and instrument. Place these records in a permanent file.
6.2.12 A label affixed to the instrument is recommended. Attach the label to the instrument's readout device in a manner, which will discourage its inadvertent removal and not interfere with readability. The label should contain the following information:
a) date of last complete calibration;

ISO 9110-1: CD
ISO 9110 – All rights reserved 7
b) instrument identification information;
c) identification of the person or agency responsible for calibration of the instrument.
7 Instrument calibration uncertainty models
This clause sets forth the procedures for deriving uncertainty models of a measuring instrument and, when significant, for evaluating the effects of environmental factors. Based on the uncertainty model selected, the measuring instrument calibration uncertainty can be determined.
7.1 General procedure
7.1.1 Select a suitable uncertainty model from either clause 7.2, 7.4, or 7.6.
NOTE The amount of calibration uncertainty in most instruments will depend upon the model selected. Higher order models will yield smaller uncertainties.
7.1.2 Enter the calibration uncertainty on the instrument's calibration record and label if used.
7.2 First order uncertainty model
7.2.1 A first order uncertainty model makes direct use of the indicated value of the instrument readout device without any corrections to the measured value. The model includes the measuring instrument, interconnect cabling and the readout device as a measuring system.
7.3 First order calibration uncertainty evaluation
7.3.1 Use the calibration data as recorded in clause 6.
7.3.2 Calculate the difference between the indicated value and the reference value of the five trials at each reference value by:
Indicated value – Reference value (xi – xr)
7.3.3 Calculate the standard deviation for each repeated trial in clause 6.2.9 over the total range of reference values, using the formula:
S = 1n
xxin
1i
2
r
where
S is the standard deviation;
xi is the Indicated value;
xr Reference value;
n is the number of values at each reference increment and repeated trial.
This calculation procedure yields the calibration standard uncertainty for all trials over the total range of reference values evaluated.
ISO 9110-1: CD
© ISO 9110 – All rights reserved
8
7.3.4 Implement the model by using the reading as indicated on the readout device.
7.3.5 The calibration uncertainty is the maximum amount recorded in clause 7.3.3 for each of the reference values used in the calibration.
7.4 Second order uncertainty model
7.4.1 A second order uncertainty model makes use of a point-to-point correction of instrument reading in the measurement situation. The assumption is that corrections are linear when indicated values taken in the measurement situation lie between data points used during calibration. Linear interpolation between discrete reference increments is used for reading correction.
7.5 Second order calibration uncertainty evaluation
7.5.1 Use the calibration data as recorded in clause 6.
7.5.2 For each reference value:
a) calculate the average indicated value of all the trials at each reference value;
b) calculate the difference between the indicated value and the average indicated value of all the trials by;
Indicated value – Average indicated value i ix x
7.5.3 Calculate the standard deviation of all values found in clause 6.2.9 over the total range of reference values.
7.5.4 Implement the model by constructing a chart of the average indicated values found in clause 6.5.2 (as averaged over all the trials for each referenced value) and the reference values.
In the measurement situation, convert indicated values into the best estimates of the actual values. Use linear interpolation between discrete data entries to arrive at the actual value.
Take environmental factors into account if significant by:
a) an alternate uncertainty model which includes their effects;
b) using instruments which have been insignificantly influenced by environmental factors;
c) controlling environmental factors during measurement so that they are in significant agreement with their values during calibration.
7.5.5 The calibration uncertainty is the maximum amount recorded in clause 7.5.3 for each of the reference values used in the calibration.
7.6 Third order uncertainty model
7.6.1 A third order uncertainty model assumes that a mathematical relationship exists between relevant environmental factors and the conventional true value of a physical variable. The corrected value is arrived at by correcting the indicated value in a manner similar to the second order model. The
ISO 9110-1: CD
ISO 9110 – All rights reserved 9
third order uncertainty model is, in effect, a second order model with additional correction for environmental factors.
A formula expressing the relationship between the variables must be developed using linear regression analysis.
7.6.2 Determine the relationship of environmental factors and indicated values with one or more of the following methods:
a) use proven mathematical relationships based upon physical laws;
b) use empirical data as measured during controlled experiments conducted in the measuring instrument calibration;
c) use manufacturer's data (for example, zero shift due to temperature, or span shift due to viscosity etc.);
d) ignore environmental factors when they are brought into agreement with measurements of values that existed during calibration, and any factors which are known to have an insignificant influence upon the indicated value.
7.7 Third order calibration uncertainty evaluation
7.7.1 Use the formula developed in subclause 7.6.
7.7.2 Calculate the difference between the indicated value and the value predicted by the derived mathematical formula of all trials at each reference value by
Indicated value – Average indicated value i ix x
7.7.3 Calculate the standard deviation of all values found in clause 7.7.2 over the total range of reference values.
7.7.4 Implement the uncertainty model by substituting the indicated values and values of the environmental factors into the mathematical formula. That result is the estimate of the actual value at measurement time. The calibration uncertainty is the maximum amount recorded in clause 7.7.3 for each of the reference values used in the calibration.
8 Readability Uncertainty evaluation
Evaluate the readability uncertainty for the readout device using the following procedure. This error arises because of the inability to assign an unlimited number of digits to the indicated value of a measured quantity.
8.1 Analog readout devices
8.1.1 The readability uncertainty (RE) for a readout device equipped with a pointer shall be calculated using

ISO 9110-1: CD
© ISO 9110 – All rights reserved
10
RE = Value of the smallest scale division
+ RF [RFd x RFp + 2.0]
where
RFd is the readability factor of the dial;
RFp is the readability factor of the pointer;
RF is the angular or parallax readability factor.
NOTE The readability uncertainty may be estimated by using
RE = Value of the smallest scale division
+ RF 2
This equation yields the maximum readability uncertainty. Therefore, if an estimate is used for RE in lieu of the exact value, the resulting uncertainty is always conservative.
The preceding factors are determined from properties of the readout device. Include the readability uncertainty in 9.1.1.1 and 9.1.1.2.
8.1.1.1 If the readout device is equipped with a parallax error minimizing feature, determine within 10 % the
width (W) of the smallest scale division in mm. RFd is calculated by substituting the value for W in the
appropriate equation.
RFd = 3(1 - e 0.5 - 1.1w) W 0.5 mm
RFd = 0.0 W< 0.5 mm
Determine the width of the pointer to the nearest 0.25 mm (0.02 in) in the region on the pointer where the reading is interpreted. Divide the width of the smallest scale division found in 9.1.1.1 by the pointer width to form the ratio .
= Width of the smallest scale division
+ RF Pointer width
Calculate RFp with the formula: (Refer to figure 1.)
RFp = 1-e0.6(1 - ) > 1.0:
RFp = 0 1.0
RF = 0 for all ’s
ISO 9110-1: CD
ISO 9110 – All rights reserved 11
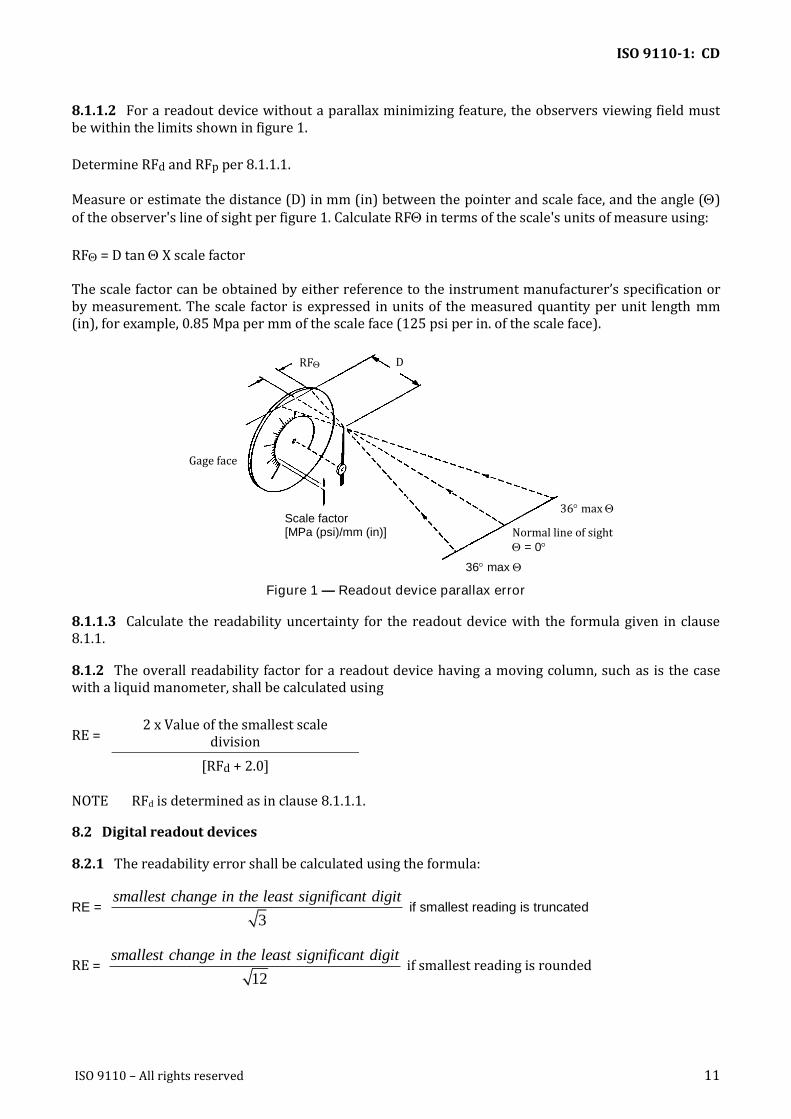
8.1.1.2 For a readout device without a parallax minimizing feature, the observers viewing field must be within the limits shown in figure 1.
Determine RFd and RFp per 8.1.1.1.
Measure or estimate the distance (D) in mm (in) between the pointer and scale face, and the angle () of the observer's line of sight per figure 1. Calculate RF in terms of the scale's units of measure using:
RF = D tan X scale factor
The scale factor can be obtained by either reference to the instrument manufacturer’s specification or by measurement. The scale factor is expressed in units of the measured quantity per unit length mm (in), for example, 0.85 Mpa per mm of the scale face (125 psi per in. of the scale face).
Figure 1 — Readout device parallax error
8.1.1.3 Calculate the readability uncertainty for the readout device with the formula given in clause 8.1.1.
8.1.2 The overall readability factor for a readout device having a moving column, such as is the case with a liquid manometer, shall be calculated using
RE = 2 x Value of the smallest scale
division
[RFd + 2.0]
NOTE RFd is determined as in clause 8.1.1.1.
8.2 Digital readout devices
8.2.1 The readability error shall be calculated using the formula:
RE =
3
smallest change in the least significant digit if smallest reading is truncated
RE =
1
2
smallest change in the least significant digit if smallest reading is rounded
RF
Gage face
D
Scale factor [MPa (psi)/mm (in)]
36 max
Normal line of sight = 0
36 max
ISO 9110-1: CD
© ISO 9110 – All rights reserved
12
NOTE Take into account the fact that by design the least significant digit in digital readout devices either truncates or rounds the smallest significant digit. Most digital systems truncate the reading. Use the value of the smallest integer change possible for the particular readout.
8.3 Readout device records
8.3.1 Enter the overall readability uncertainty, as determined in clauses 8.1 or 8.2, into the readout device's calibration record and label if used.
9 Assurance control techniques
Evaluate intermediate calibration results from clause 7 with the use of statistical quality control charts to determine if a complete calibration is required. Validation that the measurement system is in a state of statistical control is thereby established. Drifts, trends, or movements indicating out of control situations must be investigated and corrected. The methods presented herein are only valid for well-defined measurement systems. Select control chart limits based upon either the instrument manufacturer's specified uncertainty or the instrument's uncertainty as established by the user.
A detailed description of control chart methodology is outside the scope of this standard. ISO 7870-1 & 2 describe the use of statistical quality control charts.
10 Total measurement uncertainty
10.1 Determination of system uncertainty
The measurement system uncertainty is determined by summation of the various standard uncertainty contributing terms as applicable. This summation is accomplished by applying the root sum of squares (RSS) methods presented in the ISO/IEC 98-3 Guide to the Expression of Uncertainty in Measurements. The ISO method requires that each standard uncertainty contributor be characterized as either type A, which are those that are evaluated by statistical analysis of a series of observations, or type B uncertainties which must be evaluated by other means.
10.1.1 Determine uncertainty contributing terms from the instrument's calibration records, this or other standards referencing this document, or from the instrument manufacturer. Determine the measurement system uncertainty by summing all of the following standard uncertainty terms:
a) reference standard uncertainty;
b) calibration system uncertainty;
c) readability uncertainty;
d) thermal and environmental sensitivity effects; and
e) remaining uncertainty contributing terms as applicable, such as environmental factors (temperature), elevation errors (pressure head), pressure tap induced errors, data acquisition errors, etc.
10.1.2 Total measurement uncertainty must encompass a summation of the following uncertainty contributing terms:
a) propagated uncertainty for derived quantities which are not measured directly; (see Annex B)
ISO 9110-1: CD
ISO 9110 – All rights reserved 13
b) data reduction errors.
Record the total measurement uncertainty in the “Measurement acceptance designated information sheet” in annex A.
If the actual measurement uncertainty is within the maximum allowed uncertainty for the measurement class selected, or the limits specified in the governing component or system document, then the measured parameters are qualified in that test situation.
When the uncertainty exceeds the maximum allowed uncertainty limits, the uncertainty must be reduced by recalibrating the measurement system as a whole, selecting a higher order uncertainty model, changing the measurement system, or minimizing/reducing data reduction errors.

ISO 9110-1: CD
© ISO 9110 – All rights reserved
14
Annex A (informative)
Measurement system acceptance designated information sheet
Parameter Measurementt class
(A, B, C,)
Maximum allowed
measurement uncertainty
Total measurement
uncertainty
Input signal ___________ ___________ ___________
Flow ___________ ___________ ___________
Pressure ___________ ___________ ___________
Differential pressure
___________
___________
___________
Temperature ___________ ___________ ___________
Torque ___________ ___________ ___________
Speed ___________ ___________ ___________
Time ___________ ___________ ___________
Force ___________ ___________ ___________
Linear Distance
___________ ___________ ___________

ISO 9110-1: CD
ISO 9110 – All rights reserved
15
Annex B (informative)
Uncertainty Propagation
In certain measurement situations, some measured physical quantities cannot be measured directly but must be derived to arrive at the end result. For example, consider a leakage measurement in which a
volume and time interval are recorded, and the end result calculated; i.e. mm3/min (in3/min). In other cases, several measured parameters are needed to calculate a result; for example, pump overall efficiency.
In these situations, the uncertainty evaluation of the final result must also be calculated. First the total uncertainty in each primary measured quantity must be determined per clause 9. Then, the procedures contained in this section can be applied to determine how the primary uncertainty propagates through to calculated end result.
B.1 Table 1 summarizes the general form of mathematical function (formula), which may have been used in calculating the end result, and the corresponding expression for determining the propagated uncertainty.
Table 1 Mathematical function and uncertainty propagation
Formula Expression for Uncertainty Propagation
C = General arbitrary function of one variable
cC
Ux
C = General arbitrary function of several variables
1/2
2 2 2 2 2
cC C C C C
U Ux Ul Ua Ub Udx l a b d
NOTE If the derived result was calculated in terms of a formula given in the left column, the propagated uncertainty is calculated using the corresponding expression in the right column. Symbols are defined as follows:
C is the independent calculated variable; x, l,a,b,d are the dependent variables representing primary measured quantities; Ux, Ul, Ua, Ub, Ud are uncertainties to be propagated;
Uc is the sum of the individual uncertainties.
ISO 9110-1: CD
© ISO 9110 – All rights reserved
16
Annex C (informative)
Best Practices Tutorial
NOTE This tutorial is not part of ISO 9110-1. The contents may assist in establishing a more complete understanding of best practices to support good measurement approaches in the test situation.
Introduction
In the past, the emphasis has been on data generation and not evaluation. Current trends emphasize quality, and this will require greater attention to data evaluation. The basic motivation for examining measurement uncertainty is the realization that test data is no better than the measurement process involved in generating it. Improving product quality demands more reliable and accurate test data.
The purpose of testing and data collection is to provide a basis for action or decision-making. If an analysis of uncertainty is neglected, the utility of test results is compromised. Decisions cannot be made with any degree of confidence if the data uncertainty is not assessed. The aim of this standard is to provide relevant means to enable the user of test data to evaluate the total information content of that data.
C1.0 Often, one of the biggest sources of uncertainty comes from the reference standard (or calibrator)
that you use in your calibrations. Select a suitable reference standard for each measurement. It is also
important to remember that it is not enough to use the manufacturer’s accuracy specification for the
reference standard and keep using that as the uncertainty of the reference standards for years. Instead
you must have your reference standards calibrated regularly in a calibration laboratory that has
sufficient capabilities (small uncertainties) to calibrate the standard and to make it traceable. Pay
attention to the total uncertainty of the calibration that the laboratory documented for your reference
standard. Also, you should follow the stability of your reference standards between its regular
calibrations using statistical quality control charts.
C2.0 Written work instructions detailing the procedures for calibrating instruments provide a reference technicians can use and thereby insure consistency in results. These instructions should include uncertainty limits along with a reaction plan when results are not within limits.
C3.0 Written work instructions detailing the procedures for making measurements provide a reference technicians can use and thereby insure consistency in results. Technician training and qualifications for using the measurement system should be assessed before data collection commences.
C4.0 The long-term aspect of uncertainty is control. The economics involved are sometimes difficult to justify. It is certainly uneconomical to calibrate prior to every measurement, and it is equally uneconomical to make measurements without instrument calibration. The risks and costs associated with using improperly calibrated equipment needs to be assessed.
C5.0 Statistical quality control chart techniques have been proven as an economical means of control in mass production, and are equally applicable in measurement practice. Control chart methodology is well researched and published extensively. Recording and analyzing the resulting calibration data in control charts can be used to establish the short and long-term behavior of measuring instruments.

ISO 9110-1: CD
ISO 9110 – All rights reserved
17
C6.0 Calibration intervals of reference standards, and measuring instruments, can be established using a variety of approaches;
6.1 Statistical Process control chart methodology.
6.2 Using reliability analysis Weibull methods.
6.3 Periodic time intervals.
6.4 Based on frequency or elapsed time of use.
6.5 Instrument manufacturer’s performance specifications and user experience.
6.6 Specific recalibration intervals depend on a number of factors including:
• Requirements set by customers, contract, or regulation
• Inherent stability of the specific instrument or device
• Environmental factors that may affect the stability
• Instrument storage and use
C7.0 Use of an artefact substituting as a reference standard can be very effective in validating a measurement system over time. The artefact can be an actual test unit that is only use for that purpose. When results are tracked using control chart methods, or any statistical methods for comparison of data, any problems developing with the measurement system can be identified before conducting an extensive test and collecting data.
C8.0 Effort to establish that the measurement system is stable and under statistical control using statistical process control methods are a necessary prerequisite to data collection. This effort must be conducted over time and is not a single event.
C9.0 Observe any differences between in environmental conditions between the calibration and the measurement situations and conduct an assessment of how these differences influence the integrity of data collected.
C10.0 While some test standards have chosen to address the subject of uncertainty in terms of strictly the systematic error of the measuring instrument, this standard practice does not. In the test situation, systematic errors, random errors, calibration errors, environmental factors (in a lot of cases the largest and often overlooked), all contribute to uncertainty in the test data. In the post-test situation, propagated uncertainty and data reduction errors enter in. By neglecting one or more of these, measurement uncertainty is being ignored. The bottom line is, uncertainty in the final result is the prime concern, which necessitates that all possible sources of uncertainty be examined and quantified.
C11.0 A practical means for selecting instruments used in a particular measurement situation is provided in annex A, Measurement system acceptance designated information sheet. In most cases, all but the measurement system uncertainty is fixed, and this uncertainty is primarily a function of the instrument selected. The maximum allowable uncertainty corresponding to the specified measurement class is compared to the total measurement uncertainty. The measurement system is accepted if its' total uncertainty is equal to or less than the maximum allowed uncertainty.
ISO 9110-1: CD
© ISO 9110 – All rights reserved
18
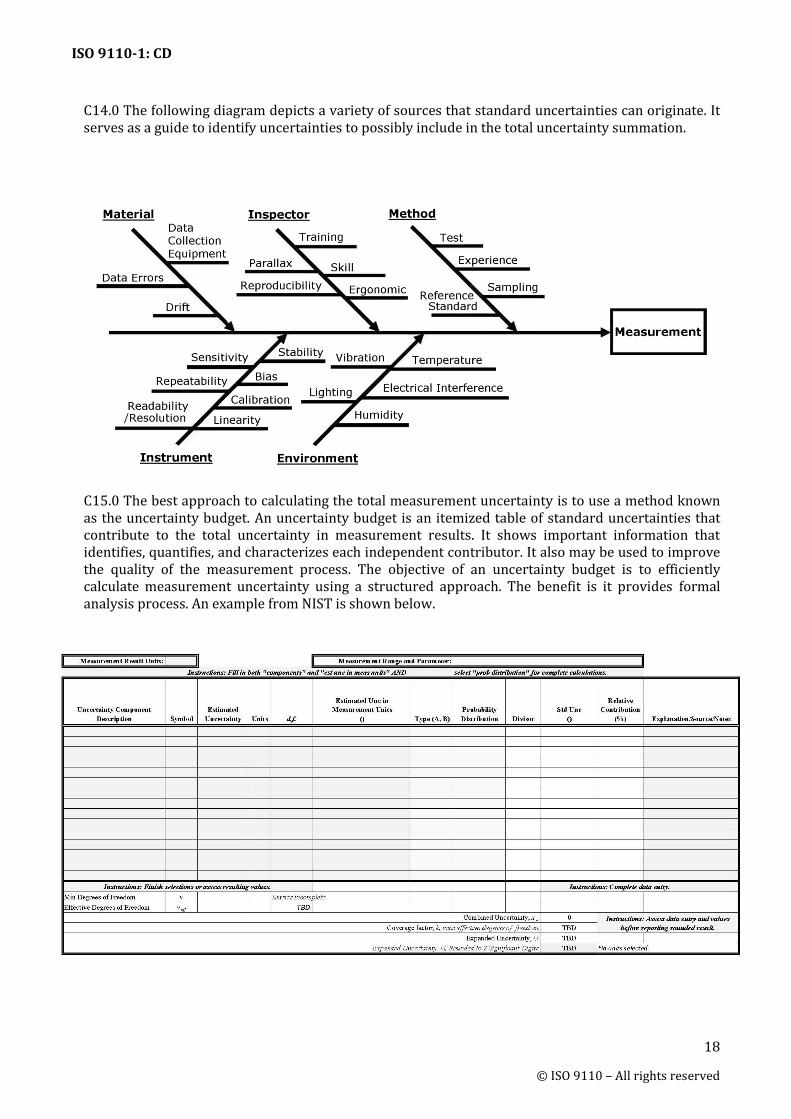
C14.0 The following diagram depicts a variety of sources that standard uncertainties can originate. It serves as a guide to identify uncertainties to possibly include in the total uncertainty summation.
C15.0 The best approach to calculating the total measurement uncertainty is to use a method known as the uncertainty budget. An uncertainty budget is an itemized table of standard uncertainties that contribute to the total uncertainty in measurement results. It shows important information that identifies, quantifies, and characterizes each independent contributor. It also may be used to improve the quality of the measurement process. The objective of an uncertainty budget is to efficiently calculate measurement uncertainty using a structured approach. The benefit is it provides formal analysis process. An example from NIST is shown below.
ISO 9110-1: CD
ISO 9110 – All rights reserved
19
C16.0 Classification of standard uncertainties as either A or B is sometimes difficult to determine. The following list of standard uncertainties may assist in that process.
Repeatability Type A Nonlinearity Type B
Reproducibility Type A Readability Type B
Stability Type A Temperature Effects Type B
Bias Type A Load Type B
Drift Type A Zero Offset Type B
Resolution Type B Sensitivity Type B
Hysteresis Type B
Reference Standard Type B Reference Standard Stability Type B
ISO 9110-1: CD
© ISO 9110 – All rights reserved
20
Bibliography
[1] An Investigation Into the Required Equipment and Procedures For the Accurate Measurement of Pressure in Hydraulic Fluid Power Systems, by The Fluid Power Institute, Milwaukee School of Engineering, 27 May 1976, under Contract Number DAAG53-76-C-0036 to the U.S. Army Mobility Equipment Research and Development Center, Ft. Belvoir, Va. Defense Technical Information Center AD No. A244165.


![Index []Index a ABC transporters 130, 131 ab initio calculation 575 Ab-protein 622 Acacia gum – adsorption layers 721 – emulsifying efficiency 722 Acacia seyal 217 Acetobacter](https://static.fdocuments.in/doc/165x107/5f88ea72fbc0e94e561b4055/index-index-a-abc-transporters-130-131-ab-initio-calculation-575-ab-protein.jpg)