My role in the data jigsaw: The Starpath view › assets › education › about › research ›...
68
My role in the data jigsaw: The Starpath view Earl Irving July 2012
Transcript of My role in the data jigsaw: The Starpath view › assets › education › about › research ›...

My role in the data jigsaw: The Starpath view
Earl Irving
July 2012
Overview
Some good news, or a double whammy? Connecting the pieces of the jigsaw Importance of data Types of data Exploring data Who, me? A challenge for all

Connecting the pieces
Be part of the solution, not part of the problem
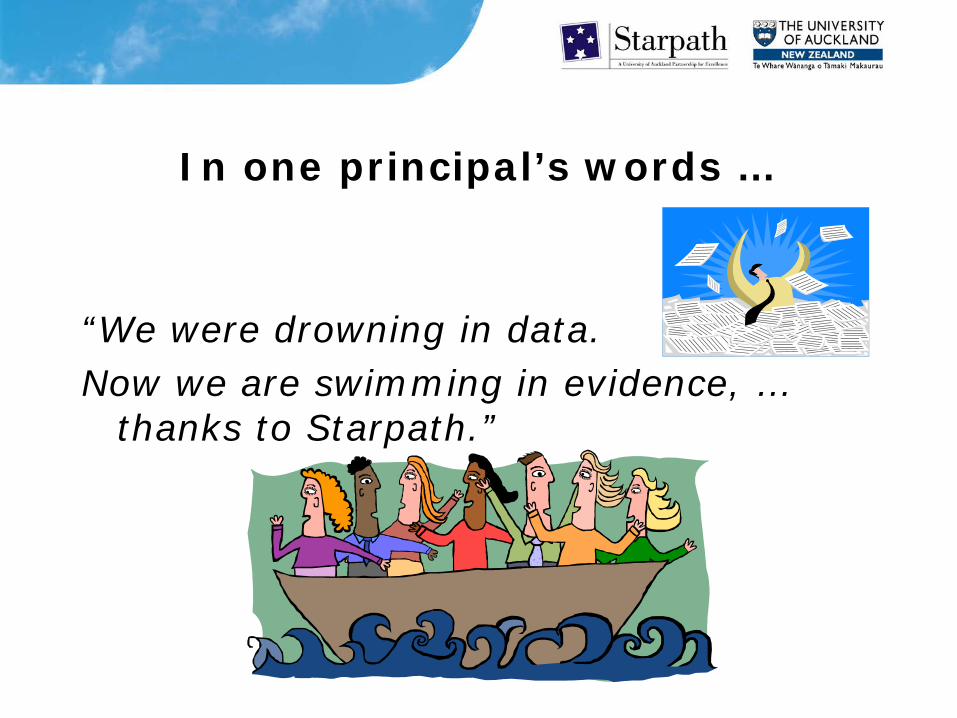
In one principal’s words … “We were drowning in data. Now we are swimming in evidence, …
thanks to Starpath.”

Data? “Without data, you are just another person with an
opinion.” (Andreas Schleicher, head of the OECD) “Schools are awash with data.” (Prof. John Hattie) “Data are the fuel of school reform …in short, using data
separates good schools from mediocre schools.” (Killian and Bellamy) “Data is not the plural of anecdote.” (Gove, 2011) But the one I love most:
“Data don’t change schools, people do.” (Love)

A Revelation?
Before the kids will change,
WE have to change!
We must be the change that we wish to see in the world.
Mahatma Gandhi

The Importance of Data
Provides the focus to ask questions & make good decisions
Allows us to work effectively Improves school processes Measures impact of strategies implemented But never forget:
–All those numbers are our future
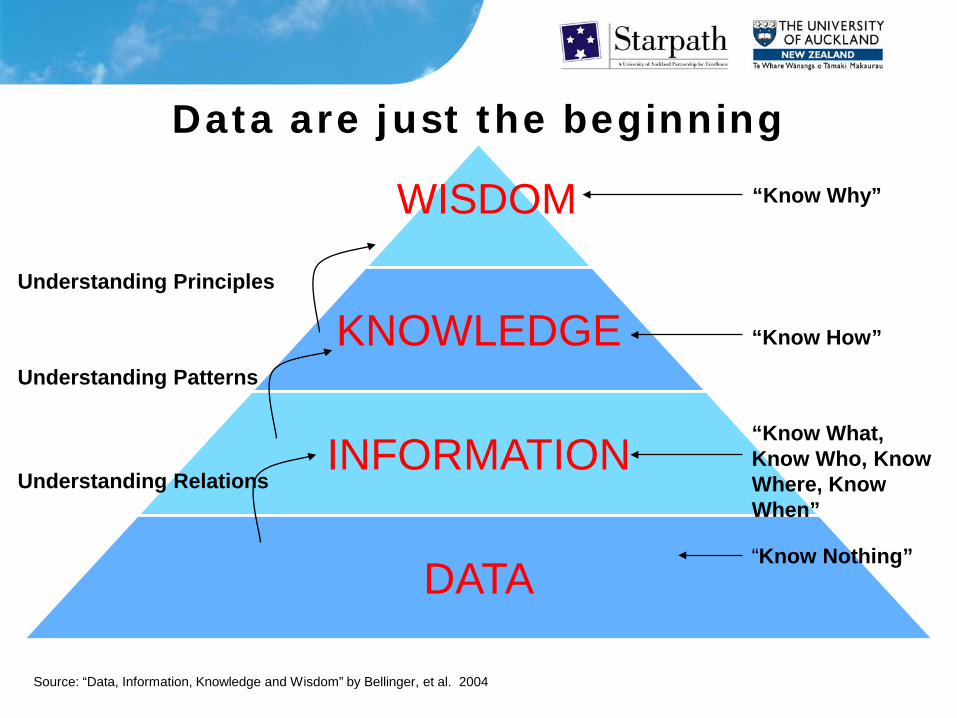
Data are just the beginning
KNOWLEDGE
INFORMATION
DATA
WISDOM
“Know What, Know Who, Know Where, Know When”
“Know Nothing”
“Know How”
“Know Why”
Understanding Relations
Understanding Patterns
Understanding Principles
Source: “Data, Information, Knowledge and Wisdom” by Bellinger, et al. 2004
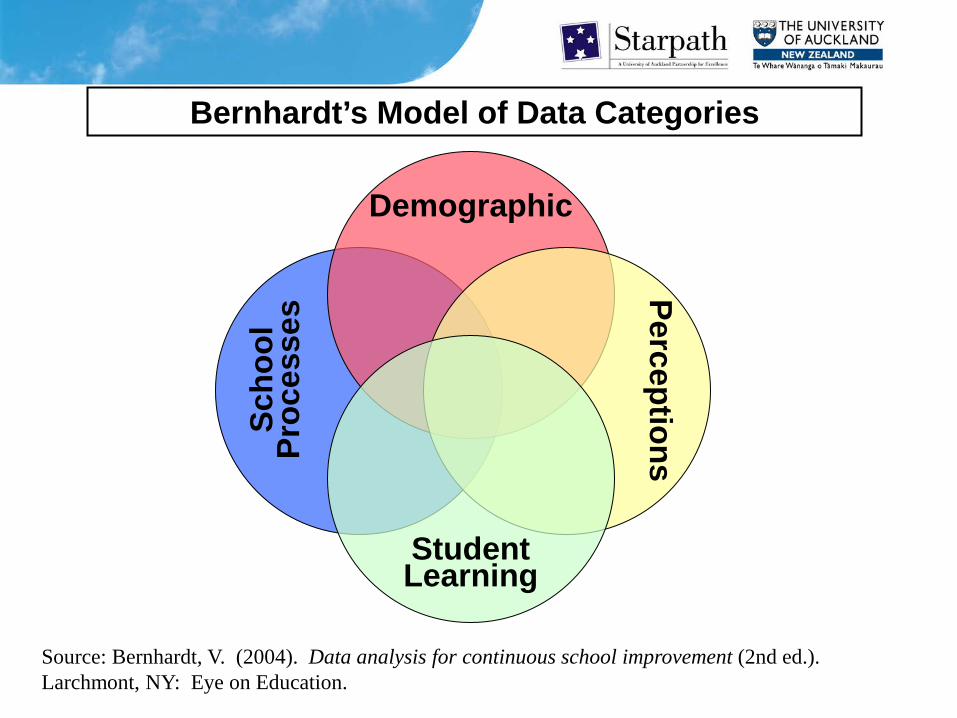
Bernhardt’s Model of Data Categories
Source: Bernhardt, V. (2004). Data analysis for continuous school improvement (2nd ed.). Larchmont, NY: Eye on Education.
Student Learning
Demographic
Perceptions Sc
hool
Pr
oces
ses
Student Learning
Demographic
Perceptions Sc
hool
Pr
oces
ses
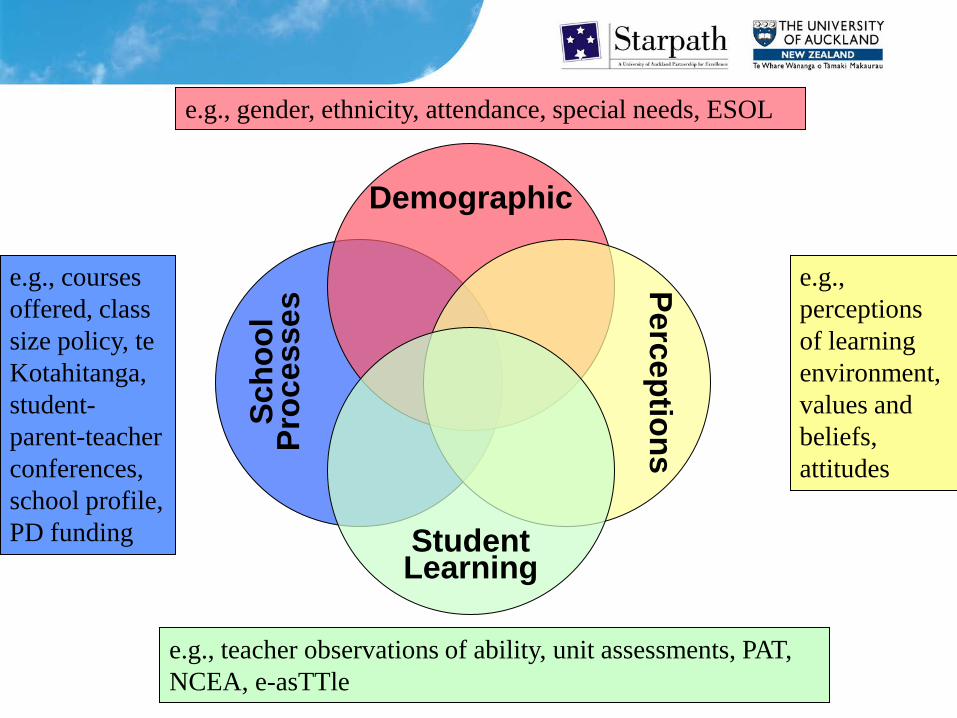
e.g., courses offered, class size policy, te Kotahitanga, student-parent-teacher conferences, school profile, PD funding
e.g., teacher observations of ability, unit assessments, PAT, NCEA, e-asTTle
e.g., perceptions of learning environment, values and beliefs, attitudes
e.g., gender, ethnicity, attendance, special needs, ESOL

Student Learning
Demographic
Perceptions
Scho
ol
Proc
esse
s
How many different groups do we have in this school?
One factor: Demographic

Student Learning
Demographic
Perceptions
Scho
ol
Proc
esse
s
Are different groups experiencing school differently?
Two factors: Demographic x Perceptions
Student Learning
Demographic
Perceptions
Scho
ol
Proc
esse
s
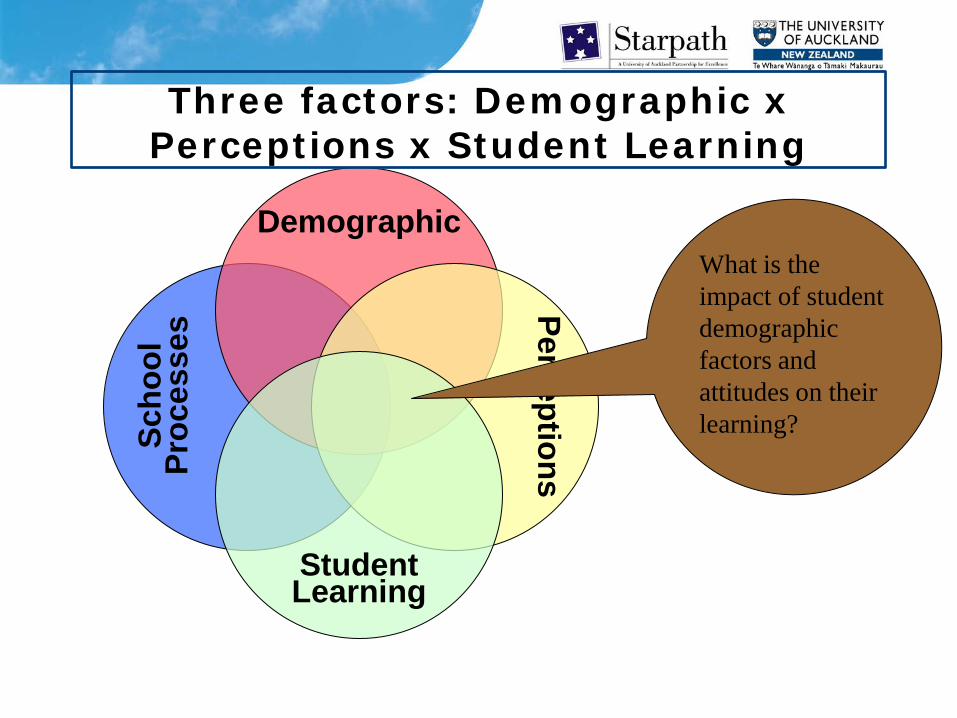
What is the impact of student demographic factors and attitudes on their learning?
Three factors: Demographic x Perceptions x Student Learning
Student Learning
Demographic
Perceptions
Scho
ol
Proc
esse
s
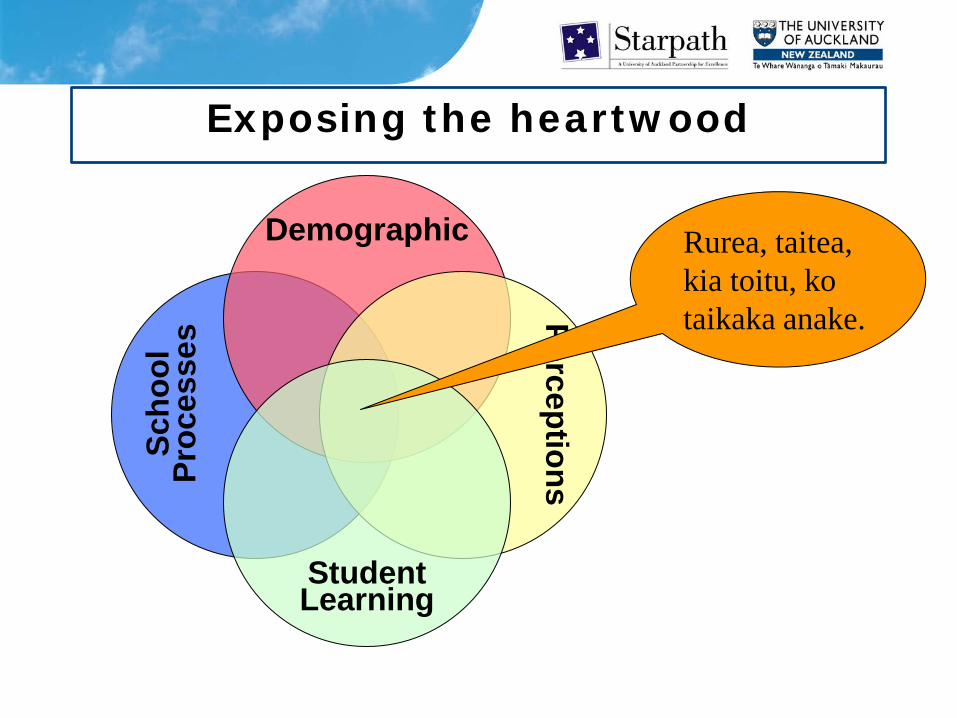
Rurea, taitea, kia toitu, ko taikaka anake.
Exposing the heartwood

The foundations for data use (Ronka, Geier & Marciniak, 2010)
Data
Quality Capacity Culture
Data Quality
High quality data requirements: • Systematic organisation • Use of multiple measures • Standardised and clean • Disaggregated (to the level of individual student)
• Currency

How data quality is most often compromised
Inconsistent or incorrect use of identification numbers (i.e., school ID or NSN) Missing, incorrect or duplicate values Incorrect assessment information Inconsistent data entry practices Lack of information about interventions or programmes GIGO – Garbage In, Garbage Out Source: Bernhardt (2007) Translating data into information to improve teaching and learning. p. 45
Data Capacity
Capacity requirements include: • Technology to support (e.g., SMS) • Accessibility of data • Formats that aid interpretation • Data and assessment literacy skills • Identification of skill gaps, followed by • Professional development

Data Culture
A Culture that fosters data use will include:
• Vision clearly articulated • Commitment to on-going improvement • Empowering of teachers, accompanied
with • Culture of collaboration, and • Accountability for results • Modelling by school leaders
High trust – earned and respected!
Data for Starpath
• Includes – ‘hard’ – ‘soft’ – quantifiable –qualitative
• Specific focus on ‘student achievement’

Data also need to be …
• Systematic • School-wide • Organised • Accessible • Timely • Credible • Disaggregated
But most importantly, data need to be …
USED

Data Use – there’s plenty of evidence!
• Data use leads to improvements in student learning (Armstrong & Anthes, 2001; Cawelti & Protheroe, 2001; LaRocque, 2007; Snipes, Doolittle & Herlihy, 2002;
Symonds, 2004; Tognieri & Anderson, 2003; Williams, Kirst, Haertel et al., 2005).
• Increased attention paid to data use also improves student learning (Heritage & Yeagley, 2005; Ikemoto & Marsh, 2007; Mandinach & Honey, 2008;
Wayman & Stringfield, 2006).
BUT
• Expansion of data gathering without a corresponding jump in data use does not improve student learning.
(Data Quality Campaign, 2006; Hamilton et al., 2009; Rothman, 2008).
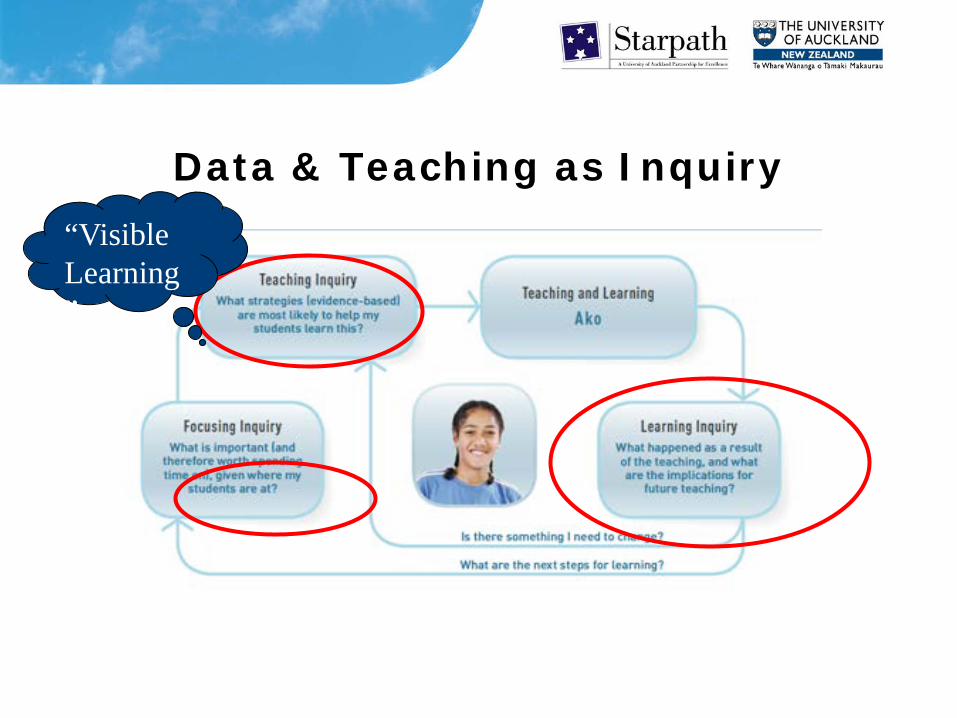
Data & Teaching as Inquiry “Visible Learning”

Data teams and school improvement
• Effective schools frequently monitor progress
• Schools need to be results focused and data driven
• Data teams need accurate data on what is happening at the school to make decisions
• Schools must have a systematic way of collecting, organizing, analyzing, and using data
• All staff must be collectors and interpreters of data
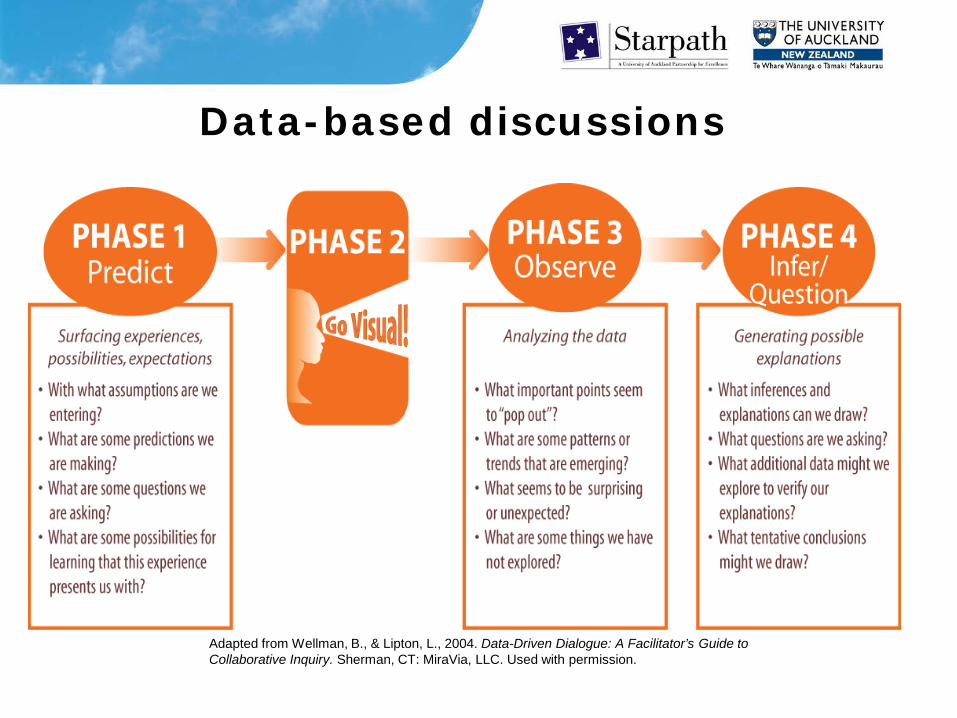
Data-based discussions
Adapted from Wellman, B., & Lipton, L., 2004. Data-Driven Dialogue: A Facilitator’s Guide to Collaborative Inquiry. Sherman, CT: MiraVia, LLC. Used with permission.

Building the Bridge Between Data and Results
Phase 2: Go Visual!

Getting the picture
Purposes: • Make handling dense data sets more
comprehensible • Treat the graphical aspects as critical
components of analysis • Provide interface for asking questions of
the data (data teams/PLCs), and forming/testing hypotheses
• Create explorers/inquirers, not statisticians

Scenario: Feb 2015, Y11 XXX class, and some Y9 & 10 data on them
Incomprehensible? Too dense?
HELP!! I’m out of here!!!!

Add a little colour (using conditional formatting in Excel)
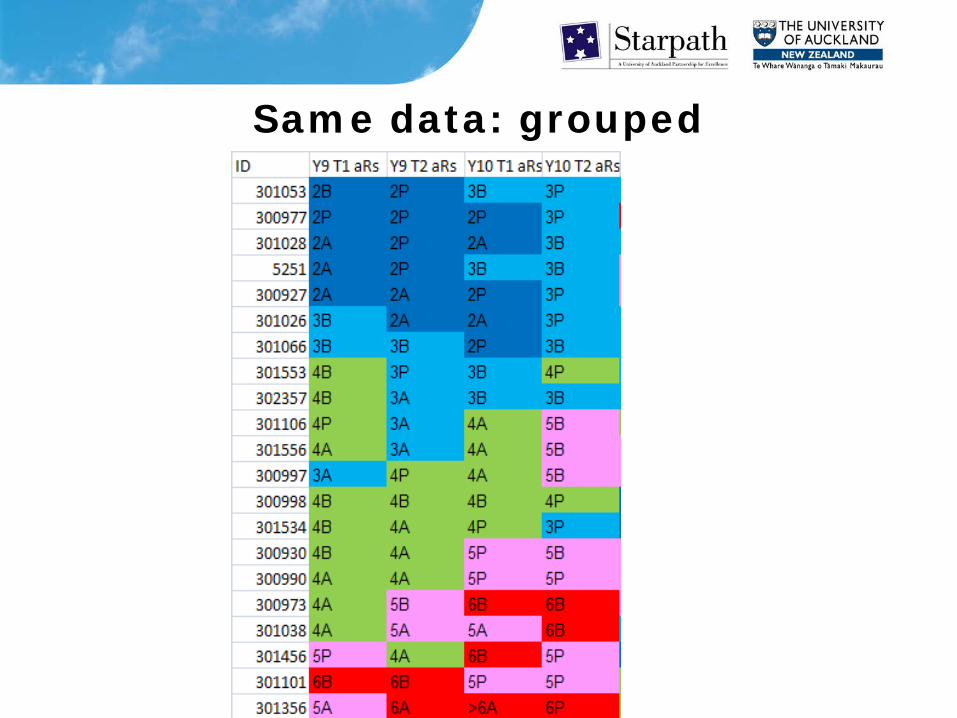
Same data: grouped
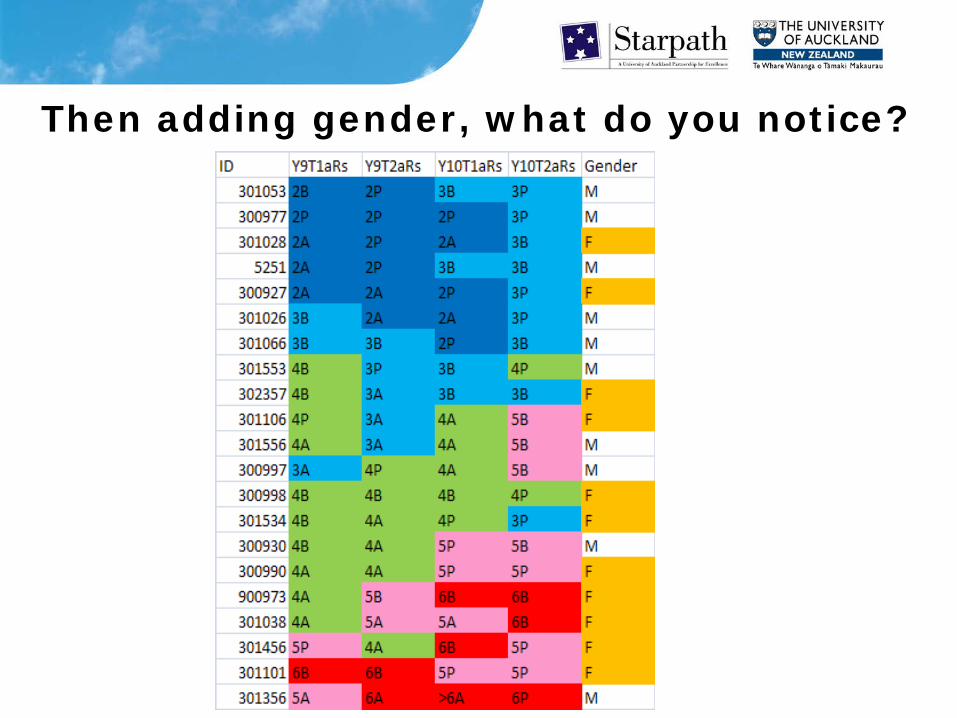
Then adding gender, what do you notice?
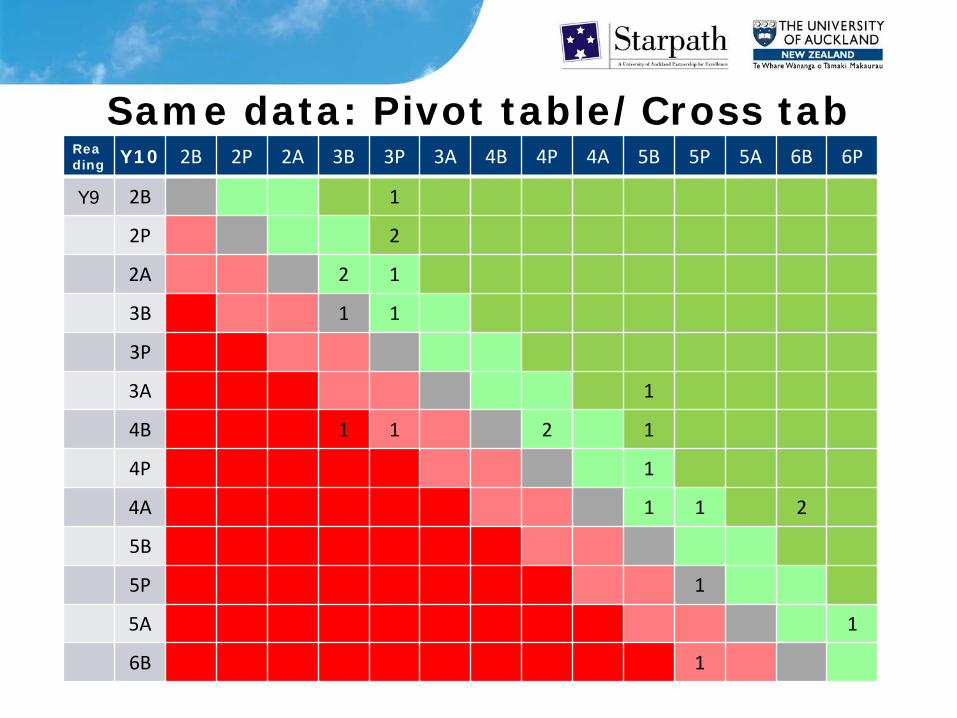
Same data: Pivot table/Cross tab Reading Y10 2B 2P 2A 3B 3P 3A 4B 4P 4A 5B 5P 5A 6B 6P
Y9 2B 1
2P 2
2A 2 1
3B 1 1
3P
3A 1
4B 1 1 2 1
4P 1
4A 1 1 2
5B
5P 1
5A 1
6B 1

Interlude - Tinkerplots
Dynamic software for visualising data … let your eyes do the walking! Close cousin = Fathom

L1 credits 2009 v L2 credits 2010

Traffic lights for Year 13
ID Opt A Opt B Opt C Opt D Opt E Opt F NCEA M E128363391 L3TRMTP L3STUZS L3VISHA L3ENGSL L3HOSCK L3MPAMH128363391 L3TRMTP 24 L3STUZS L3VISHA 16 L3ENGSL 17 L3HOSCK 30 L3MPAMH 87 10 6
128362803 L3DRXNT L3ARTDK L3VISHA L3MEDZE L3DRANT L3ENXEW128362803 L3DRXNT L3ARTDK 18 L3VISHA 26 L3MEDZE L3DRANT 24 L3ENXEW 21 89 24 13
123043247 L3STUZS L3ARTDK L3ECOJR L3ENGTA L3PEXWS L3MASCH123043247 L3STUZS L3ARTDK 18 L3ECOJR 9 L3ENGTA 7 L3PEXWS 17 L3MASCH 6 57 13
128362949 L3ENPWN L3MBTSS L3PEDWS L3AUTSU L3MAPGE L3MPAMH128362949 L3ENPWN 15 L3MBTSS 15 L3PEDWS 15 L3AUTSU 15 L3MAPGE 0 L3MPAMH 60 4
123044003 L3VISHA L3AUTSU L3SCPMB L3MASCH L3MECSS L3ENPWN123044003 L3VISHA 14 L3AUTSU 16 L3SCPMB 17 L3MASCH 6 L3MECSS 16 L3ENPWN 18 87
128365113 L3GTOZG L3GEOSC L3PEDWS L3ENGTA L3HOSCK L3MASCH128365113 L3GTOZG L3GEOSC 16 L3PEDWS 15 L3ENGTA 6 L3HOSCK 30 L3MASCH 6 73 15
Phase 3: Observe
• What important points seem to “pop out”?
• What patterns or trends are emerging?
• What is surprising or unexpected? • What questions do we have now? • How can we find out?

A Data Coach’s Guide to Improving Learning for All Students: Unleashing the Power of Collaborative Inquiry © 2008 by Corwin Press. All rights reserved.
Phase 4: Infer/Question
• What are some inferences we are drawing about these data?
• What are some implications to consider as we prepare to look at student-learning and to help manage student improvement?
• What students should we focus on?
Creating a ‘data culture’ in school
•Senior leaders must lead, and get … •Buy-in from all staff •Clear, concise and easy to understand
data and systems •Promoting confidence and understanding
in the use of data •Viewing data as a ‘friend’, not a ‘foe’
Creating a ‘data culture’ in school
•Whole school approach to data •Strategic vision linked to use of data in
the classroom •Placing students and student level data at
the centre of data and performance management systems
•Underpinned by a moral imperative that all children can succeed

Data Availability and Data Literacy
Ineffective
Embedded
Ignored
Dangerous
Low High Data Availability
Dat
a Li
tera
cy
Hig
h L
ow
The “right” question, or the “right” answer?
“Far better an approximate answer to the right question … than an exact answer to the wrong question.”
John W. Tukey Source: Tukey, J. W. (1962). The Future of Data Analysis. The Annals of
Mathematical Statistics, 33, 1, 1-67.

A good question … • Can be answered
• Meaningful/valuable
• Genuine • Researchable
• Can not be answered yes or no
Some good starter questions • What patterns can you see? • What do they tell you? • Which students and student groups in your school
are achieving well? • Are all students, including disadvantaged groups,
fulfilling their potential or should they achieve more?
• Do students who did well in NCEA Level 1, lose momentum and fail to make progress?
• Are the most disadvantaged students (e.g., those with SEN), making sufficiently rapid progress to catch up with their peers?
• Are the most able students stretched and challenged sufficiently?
• Are overall results at the end of NCEA Level 2 concealing poor progress?
45
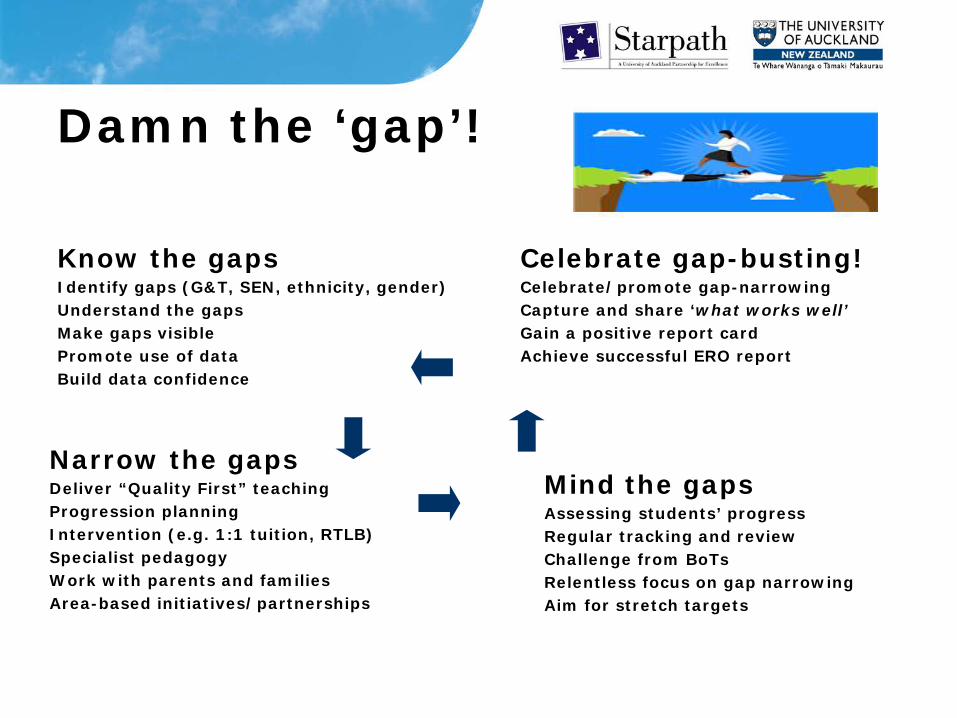
Damn the ‘gap’!
Know the gaps Identify gaps (G&T, SEN, ethnicity, gender) Understand the gaps Make gaps visible Promote use of data Build data confidence
Celebrate gap-busting! Celebrate/promote gap-narrowing Capture and share ‘what works well’ Gain a positive report card Achieve successful ERO report
Narrow the gaps Deliver “Quality First” teaching Progression planning Intervention (e.g. 1:1 tuition, RTLB) Specialist pedagogy Work with parents and families Area-based initiatives/partnerships
Mind the gaps Assessing students’ progress Regular tracking and review Challenge from BoTs Relentless focus on gap narrowing Aim for stretch targets
Barriers to building data culture/data use
• Lack of training in data use • Haphazard data collection • Lack of leadership • Outdated/poor technology • Unclear priorities and goals • Lack of teamwork • Distrust of data & its use
• So … we are there to …
How true do you think is this?
Why do we avoid data? The reason is fear— of data’s capacity to reveal strength and weakness, failure and success. Education seems to maintain a tacit bargain among constituents at every level not to gather or use information that will reveal a clear need for improvement: where we need to do better, where we need to make changes. Data almost always point to action— they are the enemy of comfortable routines. By ignoring data, we promote inaction and inefficiency.
(Schmoker, 1999, p. 39)

The concept of triangulation
NCEA analysis Other data
Professional Judgement Basis for action
Investigate Further
Check Accuracy Challenge Assumptions

Starpath commits to …
• helping teachers/schools improve • assisting with key tasks • collaborating in PD/training to
effectively implement DUACTS within school
• monitoring of progress • on-going research – to design a better
mousetrap!

What is expected of you?
Crouch… touch…set!

This means …
• Commitment to evidence based improvement • Implementation of programme & practices
(adapted to local circumstances if/where necessary) • Working with key personnel & in data teams
– inquiring mind – collegial nature, and most of all
• Engaging with meaningful up-to-date data • Get to know how to use your SMS So what’s this got to do with me? I teach …
Your role as a teacher … think about:
• Who uses the data that you enter (e.g., parents, students, board members, the principal, other teachers, payroll staff, the news media)?
• How do you use data to make important individual and group instructional decisions (e.g., progress toward curriculum standards, need for remediation and/or intervention)?
• What is the effect of the data you enter on students’ educational experiences?
• What is the impact of incomplete or inaccurate data?
• What can you do to increase the accuracy of data?

Your role as a teacher … things to do:
• Ask for and attend training on the use of data in the instructional programme
• Ask for appropriate instructions and documentation
• Do not be afraid to ask questions about your data responsibilities
• Identify barriers to effective data entry and communicate these to the principal or other appropriate personnel
• Respect the privacy and confidentiality of student data by protecting data from students and unauthorised personnel

Your role as a teacher (contd)
• Follow your school’s data security policies and procedures (e.g., change passwords frequently, do not share passwords, etc.)
• Enter data accurately and in a timely manner • Check your work for accuracy and
completeness • Ask for help if you make an error • Follow up on missed assessments • Share good ideas and best practices about
data entry with your peers • Check calendar for data reporting deadlines so
that you can allocate time for data entry
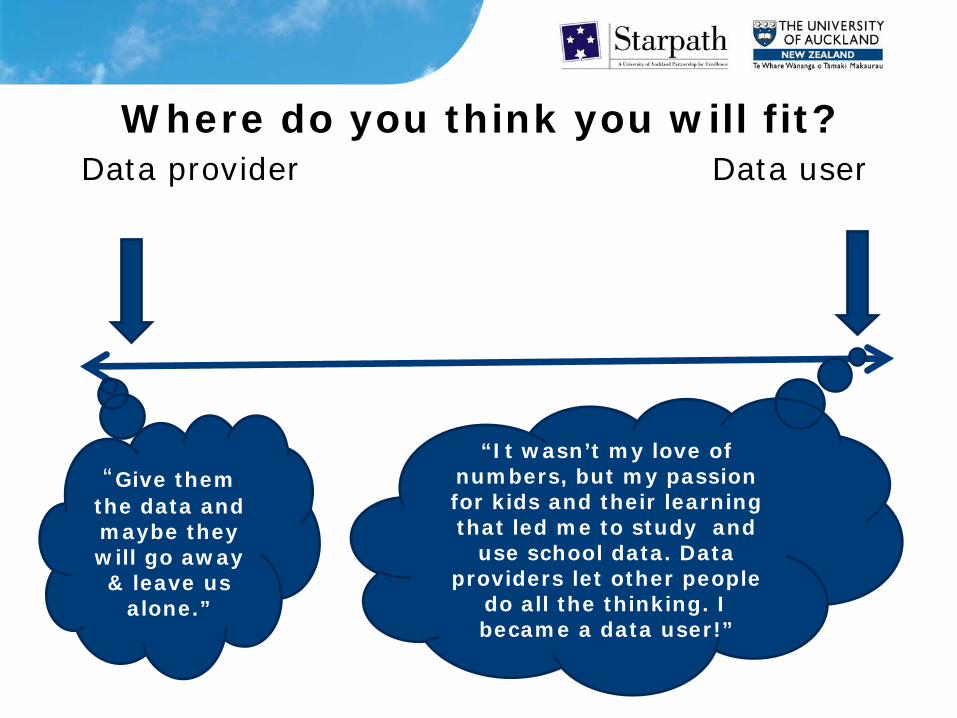
Where do you think you will fit? Data provider Data user
“Give them the data and maybe they will go away & leave us
alone.”
“It wasn’t my love of numbers, but my passion for kids and their learning that led me to study and
use school data. Data providers let other people
do all the thinking. I became a data user!”

“Every organization is perfectly designed to get the results it achieves.” --W. Edwards Deming
Let’s change the design!

Guide for Data Teams (Source: adapted from Sargent, 2003)
Eight steps for success. 1. Organise and set the context 2. Collect and organise the data 3. Analyse the data 4. Develop hypotheses 5. Develop improvement goals 6. Design specific strategies 7. Define evaluation criteria 8. Make the commitment to effect change

1. Organise and set the context With all sights on improving student achievement and maximizing learning for all students, the collection of data should be seen as a natural and essential process for the organization. This awareness and understanding can be achieved in several ways:
• Supervision and evaluation expectations that require evidence of student achievement to be collected and reported
• Professional development opportunities that train educators in the processes of assessment and the use of data as a basis for decision-making
• Putting systems in place to collect and manage the data • Continual reinforcement of data collection and use through district
practices and procedures • Ongoing communication of student and school performance data
2. Collect and organise the data Collecting data should be a planned, purposeful process. Not all data may be relevant so care needs to be taken in collecting that which will be helpful. Generally speaking, school data can be grouped into the four Bernhardt categories: • Student achievement - how well are the students
learning? • Demographic - who are students in the school? • Education programmes - who are the teachers in
this school and what is the curriculum? • Perceptions - how people feel about the school?
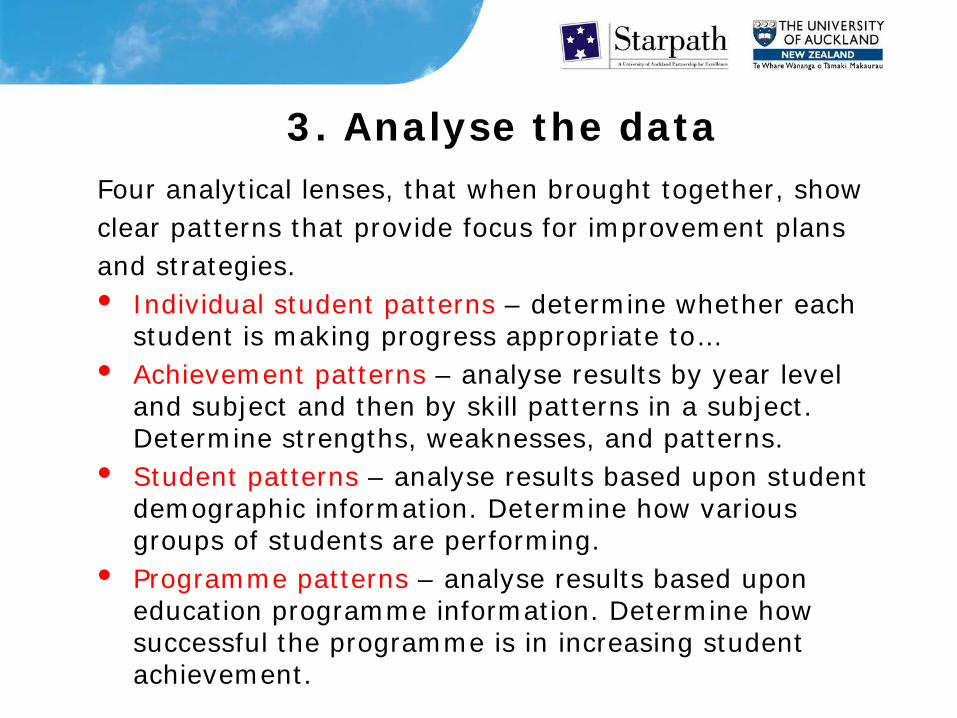
3. Analyse the data Four analytical lenses, that when brought together, show clear patterns that provide focus for improvement plans and strategies. • Individual student patterns – determine whether each
student is making progress appropriate to… • Achievement patterns – analyse results by year level
and subject and then by skill patterns in a subject. Determine strengths, weaknesses, and patterns.
• Student patterns – analyse results based upon student demographic information. Determine how various groups of students are performing.
• Programme patterns – analyse results based upon education programme information. Determine how successful the programme is in increasing student achievement.

4. Develop hypotheses The patterns that emerge through data analysis serve as the basis for formulating hypotheses that lead to an improvement plan. Developing hypotheses is the process of formulating questions that explain the data. This questioning process helps to search and find meaning in the data.All hypotheses should be expressed at this point – no holds barred! Again, high trust. Hypotheses then can be disputed if evidence can be shown that disproves an explanation. Many hypotheses usually are offered, but eventually the list is reduced into just a few of the most valid theories.

4. Develop hypotheses (example)
Sample hypothesis Evidence to contrary Our students are apathetic. They are turned off and just don't care enough to do their homework.
REJECT. We checked attendance, behavior and homework, and see no real pattern there with maths performance. These same students perform well in other subjects.
Our standards are just too high. The tests are too difficult, year by year.
REJECT. We looked at test results nationally and in neighboring schools. Maths performance is low nationally and locally, but our performance is particularly low comparatively. Also, we think the test items are fair for the year levels assessed.
Our math teachers in the junior classes have not had the proper training to teach the current maths curriculum.
ACCEPT AS A POSSIBILITY. We looked at their qualifications and training – these teachers do have appropriate qualifications, BUT when we looked at the record of PD activities, we found that very little maths PD has been provided for these teachers in 5 years.
Problem: Achievement levels in maths drop year by year and are at very low levels in Years 7, 8, 9 and 10. They pick up only slightly in Years 11 to 13.
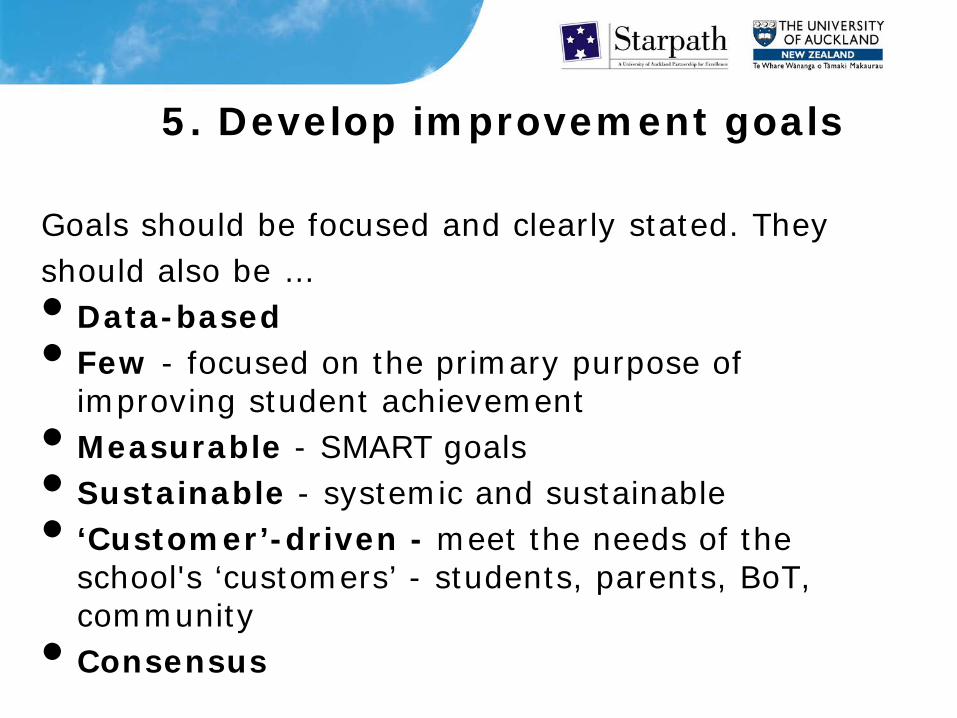
5. Develop improvement goals
Goals should be focused and clearly stated. They should also be … • Data-based • Few - focused on the primary purpose of
improving student achievement • Measurable - SMART goals • Sustainable - systemic and sustainable • ‘Customer’-driven - meet the needs of the
school's ‘customers’ - students, parents, BoT, community
• Consensus

6. Develop specific strategies
• For each goal, several strategies need to be designed. • Specific strategies can come naturally from
the hypotheses that were accepted as possibilities.
• For each strategy, give a specific timeline and identify a person responsible.
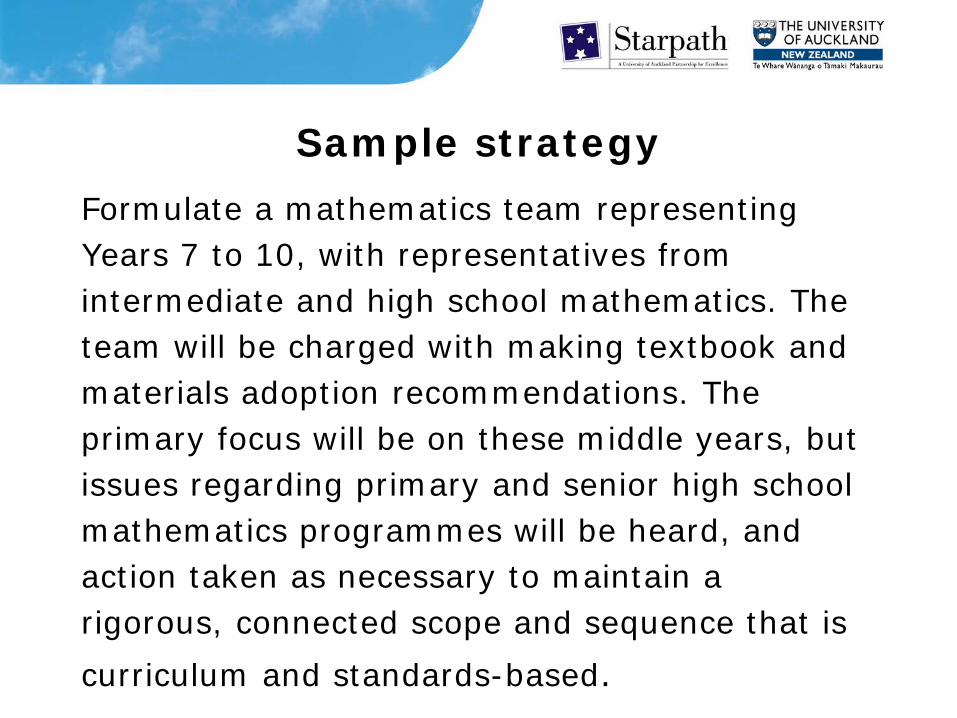
Sample strategy Formulate a mathematics team representing
Years 7 to 10, with representatives from intermediate and high school mathematics. The team will be charged with making textbook and materials adoption recommendations. The primary focus will be on these middle years, but issues regarding primary and senior high school mathematics programmes will be heard, and action taken as necessary to maintain a rigorous, connected scope and sequence that is curriculum and standards-based.

7. Define evaluation criteria
• Be prepared to evaluate the success of its improvement efforts – this aspect often gets “short-shrift”.
• Team members should discuss each strategy and identify the measures that will be used to examine to what degree the strategy was successful.
• Evaluation criteria may consist of test scores, attendance count, records of meetings held, actions accomplished, observations, survey tabulations, and a variety of other measures.

8. Make the commitment to effect change
An improvement plan on paper is just that - just a piece of paper. It's up to the school improvement team and others to make the commitment. Commitment can be demonstrated by: • signing the improvement plan. • BoT adopting the improvement plan. • building incentives into the plan once the goals are
reached e.g., a celebration, further PD. • professional development opportunities are provided
that are coordinated to the school's improvement goals. • scheduling regular/periodic meetings to discuss
progress and success.

Starpath’s cautionary tales
1. Use the SMS to store all achievement data. 2. Always use and retain the student’s unique
ID. 3. Adopt policy to use a consistent name for
each student in all files. 4. Store all original data files in a data archive
file. 5. Check data for integrity. 6. Avoid missing data. 7. Changing the school’s SMS is a time for
carefully planned change management.