Mutual Fund Review - ICICI Directcontent.icicidirect.com/mailimages/IDirect_MonthlyMF...Mutual Fund...
24
Mutual Fund Review November 19, 2009 | Mutual Fund Mutual Fund Review March 22, 2016
Transcript of Mutual Fund Review - ICICI Directcontent.icicidirect.com/mailimages/IDirect_MonthlyMF...Mutual Fund...

Mutual FundReview
October 20 2009 | Mutual Fund October 20 2009 | Mutual Fund October 20 2009 | Mutual Fund
November 19, 2009 | Mutual Fund Mutual Fund Review
March 22, 2016

ICICI Securities Ltd. | Retail MF Research
Note: Whenever, returns for the scheme are shown in the report, they are for the growth option of the scheme.
Mutual Fund Review
Equity Markets ....................................................................................... 2 Debt Markets.......................................................................................... 2 MF industry synopsis ............................................................................ 3 MF Category Analysis............................................................................ 3 Equity funds......................................................................................... 3 Equity diversified funds....................................................................... 3 Equity Infrastructure fund.................................................................... 3 Equity Banking Funds.......................................................................... 3 Equity FMCG........................................................................................ 3 Equity Pharma Funds .......................................................................... 3 Equity Technology Funds.................................................................... 3
Exchange Traded Funds (ETF) ......................................................... 3
Balanced funds ................................................................................. 3
Monthly Income Plans (MIP) ............................................................ 3
Arbitrage Funds ................................................................................ 3
Debt funds ........................................................................................ 3 Liquid Funds ........................................................................................ 3 Income funds....................................................................................... 3 Gilt Funds .......................................................................................... 3 Gold ETFs: Medium term outlook benign............Error! Bookmark not
defined. Model Portfolios .................................................................................... 3
Equity funds model portfolio............................................................ 3 Debt funds model portfolio .............................................................. 3
Top Picks................................................................................................ 3
March 22, 2016

ICICI Securities Ltd. | Retail MF Research
Page 2
Equity Markets Update
After witnessing selling pressure since start of 2016 and correcting around 12% in first two months before the Union Budget, Indian equity markets rebounded sharply post Budget and recouped almost all losses
Positive global markets, a recovery in global commodity prices including crude oil, no major negative announcement in the Budget with respect to taxing long term capital gains and value buying at lower levels were major factors behind the sharp recovery from lower levels
The silver lining in the Budget was that the fiscal deficit target of 3.9% was met and target of 3.5% has been maintained for FY17. This raises expectations of a rate cut from the RBI
The Union Budget continues to focus on fixing the economy through small/incremental steps in several areas (rural, financial, infra) without getting swayed by markets. A shift in focus towards rural sector was visible but we perceive it as a long-term economic/political strategy. Fiscal consolidation continues as per projected plan and monetary authorities will surely take notice. Spending on roads, railways and irrigation is welcome but crucially depends on meeting telecom and disinvestment targets. However, earnings downgrades are likely in a few sectors, with markets anchoring to a shift in monetary policy
The Budget focuses on good ‘governance’ through process reforms and usage of technology. Rationalising human resource in government departments will achieve higher productivity. Effective implementation of Aadhaar framework is targeted for delivery of financial and other subsidies. Also, implementing DBT for fertilisers subsidy is on a pilot
Outlook
The lower subsidy amount through higher usage of direct benefit transfer scheme, ease of doing business, administrative reforms in tax department and maintaining fiscal discipline are likely to have a long term positive impact on the economy
The strong up move post Budget triggered a bullish structural turnaround as the index has posted a faster retracement of its last falling segment for the first time since last year. The ferocious pace and extending magnitude of rally confirms the bias has turned positive
Global commodity prices have rebounded from multi-year lows and seem to have stabilised. Global equity markets have also stabilised after remaining under pressure in recent months. Market participants who were focusing on global developments and news flows are expected to shift their focus to domestic macro variable. The government had passed key structural reform bills in the budget session so far like Aadhaar Bill, Real Estate Bill and Motor Vehicles Bill. Apart from many other measures announced in the Budget, these are expected to provide long term benefits to the economy
The sharp up move from recent lows has again substantiated the value buying strategy of buying at sharp market correction when sentiments are weak. Long term investors who increased allocation when the market corrected benefited from the recovery. Increasing allocation during market fall without getting swayed by weak sentiments remains an ideal investment strategy
In the immediate near tear, markets may consolidate, especially after the sharp rally post Budget. Investors should follow the buy on dips investment strategy
CNX Nifty: Market rebounded sharply regaining its losses for the year post budget
6500
7000
7500
8000
8500
9000
Mar
-15
Apr-1
5
May
-15
Jun-
15
Jul-1
5
Aug-
15
Sep-
15
Oct-1
5
Nov
-15
Dec-
15
Jan-
16
Feb-
16
Mar
-16
Source: Bloomberg, ICICIdirect.com Research
Market breadth turns positive in last month…
4.5 5.0 5.5 5.
5
5.8
0.0
2.0
4.0
6.0
BSESmall Cap
BSEMidcap
BSE 500 BSESensex
BSE 100
Retu
rn (%
)
Source: Bloomberg, ICICIdirect.com Research Returns : February 18, 2016– March 18, 2016
Consumer durables, healthcare deliver negative returns while Banking sector recover
-2.5 -1.3
4.5
4.8
4.9 5.1 5.
3
5.5 5.9 8.
3 9.7
10.1
-5-2147
1013
Con.
Dura
Heal
thca
re
Cap.
Good
s
PSU IT
Auto
FMCG
Sens
ex
Oil &
Gas
Met
al
Real
ity
Bank
ing
Retu
rn (%
)
Source: Bloomberg, ICICIdirect.com Research Returns : February 18, 2016– March 18, 2016
Research Analyst
Sachin Jain [email protected]
Isha Bansal [email protected]
ICICI Securities Ltd. | Retail MF Research
Page 3
Debt Markets Update
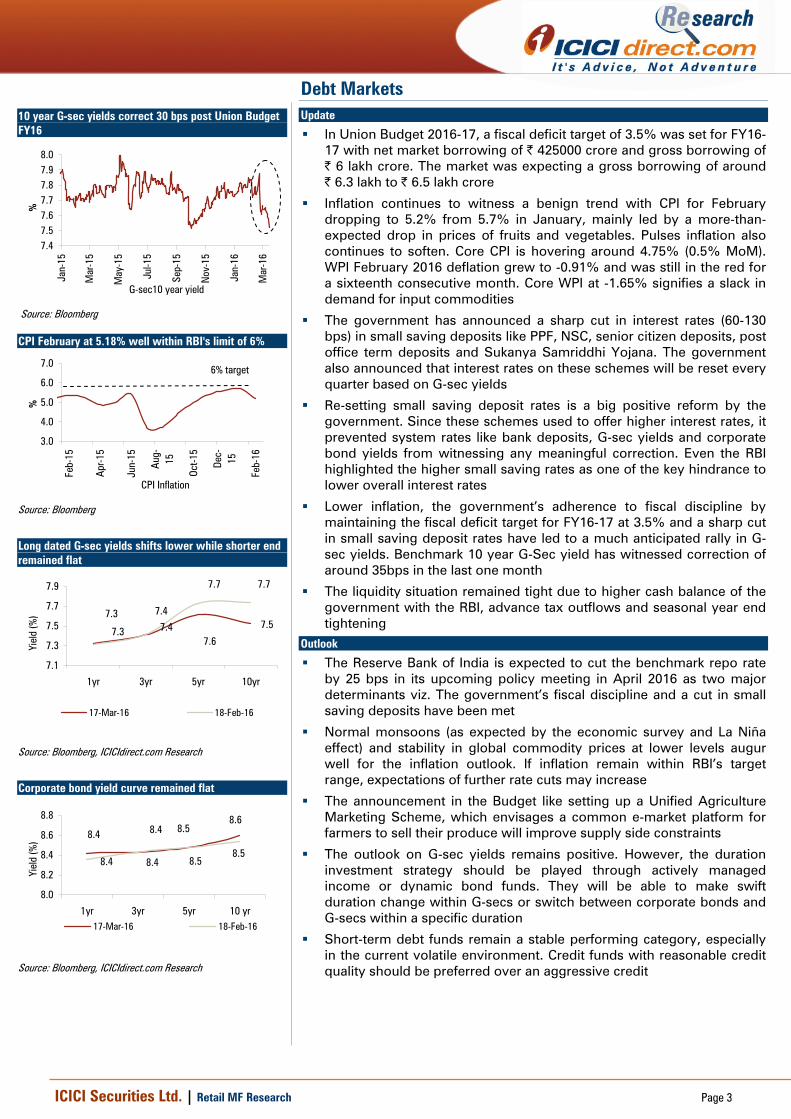
In Union Budget 2016-17, a fiscal deficit target of 3.5% was set for FY16-17 with net market borrowing of | 425000 crore and gross borrowing of | 6 lakh crore. The market was expecting a gross borrowing of around | 6.3 lakh to | 6.5 lakh crore
Inflation continues to witness a benign trend with CPI for February dropping to 5.2% from 5.7% in January, mainly led by a more-than-expected drop in prices of fruits and vegetables. Pulses inflation also continues to soften. Core CPI is hovering around 4.75% (0.5% MoM). WPI February 2016 deflation grew to -0.91% and was still in the red for a sixteenth consecutive month. Core WPI at -1.65% signifies a slack in demand for input commodities
The government has announced a sharp cut in interest rates (60-130 bps) in small saving deposits like PPF, NSC, senior citizen deposits, post office term deposits and Sukanya Samriddhi Yojana. The government also announced that interest rates on these schemes will be reset every quarter based on G-sec yields
Re-setting small saving deposit rates is a big positive reform by the government. Since these schemes used to offer higher interest rates, it prevented system rates like bank deposits, G-sec yields and corporate bond yields from witnessing any meaningful correction. Even the RBI highlighted the higher small saving rates as one of the key hindrance to lower overall interest rates
Lower inflation, the government’s adherence to fiscal discipline by maintaining the fiscal deficit target for FY16-17 at 3.5% and a sharp cut in small saving deposit rates have led to a much anticipated rally in G-sec yields. Benchmark 10 year G-Sec yield has witnessed correction of around 35bps in the last one month
The liquidity situation remained tight due to higher cash balance of the government with the RBI, advance tax outflows and seasonal year end tightening
Outlook
The Reserve Bank of India is expected to cut the benchmark repo rate by 25 bps in its upcoming policy meeting in April 2016 as two major determinants viz. The government’s fiscal discipline and a cut in small saving deposits have been met
Normal monsoons (as expected by the economic survey and La Niña effect) and stability in global commodity prices at lower levels augur well for the inflation outlook. If inflation remain within RBI’s target range, expectations of further rate cuts may increase
The announcement in the Budget like setting up a Unified Agriculture Marketing Scheme, which envisages a common e-market platform for farmers to sell their produce will improve supply side constraints
The outlook on G-sec yields remains positive. However, the duration investment strategy should be played through actively managed income or dynamic bond funds. They will be able to make swift duration change within G-secs or switch between corporate bonds and G-secs within a specific duration
Short-term debt funds remain a stable performing category, especially in the current volatile environment. Credit funds with reasonable credit quality should be preferred over an aggressive credit
10 year G-sec yields correct 30 bps post Union Budget FY16
7.47.57.67.77.87.98.0
Jan-
15
Mar
-15
May
-15
Jul-1
5
Sep-
15
Nov
-15
Jan-
16
Mar
-16
G-sec10 year yield
%
Source: Bloomberg
CPI February at 5.18% well within RBI's limit of 6%
3.0
4.0
5.0
6.0
7.0
Feb-
15
Apr-1
5
Jun-
15
Aug-
15
Oct-1
5
Dec-
15
Feb-
16
CPI Inflation
%
6% target
Source: Bloomberg
Long dated G-sec yields shifts lower while shorter end remained flat
7.3 7.47.6
7.57.3 7.4
7.7 7.7
7.1
7.3
7.5
7.7
7.9
1yr 3yr 5yr 10yr
Yiel
d (%
)
17-Mar-16 18-Feb-16
Source: Bloomberg, ICICIdirect.com Research
Corporate bond yield curve remained flat
8.4 8.4 8.58.6
8.4 8.4 8.58.5
8.0
8.2
8.4
8.6
8.8
1yr 3yr 5yr 10 yr
Yiel
d (%
)
17-Mar-16 18-Feb-16
Source: Bloomberg, ICICIdirect.com Research
ICICI Securities Ltd. | Retail MF Research
Page 4
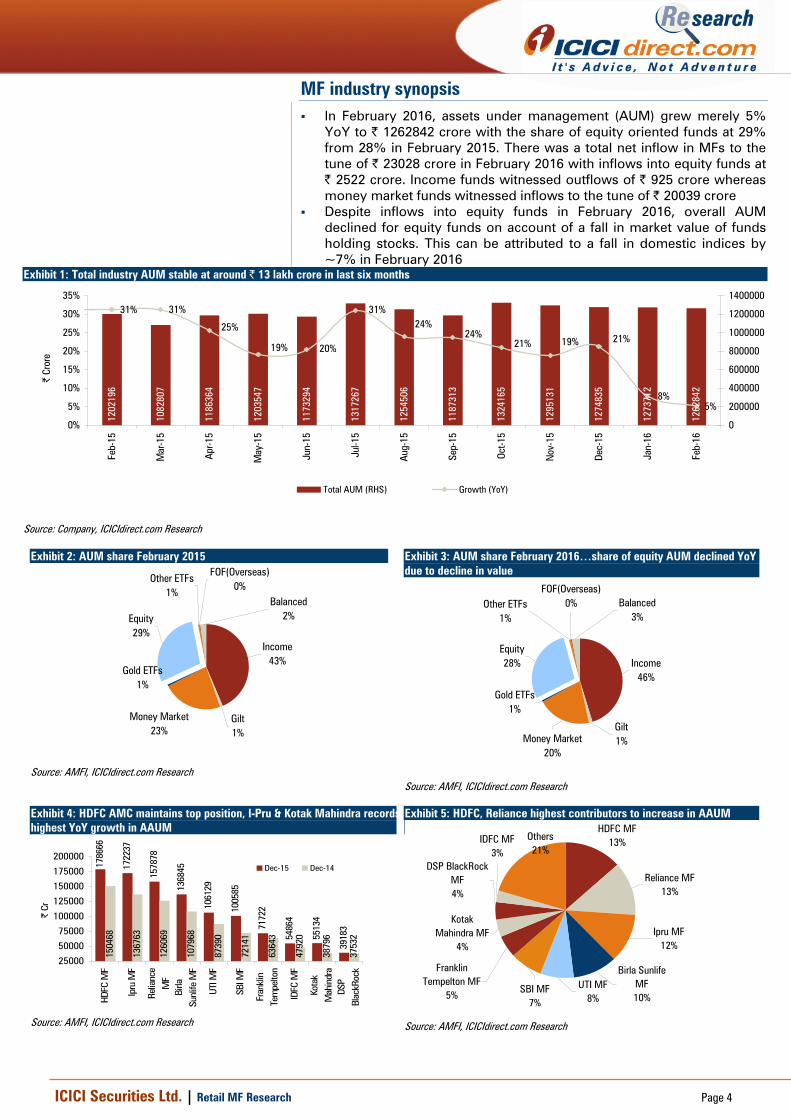
MF industry synopsis In February 2016, assets under management (AUM) grew merely 5%
YoY to | 1262842 crore with the share of equity oriented funds at 29% from 28% in February 2015. There was a total net inflow in MFs to the tune of | 23028 crore in February 2016 with inflows into equity funds at | 2522 crore. Income funds witnessed outflows of | 925 crore whereas money market funds witnessed inflows to the tune of | 20039 crore
Despite inflows into equity funds in February 2016, overall AUM declined for equity funds on account of a fall in market value of funds holding stocks. This can be attributed to a fall in domestic indices by ~7% in February 2016
Exhibit 1: Total industry AUM stable at around | 13 lakh crore in last six months
1202
196
1082
807
1186
364
1203
547
1173
294
1254
506
1324
165
1273
712
1262
842
1274
835
1295
131
1187
313
1317
267
31% 31%
5%8%
21%19%21%24%
24%31%
20%19%
25%
0%
5%
10%
15%
20%
25%
30%
35%
Feb-
15
Mar
-15
Apr-1
5
May
-15
Jun-
15
Jul-1
5
Aug-
15
Sep-
15
Oct-1
5
Nov
-15
Dec-
15
Jan-
16
Feb-
16
| Cr
ore
0
200000
400000
600000
800000
1000000
1200000
1400000
Total AUM (RHS) Growth (YoY)
Source: Company, ICICIdirect.com Research
Exhibit 2: AUM share February 2015
Income43%
Gilt1%
Money Market23%
Gold ETFs 1%
Equity29%
Other ETFs1%
FOF(Overseas)0%
Balanced2%
Source: AMFI, ICICIdirect.com Research
Exhibit 3: AUM share February 2016…share of equity AUM declined YoY due to decline in value
Income46%
Gilt1%Money Market
20%
Gold ETFs 1%
Equity28%
Other ETFs1%
FOF(Overseas)0% Balanced
3%
Source: AMFI, ICICIdirect.com Research
Exhibit 4: HDFC AMC maintains top position, I-Pru & Kotak Mahindra records highest YoY growth in AAUM
1786
66
1722
37
1578
78
1368
45
1061
29
1005
85
7172
2
5486
4
5513
4
3918
3
1504
68
1367
63
1260
69
1079
68
8739
0
7214
1
6364
3
4792
0
3879
6
3753
2
25000
50000
75000
100000
125000
150000
175000
200000
HDFC
MF
Ipru
MF
Relia
nce
MF
Birla
Sunl
ife M
F
UTI M
F
SBI M
F
Fran
klin
Tem
pelto
n
IDFC
MF
Kota
kM
ahin
dra
DSP
Blac
kRoc
k
| Cr
Dec-15 Dec-14
Source: AMFI, ICICIdirect.com Research
Exhibit 5: HDFC, Reliance highest contributors to increase in AAUM HDFC MF
13%
Reliance MF13%
Ipru MF12%
Birla Sunlife MF10%
UTI MF8%
SBI MF7%
Franklin Tempelton MF
5%
Kotak Mahindra MF
4%
DSP BlackRock MF4%
IDFC MF3%
Others21%
Source: AMFI, ICICIdirect.com Research

ICICI Securities Ltd. | Retail MF Research
Page 5
MF Category Analysis
Equity funds Midcap and large cap funds witnessed a decline in their returns with the
category average return of one year mid cap funds delivering -7.8% and large cap funds delivering -11.8% returns
Among sector funds, all funds delivered negative returns with IT and FMCG outperforming the other sectoral yearly returns
Exhibit 6: IT, FMCG clear winners (returns as on March 18, 2016)
-2.2
-2.9
-6.6
-7.8
-10.
2
-11.
8
-14.
5
19.9
13.4
26.9
25.7
16.6
12.8
13.4
6.6
14.1
19.9 22
.1
18.5
11.9
9.6
5.6
5.0
-18.
9
-30
-20
-10
0
10
20
30
Technology FMCG Pharma Mid cap Diversified Large Cap Infrastructure Banking
Retu
rns
(%)
1 year 3 Year 5 year
Source: Crisil Fund Analyser, ICICIdirect.com Research ; Returns over one year are compounded annualised returns
Exhibit 7: Inflow into equity funds remains moderate
66516324 5444
2914
6269
25225840
8481 1058410076 12273
6133
9156 6379
3644
-4500-2500-50015003500550075009500
1150013500
Dec-
14
Jan-
15
Feb-
15
Mar
-15
Apr-1
5
May
-15
Jun-
15
Jul-1
5
Aug-
15
Sep-
15
Oct-1
5
Nov
-15
Dec-
15
Jan-
16
Feb-
16
Net
Inflo
w (
| Cr
)
Net inflow (Equity + ELSS)
Source: AMFI, ICICIdirect.com Research
Exhibit 8: Equity AUM at moderate levels...due to decline in market value
3194
78
3409
36
3457
39
3451
39
3451
29
3651
66
3723
13
3936
02
3817
23
3865
17
3967
65
4026
71
4056
62
3843
50
3546
42
150000200000250000300000350000400000450000
Dec-
14
Jan-
15
Feb-
15
Mar
-15
Apr-1
5
May
-15
Jun-
15
Jul-1
5
Aug-
15
Sep-
15
Oct-1
5
Nov
-15
Dec-
15
Jan-
16
Feb-
16
| la
kh C
rore
Equity +ELSS
Source: AMFI, ICICIdirect.com Research
Exhibit 9: Deployment of equity funds
Allocation Banks Software Pharma Auto FinanceConsumer
Non-Durables
Petroleum ConstructionIndustrial
Capital Goods
Industrial Products
| crore 78644 43115 33785 26653 23131 22526 19678 15577 15,322 14566
% of total 19.2 10.6 8.3 6.5 5.7 5.5 4.8 3.8 3.8 3.6
Source: Sebi, ICICIdirect.com Research, Sector Classification (as per Amfi)
There was inflow of | 2522 crore into equity funds in
February 2016 but the equity AUM declined by | 29708
crore. This was mainly led by decline in market value
Exposure to banks and finance stocks together account for
the highest proportion with 25% of equity assets followed
by technology and pharma

ICICI Securities Ltd. | Retail MF Research
Page 6
Equity diversified funds
Equity diversified funds witnessed a sharp fall of 10.2% last year. Midcap funds were outperformers falling only 7.8% during last year whereas large caps funds dropped 11.8% against the BSE Sensex return of -19% as on March 18, 2016
After witnessing selling pressure since the start of 2016 and correcting around 12% in first two months before the Union Budget, Indian equity markets rebounded sharply post Budget and recouped almost all losses
Positive global markets, a recovery in global commodity prices including crude oil, no major negative announcement in Budget with respect to taxing long term capital gains and value buying at lower levels were major factors behind the sharp recovery from lower levels
The silver lining in the Budget was that the fiscal deficit target of 3.9% was met and target of 3.5% has been maintained for FY17. This raises expectations of a rate cut from the RBI
The Union Budget continues to focus on fixing the economy through small/incremental steps in several areas (rural, financial, infra) without getting swayed by markets. A shift in focus towards the rural sector was visible but we perceive it as a long-term economic/political strategy. Fiscal consolidation continues as per projected plan and monetary authorities will surely take notice. Spending on roads, railways and irrigation is welcome but crucially depends on meeting telecom and disinvestment targets. However, earnings downgrades are likely in a few sectors, with markets anchoring to a shift in monetary policy
In the immediate near tear, markets may consolidate especially after the sharp rally post budget. Investors should follow a buy on dips investment strategy
Recommended funds Large cap
Birla Sunlife Frontline Equity ICICI Prudential Focused Bluechip Equity SBI Bluechip
Diversified
Franklin India Prima Plus Fund Reliance Equity Opportunities ICICI Prudential Value Discovery Fund
Midcap
HDFC Mid-Cap Opportunities Fund Franklin India Smaller Companies Fund SBI Magnum Global Fund
(Refer to www.icicidirect.com for details of the fund)
View Short term: Positive Long-term: Positive

ICICI Securities Ltd. | Retail MF Research
Page 7
Equity Infrastructure fund The investment cycle, which has been reeling under pressure for the
last few years, has started showing sign of green shoots as the government is focusing on infrastructure development (accounts for ~60% of planned investment vs. ~50% few years back). Furthermore, instances of stalled projects in the government vertical have come down sharply whereas the private sector is still seeing a slow recovery in stalled projects
We have also analysed the pattern of tendering in the last 18 months, which further validates that the government is reviving the investment cycle as the government accounts for ~99% of total tenders floated
In terms of segments, road, railways, water and power T&D lead the recovery, which will continue, going ahead, into FY17E as well. Out of total tenders floated during April, 2015 -January, 2016, the share of the above segments comprised 61.4% of the overall tendering activity
Going ahead, while we believe there would be opportunities in infrastructure, we remain selectively positive on the sector
Preferred Picks
Franklin Build India Fund L&T Infrastructure Fund ICICI Prudential Infrastructure Fund
Refer www.icicidirect.com for
details of the fund
View Short-term: Positive Long-term: Positive

ICICI Securities Ltd. | Retail MF Research
Page 8
Equity Banking Funds FY16 has been a tough year for banks with significant addition to NPAs,
SDR and 5/25 cases resulting from troubled corporate in infra, metals, textile and power
PSU banks saw 51% YoY surge in GNPA to | 390443 crore, leading to provisions doubling QoQ to | 43158 crore. PSBs reported a first loss after several years in bottomline at | 11003 crore for Q3. With lower credit growth remaining a hindrance (PSU- 8.8% YoY) and pressure of NPA still hovering around led by RBI’s asset quality review, we do not believe banks will see any near term improvement either in balance sheet or profitability. Capital raising will add further pressure as barring top banks most need capital in the near term. We are cautious on PSU banks for the next two or three quarters
Though private banks, on the other hand, reported a profit of | 11364 crore in Q3FY16, still asset quality pain remained significant for them also. Private banks also saw higher stress with 46% GNPA surge to | 45577 crore and 66% NNPA surge to | 20349 crore. Strong topline growth enabled a better performance in private banks. Corporate exposure in pain sectors of large private banks will hurt them warranting higher provisions. However, better capital position will safeguard near term balance sheet as well as P/L concerns on RoE and RoA. We expect private banks to continue to outperform but sticking to quality large caps is recommended
We continue to maintain our underperform stance on the sector. Preferred Picks
ICICI Prudential Banking & Financial Services Reliance Banking Fund UTI Thematic - Banking Sector Fund
Refer to www.icicidirect.com for
details of the fund
Equity FMCG Our FMCG coverage universe is expected to witness ~12.6% revenue
growth as volume growth continues to remain lacklustre mainly due to slower urban recovery and subdued rural demand on the back of falling agri output and minimal increase in MSPs. Simultaneously, falling commodity prices could lead to aggressive price cuts or increase in promotion activity
With commodity prices falling sharply, RM cost (percentage of sales) for
our coverage universe is expected to fall 100-200 bps. However, we believe companies would increase promotional spends significantly to spur volume growth. This is expected to lead to a marginal increase in operating margins. Our FMCG coverage universe is expected to witness 16.3% increase in net profit led by an expected reduction in the corporate income tax rate in Budget 2016
We expect GST implementation to lead to a reduction in logistic cost, a
simplified tax structure and level playing field for organised players in categories dominated by highly unorganised entities
Preferred Picks
ICICI Prudential FMCG Fund SBI FMCG Fund
Refer www.icicidirect.com
for details of the fund
View Short-term: Negative Long-term: Neutral
View Short-term: Neutral Long-term: Neutral

ICICI Securities Ltd. | Retail MF Research
Page 9
Equity pharma funds We expect pharma universe revenue, EBITDA and PAT to grow at a
CAGR of 15.5%, 16.6% and 19.9% respectively, in FY16-18E
Compliance issues and currency volatility in emerging markets are likely to be mitigated by acceleration in US approvals (148 ANDAs in CY15 against 105 in CY14) (expect to grow at a CAGR of 19.4% over FY16-18E). Domestic market growth in the near term is expected to be under pressure due to triple whammy impact of combination ban, expansion of NLEM list and negative price hike for NLEM products in sync with negative WPI
We continue to maintain our positive view on the sector on the back of earning visibility, consistent operating cash flows, healthy operating margins, relatively low leverage and strong return ratios
Preferred Picks
Reliance Pharma Fund SBI Pharma Fund UTI-Pharma & Healthcare
Refer to www.icicidirect.com
for details of the fund
Equity Technology Funds
• Tier-I IT companies reported average 0.5% QoQ dollar revenue growth in Q3FY16 (in line with estimates) vs. 2.9% in Q2FY16 and 1.2% decline in Q4FY15. Constant currency revenues grew 1.3% as dollar growth was negatively impacted (~80 bps) by cross currency headwinds. Infosys reported a stellar revenue beat, HCLT, Wipro were okay while TCS was soft led by company specific reasons. Impact of Chennai floods and business continuity costs were key margin headwinds partially offset by currency tailwinds and operational efficiency. CY16E IT budgets could be flat to negative, while earnings commentary was stable led by healthy deal signings and traction in digital technologies
• Operationally, discretionary spending remains healthy in the US and led growth while Europe rebounded modestly. Insurance, telecom and oil & gas verticals are structurally challenged and growth continues to be uneven
• The average rupee has depreciated 6% during 9MFY16 and could aid margins leading to earnings upgrade in FY17E. Upsides could be in line with earnings upgrades given blended valuations are at ~15x FY17E earnings. However, sharp sell-offs should be used to accumulate given long-term growth prospects
Preferred Picks
ICICI Prudential Technology Fund DSPBR Technology fund
Refer to www.icicidirect.com for
details of the fund
View Short-term: Neutral Long-term: Positive
View Short-term: Positive Long-term: Positive

ICICI Securities Ltd. | Retail MF Research
Page 10
Exchange Traded Funds (ETF) In India, three kinds of ETFs are available: Equity index ETFs, liquid
ETFs and gold ETFs
An equity index ETF tracks a particular equity index such as the BSE Sensex, NSE Nifty, Nifty Junior, etc
An equity index ETF scores higher than index funds on several grounds. The expense of investing in ETFs is relatively less by 0.50-1.00% in comparison to an index fund. The expense ratio for ETFs is in the range of 0.50-0.75%, excluding brokerage, while for index funds the expense ratio varies in the range of 1.0-1.5%. However, brokerage (which varies) is applicable on ETFs while there are no entry loads now on index funds
Tracking error, which explains extent of deviation of returns from the underlying index, is usually low in ETFs as it tracks the equity index on a real time basis whereas it is done only once in a day for index funds
ETFs also provide liquidity as they are traded on stock exchanges and investors may subscribe or redeem them even on an intra-day basis. This is unavailable in index funds, which are subscribed/redeemed only on a closing NAV basis
There are over 400 ETFs traded globally. ETFs are transparent and cost efficient. The decision on which ETF to buy should be largely governed by the decision on getting exposure in that asset class
Volumes are higher only in the Goldman Sachs Benchmark ETFs and tracking error is also lowest at 0.01%. Therefore, it is our top pick for investors wanting Nifty-linked returns
CPSE ETF is a new entry in the Goldman Sachs ETF offering. The ETF invests in select 10 PSU stocks and has been listed on the exchange since April. It has delivered 16% return since its launch
Exhibit 10: CPSE ETF leads inflows
773
128
752 623
-579-334
73
-216
469
1927
1038722
13851190
1183
-1000
-500
0
500
1000
1500
2000
2500
Dec-
14
Jan-
15
Feb-
15
Mar
-15
Apr-1
5
May
-15
Jun-
15
Jul-1
5
Aug-
15
Sep-
15
Oct-1
5
Nov
-15
Dec-
15
Jan-
16
Feb-
16
Net
Inflo
w (
| Cr
)
Source: AMFI, ICICIdirect.com Research
Exhibit 11: AUM increases sharply
6702
7056 77
95
8060
7404
7317
7322
7170
7032 89
20 1003
1
1119
7
1188
7
1264
5
1284
6
02000400060008000
100001200014000
Dec-
14
Jan-
15
Feb-
15
Mar
-15
Apr-1
5
May
-15
Jun-
15
Jul-1
5
Aug-
15
Sep-
15
Oct-1
5
Nov
-15
Dec-
15
Jan-
16
Feb-
16
| Cr
ore
Other ETFs
Source: AMFI, ICICIdirect.com Research
Traded volumes should be the major criterion that is used
while deciding on investment in ETFs. Higher volumes
ensure lower spread and better pricing to investors...
Tracking error, though it should be considered, is not the
deciding factor as variation among funds is not huge...

ICICI Securities Ltd. | Retail MF Research
Page 11
Balanced funds Balanced funds witnessed an inflow of | 941 crore in February 2016.
CY15 witnessed massive inflows in balanced funds. AUM of balanced funds has increased from | 24490 crore in December 2014 to | 42193 crore in December 2015. Over the years, the balanced space has emerged as one of the fastest growing equity categories and offers an ideal investment option for first-time equity investors
Balanced funds are hybrid funds. More than 65% of the overall portfolio is invested in equities. Hence, as per provisions of the Income Tax Act, 1961, any capital gains over one year become tax free. Also, dividends declared by funds are tax free
In case you separately invest 35% of your investible corpus in a debt fund, the same will be subject to higher taxation. However, if the whole corpus is invested in balanced funds, 100% shall have lower taxation applicable as mentioned above
After a sharp rally in equity markets, the funds can be a preferred investment avenue as the debt proportion serves to protect on intermediate relief rallies or the downturn while providing 65% participation on further upsides
Exhibit 12: Moderate inflow into balanced funds…
1202 1425992
4511
1235
1491
880 941
1789
835 1183
4419
1358
754
0500
100015002000250030003500400045005000
Dec-
14
Jan-
15
Feb-
15
Mar
-15
Apr-1
5
May
-15
Jun-
15
Jul-1
5
Aug-
15
Sep-
15
Oct-1
5
Nov
-15
Dec-
15
Jan-
16
Feb-
16
Net
Inflo
w (
| Cr
)
Source: AMFI, ICICIdirect.com Research
Exhibit 13: AUM decreases…
2449
0
2579
2
2650
7
2636
8
2701
5
2874
9
3225
9
3455
0
3466
0
3663
3
3768
2
3855
9
4219
3
4112
1
3910
4
1300018000230002800033000380004300048000
Dec-
14
Jan-
15
Feb-
15
Mar
-15
Apr-1
5
May
-15
Jun-
15
Jul-1
5
Aug-
15
Sep-
15
Oct-1
5
Nov
-15
Dec-
15
Jan-
16
Feb-
16
| Cr
ore
Balanced
Source: AMFI, ICICIdirect.com Research
Preferred Picks
ICICI Prudential Balanced - Advantage Fund
HDFC Balanced Fund
Tata Balanced Fund
(Refer to www.icicidirect.com for details of the fund)
Monthly Income Plans (MIP) An MIP offers investors an option to invest in debt with some
participation in equity, ~10-25% of the portfolio. They are suitable for investors who seek higher return from a debt portfolio and are comfortable taking nominal risk. The debt corpus of the portfolio provides regular income while the equity portion of the fund provides alpha. However, returns can also get eroded by a fall in equities
MIPs can be classified into aggressive MIP and conservative MIP based on its equity allocation. Risk averse investors should invest in MIPs with lower equity allocation to avoid capital erosion
The change in taxation announced in the Union Budget 2014, shall be applicable to MIP funds (refer to debt funds section for details)
Investors with a limited investible surplus and a lower risk
appetite but with a willingness to invest in equities can
look to invest in these funds
View Short-term: Positive Long-term: Positive
View Short-term: Neutral Long-term: Positive
MIP should be a preferred debt investment for funds that need to be parked for over two years
ICICI Securities Ltd. | Retail MF Research
Page 12
Preferred Picks
Birla Sun Life MIP II - Savings 5 Plan
ICICI Prudential MIP 25
DSPBR MIP Fund
(Refer www.icicidirect.com for details of the fund)
Arbitrage Funds Arbitrage funds seek to exploit market inefficiencies that get manifested
as mispricing in the cash (stock) and derivative markets
Availability of arbitrage positions depends very much on the market scenario. A directional movement in the broader index attracts speculators in the market while cost of funding makes futures positions biased
Arbitrage funds are classified as equity funds as they invest into equity share and equity derivative instruments. Since these are classified as equity funds for taxation, dividends declared by the funds are tax free. No capital gains tax will be applicable if they are sold after a year
These funds can be looked upon as an alternative to liquid funds. However, for these funds, returns totally depend on arbitrage opportunities available at a particular point of time and investors should consider reviewing the same before investing. Returns of arbitrage funds are non-linear and, therefore, unsuitable for investors who want consistent return across time period
Arbitrage funds should be used as a liquid investment and should not be a major part of the investor’s portfolio
Availability of arbitrage positions depends very much on the market scenario. Directional movement in the broader index attracts speculators in the market while cost of funding makes future positions biased
In case of positive movement, long build-up in futures puts pricing in an upward bias and creates a window for direct arbitrage positions
On the other hand, negative bias attracts fresh sellers in the market. Speculators try to sell the stock much cheaper than theoretical prices. In such situations, reverse arbitrage opportunities arise
On the other hand, a range bound market does not give ample room to create arbitrage positions
Currently, there are few arbitrage opportunities available in the market which can lead to better returns
Preferred Picks
ICICI Prudential Equity - Arbitrage Fund – Regular IDFC Arbitrage Fund - (Regular) Kotak Equity Arbitrage Fund SBI Arbitrage Opportunities Fund
(Refer to www.icicidirect.com for details of the fund)
View Short-term: Positive Long-term: Positive

ICICI Securities Ltd. | Retail MF Research
Page 13
Debt funds Exhibit 14: Category average returns
7.50 8.
05 8.72
7.36 7.
81 8.50
7.34 7.
73 8.50
5.89 6.11
7.92
6.08
6.06
8.24
0.001.002.003.004.005.006.007.008.009.00
10.00
6 months 1 year 3year%
Income UST Liquid Income ST Income LT Gilt Funds
Source: ACE MF, ICICIdirect.com Research Note : Returns as on March 18, 2016; Returns over one year are compounded annualised returns
Exhibit 15: Deployment of funds: January 2016
CP Bank CD
Bank CD
Bank CD
Corporate Debt
0
5000
0
1000
00
1500
00
2000
00
2500
00
3000
00
3500
00
4000
00
4500
00
5000
00
Less than 90 days
90 days to 182days
182 days to 1 year
1 year and above
Government Securities
CP
Bank CD
Treasury Bills
CBLO
Other Money Market Investments
Corporate Debt
PSU Bonds
Securitised Debt
Bank FD
Source: SEBI, ICICIdirect.com Research Note : Holding as percentage of total AUM
Exhibit 16: G-sec yield curve
7.3 7.4
7.6
7.5
7.3
7.4 7.7
7.7
7.17.27.37.47.57.67.77.8
1yr 3yr 5yr 10yr
Yiel
d (%
)
17-Mar-16 18-Feb-16
Source: Bloomberg, ICICIdirect.com Research
Exhibit 17: Corporate bond curve
8.6
8.4
8.4
8.58.4
8.4
8.5
8.5
8.1
8.2
8.3
8.4
8.5
8.6
8.7
8.8
1yr 3yr 5yr 10 yr
Yiel
d (%
)
17-Mar-16 18-Feb-16
Source: Bloomberg, ICICIdirect.com Research
Benchmark 10 year G-Sec yield has witnessed correction of around 35bps in the last one month
Investment into securities with maturity of less than 90 days and more than a year dominate total investments by mutual funds

ICICI Securities Ltd. | Retail MF Research
Page 14
Liquid Funds Liquid fund returns moderated to 7.3-8.5% pre tax from over 9% earned
in the previous year. Liquid funds witnessed an inflow of | 20039 crore in February 2016
The Reserve Bank of India’s proactive liquidity management operations ensured that call rates stayed range bound around the policy rate reducing day-to-day volatility. CBLO rates also hovered just above the repo rate. With an improvement in liquidity conditions, the certificate of deposit and commercial paper rates in the three month bracket also eased over 100 bps to the 7.5-8% range from 9.1-9.3%. The same is likely to moderate returns in liquid funds, going forward
For less than a year, individuals in the higher tax bracket should opt for dividend option as the dividend distribution tax @ 28.325% is marginally lower. Also, though the tax arbitrage has reduced, they still earn better pre-tax returns over bank savings (3-4%) and current accounts (0-3%)
Changes in taxation rules announced in Union Budget 2014 are also applicable to liquid funds, as post tax returns in less than a three-year period get reduced for individuals falling in the higher tax bracket (30% tax slab) and for corporates
Exhibit 18: Call rates near repo rate
56789
101112
Jul-1
4Au
g-14
Sep-
14Oc
t-14
Nov
-14
Dec-
14Ja
n-15
Feb-
15M
ar-1
5Ap
r-15
May
-15
Jun-
15Ju
l-15
Aug-
15Se
p-15
Oct-1
5N
ov-1
5De
c-15
Jan-
16Fe
b-16
Mar
-16
%
Call rate
Source: Bloomberg, ICICIdirect.com Research
Exhibit 19: …CP/CD yields increases
7.0
7.5
8.0
8.5
9.0
9.5
Jul-1
4Au
g-14
Sep-
14Oc
t-14
Nov
-14
Dec-
14Ja
n-15
Feb-
15M
ar-1
5Ap
r-15
May
-15
Jun-
15Ju
l-15
Aug-
15Se
p-15
Oct-1
5N
ov-1
5De
c-15
%
3M CD 3M CP
Source: Bloomberg, ICICIdirect.com Research
Exhibit 20: Flows into liquid funds remain volatile on institutional activity
-50,
786
85,8
48
8,78
4
-112
,810
-15,
657
-47,
330
-60,
861
-42,
059 -5,2
60
2,45
5
20,0
39101,
592
89,9
78
-70,
489
103,
306
-200,000
-160,000
-120,000
-80,000
-40,000
0
40,000
80,000
120,000
Dec-
14
Jan-
15
Feb-
15
Mar
-15
Apr-1
5
May
-15
Jun-
15
Jul-1
5
Aug-
15
Sep-
15
Oct-1
5
Nov
-15
Dec-
15
Jan-
16
Feb-
16
Net
Inflo
w (
| Cr
)
Source: AMFI, ICICIdirect.com Research
Exhibit 21: AUM remains moderate
1784
9126
5358
2760
7016
2562
2667
2225
3899
2069
7930
0738
2341
4117
8507
2766
5523
6486
2329
7023
6700
2579
86
80000
130000
180000
230000
280000
330000
Dec-
14Ja
n-15
Feb-
15M
ar-1
5Ap
r-15
May
-15
Jun-
15Ju
l-15
Aug-
15Se
p-15
Oct-1
5N
ov-1
5De
c-15
Jan-
16Fe
b-16
| Cr
ore
Money Market
Source: AMFI, ICICIdirect.com Research
Preferred Picks
HDFC Cash Management Fund - Savings Plan SBI Magnum InstaCash Reliance Liquid Fund - Treasury Plan
(Refer to www.icicidirect.com for details of the fund)
View Neutral

ICICI Securities Ltd. | Retail MF Research
Page 15
Income funds In the income funds category, long term debt funds delivered 6.11%
absolute return in the last year (as on March 18, 2015) as 10-year G-sec yields have corrected to 7.48 levels from 7.78 levels after the Union Budget
Yields on longer duration securities, particularly government securities, continue to trade in a narrow range in the last three months as concerns over higher supply prevented any meaning correction in yields
Given RBI's commitment to provide adequate liquidity, we expect OMOs to continue till March, albeit sporadically. Also, starting April, liquidity should improve on account of government spending given that most of the deficit today is on account of government balances and not a structural deficit
Short-term debt funds remain a stable performing category, especially in the current volatile environment. Credit funds with reasonable credit quality should be preferred over an aggressive credit fund
Exhibit 22: Income funds witness outflows in February
-1,6
32
12,1
63
-152
-8,9
27 -2,5
10 4,20
5
5,86
1
22,8
75
2,47
4
-25,
875
15,0
14-9
25
21,7
13
12,6
71
-26,
717
-30,000
-20,000
-10,000
0
10,000
20,000
30,000
Dec-
14
Jan-
15
Feb-
15
Mar
-15
Apr-1
5
May
-15
Jun-
15
Jul-1
5
Aug-
15
Sep-
15
Oct-1
5
Nov
-15
Dec-
15
Jan-
16
Feb-
16
Net
Inflo
ws
(| .C
r)
Source: AMFI, ICICIdirect.com Research
Exhibit 23: AUM remains stagnant
5021
54
5202
34
5223
66
5157
73
5146
28
5221
78
5289
00
5558
84
5495
63
5753
24
5791
18
5553
64
5719
33
5711
92
5710
89
300000350000400000450000500000550000600000
Dec-
14
Jan-
15
Feb-
15
Mar
-15
Apr-1
5
May
-15
Jun-
15
Jul-1
5
Aug-
15
Sep-
15
Oct-1
5
Nov
-15
Dec-
15
Jan-
16
Feb-
16
| Cr
ore
Income
Source: AMFI, ICICIdirect.com Research
Recommended funds
Ultra Short Term Funds Birla Sun Life Savings Fund ICICI Prudential Flexible income
Short Term Funds Birla Sunlife short term fund HDFC Short Term Fund ICICI Pru Short Term Plan
Short Term Funds – Credit opportunities Birla Sunlife Short Term opportunities term HDFC Corporate debt opportunities ICICI Prudential Regular Savings
Long term/Dynamic Birla Sunlife income plus ICICI Prudential Dynamic Bond Fund IDFC dynamic bond fund
(Refer www.icicidirect.com for details of the fund)
View Ultra-short term: Positive
Short-term: Positive Long-term: Positive
Ultra-short-term fund returns are attractive on risk adjusted basis Short-term funds will benefit as the bond curve reverts to an upward slopping curve. Credit opportunities funds earn the highest accrual and are the best in the category Dynamic bond funds are suitable for all types of investors and for longer duration. They can take exposure to all durations as per the interest rate outlook and switch between G secs and corporate bonds

ICICI Securities Ltd. | Retail MF Research
Page 16
Gilt Funds Gilt funds delivered 6.06% absolute one year return as on March 18
2016 as lower inflation, the government’s adherence to fiscal discipline by maintaining the fiscal deficit target for FY16-17 at 3.5% and a sharp cut in small saving deposit rates have led to a much anticipated rally in G-Sec yields. Benchmark 10 year G-Sec yield has witnessed a correction of around 35 bps in the last month
The liquidity situation remained tight due to higher cash balance of the government with RBI, advance tax outflows and seasonal year end tightening
Inflation is not a policy concern currently with the RBI Governor saying inflation remains on a projected trajectory. Overall, assuming normal monsoon and current levels of oil and exchange rates, the RBI expects CPI to be 'inertial' and be around 5% by the end of FY17. However, it emphasises that implementation of the Seventh Pay Commission has not been factored in these projections whereas risks remaining broadly in the balance from monsoon and geopolitical events
The RBI has increased the FPI limit in government bonds to 5% of total outstanding government securities in a staggered manner by March 2018. Currently, FPI holding is 3.8%. The change in FPI limits has further opened up room for | 1,20,000 crore in central government securities by March 2018. All these augur well for debt funds, especially duration funds
The central government has signed a memorandum with the RBI setting out a clear inflation objective to bring the inflation rate to the mid-point of the band of 4 +/- 2%. CPI, as per our assessment, should average close to 5% for FY16 (on assumption of normal monsoons and a stable currency). The government’s commitment towards controlling price shocks and steps taken to improve the supply chain are commendable. Also, global prices have corrected sharply and are supportive ranging from crude, metal to food prices. Hence, inflation should likely stay on the intended path. This creates room for the RBI to cut rates by another 100-150 bps in the long term to earn a real return of ~1.5-2%
On the supply front, the Budget has pegged the market borrowing for FY16 at | 6 lakh crore on a gross basis and | 4.56 lakh crore on a net basis (out of this, | 2.34 lakh crore through dated securities and | 15000 through gold bonds have been scheduled for H2FY16). In Union Budget 2016-17, a fiscal deficit target of 3.5% was set for FY16-17 with net market borrowing of | 425000 crore and gross borrowing of | 6 lakh crore. The market was expecting a gross borrowing of around | 6.3 lakh to | 6.5 lakh crore
Although the outlook on G-Sec yields remains positive, the duration strategy should be played through actively managed income or dynamic bond funds. They will be able to make swift duration change within G-secs or switch between corporate bonds and G-secs within a specific duration
Recommended funds
Birla Sun Life Gilt Plus - PF Plan - Regular ICICI Prudential LT Gilt Fund - PF Option - Regular
(Refer to www.icicidirect.com for details of the fund)
View Short-term: Neutral Long-term: Neutral

ICICI Securities Ltd. | Retail MF Research
Page 17
Exhibit 24: Outflows from gilt funds in February
2090
1813 20
58
1439
164
875
-279
190
143
1183
428
-80
-243 23
-572
-1000
-500
0
500
1000
1500
2000
2500
Dec-
14
Jan-
15
Feb-
15
Mar
-15
Apr-1
5
May
-15
Jun-
15
Jul-1
5
Aug-
15
Sep-
15
Oct-1
5
Nov
-15
Dec-
15
Jan-
16
Feb-
16
Net
Inflo
w (
| Cr
)
Source: AMFI, ICICIdirect.com Research

ICICI Securities Ltd. | Retail MF Research
Page 18
Gold: Near term outlook remains positive amid global uncertainty
Year 2016 has turned the wave in favour of safe haven demand amid extreme global capital market uncertainty. Global gold prices rallied around 18% since the start of 2016
The risk, which was initially confined to the commodity space, started to spill over to currencies, equities and has recently also been impacting the credit markets as gauged by financial conditions and high yield bond market. The worsening condition is visible in rising credit default swap of countries like Brazil and companies like Deutsche Bank. As a result, there is a flight to safety and safe havens like developed market sovereign bonds (even when there is negative yield) and gold
The expectation of quantum of rate hike by the US Fed has declined significantly post recent turmoil in global capital markets. The market is now factoring in just one rate hike in the whole of calendar year 2016 especially post the dovish statement from the US Fed Chair. Interest rate hikes, in general, are negative for gold prices. With rate hike concerns receding, the overhang on prices also abates in the near term
The steep fall in industrial commodity prices, including crude oil led to a sharp fall in inflation and inflationary expectations across the globe and particularly in developed economies. The same led to reduced demand for gold as an inflationary hedge investment
Medium-term demand will, however, continue to be impacted by the overall global environment, particularly the US Fed rate hike trajectory
Exhibit 25: Gold prices rally sharply since start of year 2016 on safe haven demand…
1050
1100
1150
1200
1250
1300
Mar
-15
Apr-1
5
May
-15
Jun-
15
Jul-1
5
Aug-
15
Sep-
15
Oct-1
5
Nov
-15
Dec-
15
Jan-
16
Feb-
16
Mar
-16
Price ($/Ounce)
Source: Company, ICICIdirect.com Research
Exhibit 26: …domestic prices follows global trend
24000
25000
26000
27000
28000
29000
30000
Feb-
15
Mar
-15
Apr-1
5
May
-15
Jun-
15
Jul-1
5
Aug-
15
Sep-
15
Oct-1
5
Nov
-15
Dec-
15
Jan-
16
Feb-
16
Mar
-16
|
Price (|/10 grams)
Source: Company, ICICIdirect.com Research
Investment demand for gold is also governed by the broader economic climate. Currently, there is a lot of uncertainty surrounding currency devaluation, global economic growth prospects and equity & commodity market turmoil. The same is likely to keep demand for gold as a safe haven asset upbeat in the near term
ICICI Securities Ltd. | Retail MF Research
Page 19
Exhibit 27: Outflows from gold ETFs continue…
-157
-165
-178 -1
49
-146
-341
-227
-105
-112
-47 -38 -32
-111
-131
-74
-111
-69
-86 -76 -5
0
-82 -5
7
-69 -4
0
-46
-81
-142
-400
-200
0
Dec-
13
Jan-
14
Feb-
14
Mar
-14
Apr-1
4
May
-14
Jun-
14
Jul-1
4
Aug-
14
Sep-
14
Oct-1
4
Nov
-14
Dec-
14
Jan-
15
Feb-
15
Mar
-15
Apr-1
5
May
-15
Jun-
15
Jul-1
5
Aug-
15
Sep-
15
Oct-1
5
Nov
-15
Dec-
15
Jan-
16
Feb-
16
Net
Inflo
w (
| Cr
)
Two years of outflow
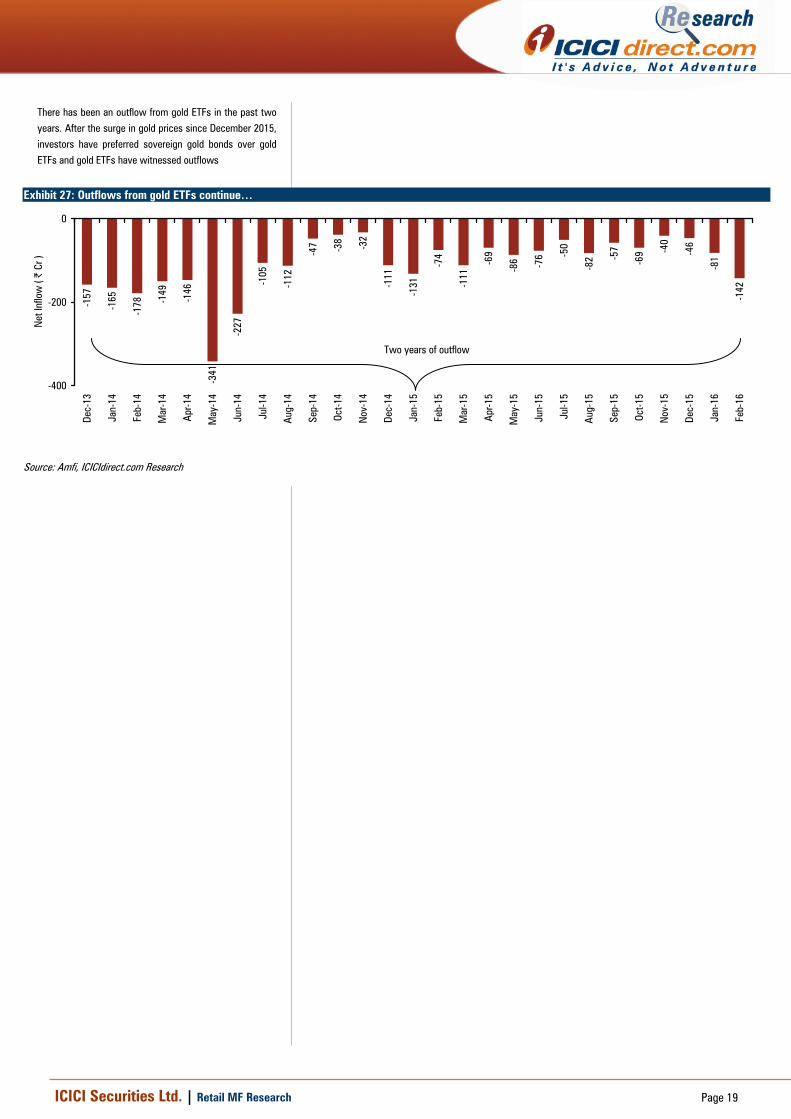
Source: Amfi, ICICIdirect.com Research
There has been an outflow from gold ETFs in the past two years. After the surge in gold prices since December 2015, investors have preferred sovereign gold bonds over gold ETFs and gold ETFs have witnessed outflows

ICICI Securities Ltd. | Retail MF Research
Page 20
Model Portfolios
Equity funds model portfolio Investors who are wary of investing directly into equities can still get returns almost as good as equity markets through the mutual fund route. We have designed three mutual fund model portfolios, namely, conservative, moderate and aggressive mutual fund portfolios. These portfolios have been designed keeping in mind various key parameters like investment horizon, investment objective, scheme ratings, and fund management. We have changed the mutual funds portfolio in July, to include midcap funds as we believe an improvement in the growth scenario may generate better alpha in midcap stocks over large cap stocks Exhibit 28: Equity model portfolio Particulars Aggressive Moderate ConservativeReview Interval Monthly Monthly QuarterlyRisk Return High Risk- High Return Medium Risk -
Medium ReturnLow Risk - Low Return
Funds Allocation % AllocationFranklin India Prima Plus 20 20 20Birla Sunlife Frontline Equity 20 20 20ICICI Prudential Dynamic Plan - - 20SBI Bluechip Fund 20 20 20ICICI Prudential Value Discovery 20 20 20HDFC Midcap Opportunities 20 20
Total 100 100 100
Source: ICICIdirect.com Research
Exhibit 29: Model portfolio performance: One year performance (as on February 29, 2016)
-12%
-16%-18%
-21%-25%
-20%
-15%
-10%
-5%
0%Aggressive Moderate Conservative BSE 100
%
Aggressive Moderate Conservative BSE 100
Source: Crisil Fund Analyser, ICICIdirect.com Research

ICICI Securities Ltd. | Retail MF Research
Page 21
Debt funds model portfolio We have designed three different mutual fund model portfolios for different investment duration viz. less than six months, six months to one year and above one year. These portfolios have been designed keeping in mind various key parameters like investment horizon, interest rate scenarios, credit quality of the portfolio and fund management, etc.
Exhibit 30: Debt funds model portfolio
Particulars
0 – 6 months 6months - 1 Year Above 1 Year
Objective LiquidityLiquidity with
moderate return Above FDReview Interval Monthly Monthly Quarterly
Risk ReturnVery Low Risk - Nominal Return
Medium Risk - Medium Return
Low Risk - High Return
Funds AllocationUltra Short term FundsBirla SL Savings Fund 20ICICI Pru Flexible Income Plan 20Short Term Debt FundsBirla Sunlife Short Term Fund 20 20Birla Sunlife Short Term Opportunites Fund 20Reliance Regular Savingfs Fund 20HDFC Short Term Opportunities Fund 20 20ICICI Prudential Regular Savings 20ICICI Prudential Short Term Fund 20IDFC SSI Short Term 20 20UTI Short Term Income Fund 20Long Term/Dynamic Debt FundsBirla SL Income Plus 20IDFC Dynamic Bond fund 20Total 100 100 100
Time Horizon
% Allocation
Source: ICICIdirect.com Research
Exhibit 32: Model portfolio performance: One year performance (as on February 29, 2016)
7.907.42
5.50
7.75 7.85
6.82
0.0
1.0
2.0
3.0
4.0
5.0
6.0
7.0
8.0
9.0
0-6 Months 6Months - 1Year Above 1yr
%
Portfolio Index
Source: Crisil Fund Analyser, , ICICIdirect.com Research
*Index: 0-6 month’s portfolio – Crisil Liquid Fund Index; 6 months-1 year – Crisil Short term Index Above 1 year: Crisil Composite Bond Index

ICICI Securities Ltd. | Retail MF Research
Page 22
Top Picks Exhibit 33: Category wise top picks
Category Top Picks
Largecaps Birla Sunlife Frontline equity Fund
ICICI Pru Focussed Bluechip Equity Fund
SBI Bluechip Fund
Midcaps HDFC Midcap Opportunities Fund
Franklin India Smaller Companies Fund
SBI Magnum Global Fund
Diversified Franklin India Prima Plus
Reliance Equity Opportunities
ICICI Prudential Value Discovery Fund
ELSS Axis Long Term Equity
ICICI Prudential Tax Plan
Franklin India Tax shield
Category Top Picks
Liquid Funds HDFC Cash Mgmnt Saving Plan
ICIC Pru Liquid Plan
Reliance Liquid Treasury Plan
Ultra Short Term Birla Sunlife Savings Fund
Reliance Medium Term Fund
ICICI Pru Flexible Income Plan
Short Term Birla Sunlife Short Term FundHDFC Short Term Opportunities Fund
ICICI Pru Short Term Plan
Credit Opportunities Fund Birla Sunlife Short Term Opportunities Plan
Reliance Regular Savings Fund
ICICI Prudential Regular Savings
Income Funds ICICI PrudenIncome Fund
Birla Sun Life Income Plus - Regular Plan
UTI Bond Fund
Gilts Funds ICICI Pru Gilt Inv. PF Plan
Birla Sunlife Constant Maturity 10 year
gilt plan
MIP Birla Sunlife Savings 5Aggressive ICICI Prudential MIP 25
DSP Blackrock MIP
Equity
Debt
(Refer www.icicidirect.com for details of the fund)

ICICI Securities Ltd. | Retail MF Research
Page 23
Pankaj Pandey Head – Research [email protected]
ICICIdirect.com Research Desk, ICICI Securities Limited, 1st Floor, Akruti Trade Centre, Road No. 7, MIDC, Andheri (East) Mumbai – 400 093
[email protected] Disclaimer ANALYST CERTIFICATION We Sachin Jain, CA and Isha Bansal, MBA (Fin) Research Analysts, authors and the names subscribed to this report, hereby certify that all of the views expressed in this research report accurately reflect our views about the subject issuer(s) or Funds. We also certify that no part of our compensation was, is, or will be directly or indirectly related to the specific recommendation(s) or view(s) in this report. Terms & conditions and other disclosures: ICICI Securities Limited (ICICI Securities) AMFI Regn. No.: ARN-0845. Registered office of I-Sec is at ICICI Securities Ltd. - ICICI Centre, H. T. Parekh Marg, Churchgate, Mumbai – 400020. India ICICI Securities Limited is a Sebi registered Research Analyst having registration no. INH000000990. ICICI Securities is a full-service, integrated investment banking and is, inter alia, engaged in the business of stock broking and distribution of financial products. ICICI Securities is a wholly-owned subsidiary of ICICI Bank which is India’s largest private sector bank and has its various subsidiaries engaged in businesses of housing finance, asset management, life insurance, general insurance, venture capital fund management, distribution of financial products etc. (“associates”), the details in respect of which are available on www.icicibank.com. ICICI Securities is one of the leading distributors of Mutual Funds and participate in distribution of Mutual Fund Schemes of almost all AMCs in India. The selection of the Mutual Funds for the purpose of including in the indicative portfolio does not in any way constitute any recommendation by ICICI Securities Limited (hereinafter referred to as ICICI Securities) with respect to the prospects or performance of these Mutual Funds. The investor has the discretion to buy all or any of the Mutual Fund units forming part of any of the indicative portfolios on icicidirect.com. Before placing an order to buy the funds forming part of the indicative portfolio, the investor has the discretion to deselect any of the units, which he does not wish to buy. Nothing in the indicative portfolio constitutes investment, legal, accounting and tax advice or a representation that any investment or strategy is suitable or appropriate to the investor's specific circumstances. The details included in the indicative portfolio are based on information obtained from public sources and sources believed to be reliable, but no independent verification has been made nor is its accuracy or completeness guaranteed. The funds included in the indicative portfolio may not be suitable for all investors, who must make their own investment decisions, based on their own investment objectives, financial positions and needs. This may not be taken in substitution for the exercise of independent judgement by any investor. The investor should independently evaluate the investment risks. ICICI Securities and affiliates accept no liabilities for any loss or damage of any kind arising out of the use of this indicative portfolio. Past performance is not necessarily a guide to future performance. Actual results may differ materially from those set forth in projections. ICICI Securities may be holding all or any of the units included in the indicative portfolio from time to time as part of our treasury management. ICICI Securities Limited is not providing the service of Portfolio Management Services (Discretionary or Non Discretionary) to its clients. Mutual fund investments are subject to market risks, read all scheme related documents carefully. Kindly note that such research recommended funds in indicative portfolio are not based on individual risk profile of each customer unless a customer has opted for a paid Investment Advisory Service offered by I-Sec. Investors should consult their financial advisers if in doubt about whether the product is suitable for them. The information contained herein is strictly confidential and meant solely for the selected recipient and may not be altered in any way, transmitted to, copied or distributed, in part or in whole, to any other person or to the media or reproduced in any form, without prior written consent of ICICI Securities Limited. The contents of this mail are solely for informational purpose and may not be used or considered as an offer document or solicitation of offer to buy or sell or subscribe for securities or other financial instruments or any other product. While due care has been taken in preparing this mail, I-Sec and affiliates accept no liabilities for any loss or damage of any kind arising out of any inaccurate, delayed or incomplete information nor for any actions taken in reliance thereon. This mail/report is not directed or intended for distribution to, or use by, any person or entity who is a citizen or resident of or located in any locality, state, country or other jurisdiction, where such distribution, publication, availability or use would be contrary to law, regulation or which would subject I-Sec and affiliates to any registration or licensing requirement within such jurisdiction. ICICI Securities and/or its associates receive compensation/ commission for distribution of Mutual Funds from various Asset Management Companies (AMCs). ICICI Securities host the details of the commission rates earned by ICICI Securities from Mutual Fund houses on our website www.icicidirect.com. Hence, ICICI Securities or its associates may have received compensation from AMCs whose funds are mentioned in the report during the period preceding twelve months from the date of this report for distribution of Mutual Funds or for providing marketing advertising support to these AMCs. ICICI Securities also provides stock broking services to institutional clients including AMCs. Hence, ICICI Securities may have received brokerage for security transactions done by any of the above AMCs during the period preceding twelve months from the date of this report