Risk Analysis of ULIP Investments (Investors' Approach) and their Comparison with Mutual Funds
Mutual Fund Investments in Private Firms
Sungjoung Kwon LeBow College of Business, Drexel University
Michelle Lowry LeBow College of Business, Drexel University
Yiming Qian University of Iowa
June 2, 2017
Abstract: Historically a key advantage of being a public firm was broader access to capital, from a disperse group of shareholders. In recent years such capital has increasingly become available to private firms as well. We document a dramatic increase over the past twenty years in the number of mutual funds participating in private markets and in the dollar value of these private firm investments. Consistent with the greater availability of capital changing the trade-off between private and public listing status, we find that mutual fund investments enable companies to stay private an average one to two years longer. The flexibility to invest in this sector of the market appears beneficial to mutual funds as well, with back-of-the-envelope calculations suggesting that the median mutual fund has earned monthly returns of 2 – 3% across their portfolio of private firm investments.
* We thank seminar participants at University of South Florida, Drexel University, the SFS Cavalcade, and the NYU Conference on “The Changing Role of Stock Markets in Capital Formation”. We thank Matt Denes for generously sharing code that facilitated the collection of patent data.

1
1. Introduction
While going public is without question a watershed event in the life of a firm, the lines
between private and public listing status have become increasingly blurred in recent years. The
number of publicly listed companies has decreased, but at the same time private companies are
increasingly raising funding from investors who traditionally focused only on public companies, for
example from mutual funds, hedge funds, pension funds and sovereign wealth funds.1 These
changing dynamics affect multiple parties: regulators who are faced with policies that are largely
based on a relatively strict line between public and private listing status, firms who are faced with
potential changes in both sources of capital and costs of capital, and investors who face changes in
their investment opportunity set.
The first objective of this paper is to provide systematic evidence on these changing
dynamics. We focus our analysis on a group of institutional investors that control a substantial
portion of the equity capital within our economy and which arguably represent an attractive source of
capital to private firms: mutual funds. From the perspective of private firms, one of the advantages
of mutual fund investors is that they do not demand strong control rights such as Board
representation (see, e.g., Chernenko, Lerner, and Zeng (2017)). In addition, they generally invest in
conjunction with a venture round, thereby avoiding an additional funding round and the
accompanying pressure for higher valuations. We investigate how the tendency of mutual funds to
invest in private companies has changed over a 20-year time period.
Our second objective is to examine the types of private companies in which mutual funds
invest. We consider both the characteristics of the company and the characteristics of institutions
that serve as intermediaries. Because mutual funds’ expertise is primarily in evaluating public
1 As of 2015, 25% of the public equity in the US was owned through mutual funds. http://www.institutionalinvestor.com/blogarticle/3407394/blog/the-latest-trend-for-pension-funds-private-equity-investment.html#.WECtwdUrLRY and http://www.wsj.com/articles/pension-funds-lambast-private-equity-firms-for-large-fees-1416562426
2
companies, we conjecture that they will rely heavily on the certification of an intermediary such as a
reputable venture capitalist (Booth and Smith (1986) and Megginson and Weiss (1991)). We further
predict that funds will focus their investments in private companies at later stages of development,
which will be more similar on various dimensions to public firms. However, it is also possible that
other forces, for example the lack of a definitive fund life (as is the case for VCs) and the fact that
such investments represent a relatively small portion of total net asset value, give mutual funds the
flexibility to invest in earlier stage companies.
Our third objective is to consider the effects of this increased availability of capital on the
underlying firms. We conjecture that mutual fund investments will enable private companies to stay
private longer. Typically, factors such as capital for investments, increased liquidity, and a broader
shareholder base influence companies’ decisions to go public (see, e.g., Brau and Fawcett (2006),
Lowry (2003)). If pre-IPO mutual fund investments lessen the advantages of public listing along any
of these dimensions, then we would expect increases in these financings to enable more companies to
stay private longer.
Finally, the last section of the paper provides some back-of-the-envelope evidence on the
benefits to mutual funds of these investments. Mutual funds’ participation in this sector of the
market may be driven by a belief that it offers higher returns or that it offers a source of
diversification, relative to public firms. The fact that the number of public firms has decreased
drastically over the last decade means that investment opportunities in the public sector have become
more limited (Grullon, Larkin, and Michaely, 2017).
To investigate the extent of mutual investments across a broad sample of private firms,
including those that are still private, we hand-collect detailed holdings data on 16 mutual fund
families. The funds in our sample include predominantly the largest fund families (e.g., Fidelity,
Blackrock, and Vanguard) as larger families are significantly more likely to invest in private firms.
Through an intensive data-gathering process, we determine that 149 funds across these 16 families
3
held shares in venture-backed private firms, over the 1995 – 2016 period.2 This practice has become
increasingly widespread: less than 14 funds invested in private companies each year through 2000,
compared to over 90 unique funds in 2014 and 2015.3 We note that this trend may be driven by
increases in the supply or in the demand for mutual fund capital. Increases in supply would be
consistent with lower costs of learning about private firms, and in recent years by the search for
higher returns in a low interest rate environment by diversifying into new asset classes. Increases in
demand would be consistent with private firms seeking to stay private longer as a way to avoid the
regulatory and shareholder-induced pressures of being a public firm.
These 149 mutual funds invested in 269 unique companies during 1995-2016. As a basis of
comparison, these 269 companies represent 1% of all venture-backed companies over our 1995 –
2016 sample period. However, this percentage is much higher in later years and among firms that
have progressed beyond the earliest stages. The percent of IPO firms that received mutual fund
financing prior to going public was 19% in 2014, 24% in 2015, and 36% in 2016.
Consistent with fund managers’ expertise and with liquidity concerns, mutual funds focus on
private firms that are at more advanced stages of development and are thus more similar to the public
firms in which they generally invest. We also find some evidence to support the prediction that
mutual funds rely on the certification effects of intermediaries, for example concentrating
investments in firms backed by higher quality venture capitalists.
Next, we consider whether mutual fund financing facilitates companies staying private
longer. As a first step, we examine whether funds provide a ‘meaningful’ amount of capital, i.e.,
whether they provide sufficient capital to feasibly enable a rapidly growing company to remain
private. While mutual funds purchase some secondary shares in these private companies, the vast
2 We focus on venture-backed private companies as a way to eliminate private companies that seek to remain private and independent. 3 The number of unique mutual funds investing in private firms dropped slightly in 2016, to 89 funds.
4
majority of mutual fund investments represent primary shares, i.e., new capital to the company. We
find that among rounds in which mutual funds participated, the funds provide an average 33% of the
total financing raised (median = 29%), over the 2011 – 2016 period. Moreover, the capital provided
by mutual funds appears to be incremental to that provided by the VCs, i.e., not to represent a
substitute in the sense of enabling VCs to stop funding the company at an earlier point.
To isolate the causal effects of mutual funds’ investments in private firms, we use an
instrument that captures relationships as conduits of information (see, e.g., Cohen, Frazzini and
Malloy (2010), Engelberg, Gao and Parsons (2012)). Consistent with this literature highlighting the
value of connections, conversations with mutual fund managers highlight the importance of
relationships as influencing these investments. We define a VC as having a prior mutual fund
relationship if another private company in the VC’s portfolio had previously received an investment
from a mutual fund. We conjecture that the increased communication that follows from this
investment increases the probability that a mutual fund becomes aware of subsequent private
companies backed by the same VC.4 Consistent with this intuition, we find that these VC-mutual
fund connections strongly predict subsequent mutual fund investments.
Using this instrument, a wide array of regression specifications suggests that mutual fund
financing enables companies to stay private longer. Among those companies that successfully exit,
our findings suggest that mutual fund financing enables companies to stay private 2.4 years longer.
Across our entire sample of VC-backed companies, those with mutual fund financing have a higher
probability of successfully exiting, but this source of financing lowers the probability of exit within a
given quarter by 6%. Finally, our findings indicate that companies with mutual fund financing are
more likely to go public but less likely to be acquired, an insightful difference given the greater stage
of development of firms going public. As highlighted by Gao, Ritter and Zhu (2013), there has been
a pronounced shift away from small IPOs since 2000.
4 see, e.g., https://www.cbinsights.com/blog/mutual-fund-vc-syndicates/
5
Over our sample period, mutual funds have done well through these investments. Among the
subsample of companies that received their first VC financing during the 2001 – 2010 period (thus
allowing sufficient time to exit), 48% exited via IPO. Across firms that ultimately went public, the
median fund earned raw returns of 150%, which equates to a monthly return of 4.9%. Finally, while
differences in mutual funds’ valuations of these private firms have received substantial attention in
the popular press, we find these cases represent outliers. Among those private firms held by more
than one mutual fund, the median firm has zero dispersion in valuations, but the difference between
the highest and lowest fund valuation equals 41% (102%) for firm at the 90th (95th) percentile.
Our study sheds new light on the financing choices and decisions of private firms. First, we
provide systematic evidence on one of the ways in which the lines between public and private status
are becoming increasingly blurred, i.e., on the extent to which a class of investors that has
traditionally focused on public firms is increasingly investing in private firms. Chernenko et al
(2017) similarly analyze mutual fund investments in private firms, but unlike us they focus on the
governance aspects of these investments. Our finding that increased mutual fund capital is flowing
to private firms is intriguing when compared to the decline in the number of IPOs and the decrease in
the number of publicly listed firms (see, e.g., Gao, Ritter and Zhou (2013), Doidge Karolyi and Stulz
(2015), and Grullon, Larkin, and Michaely (2017)). Prior literature suggests that a variety of factors
contribute to these trends, including for example the increased propensity of private firms to be
acquired rather than go public. In addition to these factors, any increases in the availability of
financing to private firms decrease the net benefits of being public and thereby influence firms’
decisions regarding public listing.
Second, a growing body of literature has contrasted the benefits of private versus public
listing, with both Brav (2009) and Gilje and Taillard (2016) concluding that public firms have lower
costs of capital and greater ability to raise capital to fund new projects. Our findings suggest that the
magnitude of these differences may have decreased over time.
6
Third, several papers have established the importance of networks within the venture capital
industry. Hochberg, Ljungqvist and Lu (2007) find that more centralized venture capitalists perform
significantly better, and Gorman and Sahlman (1989) and Sahlman (1990) discuss the ways in which
VCs rely on their connections with head hunters, patent lawyers, and investment bankers, among
others, to increase the company’s likelihood of success. Our findings suggest that relationships
between venture capitalists and mutual funds may becoming increasingly important. The fact that
VCs generally have substantial board representation in the private firms in which they invest
suggests that they view these mutual fund investments favorably.
2. Data
2.1 Private firm sample
Our sample of private firms consists of firms that received venture capital backing, as listed in
the SDC VentureXpert database, over the 1990 – 2016 period.5 Our focus on private firms with venture
backing is motivated by several factors. First, the set of venture-backed firms represents a set of firms
with the clear objective of exiting private status within a certain amount of time. As discussed by
Metrick and Yasuda (2011) and Ibrahim (2012), VC firms raise funds that are designed to last 10 – 12
years; they seek to exit investments within this period and return money to their investors. In contrast,
many non VC-backed private companies have no definite plan for exit, making it difficult if not
impossible to assess whether mutual fund investment causes firms to delay going public (or being
acquired).6 Second, while nearly all private firms have some equity investors, the identity of these
investors is frequently unknown among non-venture backed firms. Third, many mutual fund managers
focus their private firm investments on firms backed by venture capital. For example, based on 2015
5 We also download data from prior to 1990 to calculate rolling averages over previous three-year periods, as defined later. In addition, we have evaluated potential survivorship-bias related issues in the VentureXpert data, by comparing our dataset with a VentureXpert download from 2005. We compare the data on a variety of dimensions, and find no evidence that any such biases are influencing our results. 6 We frequently see many non VC-backed private companies that stay private for a very long time. To name a few, McKinsey & Company (founded 1926), Fidelity Investments (founded 1946), and SAS Institute (founded 1976).
7
filings, Fidelity Contrafund contains 21 unique restricted holdings, of which 17 (81%) represent VC-
backed companies.
We restrict the sample of VC-backed companies along several dimensions. Firms must be
private and US-based, and financing-round and firm information must be internally consistent.7 Firms
must receive an investment from at least one fund with the investment type ‘Venture Capital’ in the
VentureXpert database, thereby excluding firms whose financing is solely real estate, mezzanine
finance, or private equity. We require these portfolio companies to be founded after 1980, and to have
the first venture capital funding round in 1990 or later. Firms that received mutual fund financing prior
to venture capital financing are excluded. Our final sample includes 28,637 VC-backed private firms.
From the SDC New Issues Database and the SDC VentureXpert Mergers and Acquisitions
Database, we determine exit outcomes. For each private firm in our sample, we determine whether the
firm went public or was acquired. We obtain the industry of each firm and financing-round information
on the dollar amount invested, the date of each investment round, and the identity of the investors from
VentureXpert. Looking at Panel A of Table 1, Columns 1 and 2 show the number of companies
receiving VC financing for the first time each year, as well as the number that subsequently exited via
either IPO or acquisition. Columns 7 and 8, in Panel B, show the number of exits by exit year.
2.2. Mutual Fund Holdings
Mutual funds holding shares in private firms are required to list them as restricted securities.8
While standard data sources such as the CRSP Mutual Fund database and Thomson-Reuters Mutual
Fund Holdings database only cover investments in public companies, the SEC requires mutual funds
to disclose their complete portfolio holdings, regardless of the companies’ listing status, through
periodical filings. Electronic filings are available from EDGAR starting around 1995, and by regulation
7 For example, we drop cases in which the company’s earliest round date is earlier than the variable ‘Date Company Received First Investment’ and cases where the first VC funding round occurs prior to the firm’s founding year. 8 The SEC defines restricted securities as securities acquired in an unregistered, private sale from the issuing company or from an affiliate of the issuer.
8
all reporting companies, including mutual funds, have been required to file electronically through
EDGAR since May 1996. Through 2004 mutual funds disclosed their portfolio holdings semi-
annually, and starting in 2005 the requirement was changed to a quarterly interval.9 To ensure
consistency across our entire sample period and due to the high costs of the data collection, we collect
data semi-annually for all years. Specifically, we extract restricted holdings from Form N-30D for the
period 1995-2004 and from form N-Q for the period 2005-2016. Appendix I provides an example.
Due to the extremely high costs of collecting data on every mutual fund, we collect data on a
subset of funds. Our primary interest is to characterize the trends in mutual fund investments and
assess the impact of mutual fund investments on private companies, and we therefore seek to identify
fund families that have the willingness and infrastructure to invest in private companies. To identify
such a subset, we first identify all IPOs between 2006 and 2015, excluding REITs, ADRs, banks,
utilities, previous LBO firms, and offerings with an offer price less than $5. We then search by IPO
company name through the universe of mutual fund filings over this same period, to determine which
mutual funds owned any of these firms prior to the IPO. Filings are made at the CIK level (where each
CIK generally includes multiple funds). We identify 91 CIKs for which at least one mutual fund
invests in a company prior to its IPO; in total these CIKs include approximately 1,500 funds.
Our goal is to identify the universe of mutual funds that invest in venture capital-backed private
firms. One potential concern is that this approach will fail to identify funds that have invested in private
firms, but none of these firms have gone public. To assess the severity of this factor, we compare our
list of mutual funds with those listed in the Wall Street Journal Startup Stock Tracker, which includes
private firms held by mutual funds with valuations of $1 billion or more as of the end of 2016.10 We
find that our algorithm captures all fund families included in this list.
9 Starting from May 2004, the SEC requires mutual funds to file Form N-CSR (Certified Shareholder Report) at the end of the second and fourth fiscal quarters and Form N-Q (Quarterly Schedule of portfolio holdings) at the end of the first and third fiscal quarters (Agarwal et al., 2015). 10 http://graphics.wsj.com/tech-startup-stocks-to-watch/
9
Across these 91 CIKs, 75 are associated with open-end funds and 16 with closed-end funds.
We first provide an overview of these fund families that invest in private firms, compared to the broader
universe of mutual fund families. Across the 75 CIKs that correspond to open-end mutual funds, we
are able to match 72 with Thomson-Reuters Mutual Fund Holdings. Across these 72 CIKs, 68 CIKs
are associated with funds in decile ten (largest), 3 with funds in decile nine, and 1 with a fund in decile
seven (where the deciles are based on grouping the 12,956 unique funds listed in Thomson-Reuters by
management company, and ranking management companies into deciles according to total assets).11
In sum, larger fund families are substantially more likely to invest in private companies, a finding that
is consistent with both Chernenko et al (2017) and with a 2016 Morningstar Report.12 We note that
this is consistent with these families having superior abilities and/or capabilities to evaluate this set of
more informationally opaque companies.
Due to the high costs of data collection, we collect mutual fund holdings for a subset of 59
CIKs, which belong to 16 different fund families.13 Specifically, we select 14 families from decile ten
(Blackrock, Fidelity, Vanguard, etc.), one from decile nine (Wasatch), and one that is not in the CRSP
Mutual Fund Database (Great-West Funds). This distribution is consistent with the overall distribution
of CIKs, as described above. We extract information on each fund’s holdings of restricted securities
using Python as well as extensive hand collection and verification. We distinguish equity holding from
debt holding, and we collect company names, number of shares, valuations, acquisition dates,
acquisition costs, and security types. Additional details on this process, as well as the full list of mutual
fund families for which we collect data, are provided in Appendix I.
11 We 3 CIKs we cannot match include: AMERICAN FUNDS INSURANCE SERIES (CIK: 729528), GREAT-WEST FUNDS INC (CIK: 356476), and Voya INVESTORS TRUST (CIK: 837276). The matching of funds within these CIKs to Thomson-Reuters Mutual Fund Holdings deciles is based on the registrant fund within each CIK, as designated on the EDGAR filing. 12 Morningstar Manager Research, (2016). Unicorn hunting: mutual fund ownership of private companies is a relevant, but minor, concern for most investors. December 2016. 13 A 2016 Morningstar report lists 26 fund families holding private firms as of 2016, however the families included in their list for which we do not collect data are all substantially smaller.
10
We describe the time-series of companies with mutual fund financing in several ways: by year
in which these companies first received VC financing (Panel A of Table 1, cols 4 – 6), by year in which
a mutual fund first provided financing to a firm (Figure 2), and by year of exit (Panel B of Table 1,
cols 9 – 10). Section 2.4 focuses on discussing descriptive statistics.
For several analyses, we are interested in contrasting the capital provided by mutual funds
versus VCs. For such purposes, we strive to match mutual fund investment with investment rounds in
either VentureXpert or CrunchBase. Each of these data sources offers different advantages.
VentureXpert provides all funding rounds but does not report round series information (series A, series
B, etc.). On the other hand, Crunchbase provides round series information, but the data are less
comprehensive in the sense that they include fewer firms. As discussed further in later sections, we
define a mutual fund investment to have been part of a funding round if the absolute value of the
difference between the mutual fund’s acquisition date (as reported in mutual fund filings) and the
venture round date (as reported in either VentureXpert or CrunchBase) is less than 30 days.
2.3 Patent Data
Very little financial information is generally available for private firms, and for this reason we
focus on patent activity as a metric of a firm’s level of development. The majority of the venture-
backed firms in our sample are in technology-focused industries, where patenting tends to be important.
Thus, for each of the 28,637 private venture-capital backed firms in our sample, we seek to determine
the extent of patent activity. The official source for patent data is the USPTO (United States Patent
and Trademark Office), which provides information on granted patents on a weekly basis. Bulk
download is available through Google and Reed Tech at no charge.
Following Denes (2017), we use Python scripts to download and convert all patent files into a
machine-readable format. We extract patent number, assignee name, assignee city, assignee state,
application date, and grant date. We cross-check our patent data with previous literature and confirm
that the numbers are consistent. For example, Hall, Jaffe, and Trajtenberg (2001) document that there
11
are approximately 70,000 applied patents in 1985 (Figure 1 in Hall et al., 2001). In our sample, the
number is 78,643. Also, they document that there are approximately 90,000 granted patents in 1990
(Figure 2 in Hall et al., 2001), and we have 99,275 granted patents in this year.
Because there is no common identifier between the patent data and VentureXpert, we name-
match the two databases. We first normalize patent assignee names by removing punctuations and legal
suffixes and then implement the cosine similarity algorithm developed by Denes (2017) to name-match
patent assignee names with VC-backed companies in VentureXpert. The algorithm gives us the
matching quality with a scale of 0 to 1. We match patents with VentureXpert if one of the following
criteria is met: 1) match quality is higher than 0.9, or 2) match quality is higher than 0.8 conditional on
having the same city. The matching gives us 260,494 patents matched to 11,101 VC-backed companies
in our VentureXpert sample.
There are two dates for each patent: application date and grant date. As noted by Lerner and
Seru (2015), the patent literature has generally focused on analyzing patent filing by the application
year. The economic motivation for this measure is that firms will tend to file for patents soon after the
discoveries are made. However, we observe patent applications only if they are granted. Therefore,
counting number of patents based on application year will mechanically create a truncation problem.
Hall, Jaffe, and Trajtenberg (2001) and Bernstein (2015), among others, correct this truncation bias by
dividing each patent by the average number of applied patents of all firms in the same year and
technology class. In the same spirit, we scale each patent by the average number of patents of all VC-
backed companies in the same year and industry, using the industry grouping provided in VentureXpert
as tabulated in Table 2.
2.4 Descriptive Statistics
Descriptive statistics on these 28,637 venture-backed companies are provided in Table 2,
where the first column focuses on the 269 companies that received mutual fund investment prior to
exit (i.e., prior to going public or being acquired), and the second column focuses on companies that
12
did not receive such investment.
The first set of rows shows the characteristics of the VCs providing funding in the first round:
VC firm age, the number of companies and the number of rounds in which the VC invested during the
past three years, and the number of companies funded by the VC that had an IPO or were acquired
during the past three years. When there are multiple VCs in the first round, we take the average of
these characteristics. These metrics are generally perceived to capture aspects of VC quality and also
firm quality (see, e.g., Lerner (1994), Hochberg, Ljungqvist, and Lu (2007), Nahata (2008)). Sorenson
(2007) shows that higher ranked VCs both select higher quality companies in which to invest and
provide higher quality advising and monitoring. Across all five of these measures, firms that are
ultimately funded by mutual funds are backed by higher quality VCs during the first round of financing.
This is consistent with our conjecture that mutual funds rely on the certification of an intermediary,
when selecting private companies in which to invest.
The second set of rows focuses on the extent of VC funding. Because we are interested in the
decision of mutual funds to invest in firms, we measure these variables prior to the first mutual fund
financing for the sample of 269 firms that received such financing and prior to exit (or as of the last
financing round) for all other firms. This approach is based on the intuition that funds had the choice
to invest in these other firms at each point in time (up to ultimate exit or to the last observed round),
but never did. Rounds received represents the number of venture capital financing rounds, and VC
syndicate size represents the number of VCs that have invested in the firm, at these points in time.
These measures all indicate that mutual funds are choosing to invest in firms in which VCs have made
greater commitments.
The third set of rows shows measures of patenting activity. We find that as of the last VC
round, companies with mutual fund financing have applied for significantly more patents (where the
set of patents is restricted to those that are ultimately granted) than those without: 8.5 versus 2.9 in
raw terms, and 1.4 versus 0.6 after adjusting for year and industry. Similarly, firms with mutual fund
13
financing are significantly more likely to have applied for and to have been granted at least one patent.
The fourth set of rows shows the industry distribution of the two sets of firms, where industry
definitions are taken from VentureXpert. We observe a marked concentration of mutual-fund backed
firms in the biotech industry: 25% of firms receiving mutual fund financing belong to the biotech
industry, compared to only 6% of non-mutual fund backed firms. As highlighted by Dambra,
Gustafson and Field (2015), biotech firms have high proprietary disclosure costs, suggesting they may
benefit from staying private longer to delay the provision of sensitive information to competitors.
The fifth set of rows shows the geographical distribution. Prior literature provides strong
evidence regarding the benefits of geographic proximity (see, e.g., Chen, Gompers, Kovner, and Lerner
(2010) for evidence on VCs, and Hong, Kubik, and Stein (2005) and Coval and Moskowitz (2001) for
mutual funds). Because many mutual funds are located in places without a concentration of private
companies, the best option is arguably for the fund to invest in companies that are all located in one
‘far-away’ location.14 It is more efficient for a fund manager to make one trip to Silicon Valley and
visit 20 different companies, versus making trips to five different locations and visiting just a few
companies at each. Consistent with this conjecture, we find a strong California effect: 50% of firms
with mutual fund financing are located in California, compared to only 35% of other VC-backed firms.
Finally, the sixth set of rows describes the outcomes of each group of firms. Those firms that
receive mutual fund financing are significantly more likely to exit (51% versus 29%), and in particular
to exit via an IPO (32% versus 5%). Interestingly, firms that receive mutual fund financing are less
likely to exit via acquisition (18% versus 23%), a finding that likely reflects the fact that many
acquisition exits represent losses to the investing entity and are thus more akin to failures than
successes. Finally, the firms that receive mutual fund financing also remain private significantly
14 Many of the largest funds are on the east coast, whereas the largest concentration of private companies is on the west coast. T. Rowe Price fund manager Henry Ellenbogen states that he spends an average 100 days a year on the road, emphasizing the importance of in person due diligence. http://www.bloomberg.com/news/articles/2015-07-08/how-t-rowe-s-ellenbogen-started-the-flood-of-cash-into-startups
14
longer, measured as time to exit from first VC round: 6.51 years versus 4.92 years. This could be
driven by differences in the types of firms that go public or by the mutual fund financing enabling these
firms to delay going public.
3. The time trend of mutual fund investments in private companies
Figures 1, 2, and 3 provide evidence on the prevalence of mutual fund financing in private
companies, as well as the ways in which it has evolved over the past 20 years. These figures show
time trends in the number of private companies with mutual fund financing as well as trends in the
number of mutual funds participating in this market.
Panel A of Figure 1 shows that there have been dramatic increases in: the number of mutual
funds participating in these private markets and in the number of private companies with mutual fund
investments. Between 1995 and 2000, less than fifteen mutual funds had investments in private
firms, compared to 97 in 2014. The number of private firms receiving mutual fund investment has
followed a similar trajectory. Interestingly, both series exhibit a decrease in 2016.
Contemporaneous with the increased number of funds investing in private firms, Panel B
shows that the aggregate value of these investments has increased from less than $70 million dollars
prior to 2000 to $7.5 billion in 2015 and $7.2 billion in 2016. This increase in valuations is driven by
appreciation of prior investments and by new investments. The bars plot the latter, and they show
that in 2015 alone mutual funds invested nearly $4 billion into private, VC-backed firms. However,
consistent with the evidence in Panel A of a slowdown in the most recent year, Panel B shows that
there was only $1.2 billion in new investments in 2016.
We find that mutual funds typically invest alongside venture capitalists in funding rounds
(commonly referred to as Series A, Series B, etc.). Panel C of Figure 1 shows that the capital
provided by mutual funds represents an increasing percentage of total financing obtained through
these funding rounds. In the 1995 – 2005 period, mutual funds provided an average 11.3% (median
15
5.4%) of capital in funding rounds. This increased to an average of 29.7% over the 2005 – 2010
period and 33.4% over the 2011 – 2016 period (medians = 17.4% and 28.7%).
A portion of the time trends in Figure 1 represent the cumulative effects of prior investments,
i.e., if a fund invests in two firms per year and doesn’t divest any of these investments then after
three years it will have investments in six private firms. To separate these effects, Panel A of Figure
2 focuses on the number of companies receiving mutual fund financing for the first time each year.
Panel B shows the median amount of capital invested by a mutual fund in a private firm. Several
conclusions emerge. First, there have been time-series fluctuations in these metrics, but not a steady
increase. The number of new companies receiving this type of financing equaled 35 at the height of
the Internet Bubble, decreased to approximately ten or fewer per year over the subsequent decade
and then has increased again in more recent years to a high of 44 companies in 2015. Consistent
with evidence in Figure 1, there is a stark decrease in 2016, with only 6 new private companies
receiving mutual fund financing. However, the typical amount of capital provided was substantially
less in these earlier years. As shown in Panel B, the median funding amounts were relatively low
during the Internet Bubble years, increased markedly in the years following the Financial Crisis, and
remain relatively high today. The conclusion that funds are investing more capital holds across all
development stages: early stage, expansion stage, and later stage. Second, Panel A shows that
mutual funds are increasingly investing in earlier stage companies, which is perhaps surprising given
their presumably greater expertise in later stage companies.15 More consistent with expectations,
Panel B shows that in dollar terms the amount of capital devoted to early stage companies remains
relatively small.
15 One factor potentially driving mutual funds to increasingly invest in early stages is a search for more risk, for investments that are less correlated with public firms. This argument is highlighted in ‘Desperate For Returns, Mutual Funds Add Risk By Investing In Private Startups’: http://www.forbes.com/sites/thomaslandstreet/2015/12/08/desperate-for-returns-mutual-funds-add-risk-by-investing-in-private-startups/#429f6586d5a8
16
It also appears that the number of mutual fund investments in private companies is positively
correlated with other cycles in the financing of private firms. The number of companies receiving
mutual fund financing for the first time (shown in Panel A of Figure 2) commoves with the number
of IPOs, with a correlation of 0.34. Interestingly, the number of companies receiving mutual fund
financing for the first time appears to be somewhat higher prior to market crashes, e.g., at the height
of the Internet Bubble in 1999 and 2000 and prior to the Financial Crisis in 2008, but the amount of
capital invested is substantially higher in the immediate wake of these events, e.g., in 2001 and 2009
– 2011. We conjecture that this latter effect reflects the infeasibility of going public in these years
combined with a demand for capital to survive. We also find that the number of private companies in
which mutual funds have investments is positively related to the number of private companies in
which VC firms have active investments (not tabulated).
Figure 3 highlights the extent to which the most successful venture-backed private companies
received mutual fund financing. Specifically, the sample is restricted to those VC-backed firms that
successfully went public, and for each year the bar graph depicts the number of such firms that
received mutual fund financing prior to the IPO (bottom, dark-shaded portion of each bar) versus
those that did not (top, lightly-shaded portion). The overlaid line shows VC-backed IPO firms that
received mutual financing prior to the IPO (bottom portion of each bar) as a percent of all VC-backed
IPO firms (total bar). This percent ranges between 0 – 5% in the years prior to 2010, and has
increased substantially in recent years, to 24% in 2015 and 36% in 2016.
While these figures are merely descriptive, they are consistent with several underlying
dynamics. First, the development of the internet has substantially decreased the costs of information
collection, and firms with the highest information asymmetry are among the biggest beneficiaries of
such changes. Also, the internet has facillitated a growing market for shares of private firms.
According to the New York Times, secondary sales of stakes in funds — including private equity
17
funds, venture capital funds and real estate funds — totaled $47 billion in 201416. The Nasdaq
Private Market launched in March 2014 enables private firms to raise capital and manage secondary
transactions. Second, the fall in the number of companies going public since 2000 (see, e.g., Gao,
Ritter, and Zhu, 2013) means that mutual funds are less able to gain exposure to one sector of the
market, i.e., to small, high growth firms. For reasons related to diversification and/or to fund
mission, funds looking to gain such exposure may turn toward private firms. Third, incentives to earn
higher returns in a low-interest rate environment may have pushed mutual funds to mimic successful
strategies of hedge funds and other institutional investors to embrace alternative investments
including private equity.17
4. Mutual funds’ choice of companies in which to invest
4.1 In which private companies do mutual fund invest?
Private firms are characterized by enormously high information asymmetry, and the set of
possible private firms in which funds can potentially invest is enormous. Table 3 shows cross-
sectional OLS regressions, where each VC-backed private company represents one observation and
the dependent variable equals one if that company received mutual fund financing prior to either the
end of the sample period or to exit, where exit is defined as either going public via an IPO or being
acquired. Column 1 focuses on the full sample of 28,637 private VC-backed companies that first
received VC financing in the 1990 -2015 sample period, of which 269 companies received mutual
fund financing. Columns 2 and 3 restrict the sample along various dimensions, in an effort to limit
the sample of firms to those on which mutual funds might more likely focus their attention. For
example, Column 2 limits the sample to companies with at least two rounds of venture capital
financing, and Column 3 adds the requirement that companies be funded by a minimum of two
16 A Boom in Private Equity’s Secondary Market, Feb 15, 2015 (http://dealbook.nytimes.com/2015/02/18/a-boom-in-private-equitys-secondary-market/?_r=0) 17 http://www.barrons.com/articles/alternative-investments-surfing-the-market-1445664165
18
venture capitalists prior to mutual fund investment. Finally, Column 4 shows results over the 1995 –
2010 period both because there were relatively few mutual fund investments prior to 1995 and to
allow time for companies to exit. Stage level (e.g., early, expansion, or later stage), industry, and
first VC round year fixed effects are included in all specifications. Consistent with Table 2, variables
that vary over time are defined as of the quarter end preceding the first mutual fund investment for
firms that obtained mutual fund investment, and as of the last VC round date for all other firms.
Results highlight the importance of a company’s stage of development as perhaps the most
important determinant of mutual funds’ investments. Mutual funds are significantly more likely to
invest in companies that have applied for more patents. In addition, they are also significantly more
likely to invest in companies that have raised more money in prior rounds, a finding that likely
captures several effects. First, it proxies for the quality of the firm, as VCs make larger dollar
investments into firms they perceive to have a higher probability of successful exit. Second, mutual
funds are more likely to recoup the fixed costs of researching a private company if they can make a
larger dollar investment. Third, it is likely easier to obtain information on larger companies.
We find some support for the certification effects of intermediaries. In Column 3, when we
limit the sample to those cases that mutual funds are most likely to seriously consider (a minimum if
two VC rounds and participation by at least two different VCs), we find that mutual funds are
significantly more likely to invest in firms that are backed by VCs with more successful exits. A one
standard deviation increase in the number of exits by the funding VC(s) is associated with a 0.47
percentage point increase in the probability of a mutual fund investing in that company.18
Finally, Table 3 also indicates that geography is a relevant criteria. We include dummies for
five states: California, Massachusetts, New York, Texas, and Pennsylvania. Consistent with mutual
18 The standard deviation of # Exits is 1.38. Based on the column 3 estimates, the probability(receiving mutual fund investment) increases by 0.0034*1.38 = 0.00469, or 0.47%. When compared to the unconditional mean 0.94% of receiving mutual fund financing, this represents a 50% increase in probability.
19
funds finding it more efficient to focus on geographically clustered companies, we find that
companies are more likely to receive mutual fund financing if they are located in California, and
significantly less likely if they are located in Texas.
Results are also robust to limiting the regression sample to companies that received their first
funding round over the 2005 – 2016 period (not tabulated). This suggests that mutual funds continue
to invest in these same types of companies in more recent years.
4.2 In which IPO companies did mutual funds invest prior to IPO?
To provide a different perspective on the companies in which mutual funds choose to invest,
Figure 4 and Table 4 focus on a set of companies that were ex post successful, i.e., that went public
via an IPO. Looking first at Figure 4, we examine various financial characteristics in the years prior
to and following the IPO. In each panel, year 0 is the fiscal year that includes the IPO. Panels A
through D examine total assets, net sales, expenditures (= CapEx + R&D + SG&A), and gross
margin, respectively. Together these panels suggest that the companies in which mutual funds have
invested are characterized by higher growth.
Looking first at Panel A, those companies with mutual fund investment have slightly larger
assets two years prior to the IPO ($39 million versus $22 million, a difference of 79%), but this
difference increases substantially over the next 4 years. The companies in which mutual funds invest
are 155% larger in terms of assets at the end of the fiscal year prior to the IPO and 226% larger two
years later. Similar conclusions emerge from Panel B, which focuses on sales. Panel C suggests that
much of this higher growth is coming from higher expenditures. Two years prior to the IPO, the
expenditures of the companies in which mutual funds invest are approximately 64% larger (41
million versus 25 million), and by two years after the IPO the differential has increased to 186% (229
mil versus 80 million). Finally, Panel D indicates that this higher growth trajectory of the companies
in which mutual funds invest is also manifested in lower profits for an extended period of time. The
combination of both higher sales and higher expenditures of the mutual-fund backed companies, but
20
no difference in gross margin is consistent with these companies having insufficient internal cash
flows to fund their growth and thus demanding more external capital.
Table 4 examines the statistical significance of these patterns. We restrict the sample to the
1,315 venture-backed firms that went public between 1992 and 2014, of which 56 received mutual
fund financing, for fiscal years two years prior through two years following the IPO.19 The
dependent variable in columns 1 – 4 equals each of the variables examined in Figure 4: total assets,
net sales, expenditures, and gross margin. Independent variables include a dummy equal to one if the
firm received mutual fund investment, a dummy equal to one in the IPO years and beyond, and an
interaction term between the mutual fund investment dummy and the event time dummy. Control
variables similar to those in Table 3 are also included. The significantly positive coefficient on the
interaction terms in the assets, sales, and expenditures regressions as well as the marginally
significant negative coefficient in the gross margin regression are consistent with conclusions from
Figure 3.
Table 4 also includes two additional regressions, where the dependent variable equals
expenditures as a fraction of assets and cash as a fraction of assets. If companies were wasting the
capital provided by mutual funds through non-productive expenditures or holding onto the cash as a
safety net, we would expect to find significantly positive coefficients on the mutual fund investment
dummy * IPO year and beyond dummy. The insignificance of this coefficient in the scaled
expenditures regression and the marginally significant negative coefficient in the cash regression
provides no support for these conjectures.
In sum, both Figure 4 and the regressions in Table 4 suggest that mutual funds are
concentrating their investments in a set of high-growth companies. Such companies tend to have
19 Results are similar in economic terms but statistically stronger if we extend the sample through 2016 (i.e., the sample represented in Figure 4). This approximately doubles the number of IPO firms with mutual fund financing but includes firms for which we do not have two full years of post-IPO data.
21
high demands for capital, and if they want to delay going public they may find it difficult to raise
sufficient financing from venture capital. First, individual venture capital funds avoid investing too
much money in any one company, for reasons related to diversification. Second, there are frictions
associated with having too many venture capitalists funding a company, for reasons related to
contracting and control. Mutual funds willing to invest in the company potentially provide a solution
to this problem. In this way, mutual fund financing provides benefits similar to those discussed by
Hochberg et al (2016) for venture debt.
5. Do companies obtain ‘incremental capital’ from mutual funds?
In an effort to understand the ways in which mutual fund investments potentially benefit
companies, we seek in this section to understand the extent to which these investments provide new
capital and/or additional liquidity to the underlying companies.
5.1 Primary shares or secondary shares?
We first investigate whether mutual fund investments predominantly represent primary
shares or secondary shares. The high growth trajectory of these companies (Figure 4, Table 4) makes
primary share investments particularly beneficial. However, purchases of secondary shares are also
be valuable, as the increased liquidity enables existing shareholders to sell at least a portion of their
holdings and thereby lessens pressure to go public before the company is ready.20
Because mutual funds do not report whether their investments were primary or secondary
shares, we employ three alternative procedures to identify share type. First, we tabulate the portion
of mutual funds’ investments that represent preferred shares, versus everything else (which includes
common stock, warrants, etc.). This categorization is based on conversations with VCs, which
20 For example, when Intel invested $740 million into Cloudera in 2013, a portion of this investment represented secondary share purchases and thus provided no new capital to the company. https://techcrunch.com/2014/04/01/much-of-intels-740m-cloudera-investment-likely-went-to-existing-shareholders/
22
suggest that primary share investments are exclusively (or nearly exclusively) preferred stock. As
shown in Panel A of Table 5, this categorization suggests that only 10.5% of fund-firm investments
are exclusively secondary shares, a full 62.2% consist entirely of primary shares, and among the
remaining cases where mutual fund investments consist of both primary and secondary shares,
primary shares generally represent the majority.
Second, we match each mutual fund investment with reported rounds in VentureXpert. We
find that 72.4% of the 1,051 mutual fund investments in our sample (where each of these 1,051
observations represents an investment by one fund in one company at one date) are within 30 days of
a reported VentureXpert round. Panel B of Figure 5 shows the time distribution of these 72% of
cases: the concentration in the days preceding the round closing date is consistent with funds
investing in the weeks leading up to the final round close date. While the remaining 28% of cases
potentially represent a combination of primary shares (e.g., if the mutual fund purchased the shares
more than 30 days prior to the round closing date or if the round date in VentureXpert is reported
with error) and secondary shares, Google searches on a random sample indicate that primary shares
are issued in most (84%) cases. In sum, similar to Panel A, this process suggests that in the vast
majority of cases mutual funds are purchasing primary shares.
Third, we match each mutual fund investment with reported rounds in Crunchbase. While
Crunchbase includes a smaller number of firms, it has the advantage of providing the series number
(series A, series B, etc.) for each financing round. This enables us to perform the most precise
match, because we know both the date the fund purchased the shares and the exact issue date of these
specific shares (i.e., series A shares, series B shares, etc.). While based on a more limited subsample,
this process generates a similar conclusion. We find that 70.3% of investments fall within 30 days of
a reported Crunchbase round conditional on having the same series number. In sum, these three
alternative methods consistently suggest that 70 - 80% of mutual fund investments in private firms
represent primary shares.
23
5.2 Do mutual fund investments increase total capital raised?
As a next step in evaluating the ways in which the underlying companies benefit from mutual
fund investments, we seek to determine if the capital provided by mutual funds is incremental to
investments that VCs would have otherwise made. There are several reasons to believe that mutual
funds may provide funds over and above that which VCs are willing to provide. First, for
diversification reasons, there is an upper bound on the amount of money a VC is willing to invest in a
single company. In fact, as various market changes have led companies to seek more advanced
stages of development prior to going public, VCs have noted that the associated higher capital
demands are challenging to satisfy without the participation of mutual funds. Second, existing
investors may not want a new VC to take an ownership stake in the company because this new VC
would likely demand control rights. As discussed earlier, mutual funds rarely demand control rights.
We begin with descriptive evidence. Figure 6 restricts the sample to companies that obtain
mutual fund financing in at least one round, and compares round size across the rounds with versus
without mutual fund participation. We match the mutual fund investments to venture financing
rounds using CrunchBase in Panel A (as this source provides detail on the serie, e.g., Series A, Series
B, etc), and to VentureXpert in Panel B (as this source provides a more comprehensive sample of
venture financing rounds). In both cases, we match the rounds if the mutual fund acquisition date is
within 30 days of the venture round date.
As shown in Panel A of Figure 6, we find that rounds that include mutual fund participation
are substantially larger than those that do not, across every series. 21 For example, among Series B
financings, the median round amount of rounds with versus without mutual fund participation is $60
million versus $16 million.22 Importantly, because the sample is restricted to companies that receive
21 Because relatively few companies have series F, G, and beyond, we merge them into a single category. 22The larger round amounts of rounds with mutual fund financings is NOT driven by the fact that such rounds are predominantly the last round a company raises. In fact, only 55% of rounds with mutual fund participation represent the last round a company raises.
24
mutual fund financing at some point, this difference does not reflect a company-type effect.
Panel B of Figure 6 plots the kernel density of round sizes across rounds with mutual fund
financing versus those without.23 Consistent with conclusions from Panel A, the distribution of
rounds with mutual fund participation lies solidly to the right of those without.
Table 5 provides further evidence on the extent to which mutual fund investments provide
incremental capital to companies. Across all specifications, the dependent variable is the natural log
of the round amount, and the independent variable of interest is a dummy equal to one if the round
included participation by mutual funds. We similarly conduct the analysis using both the more
comprehensive VentureXpert data (Col 1, which contains all rounds) and the more detailed
CrunchBase data (Cols 2 – 4, which include series fixed effects). Columns 1 and 2 show OLS
regressions, while Columns 3 and 4 show the first and second stages, respectively, of a 2SLS
specification to control for endogeneity.
Across all specifications, conclusions are similar to those from the figures: mutual funds
appear to be providing incremental capital to companies, rather than merely representing a substitute
for VC investments. Across the full sample of 74,839 VC rounds, of which 183 include mutual fund
investment, Column 1 indicates that rounds with mutual fund participation are significantly higher.
Columns 2 – 4 restrict the sample to the 537 funding rounds across the 121 unique VC-backed
companies with mutual fund investments that we are able to match to financing rounds listed in
CrunchBase. Across these 537 funding rounds, 136 include mutual fund participation.24 Column 2,
which like Column 1 shows an OLS regression, similarly shows that rounds with mutual fund
participation are significantly higher.
23 Because this figure does not require detail on the series, which is not available for all mutual fund investments, we match to VentureXpert to better enable us to use all available data. 24 The decreased number of rounds with mutual fund participation in Col 2 compared to Col 1 stems from the lower coverage of CrunchBase versus VentureXpert + restricting sample to firms with mutual fund investment at some point.
25
To control for the possibility that the rounds in which mutual funds participate are larger for
reasons other than the mutual funds’ participation per se, Columns 3 and 4 utilize a 2SLS approach.
We note that the most likely source of endogeneity in this context is correlated omitted variables, i.e.,
if the investment by the mutual fund is correlated with other factors that we do not observe and
which cause round size to be larger. Because the sample is defined such that every firm has mutual
fund investment at some point, time-invariant correlated omitted variables should not be a concern.
We require an instrument that is correlated with mutual funds’ decision of whether to participate in a
round (the relevance condition) but not correlated with firm characteristics that potentially affect the
round amount (the exclusion condition). Based on both a broad academic literature on the value of
connections and conversations with mutual fund managers and venture capitalists, we argue that the
existence of connections between mutual funds and the VC(s) that have provided funding to the firm
as of a particular point in time satisfy these conditions.
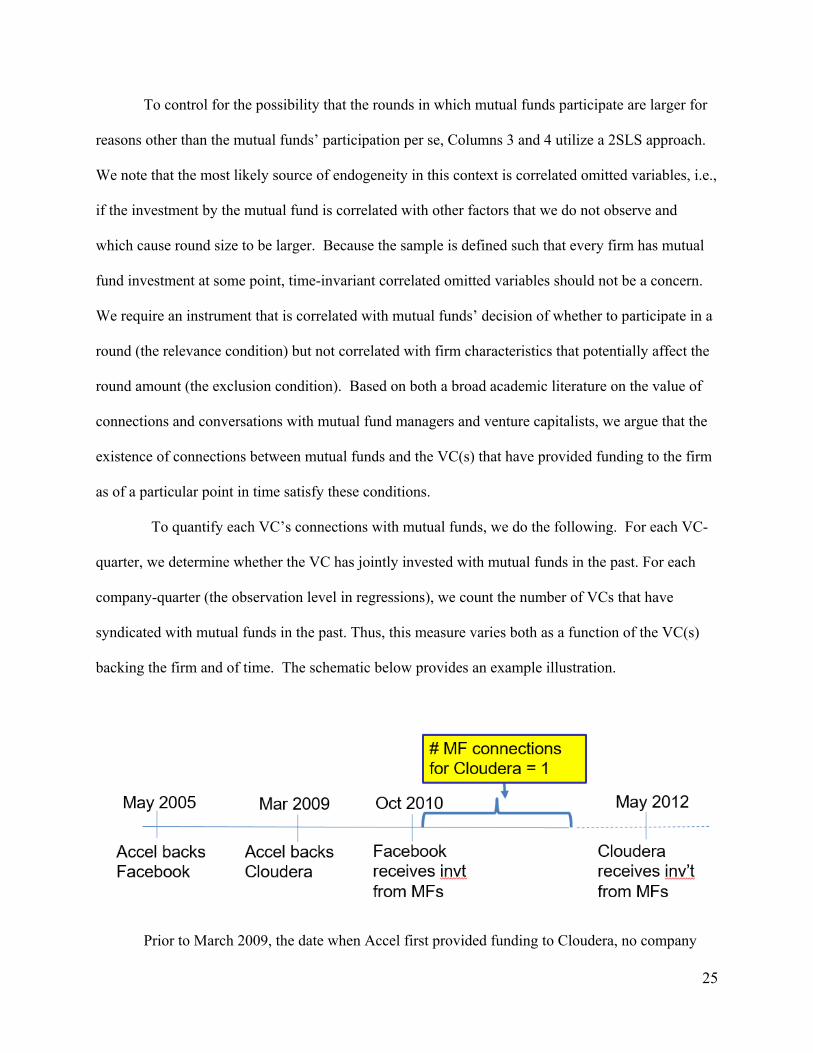
To quantify each VC’s connections with mutual funds, we do the following. For each VC-
quarter, we determine whether the VC has jointly invested with mutual funds in the past. For each
company-quarter (the observation level in regressions), we count the number of VCs that have
syndicated with mutual funds in the past. Thus, this measure varies both as a function of the VC(s)
backing the firm and of time. The schematic below provides an example illustration.
Prior to March 2009, the date when Accel first provided funding to Cloudera, no company
26
backed by Accel had had received funding from mutual funds; thus, Accel had zero mutual fund
connections. However, approximately 1 ½ years after this initial funding to Cloudera, one of Accel’s
portfolio companies, Facebook, received funding from a mutual fund. Thus, for all dates after
October 2010, Accel has a mutual fund connection. Several key factors strengthen this variable as an
instrument. First, because the sample in this regression is limited to firms that received mutual fund
financing in at least one round, identification comes from time-series variation in VCs’ developing a
connection with a mutual fund. The extent to which certain VCs may be more likely to develop such
connections will not influence results because a firm (by definition) is backed by a VC throughout
multiple rounds, but only receives mutual fund financing in a small subset. Second, year, industry,
stage level, and VC round year fixed effects capture many of the time-series trends (mutual fund
investments have increased over time) and cross-sectional patterns (mutual fund investments are
more common among firms at later stages of development) documented earlier.
The relevance condition is satisfied by the fact that a prior relationship with a VC lowers
mutual funds’ research costs: a prior relationship facilitates efficient communication between the VC
and the mutual fund manager, and reputation effects combined with trust built through prior
interactions should make such information credible. In terms of the exclusion condition, we can
think of no reason that a relationship between a company’s VC and a mutual fund manager would
independently be related to changes in a company’s characteristics over time in ways that would
cause certain rounds to be larger than others, particularly after controlling for the time and stage fixed
effects as described above.25
Column 3 of Table 5 shows the first stage regression, where the dependent variable equals
one if the mutual fund participated, zero otherwise. Our instrument, the # mutual fund connections is
25 Note that because all firms in this sample receive mutual fund financing at some point, the identification comes from changes over time in the identity of the VCs financing the firm. As a result, the F-statistic of 9.4 is somewhat low. Subsequent analyses that employ this instrument in broader samples have substantially stronger identification, yet importantly lead to the same overall conclusion.
27
positive as predicted in explaining the likelihood of receiving a mutual fund investment, and it is
highly significant. Conclusions from the second-stage regression are consistent with those from the
OLS specifications. Round amounts that include mutual fund participation are significantly higher.
6. Relation between mutual funds’ investments on companies’ decisions to stay private
To the extent that funds provided by mutual funds represent an incremental source of new
capital, as suggested by findings in the prior section, this funding should enable companies to stay
private longer. While greater access to capital is commonly viewed as a key benefit of going public,
if a company can more easily access capital from other sources while still private then the company
has less of an incentive to go public. Viewing the decision to go public as a trade-off between the
benefits of public listing versus the benefits of private status, a decrease in the benefits of public
listing should tilt the scale toward staying private longer. As discussed by Asker, Farre-Mensa and
Ljungqvist (2015) and Farre-Mensa (2015), the benefits to being private are substantial, e.g., fewer
regulatory requirements, fewer mandated filings, less pressure to meet short-term targets, etc.
We examine this conjecture in a series of steps. First, we examine if companies in which
mutual funds have invested have a higher probability of successfully exiting, via either IPO or M&A
(Table 6). Second, we examine if conditional on exiting, mutual fund financing enables companies
to stay private longer (Table 7). Finally, we extend our analysis to the entire sample, which includes
companies that have successfully exited, active private companies, and companies that are defunct
(Tables 8 and 9). Throughout we estimate both OLS regressions to obtain a sense of the strength and
direction of association and 2SLS specifications that control for endogeneity.
We begin in Table 6 by examining the relation between mutual fund investments and
company outcomes. All else equal, we expect mutual funds to invest in companies that are less
likely to fail. This prediction is based on several factors. First, to the extent that VCs have a
repeated game relationship with mutual funds, the VCs are unlikely to recommend firms with a high
28
probability of failure. Second, results in earlier sections demonstrated that mutual funds tend to
invest in companies with stronger indications of success, for example as proxied by patenting.
Table 6 shows cross-sectional regressions, where the dependent variable equals one of three
measures of company outcome: IPO, M&A, and failure, defined as not having either exited or
received a financing round for four consecutive years. The decision to classify firms as failed if they
do not receive a financing round for four consecutive years is based on the distribution of financing
rounds across our sample. The median time between rounds is 0.8 years, and the 90% percentile is
2.26 years. It is unavoidable, however, that this classification produces both Type I and Type II
errors. Some companies actually fail within a relatively short amount of time after the last financing
round, meaning for example that a company with a financing round in 2013 could have failed by
2014, yet we would not define it as such. In addition, there are some cases where a company
successfully exits after the four-year cutoff, but is still classified as failed according to our algorithm.
Across the 13,424 cases that our definition classifies as failures, 1,175 (8.75%) actually successfully
exit, i.e., they exit more than four years after the last financing round.
Regressions in Columns 1, 2, and 3 employ the full sample of 28,637 companies that
received their first VC financing round during the 1990 – 2016 period. Columns 4 – 6 show
analogous regressions, but are limited to the 1995 – 2010 period, as there were few mutual fund
investments in the earlier years and ending in 2010 gives companies more time to successfully exit.
Independent variables previously used in Table 3 are included as controls.
Consistent with predictions, Columns 1 and 4 show that companies with mutual fund
financing are significantly less likely to fail. As these are OLS regressions, this potentially
incorporates two effects: a selection effect under which mutual funds are less likely to invest in
companies that subsequently fail, and a treatment effect under which the capital provided by mutual
29
funds gives companies more flexibility to continue operations until they can successfully exit.26
Additional columns in Table 6 also provide strong evidence that companies with mutual fund
financing are significantly more likely to exit via IPO but significantly less likely to exit via M&A.
This again potentially reflects both a selection effect and a treatment effect. Regarding the former,
mutual funds likely strive to invest in those companies that will ultimately provide the largest
payoffs, i.e., in companies that will go public via IPO. Many of the VC-backed companies that are
acquired are acquired at relatively low valuations, and might be more accurately categorized as
failures. Chaplinsky and Gupta-Mukherjee (2016) find that the median VC-backed firm that exits via
acquisition results in a 31% loss, versus a 141% gain for the median IPO. There is also a possible
treatment effect where the money provided by mutual funds enables companies to develop to a scale
necessary to survive as an independent public firm.27 Gao et al. (2013) and Grullon et al (2017)
suggest that changes in the market since 2000, for example globalization and increased economies of
scale, have made it difficult for small companies to operate as independent public firms. Our
findings are consistent with the capital provided by mutual funds assisting companies to stay private
long enough to achieve a sufficient size and stage of development to go public via an IPO.
Figure 7 and Table 7 examine whether those companies with mutual fund financing were
private for a longer time prior to exit. Looking first at Panel A of Figure 7, we classify companies
into one of four categories: companies with their first VC financing round over the 1990 – 2000 and
2001 – 2010 periods that exited via IPO, and companies over each of these periods that exited via
26 The concentration of mutual fund investments in the years following the Crash of the Internet Bubble and following the Financial Crisis provide some support for a treatment effect. 27 There is also anecdotal evidence that in more recent years, mutual funds investing in private companies have included ratchet clauses and blocking rights in the funding agreements, which provide mutual funds with certain downside protections. Ratchet clauses require companies to issue mutual funds additional shares if the IPO price is below a certain level, and blocking rights mean that investors’ preferred stock only converts automatically into common stock if the IPO price is above a certain level. See, e,g., Square Pays $93 Million Penalty to Some Investors in IPO, Nov 18, 2015, WSJ (http://blogs.wsj.com/digits/2015/11/18/square-pays-93-million-penalty-to-some-investors-in-ipo/) and http://www.law360.com/articles/758292/unicorn-investors-securing-safety-nets-in-shaky-ipo-market .
30
M&A. Across all four groups, the companies with mutual fund financing stayed private substantially
longer. Panel B shows a kernel density plot of time to exit among companies without (solid line)
and with (dashed line) mutual fund financing. Consistent with conclusions from Panel A, the density
of companies with mutual fund financing lies to the right, indicating that these companies tend to
stay private longer.
Table 7 examines these relations in a regression framework, using either the full sample of
venture-backed companies that have exited via IPO or M&A (cols 1 – 3) or a matched sample where
companies with mutual fund financing are matched with those that never obtained such financing
(cols 4 – 9). To form the matched sample, we employ a propensity score approach based on the
regression in Column 1 of Table 3. We match each firm with mutual fund investment to the five
firms without mutual fund investment that have the closest fitted values, subject to the additional
requirement that treated firms and control firms have the same first VC round year and be in the
same industry; we do not use repeated sampling. Columns 1 – 6 employ OLS regressions, and
columns 7 – 9 represent 2SLS regressions that control for endogeneity.28
For the 2SLS regression, we use the number of VCs with mutual fund interaction in the past
as an instrument, as defined previously. Here, the exclusion criterion requires that mutual funds’
relationships with VCs not directly affect time to exit. One concern might be that higher quality
VCs are more likely to have such relationships. However, such an effect would likely bias us
against finding that mutual fund financing enables companies to stay private longer: Hochberg
et al (2007) and Nahata (2008) find that higher quality VCs take their portfolio companies faster.
We find similar effects within our sample: companies backed by higher quality VCs (defined as
28 We employ the matched sample in our 2SLS analysis because the higher power provides stronger identification. Relative to the population, this equates to oversampling firms with mutual fund financing. While this potentially biases first -stage probabilities of mutual fund financing, Palepu (1986, p. 8) notes that such a bias does not affect the relative ranking of firms’ probabilities of receiving such financing. Because the first-stage estimated probability is a monotonic transformation of the ‘true’ probability, it is still a reasonable proxy. See Field, Lowry and Shu (2005) for a similar application.
31
above-median % of investments that exit via IPO or acquisition) have an average time-to-exit of
4.9 years, compared to 5.0 years among lower quality VCs. More specifically, we find no
difference between average time-to-exit of all investments by VCs with (4.9 years) versus
without (4.9 years) mutual fund-backed companies.
Across all specifications in Table 7, the dependent variable is the log of time to exit,
measured as the number of years between the first VC round and either IPO or M&A. We employ
three measures of mutual fund participation: a dummy equal to one if a mutual fund invested in the
company at some point (cols 1, 4, and 7), the log of the amount of capital invested by mutual funds
(cols 2, 5, and 8; note that these columns have fewer observations because some mutual funds do not
report acquisition cost), and the number of mutual funds that invested in the company (cols 3, 6, and
9). Each regression includes control variables and fixed effects used in previous tables. In addition,
the full sample regressions also include lead VC fixed effects. We define the lead VC as the VC that
participated in the first round and made the largest total investment in the company across all rounds
of funding (see Nahata, 2008). When there are ties (multiple VCs participate in the first VC round
and invest the same amount across all rounds), we choose the VC that participated in a greater
number of rounds.29
OLS regressions in columns 1 and 4 indicate that companies with mutual fund investment
stay private 19 – 20% longer, which translates into approximately one year (based on a mean time to
exit of 4.9 years). As discussed previously, this includes both a selection effect and a treatment
effect, whereas the 2SLS regression in Column 7 isolates the treatment effect. Looking at Column 7,
our finding that the 2SLS coefficient is greater than the OLS coefficient provides some evidence that
the selection effect is negative, i.e., funds are choosing to invest in companies that would tend to go
29 Because we use lead VC fixed effects, we drop a small number of cases in which a VC served as lead for only one company - we need at least 2 observations per lead VC. We do not include lead VC fixed effects in the matched sample regressions because this sample contains many instances in which a lead VC is only represented one time, meaning we would lose a substantial number of observations.
32
public sooner.30 This would be consistent with mutual funds focusing on high growth companies that
(in the absence of other sources of financing) would seek to go public relatively soon in order to
obtain capital to fund positive NPV opportunities. The 2SLS specification suggests that the mutual
fund investment enables these companies to stay private for approximately 2.35 more years. This is
equivalent to staying private through 1 – 2 more funding rounds, a seemingly plausible magnitude.
In fact, among the companies that exited via IPO or M&A during our sample period, the 136
companies with pre-IPO mutual fund financing have an average (median) of 5.86 (5.0) rounds,
compared to 3.64 (3.0) rounds for the firms without pre-IPO mutual fund financing.
It is also possible that this magnitude is overstated, because it captures a local average
treatment effect (LATE) rather than an average treatment effect (ATE). There are presumably some
companies that have an extremely high likelihood of receiving mutual fund financing, regardless of
whether their VC has a prior relationship with a mutual fund, e.g., companies such as Uber, Dropbox
and AirBNB that are both large and common household names. Analogously, there are other
companies with a close to zero probability of receiving mutual fund financing, regardless of whether
their VC has a prior mutual fund relationship, e.g., because their business is not on a successful
growth path and the probability of failure is high. Identification comes off the marginal cases, and
these cases arguably represent the companies that would benefit most from the flexibility to stay
private longer and for whom the additional capital enables them to pursue this option.
Results in other columns present consistent conclusions. Greater capital invested by mutual
funds and participation by a greater number of mutual funds both are associated with longer time to
exit (as indicated by the OLS specifications) and specifically enable the company to stay private
longer (as indicated by the 2SLS specifications).
30 It is also possible that the finite sample bias of 2SLS contributes to the higher coefficient in the 2SLS specification. However, back-of-the-envelope calculations based on derivations in Hahn and Hausman (2005) suggest this is unlikely to be a major factor.
33
Table 8 presents an even stronger test of the effects of mutual fund investment on time spent
in private status. Table 8 shows panel regressions, where the sample consists of the 571,793
company-quarter observations across the 28,637 private companies that received VC financing for
the first time over the 1990 – 2016 period. The panel regression specification is an alternative to
duration models (see, e.g., Shumway 2001) that enables the use of a two-stage approach to control
for endogeneity.31 Each period, the dependent variable equals one if the company successfully exited
that period and zero if the company is still an ‘active private company’, which is defined as having
had a VC round within the prior four years and not having exited. Companies leave the sample after
they either exit or go four years without a funding round.32
We employ the same three measures of mutual fund participation as were used in Table 7: a
dummy equal to one if at least one mutual fund provided financing to the company, the log of capital
invested by mutual funds in the company, and the number of mutual fund investors in the company.
For each, we first estimate a first-stage regression using the number of VCs with a mutual fund
connection as the instrument, as defined earlier. In each of these first-stage regressions, the
instrument is significant at the 1% level and the F-statistic for identification is well above the critical
value of 10. The second-stage regressions show consistent evidence of mutual fund participation
contributing to the company staying private longer. In economic terms, Column 2 suggests that a
company with mutual fund financing has a 6.03% lower probability of exiting in any given quarter.
Column 2 suggests that $10 million funding by mutual funds decreases the probability of going
public in a quarter by 6.5%.33 Finally, one additional mutual fund investing in the company decreases
31 To enable the inclusion of fixed effects, we employ OLS rather than the logit specification used by Shumway. 32 As discussed earlier, this results in some misclassifications, e.g., companies that fail less than 4 years after the prior funding round will be classified as ‘active’ for too long, and companies that successfully exit after 4 years will be incorrectly classified as ‘failed’. In addition, it also causes us to incorrectly identify 20 firms as never having received mutual fund financing, because they received this financing more than 4 years after the previous financing round; thus the sample identifies 239 firms (instead of 259) as having mutual fund financing. Such misclassifications lessen the power of our tests by increasing standard errors, but should not bias results in any one direction. 33 Ln(10 + 1)*-0.027 = -0.06474.

34
the probability of going public in a quarter by 1.4%. These results that mutual fund financing
contributes to a lower probability of exit in any one quarter, combined with previous results in Table
6 showing that companies with mutual fund investment are more likely to successfully exit, provide
strong basis to conclude that mutual fund investments enable companies to stay private longer.
One potential weakness of the Table 8 analysis relates to our inability to definitely determine
when a company has failed. To avoid misclassifying too many firms as failed when they actually
successfully exit, we allow firms to go four years without a funding round before they are classified
as failed. To evaluate the sensitivity of results to this classification, we estimate on ordered probit
model where the dependent variable takes one of four possible values: 1 if the company fails
(defined as having the last funding round more than four years ago and not having exited during this
period), 2 if the company’s outcome is uncertain at that point in time (defined as not having exited,
and having the last funding round more than two years ago but less than four years ago), 3 if the
company is still private and active (defined as having the last funding round within the past two
years), and 4 if the company exits via IPO or acquisition. Figure 8 shows the distribution of these
four outcomes, across those firms with versus without mutual fund participation.
In addition to producing a coefficient on each measure of mutual fund participation, the
ordered probit generates cutoff values. As shown at the bottom of Table 9, mutual fund participation
is associated with a lower probability of being in the uncertain status and a higher probability of
being active but still private. By design, most firm-quarters are designated as either uncertain or
active. Each firm can only fail or exit once, meaning that for each firm only one quarter will be
identified as failure or exit and all other quarters will be identified as active or uncertain. Thus, the
finding that mutual fund investments are associated with a higher probability of being in active status
is consistent with these companies both having a higher probability of ultimately successfully exiting
but taking a longer time to do so.
35
7. Benefits to Mutual funds
Mutual funds’ decisions to invest in private firms contrasts with their traditional focus on
public firms. In this section we provide some back-of-the-envelope evidence on their experience in
this sector. Compared to public firms, private firms are substantially riskier and have much higher
information asymmetry. Moreover, investors lack the benefit of a publicly observable stock price,
which serves as an aggregate measure of market participants’ overall valuation.
First, we examine the percent of their investments that have successfully exited and the
returns across the subset that exited via IPO. Across the 139 unique mutual funds that invested in
VC-backed private firms over the sample period, we tabulate the percent of each fund’s investments
that exited via either IPO or acquisition and the returns on the subset of firms with exited via IPO.
Panel A of Table 10 shows that the average (median) mutual fund exited 42.6% (33.3%) of its
investments via IPO and 10.1% (0%) of its investments via acquisition. Because firms that were
founded later in the sample period have a lower probability of exiting, we tabulate similar measures
across three sub-periods: firms with a first VC round date during 1990 – 2000, during 2001 – 2010,
and during 2011 – 2016. The exit rates are highest in the middle subperiod, a period during that both
includes greater participation and allows sufficient time for exit. During this subperiod, the mean
(median) fund exited 49.2% (47.7%) of its exits via IPO and 4.1% (0%) via acquisition.
Panel B tabulates mutual funds’ returns, across the subset of its private firm investments
that exited via IPO. Row 1 shows that the average (median) fund earns a raw return of 320.5%
(149.8%) on its private firm investments, where return is calculated as
. Not surprisingly, these investments are held for varying
amounts of time, and thus we also report statistics on funds’ monthly returns in these investments.
On a monthly basis, the average fund earns 10.4%, however the distribution is highly skewed. The
median fund earns a much lower 4.9%, and the first and third quartiles equal 2.9% and 10.5%,
36
respectively. Together Panels A and B highlight the extent to which the subset of investments that
are most successful generate quite high returns, but only a fraction of investments are ultimately so
successful. For the median fund where approximately half of its investments exit via IPO (from
Panel A) and which earned a 4.9% monthly return on the subset of cases that went public,
performance on this subset of investments would still be an impressive 2.5% per month.
An additional challenge for mutual funds investing in these private firms relates to the
valuations of these investments. Mutual funds are required to update their valuations on a regular
basis, and the popular press has drawn attention to the disagreement among funds regarding these
valuations. For example, a 2015 WSJ article highlights the varying valuations of Uber, with
Blackrock valuing it at $40.03 per share, Hartford Financial Services at $35.67, and Fidelity
Investments at $33.32.34 In potential contrast to such disagreement, mutual fund managers state that
valuations are based on various criteria, at least some of which are largely observable. For example,
each funding round causes a valuation, and this valuation is observable to all investors. Moreover,
mutual fund investors generally also have board observation rights and access to all internal
documents associated with such Board meetings. Thus any valuation-relevant material contained
therein would be available to all these investors.
Panel C of Table 10 examines this issue by calculating the dispersion in valuation across the
134 private firms with more than one mutual fund investor, on a semi-annual basis (i.e., at each 6-
month interval for which there are multiple mutual fund investors). Our findings show that there is
complete agreement regarding valuations in the vast majority of cases, but relatively large
disagreement among a small subset of cases. For the median firm-period, dispersion in valuation,
measured as
, equals zero. It equals 7% at the 75th percentile, 34%
at the 90th percentile, and 102% at the 95th percentile. In sum, there is perhaps a surprisingly small
34 ‘Mutual Funds Flail at Valuing Hot Startups Like Uber’, WSJ Oct 29, 2015.
37
amount of disagreement in most cases, a phenomena that arguably reflects the extent to which
verifiable information such as the valuation at the latest funding round dictates mutual fund
valuations. However, there is a very large among of disagreement in a relatively small subsample.
8. Conclusion
Public listing status offers both advantages and disadvantages. Public firms potentially
benefit from greater availability of capital, including for example a lower cost of capital (Brav, 2009;
Gilje and Taillard, 2016). However, increased regulatory burdens and pressure from investors for
short-term results can represent nontrivial costs for public firms (Asker, Farre-Mensa and Ljungqvist,
2015). Firms’ decisions of when to go public represent a trade-off between the benefits and costs
and public listing. It follows that if the benefits of going public fall for a private firm, then that firm
should opt to stay private longer.
Consistent with greater capital availability being a benefit of public listing, Lowry (2003)
concludes that more companies go public during periods when firms’ demands for capital are higher.
However, results in this paper demonstrate that the availability of capital to private firms in the form
of investments by mutual funds has increased dramatically over the past 15 years. We note that this
trend is consistent with changes in the financial landscape over this time period, including both
regulatory changes and decreasing costs of collecting information about opaque firms. This
increased availability of capital to private firms suggests that demands for capital should motivate
fewer companies to go public at any point in time. The drop in the number of companies going
public is consistent with this conjecture.

38
Appendix I
A. Additional details on obtaining mutual funds’ holdings in private firms
The process of matching mutual funds’ holdings of restricted securities to our sample of private, venture-backed firms involves many complications, beyond those described within the main body of the paper. The purpose of this appendix is to provide additional detail, which may be helpful to future researchers.
In addition to verifying that a mutual fund has an investment in a private company, we also need to determine if the investment represents equity. While mutual funds’ investments in private startups are classified as restricted securities, not all restricted securities are investments in private companies. For example, PIPEs (Private Investment in Public Equity), newly public firms’ shares before the lockup expiration date, corporate bonds or notes with restricted conditions, investments in foreign countries, etc., are all classified under restricted securities. Using Python programming, we create a debt dummy = 1 if the filing contains wordings such as bond, note, term loan, tranche, etc. in the neighborhood of company name. In a similar way, we create an equity dummy = 1 if the filing contains wordings such as common, class A, class B, preferred, etc., in the neighborhood of company name. After creating these dummies, we manually check whether the investments are equity investments. Through this combination of Python and hand verification, we isolate equity investments.
In addition to matching fund holdings with firms on a semi-annual basis, we also wish to track individual funds over time. This is complicated by several issues: multiple funds report their holdings within a single filing (i.e., the reported filing is based on the CIK level rather than the fund level) and funds can change their names. To overcome this problem, we use the EDGAR-assigned series number provided to each fund, as this series number remains the same even if the fund changes names.35 For example, CIK 0000024238 corresponds to Fidelity Contrafund. There are 4 funds that report filings under this CIK: Fidelity Advisor New Insights Fund (S000006036), Fidelity Contrafund (S000006037), Fidelity Series Opportunistic Insights Fund (S000039220), and Fidelity Advisor Series Opportunistic Insights Fund (S000039221). The characters in parenthesis represent series numbers. Because series numbers are provided beginning in 2006, we backfill series numbers for funds for the period 1995-2005. In cases where names are similar but not exact, we verify manually. This backfill is only possible if the same fund exists before and after 2005. If a fund only exists prior to 2005, we assign a pseudo series number.
35 This is confirmed by David Marcinkus, the branch chief at the SEC as of August 2016.
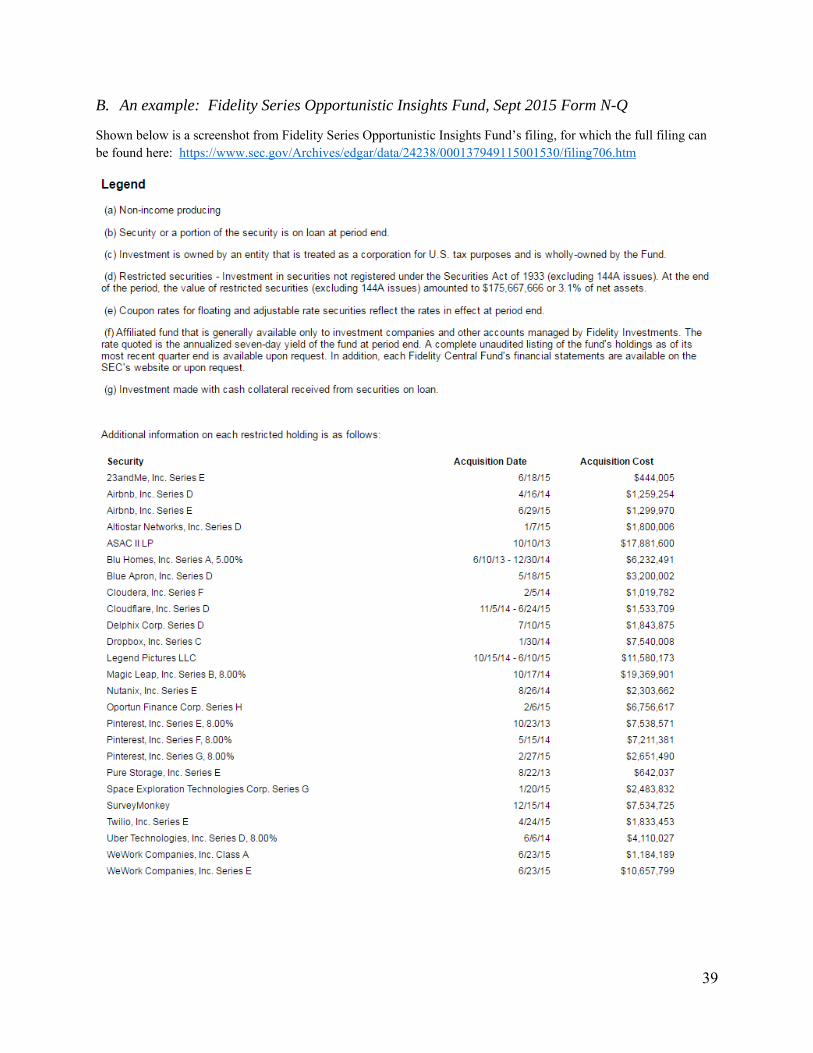
39
B. An example: Fidelity Series Opportunistic Insights Fund, Sept 2015 Form N-Q
Shown below is a screenshot from Fidelity Series Opportunistic Insights Fund’s filing, for which the full filing can be found here: https://www.sec.gov/Archives/edgar/data/24238/000137949115001530/filing706.htm
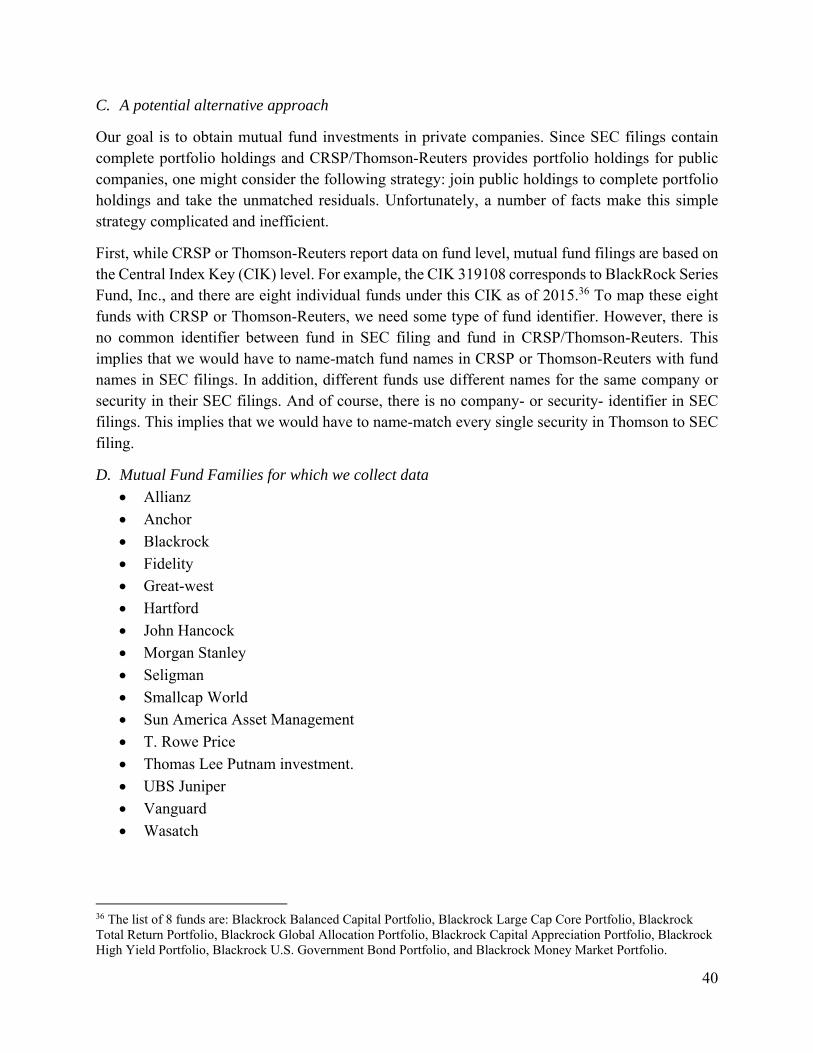
40
C. A potential alternative approach
Our goal is to obtain mutual fund investments in private companies. Since SEC filings contain complete portfolio holdings and CRSP/Thomson-Reuters provides portfolio holdings for public companies, one might consider the following strategy: join public holdings to complete portfolio holdings and take the unmatched residuals. Unfortunately, a number of facts make this simple strategy complicated and inefficient.
First, while CRSP or Thomson-Reuters report data on fund level, mutual fund filings are based on the Central Index Key (CIK) level. For example, the CIK 319108 corresponds to BlackRock Series Fund, Inc., and there are eight individual funds under this CIK as of 2015.36 To map these eight funds with CRSP or Thomson-Reuters, we need some type of fund identifier. However, there is no common identifier between fund in SEC filing and fund in CRSP/Thomson-Reuters. This implies that we would have to name-match fund names in CRSP or Thomson-Reuters with fund names in SEC filings. In addition, different funds use different names for the same company or security in their SEC filings. And of course, there is no company- or security- identifier in SEC filings. This implies that we would have to name-match every single security in Thomson to SEC filing.
D. Mutual Fund Families for which we collect data
Allianz
Anchor
Blackrock
Fidelity
Great-west
Hartford
John Hancock
Morgan Stanley
Seligman
Smallcap World
Sun America Asset Management
T. Rowe Price
Thomas Lee Putnam investment.
UBS Juniper
Vanguard
Wasatch
36 The list of 8 funds are: Blackrock Balanced Capital Portfolio, Blackrock Large Cap Core Portfolio, Blackrock Total Return Portfolio, Blackrock Global Allocation Portfolio, Blackrock Capital Appreciation Portfolio, Blackrock High Yield Portfolio, Blackrock U.S. Government Bond Portfolio, and Blackrock Money Market Portfolio.
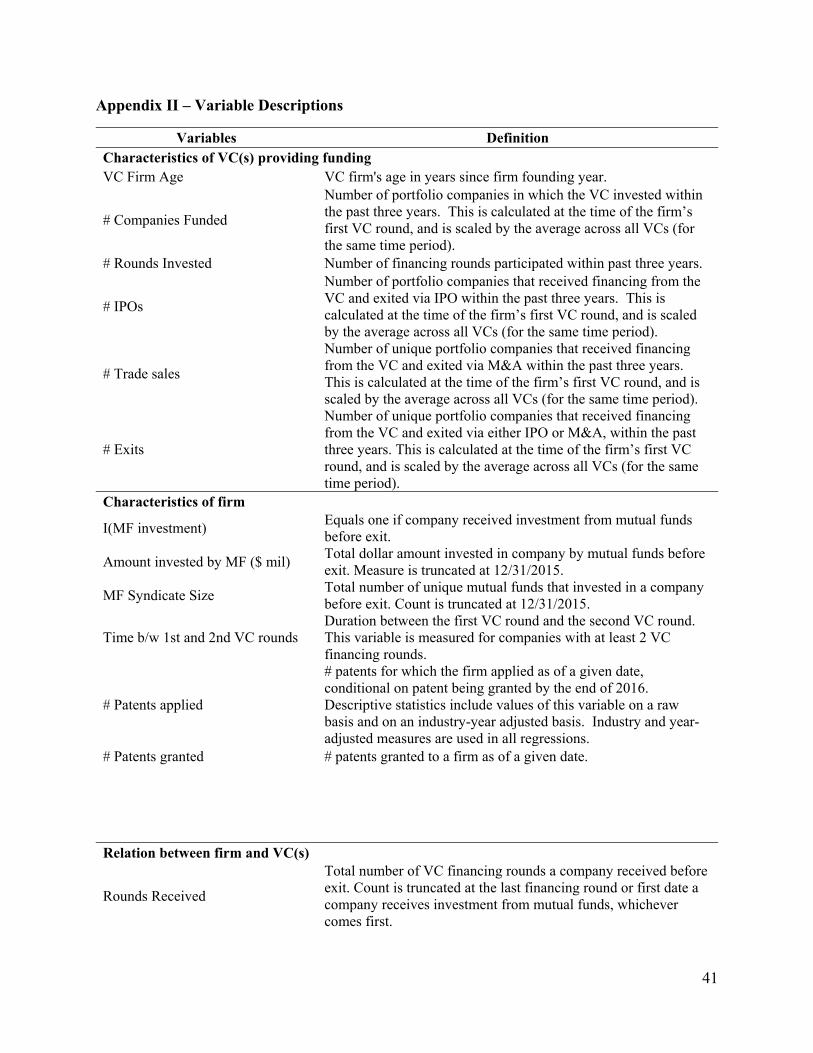
41
Appendix II – Variable Descriptions
Variables Definition Characteristics of VC(s) providing funding VC Firm Age VC firm's age in years since firm founding year.
# Companies Funded
Number of portfolio companies in which the VC invested within the past three years. This is calculated at the time of the firm’s first VC round, and is scaled by the average across all VCs (for the same time period).
# Rounds Invested Number of financing rounds participated within past three years.
# IPOs
Number of portfolio companies that received financing from the VC and exited via IPO within the past three years. This is calculated at the time of the firm’s first VC round, and is scaled by the average across all VCs (for the same time period).
# Trade sales
Number of unique portfolio companies that received financing from the VC and exited via M&A within the past three years. This is calculated at the time of the firm’s first VC round, and is scaled by the average across all VCs (for the same time period).
# Exits
Number of unique portfolio companies that received financing from the VC and exited via either IPO or M&A, within the past three years. This is calculated at the time of the firm’s first VC round, and is scaled by the average across all VCs (for the same time period).
Characteristics of firm
I(MF investment) Equals one if company received investment from mutual funds before exit.
Amount invested by MF ($ mil) Total dollar amount invested in company by mutual funds before exit. Measure is truncated at 12/31/2015.
MF Syndicate Size Total number of unique mutual funds that invested in a company before exit. Count is truncated at 12/31/2015.
Time b/w 1st and 2nd VC rounds Duration between the first VC round and the second VC round. This variable is measured for companies with at least 2 VC financing rounds.
# Patents applied
# patents for which the firm applied as of a given date, conditional on patent being granted by the end of 2016. Descriptive statistics include values of this variable on a raw basis and on an industry-year adjusted basis. Industry and year-adjusted measures are used in all regressions.
# Patents granted # patents granted to a firm as of a given date. Relation between firm and VC(s)
Rounds Received
Total number of VC financing rounds a company received before exit. Count is truncated at the last financing round or first date a company receives investment from mutual funds, whichever comes first.
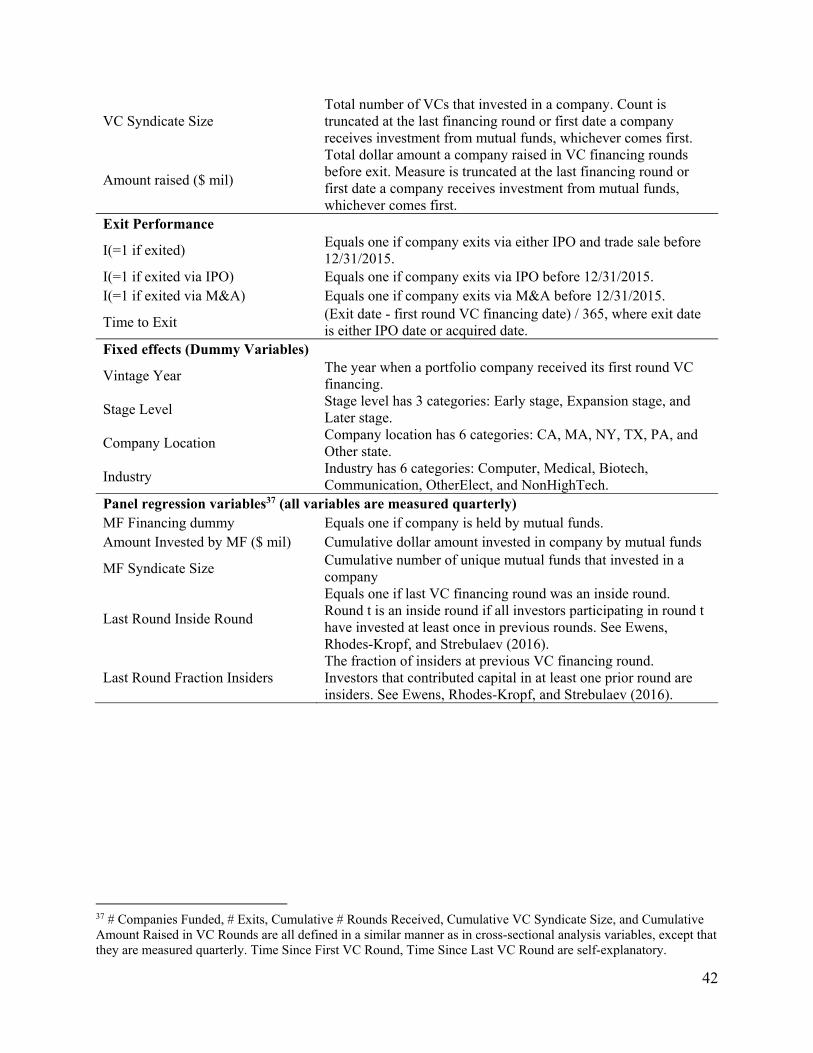
42
VC Syndicate Size Total number of VCs that invested in a company. Count is truncated at the last financing round or first date a company receives investment from mutual funds, whichever comes first.
Amount raised ($ mil)
Total dollar amount a company raised in VC financing rounds before exit. Measure is truncated at the last financing round or first date a company receives investment from mutual funds, whichever comes first.
Exit Performance
I(=1 if exited) Equals one if company exits via either IPO and trade sale before 12/31/2015.
I(=1 if exited via IPO) Equals one if company exits via IPO before 12/31/2015. I(=1 if exited via M&A) Equals one if company exits via M&A before 12/31/2015.
Time to Exit (Exit date - first round VC financing date) / 365, where exit date is either IPO date or acquired date.
Fixed effects (Dummy Variables)
Vintage Year The year when a portfolio company received its first round VC financing.
Stage Level Stage level has 3 categories: Early stage, Expansion stage, and Later stage.
Company Location Company location has 6 categories: CA, MA, NY, TX, PA, and Other state.
Industry Industry has 6 categories: Computer, Medical, Biotech, Communication, OtherElect, and NonHighTech.
Panel regression variables37 (all variables are measured quarterly) MF Financing dummy Equals one if company is held by mutual funds. Amount Invested by MF ($ mil) Cumulative dollar amount invested in company by mutual funds
MF Syndicate Size Cumulative number of unique mutual funds that invested in a company
Last Round Inside Round
Equals one if last VC financing round was an inside round. Round t is an inside round if all investors participating in round t have invested at least once in previous rounds. See Ewens, Rhodes-Kropf, and Strebulaev (2016).
Last Round Fraction Insiders The fraction of insiders at previous VC financing round. Investors that contributed capital in at least one prior round are insiders. See Ewens, Rhodes-Kropf, and Strebulaev (2016).
37 # Companies Funded, # Exits, Cumulative # Rounds Received, Cumulative VC Syndicate Size, and Cumulative Amount Raised in VC Rounds are all defined in a similar manner as in cross-sectional analysis variables, except that they are measured quarterly. Time Since First VC Round, Time Since Last VC Round are self-explanatory.
43
References
Agarwal, V., Mullally, K. A., Tang, Y., & Yang, B. (2015). Mandatory portfolio disclosure, stock liquidity, and mutual fund performance. The Journal of Finance, 70(6), 2733-2776.
Akerlof, G. (1970). The market for lemons: qualitative uncertainty and market mechanism. Quarterly Journal of Economics, 89.
Asker, J., Farre-Mensa, J., & Ljungqvist, A. (2014). Corporate investment and stock market listing: a puzzle?. Review of Financial Studies, 28(2), 342-390.
Bernstein, S., (2015). Does going public affect innovation? Journal of Finance 70, 1365 – 1403.
Booth, J. R., & Smith, R. L. (1986). Capital raising, underwriting and the certification hypothesis. Journal of Financial Economics, 15(1), 261-281.
Brau, J. C., & Fawcett, S. E. (2006). Initial public offerings: An analysis of theory and practice. The Journal of Finance, 61(1), 399-436.
Brav, O. (2009). Access to capital, capital structure, and the funding of the firm. The Journal of Finance, 64(1), 263-308.
Chaplinsky, S., Gupta-Mukherjee, S., 2016. Investment risk allocation and the venture capital exit market: evidence from early stage investing. Journal of Banking and Finance 73, 38-54.
Chen, H., Gompers, P., Kovner, A., & Lerner, J. (2010). Buy local? The geography of venture capital. Journal of Urban Economics, 67(1), 90-102.
Chernenko, S., Lerner, J., Zeng, Yl, 2017. Mutual funds as venture capitalists? Evidence from unicorns. Working paper.
Coval, J., Moskowitz, T., 2001. The geography of investment: informed trading and asset prices. Journal of Political Economy (109), 811–841.
Dambra, M., Field, L. C., & Gustafson, M. T. (2015). The JOBS Act and IPO volume: Evidence that disclosure costs affect the IPO decision. Journal of Financial Economics, 116(1), 121-143.
Denes, M., (2017). Why do firms risk shift? Evidence from venture capital. Working paper.
Doidge, C., Karolyi, G. A., & Stulz, R. M. (2015). The US listing gap (No. w21181). National Bureau of Economic Research.
Edmans, A., Goldstein, I., & Jiang, W. (2012). The real effects of financial markets: The impact of prices on takeovers. The Journal of Finance, 67(3), 933-971.
Ewens, M., Rhodes-Kropf, M., & Strebulaev, I. A. (2016). Insider Financing and Venture Capital Returns.
44
Ewens, M., Nanda, R., and Rhodes-Kropf, M., (2017) Cost of experimentation and the evolution of venture capital. Journal of Financial Economics, forthcoming.
Gao, X., Ritter, J. R., & Zhu, Z. (2013). Where have all the IPOs gone?. Journal of Financial and Quantitative Analysis, 48(06), 1663-1692.
Gilje, E. P., & Taillard, J. P. (2016). Do private firms invest differently than public firms? Taking cues from the natural gas industry. The Journal of Finance.
Grullon, G., Larkin, Y., Michaely, R., (2017). Are U.S. industries becoming more concentrated? Working paper.
Hahn, J., Hausman, J., (2005). Estimation with valid and invalid instruments. Annales d’economie et de statistique 79/80, 25 – 57.
Hall, B., Jaffe, A., Trajtenberg, (2001). The NBER patent citations data file: lessons, insights and methodological tools. Working paper.
Hochberg, Y. V., Ljungqvist, A., & Lu, Y. (2007). Whom you know matters: Venture capital networks and investment performance. The Journal of Finance, 62(1), 251-301.
Hochberg, Y. V., Serrano, C. J., & Ziedonis, R. H. (2014). Patent collateral, investor commitment, and the market for venture lending (No. w20587). National Bureau of Economic Research.
Hong, H., Kubik, J. D., & Stein, J. C. (2005). Thy neighbor's portfolio: Word‐of‐mouth effects in the holdings and trades of money managers. The Journal of Finance, 60(6), 2801-2824.
Ibrahim, D. M. (2012). The new exit in venture capital. Vanderbilt Law Review, 65.
Lerner, J., (1994). Venture capitalists and the decision to go public. Journal of Financial Economics 35, 293 – 316.
Lowry, M. (2003). Why does IPO volume fluctuate so much?. Journal of Financial economics, 67(1), 3-40.
Megginson, W. L., & Weiss, K. A. (1991). Venture capitalist certification in initial public offerings. The Journal of Finance, 46(3), 879-903.
Metrick, A., & Yasuda, A. (2010). Venture capital & the finance of innovation (2nd edition), Wiley 2010.
Metrick, A., & Yasuda, A. (2011). Venture capital and other private equity: a survey. European Financial Management, 17(4), 619-654.
Morningstar Manager Research, (2016). Unicorn hunting: mutual fund ownership of private companies is a relevant, but minor, concern for most investors. December 2016.
45
Nahata, R. (2008). Venture capital reputation and investment performance. Journal of Financial Economics, 90(2), 127-151.
Sahlman, W. 2010. Risk and reward in venture capital. Harvard Business School Note 811-036.
Sørensen, M. (2007). How smart is smart money? A two‐sided matching model of Venture Capital. The Journal of Finance, 62(6), 2725-2762.
Shumway, T. (2001). Forecasting bankruptcy more accurately: A simple hazard model. The Journal of Business, 74(1), 101-124.
Figure 1: Mutual fund investments in private companies.
Panel A shows the number of mutual funds holdings shares in VC-backed companies and the number of VC-backed companies held by mutual funds. Panel B shows the amount of new money invested by funds each year, as indicated by reported acquisition costs, and also the aggregate of mutual funds’ reported valuations of these investments each year. The valuations of mutual funds’ investments is based on the last available filing date in each year, and it is calculated by aggregating funds’ valuations across their investments in VC-backed companies. Data is based on mutual funds’ restricted holdings extracted from EDGAR Form N-30Ds (1995-2005) and Form N-Qs (2006-2016). Panel C shows the percentage of capital provided by mutual funds within each financing round, conditional on financing rounds having at least one mutual fund as a participating investor. Mutual fund investments are matched with funding round information in VentureXpert, where the absolute difference between the mutual fund’s reported acquisition date and the VentureXpert round date is less than 30 days.
Panel A: Number of mutual funds and private companies
Panel B: Dollar Values
02
04
06
08
01
00C
ou
nt
1995 2000 2005 2010 2015Year
# MFs investing in VC-backed companies
# VC-backed companies held by MFs
02
000
400
06
000
800
0$
mil
1995 2000 2005 2010 2015Year
$ New investments of MF investments in private companies
$ Valuation of MF investments in private companies
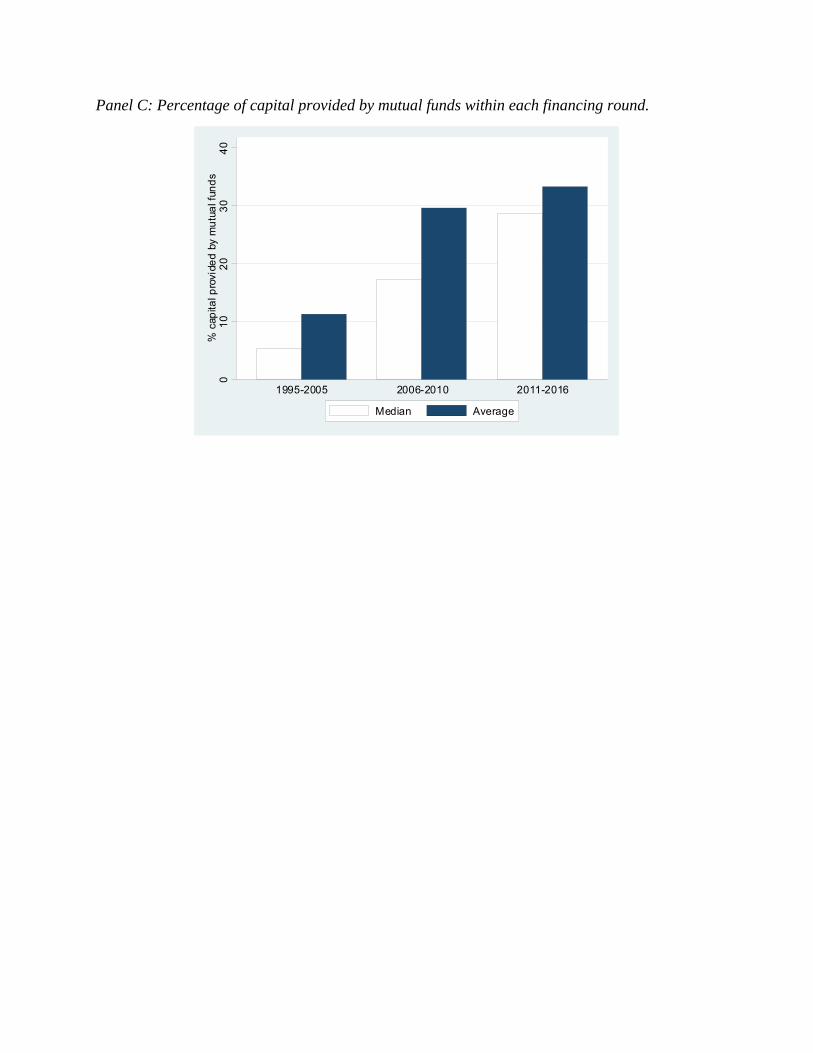
Panel C: Percentage of capital provided by mutual funds within each financing round.
01
02
03
04
0%
cap
ital p
rovi
ded
by
mu
tua
l fun
ds
1995-2005 2006-2010 2011-2016
Median Average
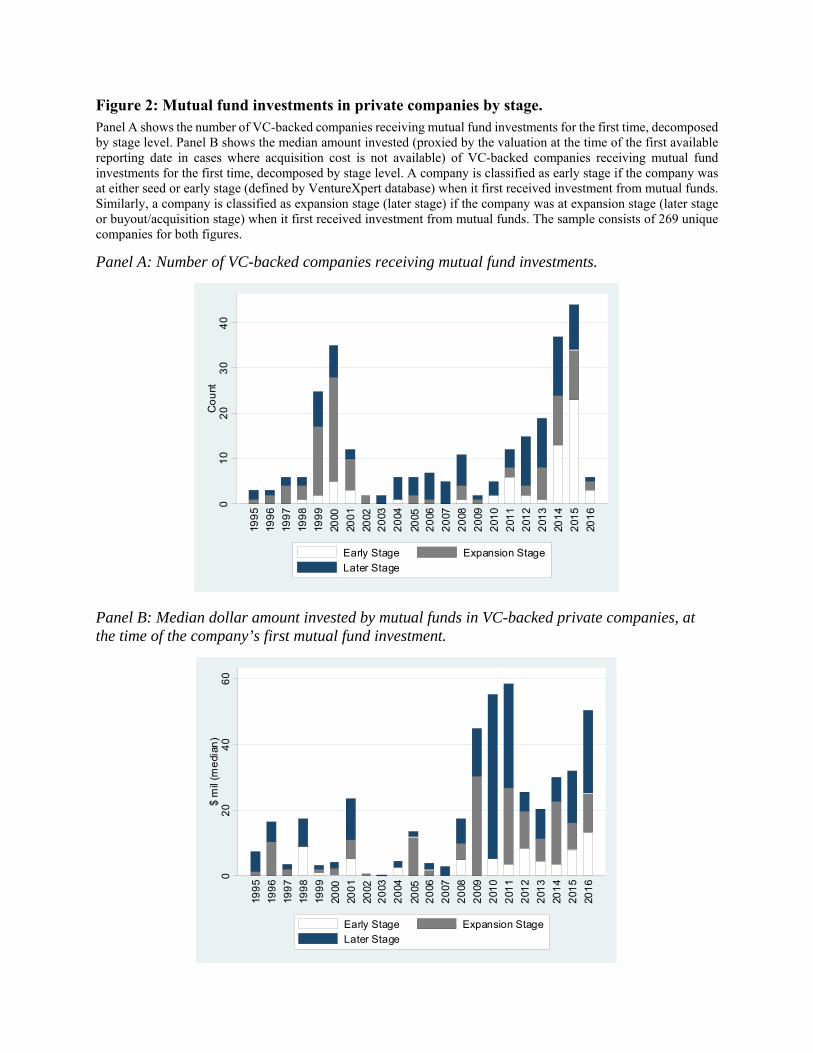
Figure 2: Mutual fund investments in private companies by stage. Panel A shows the number of VC-backed companies receiving mutual fund investments for the first time, decomposed by stage level. Panel B shows the median amount invested (proxied by the valuation at the time of the first available reporting date in cases where acquisition cost is not available) of VC-backed companies receiving mutual fund investments for the first time, decomposed by stage level. A company is classified as early stage if the company was at either seed or early stage (defined by VentureXpert database) when it first received investment from mutual funds. Similarly, a company is classified as expansion stage (later stage) if the company was at expansion stage (later stage or buyout/acquisition stage) when it first received investment from mutual funds. The sample consists of 269 unique companies for both figures.
Panel A: Number of VC-backed companies receiving mutual fund investments.
Panel B: Median dollar amount invested by mutual funds in VC-backed private companies, at the time of the company’s first mutual fund investment.
01
02
03
04
0C
ou
nt
199
5
199
6
199
7
199
8
199
9
2000
200
1
2002
20
03
20
04
2005
20
06
20
07
20
08
20
09
201
0
201
1
201
2
201
3
201
4
201
5
201
6
Early Stage Expansion Stage
Later Stage
02
04
06
0$
mil
(me
dian
)
199
5
199
6
199
7
199
8
199
9
2000
200
1
2002
20
03
20
04
2005
20
06
20
07
20
08
20
09
201
0
201
1
201
2
201
3
201
4
201
5
201
6
Early Stage Expansion Stage
Later Stage
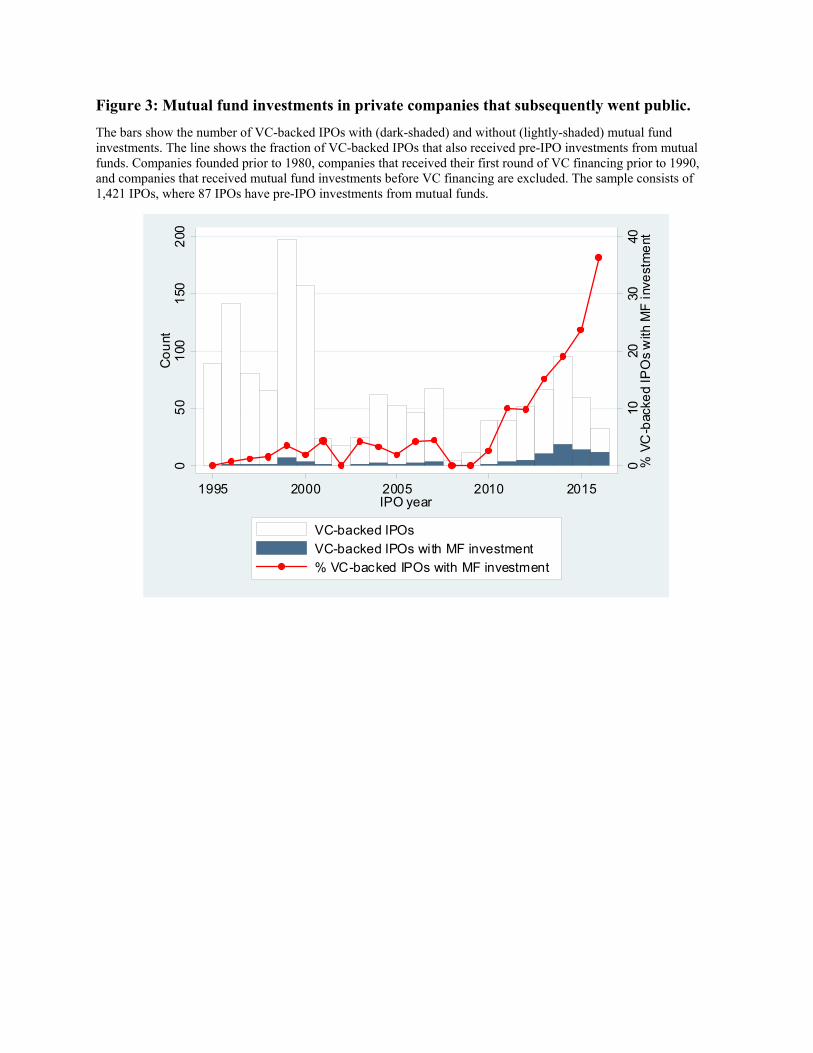
Figure 3: Mutual fund investments in private companies that subsequently went public.
The bars show the number of VC-backed IPOs with (dark-shaded) and without (lightly-shaded) mutual fund investments. The line shows the fraction of VC-backed IPOs that also received pre-IPO investments from mutual funds. Companies founded prior to 1980, companies that received their first round of VC financing prior to 1990, and companies that received mutual fund investments before VC financing are excluded. The sample consists of 1,421 IPOs, where 87 IPOs have pre-IPO investments from mutual funds.
0
1020
3040
% V
C-b
acke
d IP
Os
with
MF
inve
stm
ent
05
01
001
502
00C
ou
nt
1995 2000 2005 2010 2015IPO year
VC-backed IPOs
VC-backed IPOs with MF investment
% VC-backed IPOs with MF investment
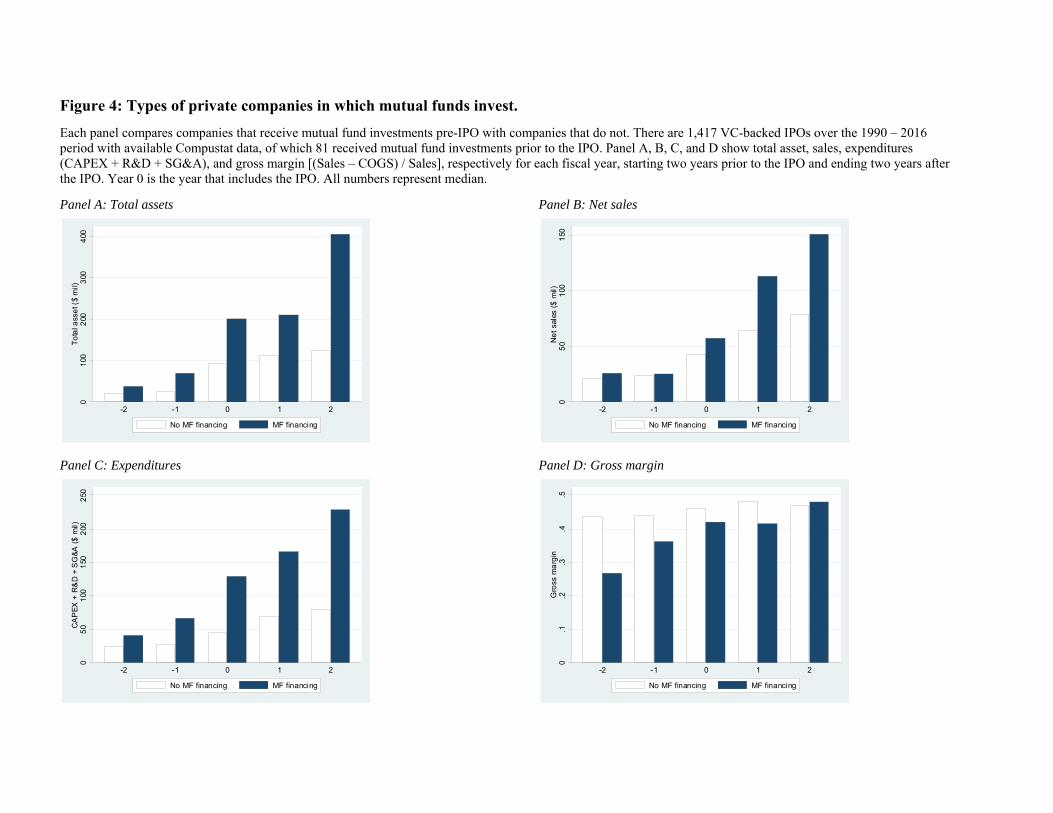
Figure 4: Types of private companies in which mutual funds invest.
Each panel compares companies that receive mutual fund investments pre-IPO with companies that do not. There are 1,417 VC-backed IPOs over the 1990 – 2016 period with available Compustat data, of which 81 received mutual fund investments prior to the IPO. Panel A, B, C, and D show total asset, sales, expenditures (CAPEX + R&D + SG&A), and gross margin [(Sales – COGS) / Sales], respectively for each fiscal year, starting two years prior to the IPO and ending two years after the IPO. Year 0 is the year that includes the IPO. All numbers represent median.
Panel A: Total assets Panel B: Net sales
Panel C: Expenditures Panel D: Gross margin
01
002
003
004
00T
ota
l ass
et (
$ m
il)
-2 -1 0 1 2
No MF financing MF financing
05
01
001
50N
et
sale
s ($
mil)
-2 -1 0 1 2
No MF financing MF financing
05
01
001
502
002
50C
AP
EX
+ R
&D
+ S
G&
A (
$ m
il)
-2 -1 0 1 2
No MF financing MF financing
0.1
.2.3
.4.5
Gro
ss m
arg
in
-2 -1 0 1 2
No MF financing MF financing
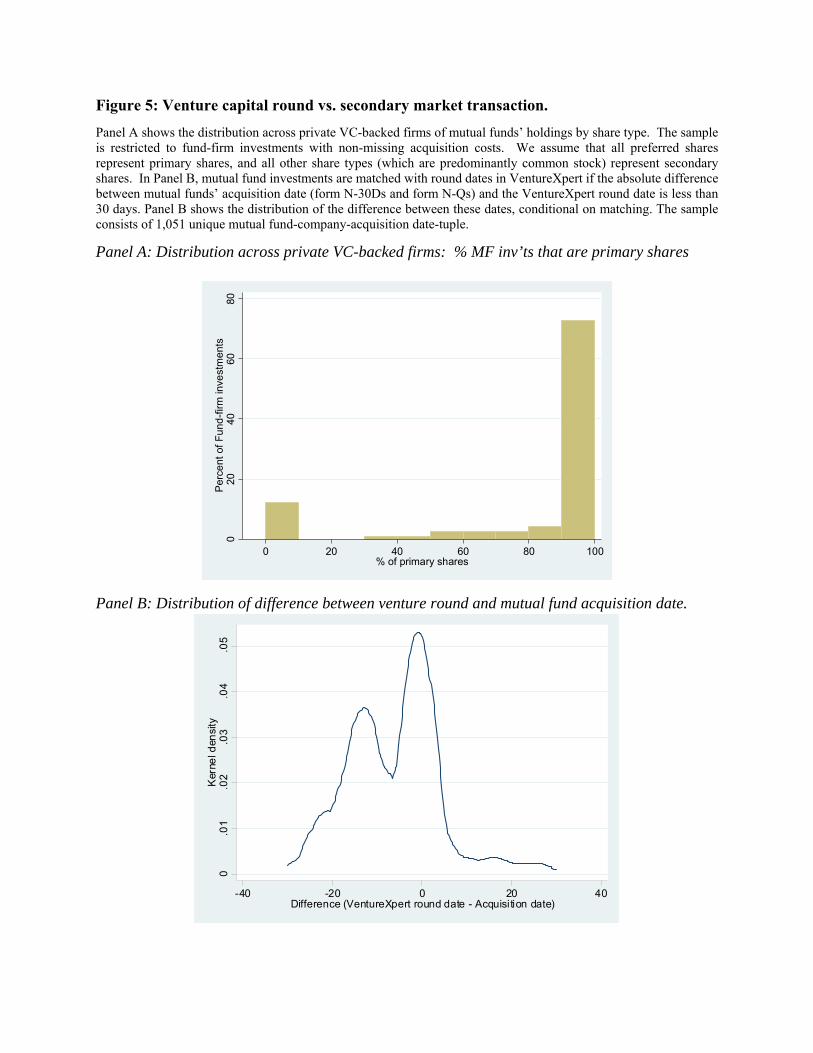
Figure 5: Venture capital round vs. secondary market transaction.
Panel A shows the distribution across private VC-backed firms of mutual funds’ holdings by share type. The sample is restricted to fund-firm investments with non-missing acquisition costs. We assume that all preferred shares represent primary shares, and all other share types (which are predominantly common stock) represent secondary shares. In Panel B, mutual fund investments are matched with round dates in VentureXpert if the absolute difference between mutual funds’ acquisition date (form N-30Ds and form N-Qs) and the VentureXpert round date is less than 30 days. Panel B shows the distribution of the difference between these dates, conditional on matching. The sample consists of 1,051 unique mutual fund-company-acquisition date-tuple.
Panel A: Distribution across private VC-backed firms: % MF inv’ts that are primary shares
Panel B: Distribution of difference between venture round and mutual fund acquisition date.
020
4060
80P
erce
nt o
f F
und
-firm
inve
stm
ent
s
0 20 40 60 80 100% of primary shares
0.0
1.0
2.0
3.0
4.0
5K
erne
l den
sity
-40 -20 0 20 40Difference (VentureXpert round date - Acquisition date)
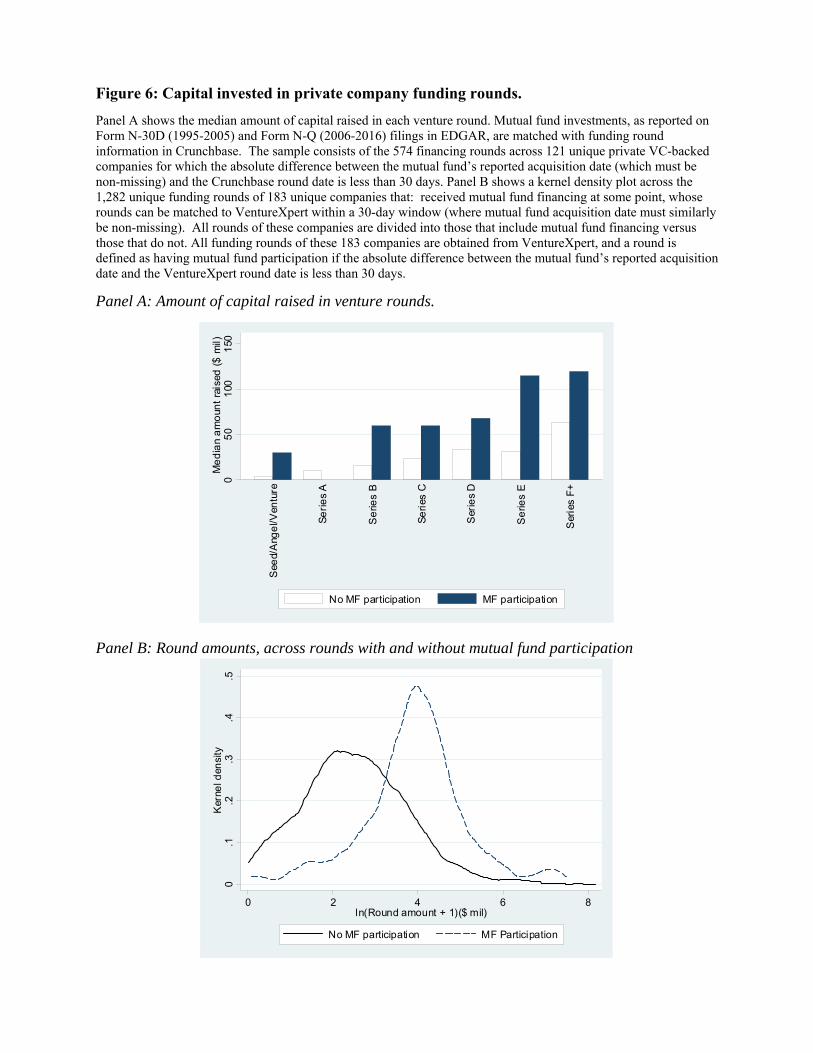
Figure 6: Capital invested in private company funding rounds.
Panel A shows the median amount of capital raised in each venture round. Mutual fund investments, as reported on Form N-30D (1995-2005) and Form N-Q (2006-2016) filings in EDGAR, are matched with funding round information in Crunchbase. The sample consists of the 574 financing rounds across 121 unique private VC-backed companies for which the absolute difference between the mutual fund’s reported acquisition date (which must be non-missing) and the Crunchbase round date is less than 30 days. Panel B shows a kernel density plot across the 1,282 unique funding rounds of 183 unique companies that: received mutual fund financing at some point, whose rounds can be matched to VentureXpert within a 30-day window (where mutual fund acquisition date must similarly be non-missing). All rounds of these companies are divided into those that include mutual fund financing versus those that do not. All funding rounds of these 183 companies are obtained from VentureXpert, and a round is defined as having mutual fund participation if the absolute difference between the mutual fund’s reported acquisition date and the VentureXpert round date is less than 30 days.
Panel A: Amount of capital raised in venture rounds.
Panel B: Round amounts, across rounds with and without mutual fund participation
05
01
001
50M
ed
ian
am
oun
t ra
ised
($
mil)
See
d/A
nge
l/Ven
ture
Se
rie
s A
Se
ries
B
Se
ries
C
Ser
ies
D
Se
ries
E
Ser
ies
F+
No MF participation MF participation
0.1
.2.3
.4.5
Ker
nel d
ensi
ty
0 2 4 6 8ln(Round amount + 1)($ mil)
No MF participation MF Participation
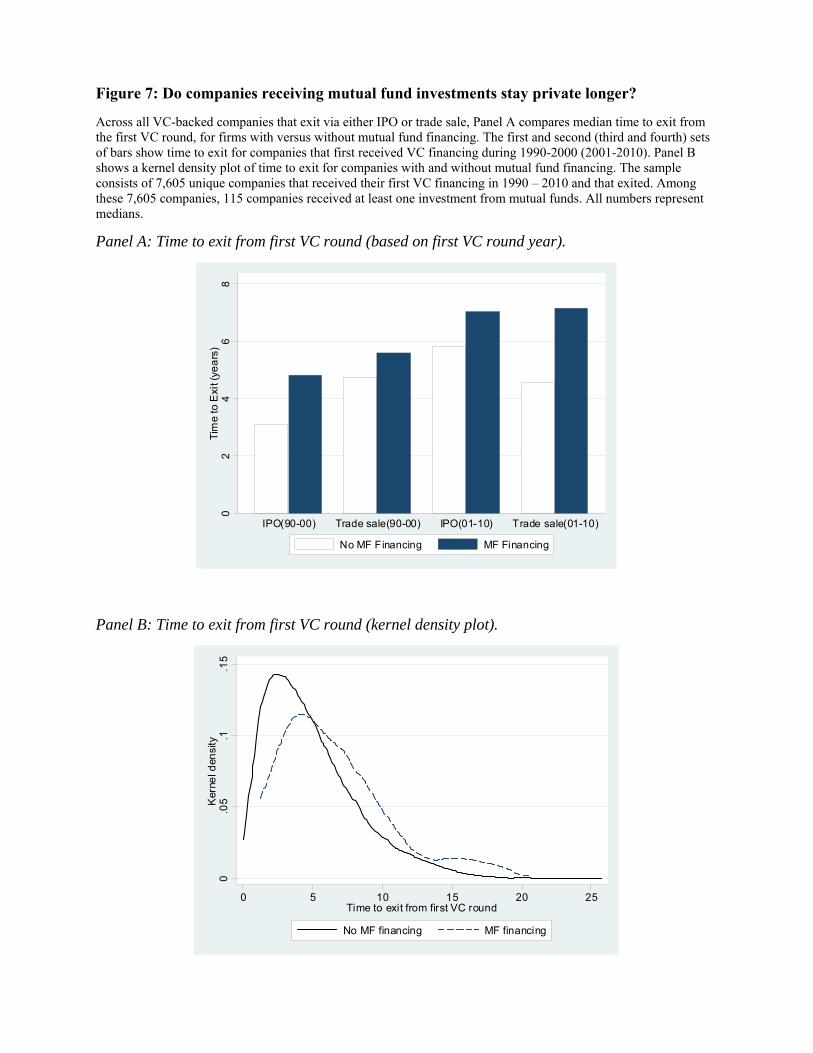
Figure 7: Do companies receiving mutual fund investments stay private longer?
Across all VC-backed companies that exit via either IPO or trade sale, Panel A compares median time to exit from the first VC round, for firms with versus without mutual fund financing. The first and second (third and fourth) sets of bars show time to exit for companies that first received VC financing during 1990-2000 (2001-2010). Panel B shows a kernel density plot of time to exit for companies with and without mutual fund financing. The sample consists of 7,605 unique companies that received their first VC financing in 1990 – 2010 and that exited. Among these 7,605 companies, 115 companies received at least one investment from mutual funds. All numbers represent medians.
Panel A: Time to exit from first VC round (based on first VC round year).
Panel B: Time to exit from first VC round (kernel density plot).
02
46
8T
ime
to E
xit (
yea
rs)
IPO(90-00) Trade sale(90-00) IPO(01-10) Trade sale(01-10)
No MF Financing MF Financing
0.0
5.1
.15
Ker
nel d
ensi
ty
0 5 10 15 20 25Time to exit from first VC round
No MF financing MF financing
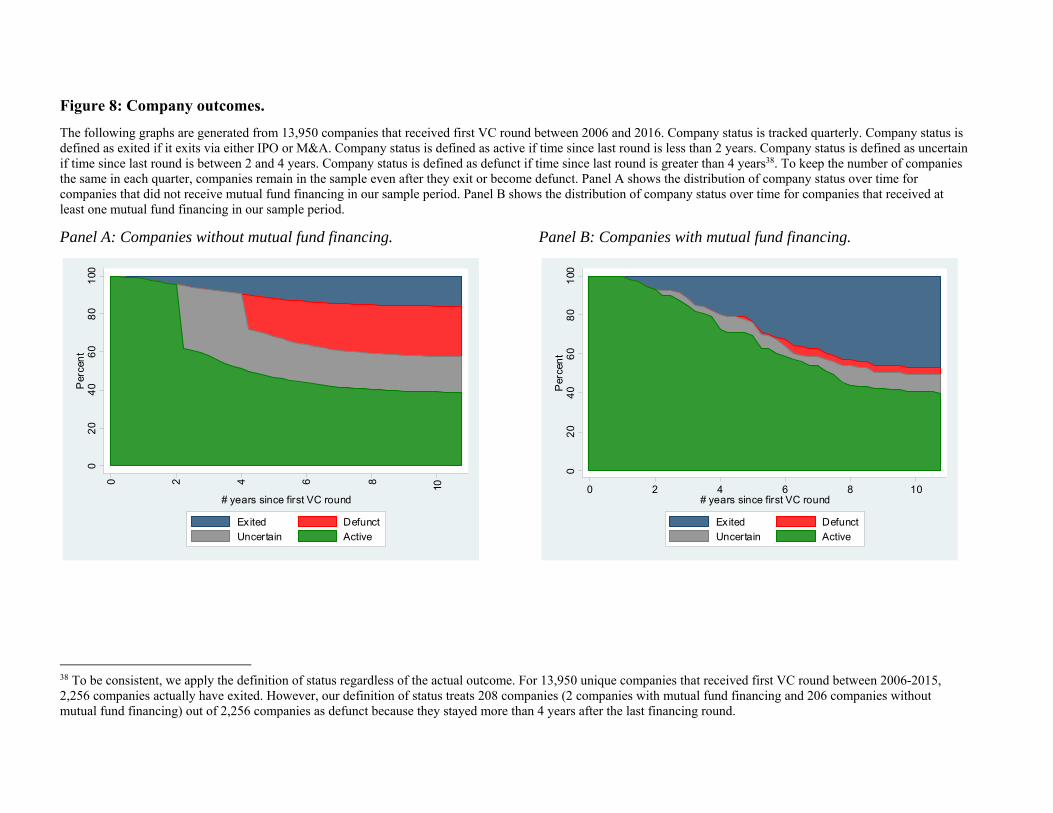
Figure 8: Company outcomes.
The following graphs are generated from 13,950 companies that received first VC round between 2006 and 2016. Company status is tracked quarterly. Company status is defined as exited if it exits via either IPO or M&A. Company status is defined as active if time since last round is less than 2 years. Company status is defined as uncertain if time since last round is between 2 and 4 years. Company status is defined as defunct if time since last round is greater than 4 years38. To keep the number of companies the same in each quarter, companies remain in the sample even after they exit or become defunct. Panel A shows the distribution of company status over time for companies that did not receive mutual fund financing in our sample period. Panel B shows the distribution of company status over time for companies that received at least one mutual fund financing in our sample period.
Panel A: Companies without mutual fund financing. Panel B: Companies with mutual fund financing.
38 To be consistent, we apply the definition of status regardless of the actual outcome. For 13,950 unique companies that received first VC round between 2006-2015, 2,256 companies actually have exited. However, our definition of status treats 208 companies (2 companies with mutual fund financing and 206 companies without mutual fund financing) out of 2,256 companies as defunct because they stayed more than 4 years after the last financing round.
02
04
06
08
01
00P
erce
nt
0 2 4 6 8
10
# years since first VC round
Exited Defunct
Uncertain Active
02
04
06
08
01
00P
erce
nt
0 2 4 6 8 10# years since first VC round
Exited Defunct
Uncertain Active
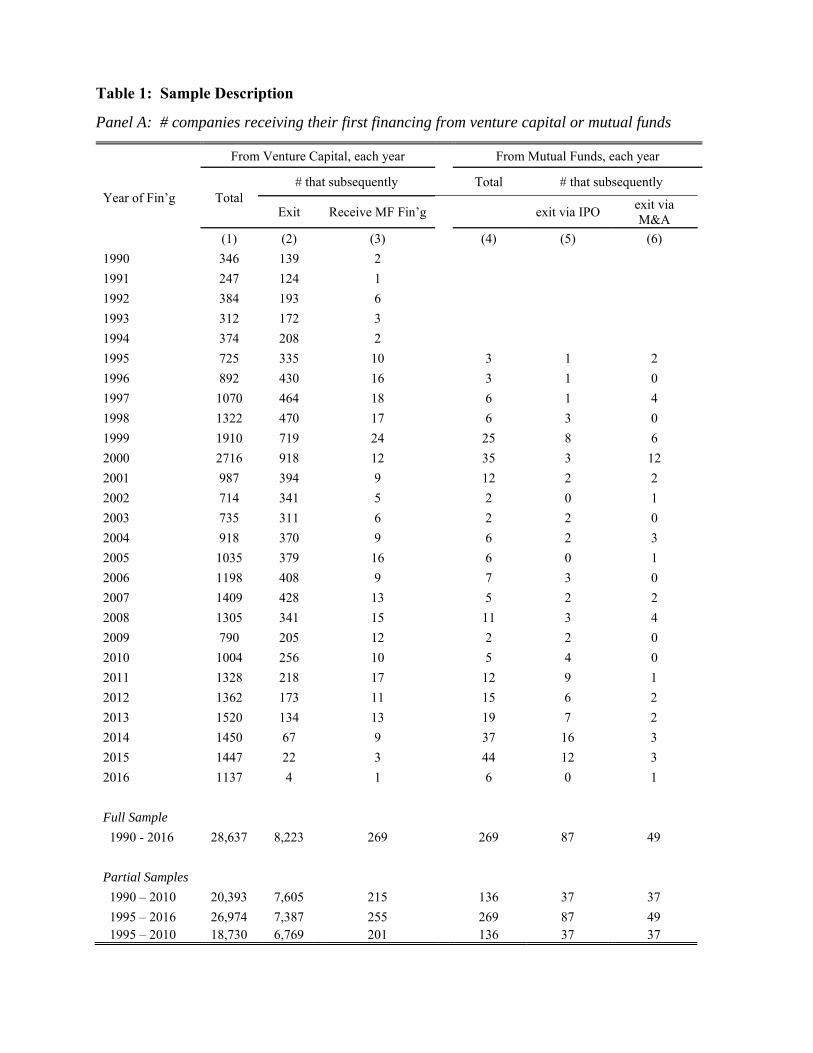
Table 1: Sample Description
Panel A: # companies receiving their first financing from venture capital or mutual funds
From Venture Capital, each year From Mutual Funds, each year
Year of Fin’g Total # that subsequently Total # that subsequently
Exit Receive MF Fin’g exit via IPO exit via M&A
(1) (2) (3) (4) (5) (6)
1990 346 139 2
1991 247 124 1
1992 384 193 6
1993 312 172 3
1994 374 208 2
1995 725 335 10 3 1 2
1996 892 430 16 3 1 0
1997 1070 464 18 6 1 4
1998 1322 470 17 6 3 0
1999 1910 719 24 25 8 6
2000 2716 918 12 35 3 12
2001 987 394 9 12 2 2
2002 714 341 5 2 0 1
2003 735 311 6 2 2 0
2004 918 370 9 6 2 3
2005 1035 379 16 6 0 1
2006 1198 408 9 7 3 0
2007 1409 428 13 5 2 2
2008 1305 341 15 11 3 4
2009 790 205 12 2 2 0
2010 1004 256 10 5 4 0
2011 1328 218 17 12 9 1
2012 1362 173 11 15 6 2
2013 1520 134 13 19 7 2
2014 1450 67 9 37 16 3
2015 1447 22 3 44 12 3
2016 1137 4 1 6 0 1
Full Sample
1990 - 2016 28,637 8,223 269 269 87 49
Partial Samples
1990 – 2010 20,393 7,605 215 136 37 37
1995 – 2016 26,974 7,387 255 269 87 49 1995 – 2010 18,730 6,769 201 136 37 37
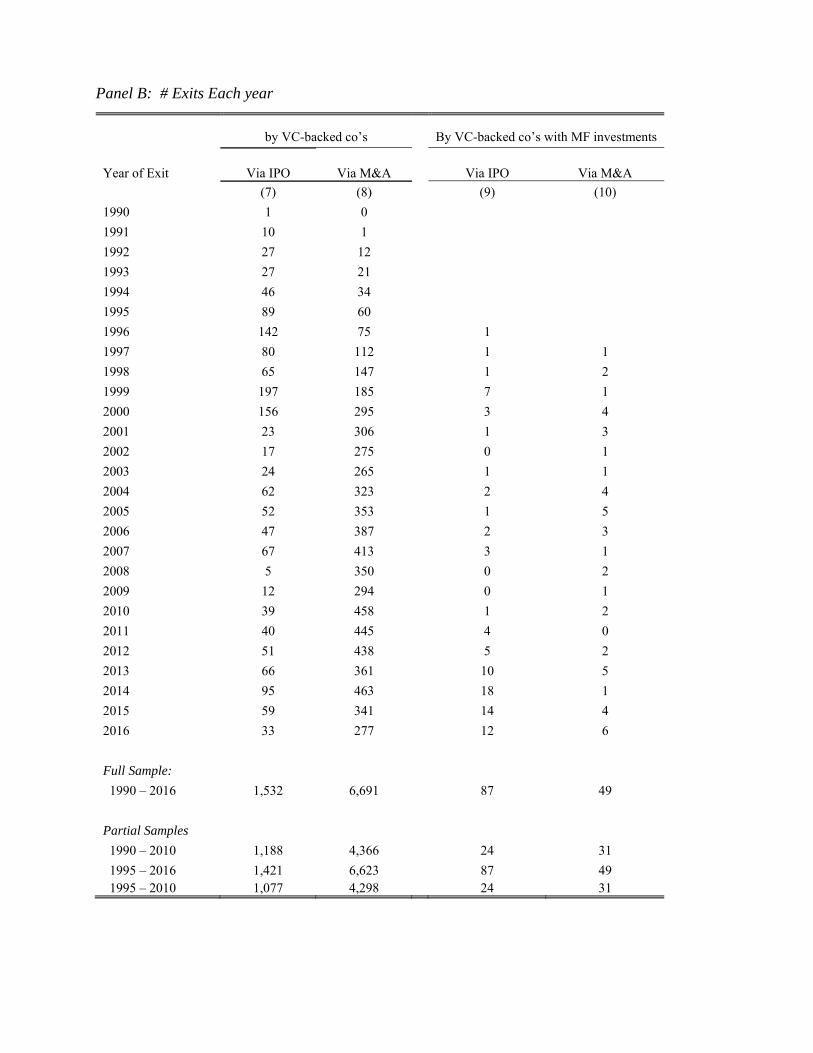
Panel B: # Exits Each year
by VC-backed co’s By VC-backed co’s with MF investments
Year of Exit Via IPO Via M&A Via IPO Via M&A
(7) (8) (9) (10)
1990 1 0
1991 10 1
1992 27 12
1993 27 21
1994 46 34
1995 89 60
1996 142 75 1
1997 80 112 1 1
1998 65 147 1 2
1999 197 185 7 1
2000 156 295 3 4
2001 23 306 1 3
2002 17 275 0 1
2003 24 265 1 1
2004 62 323 2 4
2005 52 353 1 5
2006 47 387 2 3
2007 67 413 3 1
2008 5 350 0 2
2009 12 294 0 1
2010 39 458 1 2
2011 40 445 4 0
2012 51 438 5 2
2013 66 361 10 5
2014 95 463 18 1
2015 59 341 14 4
2016 33 277 12 6
Full Sample:
1990 – 2016 1,532 6,691 87 49
Partial Samples
1990 – 2010 1,188 4,366 24 31
1995 – 2016 1,421 6,623 87 49 1995 – 2010 1,077 4,298 24 31
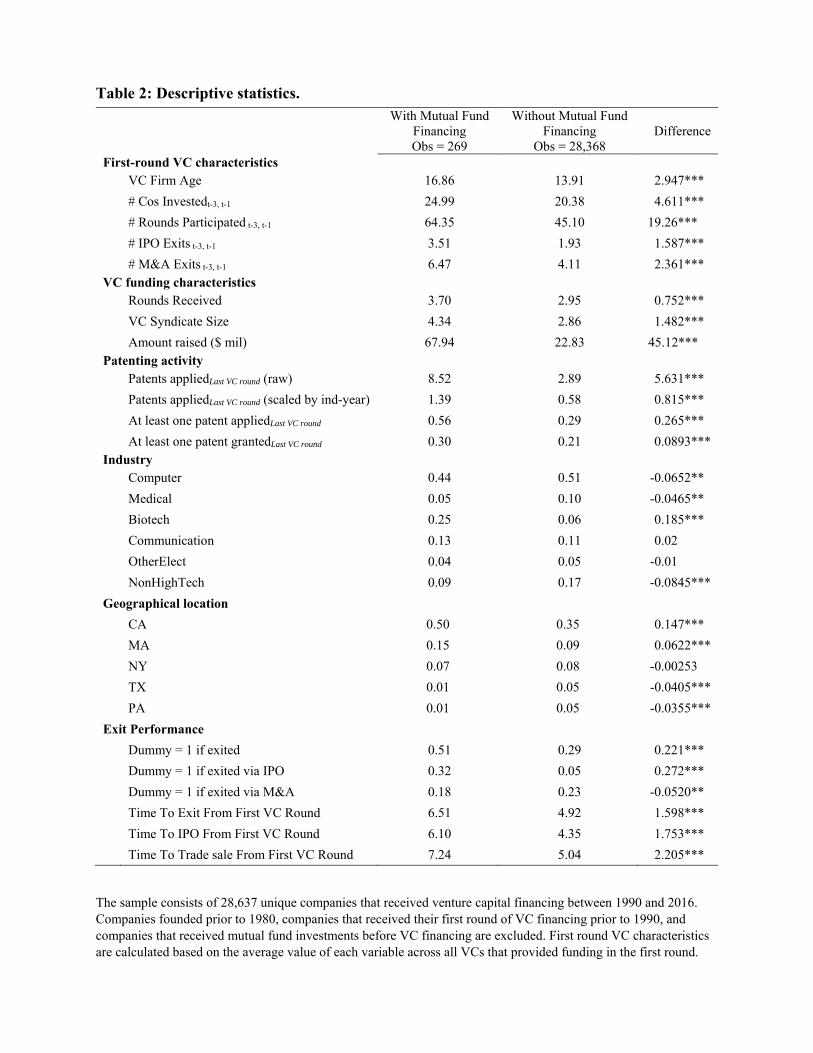
Table 2: Descriptive statistics. With Mutual Fund Without Mutual Fund Financing Financing Difference Obs = 269 Obs = 28,368 First-round VC characteristics VC Firm Age 16.86 13.91 2.947***
# Cos Investedt-3, t-1 24.99 20.38 4.611***
# Rounds Participated t-3, t-1 64.35 45.10 19.26***
# IPO Exits t-3, t-1 3.51 1.93 1.587***
# M&A Exits t-3, t-1 6.47 4.11 2.361*** VC funding characteristics Rounds Received 3.70 2.95 0.752***
VC Syndicate Size 4.34 2.86 1.482***
Amount raised ($ mil) 67.94 22.83 45.12*** Patenting activity Patents appliedLast VC round (raw) 8.52 2.89 5.631***
Patents appliedLast VC round (scaled by ind-year) 1.39 0.58 0.815***
At least one patent appliedLast VC round 0.56 0.29 0.265***
At least one patent grantedLast VC round 0.30 0.21 0.0893*** Industry Computer 0.44 0.51 -0.0652**
Medical 0.05 0.10 -0.0465**
Biotech 0.25 0.06 0.185***
Communication 0.13 0.11 0.02
OtherElect 0.04 0.05 -0.01
NonHighTech 0.09 0.17 -0.0845***
Geographical location
CA 0.50 0.35 0.147***
MA 0.15 0.09 0.0622***
NY 0.07 0.08 -0.00253
TX 0.01 0.05 -0.0405***
PA 0.01 0.05 -0.0355***
Exit Performance
Dummy = 1 if exited 0.51 0.29 0.221***
Dummy = 1 if exited via IPO 0.32 0.05 0.272***
Dummy = 1 if exited via M&A 0.18 0.23 -0.0520**
Time To Exit From First VC Round 6.51 4.92 1.598***
Time To IPO From First VC Round 6.10 4.35 1.753***
Time To Trade sale From First VC Round 7.24 5.04 2.205***
The sample consists of 28,637 unique companies that received venture capital financing between 1990 and 2016. Companies founded prior to 1980, companies that received their first round of VC financing prior to 1990, and companies that received mutual fund investments before VC financing are excluded. First round VC characteristics are calculated based on the average value of each variable across all VCs that provided funding in the first round.

Time To Exit From First VC Round is based on the smaller subset of companies that successfully exit via either IPO or acquisition: 136 companies with mutual fund financing and 8,087 companies without. Patenting activity variables are measured as of the quarter end prior to the mutual fund financing for companies with such financing, and as of the last VC round for all other companies. Means are shown for all variables, and variable definitions are in the Appendix.
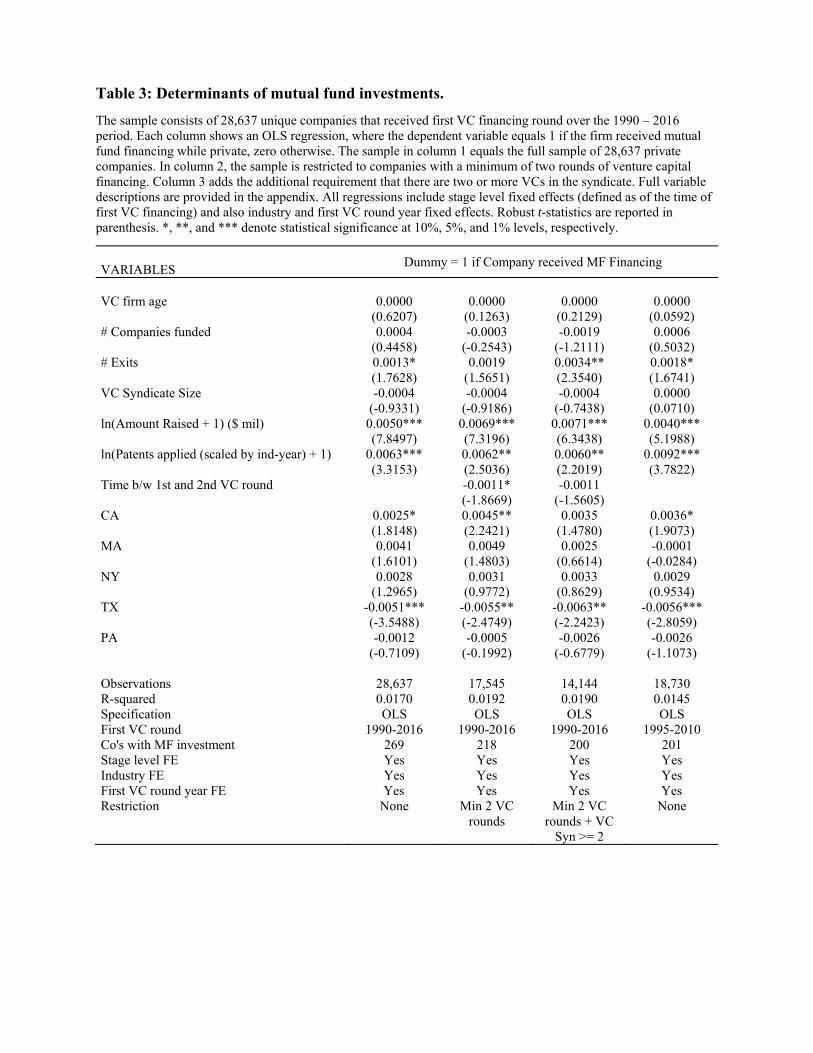
Table 3: Determinants of mutual fund investments.
The sample consists of 28,637 unique companies that received first VC financing round over the 1990 – 2016 period. Each column shows an OLS regression, where the dependent variable equals 1 if the firm received mutual fund financing while private, zero otherwise. The sample in column 1 equals the full sample of 28,637 private companies. In column 2, the sample is restricted to companies with a minimum of two rounds of venture capital financing. Column 3 adds the additional requirement that there are two or more VCs in the syndicate. Full variable descriptions are provided in the appendix. All regressions include stage level fixed effects (defined as of the time of first VC financing) and also industry and first VC round year fixed effects. Robust t-statistics are reported in parenthesis. *, **, and *** denote statistical significance at 10%, 5%, and 1% levels, respectively.
Dummy = 1 if Company received MF Financing
VARIABLES VC firm age 0.0000 0.0000 0.0000 0.0000 (0.6207) (0.1263) (0.2129) (0.0592) # Companies funded 0.0004 -0.0003 -0.0019 0.0006 (0.4458) (-0.2543) (-1.2111) (0.5032) # Exits 0.0013* 0.0019 0.0034** 0.0018* (1.7628) (1.5651) (2.3540) (1.6741) VC Syndicate Size -0.0004 -0.0004 -0.0004 0.0000 (-0.9331) (-0.9186) (-0.7438) (0.0710) ln(Amount Raised + 1) ($ mil) 0.0050*** 0.0069*** 0.0071*** 0.0040*** (7.8497) (7.3196) (6.3438) (5.1988) ln(Patents applied (scaled by ind-year) + 1) 0.0063*** 0.0062** 0.0060** 0.0092*** (3.3153) (2.5036) (2.2019) (3.7822) Time b/w 1st and 2nd VC round -0.0011* -0.0011 (-1.8669) (-1.5605) CA 0.0025* 0.0045** 0.0035 0.0036* (1.8148) (2.2421) (1.4780) (1.9073) MA 0.0041 0.0049 0.0025 -0.0001 (1.6101) (1.4803) (0.6614) (-0.0284) NY 0.0028 0.0031 0.0033 0.0029 (1.2965) (0.9772) (0.8629) (0.9534) TX -0.0051*** -0.0055** -0.0063** -0.0056*** (-3.5488) (-2.4749) (-2.2423) (-2.8059) PA -0.0012 -0.0005 -0.0026 -0.0026 (-0.7109) (-0.1992) (-0.6779) (-1.1073) Observations 28,637 17,545 14,144 18,730 R-squared 0.0170 0.0192 0.0190 0.0145 Specification OLS OLS OLS OLS First VC round 1990-2016 1990-2016 1990-2016 1995-2010 Co's with MF investment 269 218 200 201 Stage level FE Yes Yes Yes Yes Industry FE Yes Yes Yes Yes First VC round year FE Yes Yes Yes Yes Restriction None Min 2 VC
rounds Min 2 VC
rounds + VC Syn >= 2
None
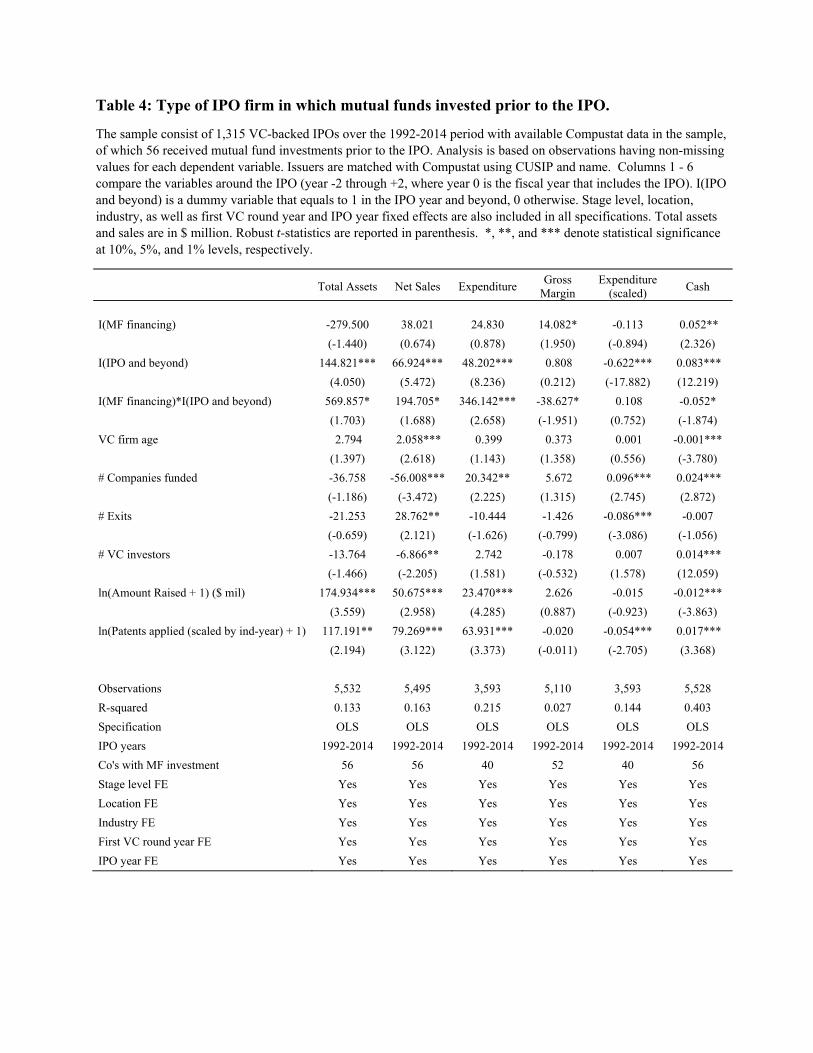
Table 4: Type of IPO firm in which mutual funds invested prior to the IPO.
The sample consist of 1,315 VC-backed IPOs over the 1992-2014 period with available Compustat data in the sample, of which 56 received mutual fund investments prior to the IPO. Analysis is based on observations having non-missing values for each dependent variable. Issuers are matched with Compustat using CUSIP and name. Columns 1 - 6 compare the variables around the IPO (year -2 through +2, where year 0 is the fiscal year that includes the IPO). I(IPO and beyond) is a dummy variable that equals to 1 in the IPO year and beyond, 0 otherwise. Stage level, location, industry, as well as first VC round year and IPO year fixed effects are also included in all specifications. Total assets and sales are in $ million. Robust t-statistics are reported in parenthesis. *, **, and *** denote statistical significance at 10%, 5%, and 1% levels, respectively.
Total Assets Net Sales Expenditure
Gross Margin
Expenditure (scaled)
Cash
I(MF financing) -279.500 38.021 24.830 14.082* -0.113 0.052**
(-1.440) (0.674) (0.878) (1.950) (-0.894) (2.326)
I(IPO and beyond) 144.821*** 66.924*** 48.202*** 0.808 -0.622*** 0.083***
(4.050) (5.472) (8.236) (0.212) (-17.882) (12.219)
I(MF financing)*I(IPO and beyond) 569.857* 194.705* 346.142*** -38.627* 0.108 -0.052*
(1.703) (1.688) (2.658) (-1.951) (0.752) (-1.874)
VC firm age 2.794 2.058*** 0.399 0.373 0.001 -0.001***
(1.397) (2.618) (1.143) (1.358) (0.556) (-3.780)
# Companies funded -36.758 -56.008*** 20.342** 5.672 0.096*** 0.024***
(-1.186) (-3.472) (2.225) (1.315) (2.745) (2.872)
# Exits -21.253 28.762** -10.444 -1.426 -0.086*** -0.007
(-0.659) (2.121) (-1.626) (-0.799) (-3.086) (-1.056)
# VC investors -13.764 -6.866** 2.742 -0.178 0.007 0.014***
(-1.466) (-2.205) (1.581) (-0.532) (1.578) (12.059)
ln(Amount Raised + 1) ($ mil) 174.934*** 50.675*** 23.470*** 2.626 -0.015 -0.012***
(3.559) (2.958) (4.285) (0.887) (-0.923) (-3.863)
ln(Patents applied (scaled by ind-year) + 1) 117.191** 79.269*** 63.931*** -0.020 -0.054*** 0.017***
(2.194) (3.122) (3.373) (-0.011) (-2.705) (3.368)
Observations 5,532 5,495 3,593 5,110 3,593 5,528
R-squared 0.133 0.163 0.215 0.027 0.144 0.403
Specification OLS OLS OLS OLS OLS OLS
IPO years 1992-2014 1992-2014 1992-2014 1992-2014 1992-2014 1992-2014
Co's with MF investment 56 56 40 52 40 56
Stage level FE Yes Yes Yes Yes Yes Yes
Location FE Yes Yes Yes Yes Yes Yes
Industry FE Yes Yes Yes Yes Yes Yes
First VC round year FE Yes Yes Yes Yes Yes Yes
IPO year FE Yes Yes Yes Yes Yes Yes
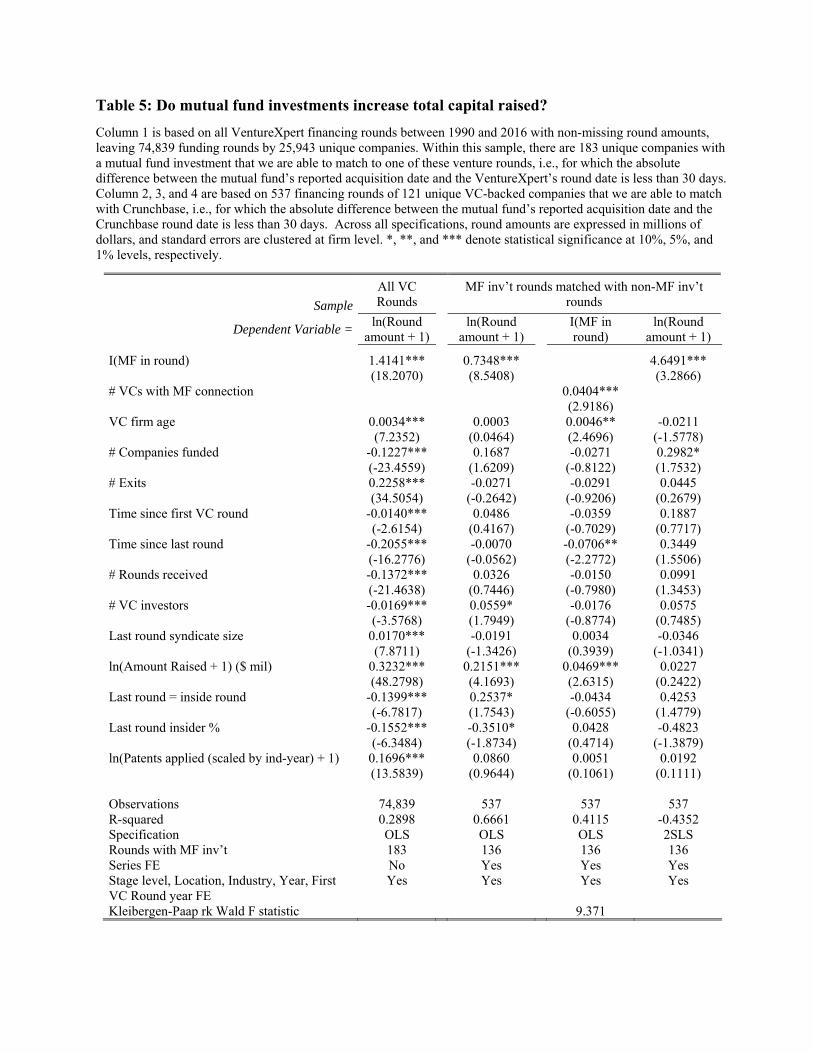
Table 5: Do mutual fund investments increase total capital raised?
Column 1 is based on all VentureXpert financing rounds between 1990 and 2016 with non-missing round amounts, leaving 74,839 funding rounds by 25,943 unique companies. Within this sample, there are 183 unique companies with a mutual fund investment that we are able to match to one of these venture rounds, i.e., for which the absolute difference between the mutual fund’s reported acquisition date and the VentureXpert’s round date is less than 30 days. Column 2, 3, and 4 are based on 537 financing rounds of 121 unique VC-backed companies that we are able to match with Crunchbase, i.e., for which the absolute difference between the mutual fund’s reported acquisition date and the Crunchbase round date is less than 30 days. Across all specifications, round amounts are expressed in millions of dollars, and standard errors are clustered at firm level. *, **, and *** denote statistical significance at 10%, 5%, and 1% levels, respectively.
Sample
All VC Rounds
MF inv’t rounds matched with non-MF inv’t rounds
Dependent Variable = ln(Round
amount + 1)ln(Round
amount + 1) I(MF in round)
ln(Round amount + 1)
I(MF in round) 1.4141*** 0.7348*** 4.6491*** (18.2070) (8.5408) (3.2866) # VCs with MF connection 0.0404*** (2.9186) VC firm age 0.0034*** 0.0003 0.0046** -0.0211 (7.2352) (0.0464) (2.4696) (-1.5778) # Companies funded -0.1227*** 0.1687 -0.0271 0.2982* (-23.4559) (1.6209) (-0.8122) (1.7532) # Exits 0.2258*** -0.0271 -0.0291 0.0445 (34.5054) (-0.2642) (-0.9206) (0.2679) Time since first VC round -0.0140*** 0.0486 -0.0359 0.1887 (-2.6154) (0.4167) (-0.7029) (0.7717) Time since last round -0.2055*** -0.0070 -0.0706** 0.3449 (-16.2776) (-0.0562) (-2.2772) (1.5506) # Rounds received -0.1372*** 0.0326 -0.0150 0.0991 (-21.4638) (0.7446) (-0.7980) (1.3453) # VC investors -0.0169*** 0.0559* -0.0176 0.0575 (-3.5768) (1.7949) (-0.8774) (0.7485) Last round syndicate size 0.0170*** -0.0191 0.0034 -0.0346 (7.8711) (-1.3426) (0.3939) (-1.0341) ln(Amount Raised + 1) ($ mil) 0.3232*** 0.2151*** 0.0469*** 0.0227 (48.2798) (4.1693) (2.6315) (0.2422) Last round = inside round -0.1399*** 0.2537* -0.0434 0.4253 (-6.7817) (1.7543) (-0.6055) (1.4779) Last round insider % -0.1552*** -0.3510* 0.0428 -0.4823 (-6.3484) (-1.8734) (0.4714) (-1.3879) ln(Patents applied (scaled by ind-year) + 1) 0.1696*** 0.0860 0.0051 0.0192 (13.5839) (0.9644) (0.1061) (0.1111) Observations 74,839 537 537 537 R-squared 0.2898 0.6661 0.4115 -0.4352 Specification OLS OLS OLS 2SLS Rounds with MF inv’t 183 136 136 136 Series FE No Yes Yes Yes Stage level, Location, Industry, Year, First VC Round year FE
Yes Yes Yes Yes
Kleibergen-Paap rk Wald F statistic 9.371
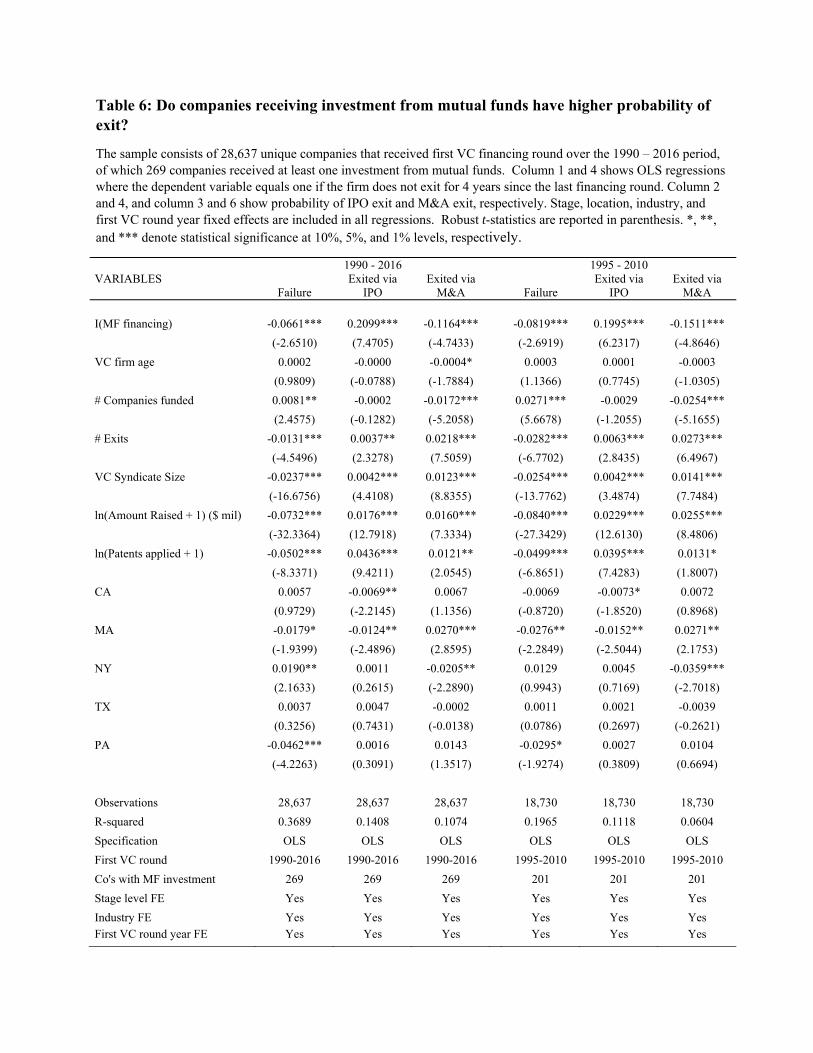
Table 6: Do companies receiving investment from mutual funds have higher probability of exit?
The sample consists of 28,637 unique companies that received first VC financing round over the 1990 – 2016 period, of which 269 companies received at least one investment from mutual funds. Column 1 and 4 shows OLS regressions where the dependent variable equals one if the firm does not exit for 4 years since the last financing round. Column 2 and 4, and column 3 and 6 show probability of IPO exit and M&A exit, respectively. Stage, location, industry, and first VC round year fixed effects are included in all regressions. Robust t-statistics are reported in parenthesis. *, **, and *** denote statistical significance at 10%, 5%, and 1% levels, respectively.
1990 - 2016 1995 - 2010 VARIABLES
Failure Exited via
IPO Exited via
M&A Failure Exited via
IPO Exited via
M&A I(MF financing) -0.0661*** 0.2099*** -0.1164*** -0.0819*** 0.1995*** -0.1511***
(-2.6510) (7.4705) (-4.7433) (-2.6919) (6.2317) (-4.8646)
VC firm age 0.0002 -0.0000 -0.0004* 0.0003 0.0001 -0.0003
(0.9809) (-0.0788) (-1.7884) (1.1366) (0.7745) (-1.0305)
# Companies funded 0.0081** -0.0002 -0.0172*** 0.0271*** -0.0029 -0.0254***
(2.4575) (-0.1282) (-5.2058) (5.6678) (-1.2055) (-5.1655)
# Exits -0.0131*** 0.0037** 0.0218*** -0.0282*** 0.0063*** 0.0273***
(-4.5496) (2.3278) (7.5059) (-6.7702) (2.8435) (6.4967)
VC Syndicate Size -0.0237*** 0.0042*** 0.0123*** -0.0254*** 0.0042*** 0.0141***
(-16.6756) (4.4108) (8.8355) (-13.7762) (3.4874) (7.7484)
ln(Amount Raised + 1) ($ mil) -0.0732*** 0.0176*** 0.0160*** -0.0840*** 0.0229*** 0.0255***
(-32.3364) (12.7918) (7.3334) (-27.3429) (12.6130) (8.4806)
ln(Patents applied + 1) -0.0502*** 0.0436*** 0.0121** -0.0499*** 0.0395*** 0.0131*
(-8.3371) (9.4211) (2.0545) (-6.8651) (7.4283) (1.8007)
CA 0.0057 -0.0069** 0.0067 -0.0069 -0.0073* 0.0072
(0.9729) (-2.2145) (1.1356) (-0.8720) (-1.8520) (0.8968)
MA -0.0179* -0.0124** 0.0270*** -0.0276** -0.0152** 0.0271**
(-1.9399) (-2.4896) (2.8595) (-2.2849) (-2.5044) (2.1753)
NY 0.0190** 0.0011 -0.0205** 0.0129 0.0045 -0.0359***
(2.1633) (0.2615) (-2.2890) (0.9943) (0.7169) (-2.7018)
TX 0.0037 0.0047 -0.0002 0.0011 0.0021 -0.0039
(0.3256) (0.7431) (-0.0138) (0.0786) (0.2697) (-0.2621)
PA -0.0462*** 0.0016 0.0143 -0.0295* 0.0027 0.0104
(-4.2263) (0.3091) (1.3517) (-1.9274) (0.3809) (0.6694)
Observations 28,637 28,637 28,637 18,730 18,730 18,730
R-squared 0.3689 0.1408 0.1074 0.1965 0.1118 0.0604
Specification OLS OLS OLS OLS OLS OLS
First VC round 1990-2016 1990-2016 1990-2016 1995-2010 1995-2010 1995-2010
Co's with MF investment 269 269 269 201 201 201
Stage level FE Yes Yes Yes Yes Yes Yes
Industry FE Yes Yes Yes Yes Yes Yes First VC round year FE Yes Yes Yes Yes Yes Yes
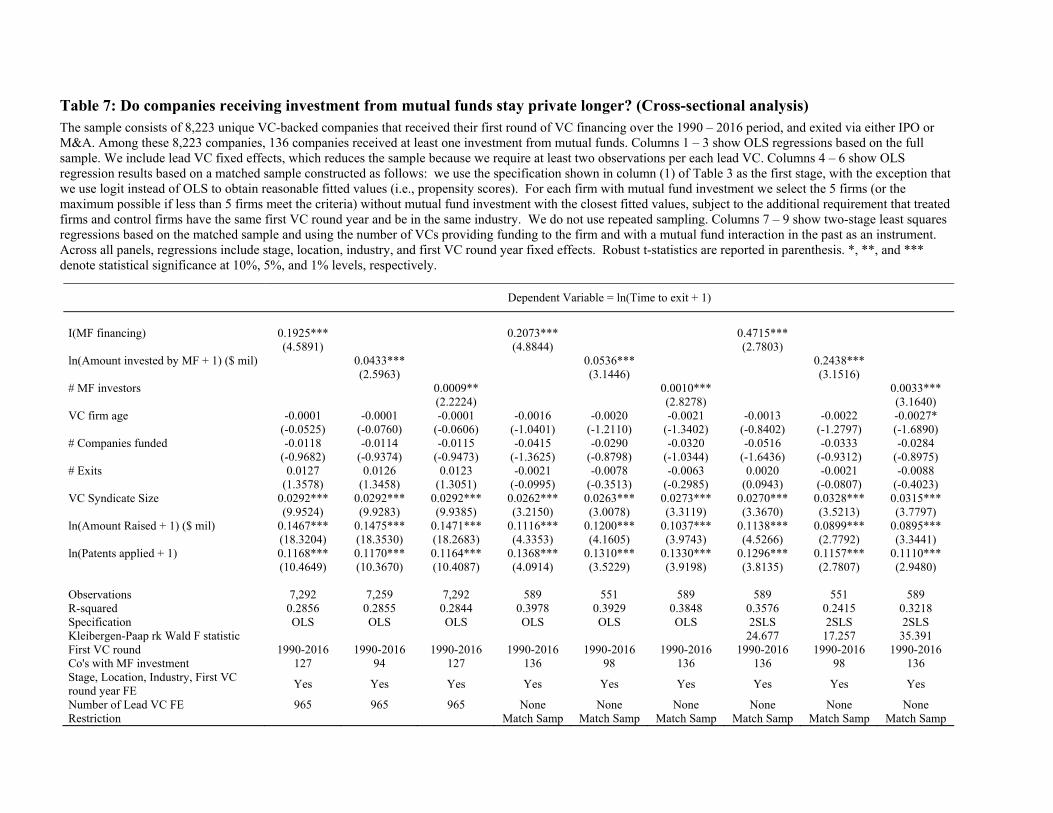
Table 7: Do companies receiving investment from mutual funds stay private longer? (Cross-sectional analysis) The sample consists of 8,223 unique VC-backed companies that received their first round of VC financing over the 1990 – 2016 period, and exited via either IPO or M&A. Among these 8,223 companies, 136 companies received at least one investment from mutual funds. Columns 1 – 3 show OLS regressions based on the full sample. We include lead VC fixed effects, which reduces the sample because we require at least two observations per each lead VC. Columns 4 – 6 show OLS regression results based on a matched sample constructed as follows: we use the specification shown in column (1) of Table 3 as the first stage, with the exception that we use logit instead of OLS to obtain reasonable fitted values (i.e., propensity scores). For each firm with mutual fund investment we select the 5 firms (or the maximum possible if less than 5 firms meet the criteria) without mutual fund investment with the closest fitted values, subject to the additional requirement that treated firms and control firms have the same first VC round year and be in the same industry. We do not use repeated sampling. Columns 7 – 9 show two-stage least squares regressions based on the matched sample and using the number of VCs providing funding to the firm and with a mutual fund interaction in the past as an instrument. Across all panels, regressions include stage, location, industry, and first VC round year fixed effects. Robust t-statistics are reported in parenthesis. *, **, and *** denote statistical significance at 10%, 5%, and 1% levels, respectively.
Dependent Variable = ln(Time to exit + 1)
I(MF financing) 0.1925*** 0.2073*** 0.4715*** (4.5891) (4.8844) (2.7803) ln(Amount invested by MF + 1) ($ mil) 0.0433*** 0.0536*** 0.2438*** (2.5963) (3.1446) (3.1516) # MF investors 0.0009** 0.0010*** 0.0033*** (2.2224) (2.8278) (3.1640) VC firm age -0.0001 -0.0001 -0.0001 -0.0016 -0.0020 -0.0021 -0.0013 -0.0022 -0.0027* (-0.0525) (-0.0760) (-0.0606) (-1.0401) (-1.2110) (-1.3402) (-0.8402) (-1.2797) (-1.6890) # Companies funded -0.0118 -0.0114 -0.0115 -0.0415 -0.0290 -0.0320 -0.0516 -0.0333 -0.0284 (-0.9682) (-0.9374) (-0.9473) (-1.3625) (-0.8798) (-1.0344) (-1.6436) (-0.9312) (-0.8975) # Exits 0.0127 0.0126 0.0123 -0.0021 -0.0078 -0.0063 0.0020 -0.0021 -0.0088 (1.3578) (1.3458) (1.3051) (-0.0995) (-0.3513) (-0.2985) (0.0943) (-0.0807) (-0.4023) VC Syndicate Size 0.0292*** 0.0292*** 0.0292*** 0.0262*** 0.0263*** 0.0273*** 0.0270*** 0.0328*** 0.0315*** (9.9524) (9.9283) (9.9385) (3.2150) (3.0078) (3.3119) (3.3670) (3.5213) (3.7797) ln(Amount Raised + 1) ($ mil) 0.1467*** 0.1475*** 0.1471*** 0.1116*** 0.1200*** 0.1037*** 0.1138*** 0.0899*** 0.0895*** (18.3204) (18.3530) (18.2683) (4.3353) (4.1605) (3.9743) (4.5266) (2.7792) (3.3441) ln(Patents applied + 1) 0.1168*** 0.1170*** 0.1164*** 0.1368*** 0.1310*** 0.1330*** 0.1296*** 0.1157*** 0.1110*** (10.4649) (10.3670) (10.4087) (4.0914) (3.5229) (3.9198) (3.8135) (2.7807) (2.9480) Observations 7,292 7,259 7,292 589 551 589 589 551 589 R-squared 0.2856 0.2855 0.2844 0.3978 0.3929 0.3848 0.3576 0.2415 0.3218 Specification OLS OLS OLS OLS OLS OLS 2SLS 2SLS 2SLS Kleibergen-Paap rk Wald F statistic 24.677 17.257 35.391 First VC round 1990-2016 1990-2016 1990-2016 1990-2016 1990-2016 1990-2016 1990-2016 1990-2016 1990-2016 Co's with MF investment 127 94 127 136 98 136 136 98 136 Stage, Location, Industry, First VC round year FE
Yes Yes Yes Yes Yes Yes Yes Yes Yes
Number of Lead VC FE 965 965 965 None None None None None None Restriction Match Samp Match Samp Match Samp Match Samp Match Samp Match Samp
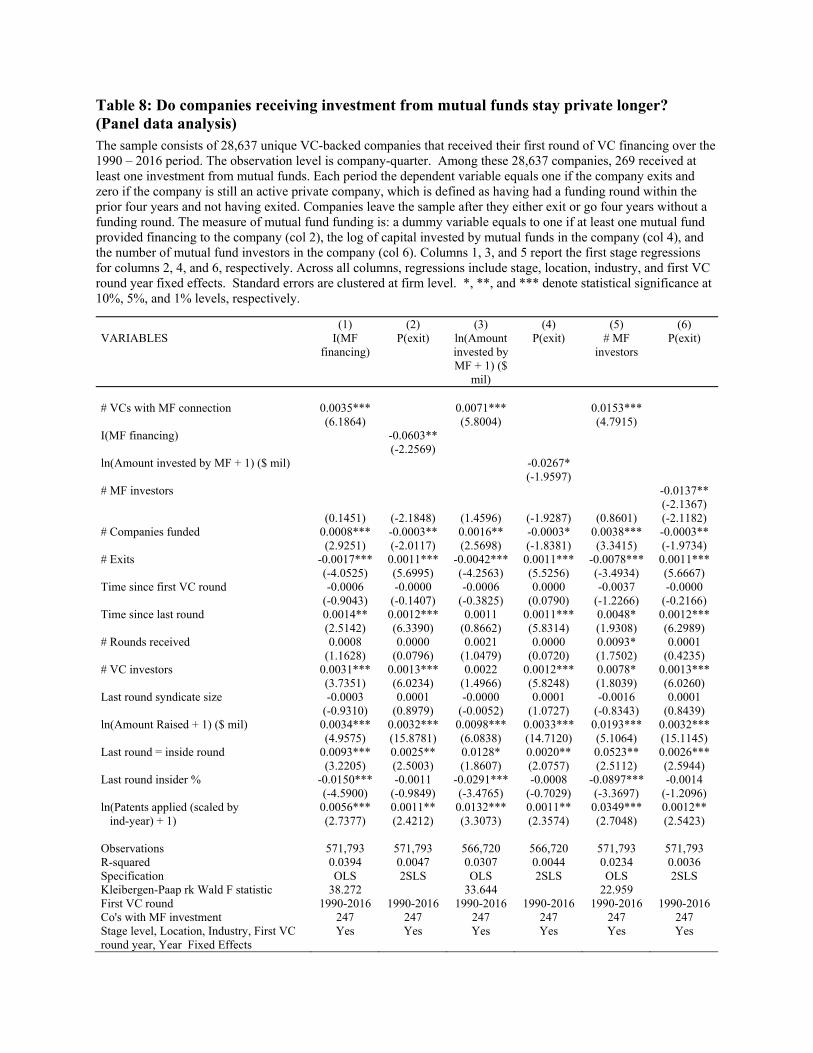
Table 8: Do companies receiving investment from mutual funds stay private longer? (Panel data analysis) The sample consists of 28,637 unique VC-backed companies that received their first round of VC financing over the 1990 – 2016 period. The observation level is company-quarter. Among these 28,637 companies, 269 received at least one investment from mutual funds. Each period the dependent variable equals one if the company exits and zero if the company is still an active private company, which is defined as having had a funding round within the prior four years and not having exited. Companies leave the sample after they either exit or go four years without a funding round. The measure of mutual fund funding is: a dummy variable equals to one if at least one mutual fund provided financing to the company (col 2), the log of capital invested by mutual funds in the company (col 4), and the number of mutual fund investors in the company (col 6). Columns 1, 3, and 5 report the first stage regressions for columns 2, 4, and 6, respectively. Across all columns, regressions include stage, location, industry, and first VC round year fixed effects. Standard errors are clustered at firm level. *, **, and *** denote statistical significance at 10%, 5%, and 1% levels, respectively.
(1) (2) (3) (4) (5) (6) VARIABLES I(MF
financing) P(exit) ln(Amount
invested by MF + 1) ($
mil)
P(exit) # MF investors
P(exit)
# VCs with MF connection 0.0035*** 0.0071*** 0.0153*** (6.1864) (5.8004) (4.7915) I(MF financing) -0.0603** (-2.2569) ln(Amount invested by MF + 1) ($ mil) -0.0267* (-1.9597) # MF investors -0.0137** (-2.1367) (0.1451) (-2.1848) (1.4596) (-1.9287) (0.8601) (-2.1182) # Companies funded 0.0008*** -0.0003** 0.0016** -0.0003* 0.0038*** -0.0003** (2.9251) (-2.0117) (2.5698) (-1.8381) (3.3415) (-1.9734) # Exits -0.0017*** 0.0011*** -0.0042*** 0.0011*** -0.0078*** 0.0011*** (-4.0525) (5.6995) (-4.2563) (5.5256) (-3.4934) (5.6667) Time since first VC round -0.0006 -0.0000 -0.0006 0.0000 -0.0037 -0.0000 (-0.9043) (-0.1407) (-0.3825) (0.0790) (-1.2266) (-0.2166) Time since last round 0.0014** 0.0012*** 0.0011 0.0011*** 0.0048* 0.0012*** (2.5142) (6.3390) (0.8662) (5.8314) (1.9308) (6.2989) # Rounds received 0.0008 0.0000 0.0021 0.0000 0.0093* 0.0001 (1.1628) (0.0796) (1.0479) (0.0720) (1.7502) (0.4235) # VC investors 0.0031*** 0.0013*** 0.0022 0.0012*** 0.0078* 0.0013*** (3.7351) (6.0234) (1.4966) (5.8248) (1.8039) (6.0260) Last round syndicate size -0.0003 0.0001 -0.0000 0.0001 -0.0016 0.0001 (-0.9310) (0.8979) (-0.0052) (1.0727) (-0.8343) (0.8439) ln(Amount Raised + 1) ($ mil) 0.0034*** 0.0032*** 0.0098*** 0.0033*** 0.0193*** 0.0032*** (4.9575) (15.8781) (6.0838) (14.7120) (5.1064) (15.1145) Last round = inside round 0.0093*** 0.0025** 0.0128* 0.0020** 0.0523** 0.0026*** (3.2205) (2.5003) (1.8607) (2.0757) (2.5112) (2.5944) Last round insider % -0.0150*** -0.0011 -0.0291*** -0.0008 -0.0897*** -0.0014 (-4.5900) (-0.9849) (-3.4765) (-0.7029) (-3.3697) (-1.2096) ln(Patents applied (scaled by 0.0056*** 0.0011** 0.0132*** 0.0011** 0.0349*** 0.0012** ind-year) + 1) (2.7377) (2.4212) (3.3073) (2.3574) (2.7048) (2.5423) Observations 571,793 571,793 566,720 566,720 571,793 571,793 R-squared 0.0394 0.0047 0.0307 0.0044 0.0234 0.0036 Specification OLS 2SLS OLS 2SLS OLS 2SLS Kleibergen-Paap rk Wald F statistic 38.272 33.644 22.959 First VC round 1990-2016 1990-2016 1990-2016 1990-2016 1990-2016 1990-2016 Co's with MF investment 247 247 247 247 247 247 Stage level, Location, Industry, First VC round year, Year Fixed Effects
Yes Yes Yes Yes Yes Yes
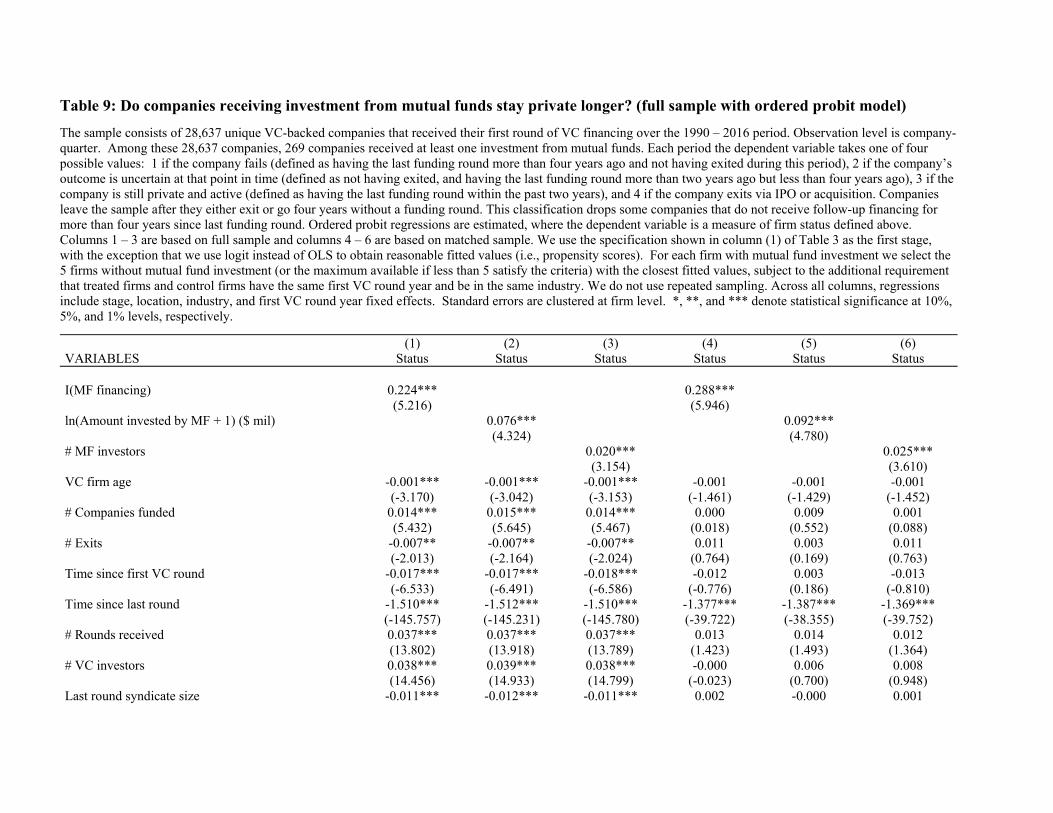
Table 9: Do companies receiving investment from mutual funds stay private longer? (full sample with ordered probit model)
The sample consists of 28,637 unique VC-backed companies that received their first round of VC financing over the 1990 – 2016 period. Observation level is company-quarter. Among these 28,637 companies, 269 companies received at least one investment from mutual funds. Each period the dependent variable takes one of four possible values: 1 if the company fails (defined as having the last funding round more than four years ago and not having exited during this period), 2 if the company’s outcome is uncertain at that point in time (defined as not having exited, and having the last funding round more than two years ago but less than four years ago), 3 if the company is still private and active (defined as having the last funding round within the past two years), and 4 if the company exits via IPO or acquisition. Companies leave the sample after they either exit or go four years without a funding round. This classification drops some companies that do not receive follow-up financing for more than four years since last funding round. Ordered probit regressions are estimated, where the dependent variable is a measure of firm status defined above. Columns 1 – 3 are based on full sample and columns 4 – 6 are based on matched sample. We use the specification shown in column (1) of Table 3 as the first stage, with the exception that we use logit instead of OLS to obtain reasonable fitted values (i.e., propensity scores). For each firm with mutual fund investment we select the 5 firms without mutual fund investment (or the maximum available if less than 5 satisfy the criteria) with the closest fitted values, subject to the additional requirement that treated firms and control firms have the same first VC round year and be in the same industry. We do not use repeated sampling. Across all columns, regressions include stage, location, industry, and first VC round year fixed effects. Standard errors are clustered at firm level. *, **, and *** denote statistical significance at 10%, 5%, and 1% levels, respectively.
(1) (2) (3) (4) (5) (6) VARIABLES Status Status Status Status Status Status I(MF financing) 0.224*** 0.288*** (5.216) (5.946) ln(Amount invested by MF + 1) ($ mil) 0.076*** 0.092*** (4.324) (4.780) # MF investors 0.020*** 0.025*** (3.154) (3.610) VC firm age -0.001*** -0.001*** -0.001*** -0.001 -0.001 -0.001 (-3.170) (-3.042) (-3.153) (-1.461) (-1.429) (-1.452) # Companies funded 0.014*** 0.015*** 0.014*** 0.000 0.009 0.001 (5.432) (5.645) (5.467) (0.018) (0.552) (0.088) # Exits -0.007** -0.007** -0.007** 0.011 0.003 0.011 (-2.013) (-2.164) (-2.024) (0.764) (0.169) (0.763) Time since first VC round -0.017*** -0.017*** -0.018*** -0.012 0.003 -0.013 (-6.533) (-6.491) (-6.586) (-0.776) (0.186) (-0.810) Time since last round -1.510*** -1.512*** -1.510*** -1.377*** -1.387*** -1.369*** (-145.757) (-145.231) (-145.780) (-39.722) (-38.355) (-39.752) # Rounds received 0.037*** 0.037*** 0.037*** 0.013 0.014 0.012 (13.802) (13.918) (13.789) (1.423) (1.493) (1.364) # VC investors 0.038*** 0.039*** 0.038*** -0.000 0.006 0.008 (14.456) (14.933) (14.799) (-0.023) (0.700) (0.948) Last round syndicate size -0.011*** -0.012*** -0.011*** 0.002 -0.000 0.001
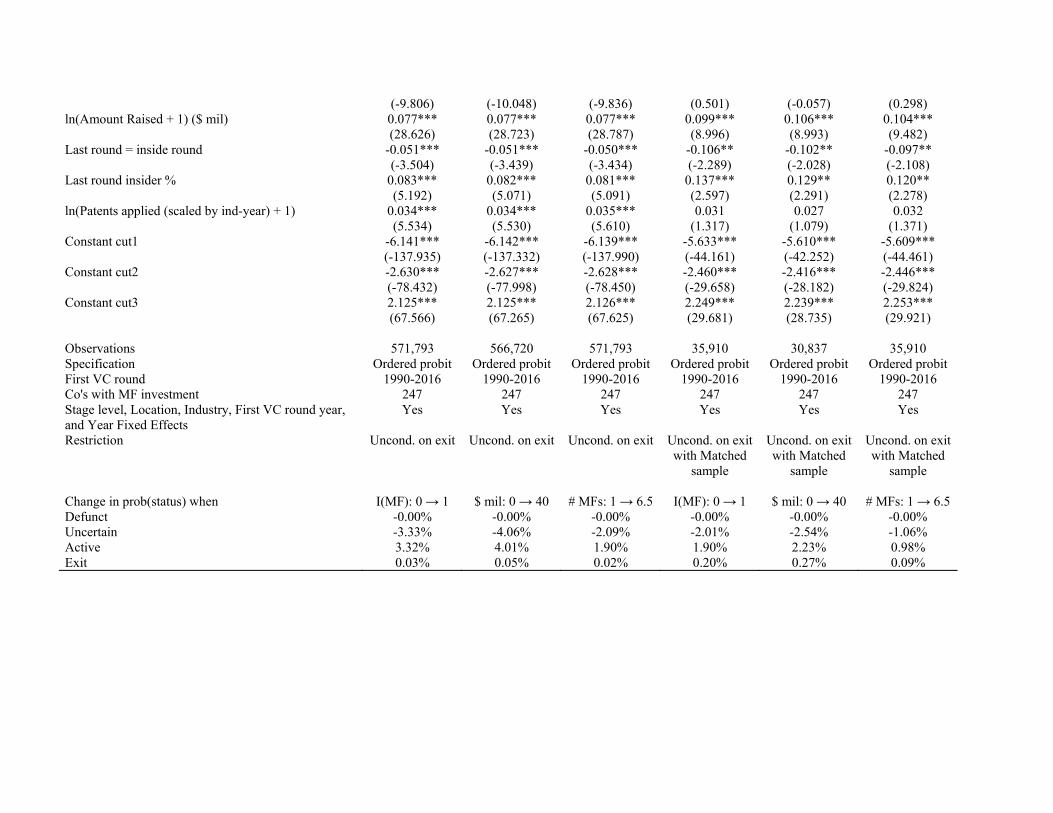
(-9.806) (-10.048) (-9.836) (0.501) (-0.057) (0.298) ln(Amount Raised + 1) ($ mil) 0.077*** 0.077*** 0.077*** 0.099*** 0.106*** 0.104*** (28.626) (28.723) (28.787) (8.996) (8.993) (9.482) Last round = inside round -0.051*** -0.051*** -0.050*** -0.106** -0.102** -0.097** (-3.504) (-3.439) (-3.434) (-2.289) (-2.028) (-2.108) Last round insider % 0.083*** 0.082*** 0.081*** 0.137*** 0.129** 0.120** (5.192) (5.071) (5.091) (2.597) (2.291) (2.278) ln(Patents applied (scaled by ind-year) + 1) 0.034*** 0.034*** 0.035*** 0.031 0.027 0.032 (5.534) (5.530) (5.610) (1.317) (1.079) (1.371) Constant cut1 -6.141*** -6.142*** -6.139*** -5.633*** -5.610*** -5.609*** (-137.935) (-137.332) (-137.990) (-44.161) (-42.252) (-44.461) Constant cut2 -2.630*** -2.627*** -2.628*** -2.460*** -2.416*** -2.446*** (-78.432) (-77.998) (-78.450) (-29.658) (-28.182) (-29.824) Constant cut3 2.125*** 2.125*** 2.126*** 2.249*** 2.239*** 2.253*** (67.566) (67.265) (67.625) (29.681) (28.735) (29.921) Observations 571,793 566,720 571,793 35,910 30,837 35,910 Specification Ordered probit Ordered probit Ordered probit Ordered probit Ordered probit Ordered probit First VC round 1990-2016 1990-2016 1990-2016 1990-2016 1990-2016 1990-2016 Co's with MF investment 247 247 247 247 247 247 Stage level, Location, Industry, First VC round year, and Year Fixed Effects
Yes Yes Yes Yes Yes Yes
Restriction Uncond. on exit Uncond. on exit Uncond. on exit Uncond. on exit with Matched
sample
Uncond. on exit with Matched
sample
Uncond. on exit with Matched
sample Change in prob(status) when I(MF): 0 → 1 $ mil: 0 → 40 # MFs: 1 → 6.5 I(MF): 0 → 1 $ mil: 0 → 40 # MFs: 1 → 6.5 Defunct -0.00% -0.00% -0.00% -0.00% -0.00% -0.00% Uncertain -3.33% -4.06% -2.09% -2.01% -2.54% -1.06% Active 3.32% 4.01% 1.90% 1.90% 2.23% 0.98% Exit 0.03% 0.05% 0.02% 0.20% 0.27% 0.09%
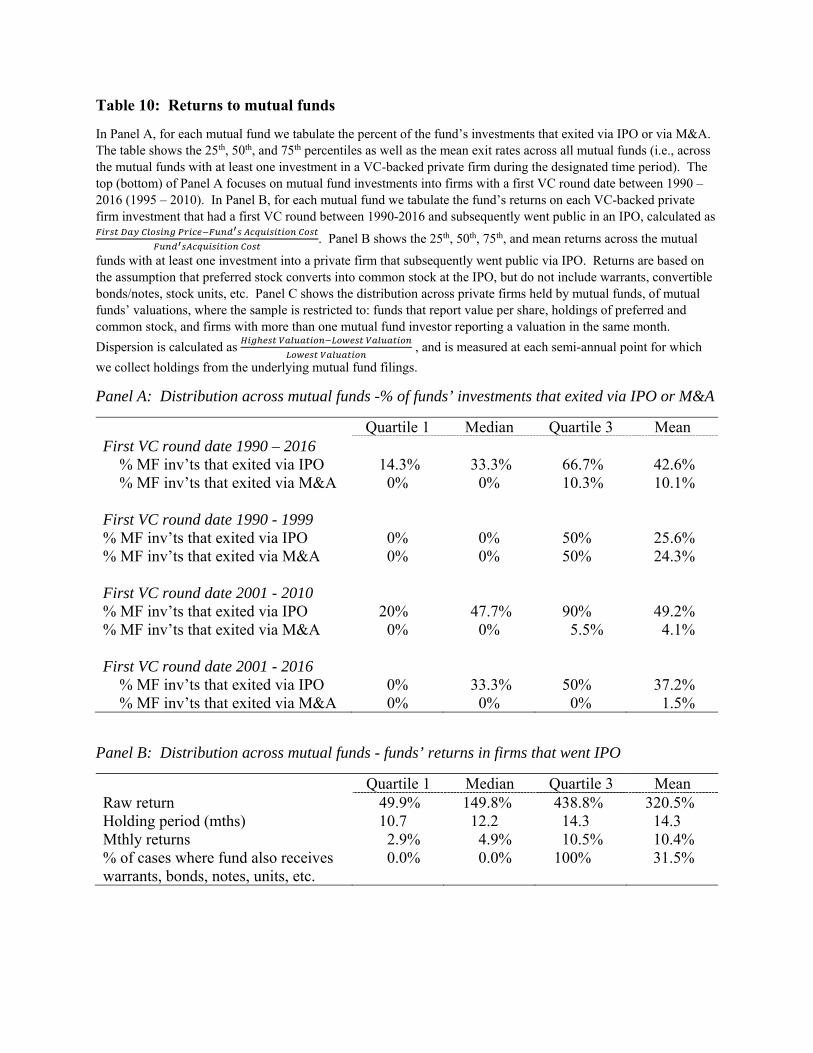
Table 10: Returns to mutual funds
In Panel A, for each mutual fund we tabulate the percent of the fund’s investments that exited via IPO or via M&A. The table shows the 25th, 50th, and 75th percentiles as well as the mean exit rates across all mutual funds (i.e., across the mutual funds with at least one investment in a VC-backed private firm during the designated time period). The top (bottom) of Panel A focuses on mutual fund investments into firms with a first VC round date between 1990 – 2016 (1995 – 2010). In Panel B, for each mutual fund we tabulate the fund’s returns on each VC-backed private firm investment that had a first VC round between 1990-2016 and subsequently went public in an IPO, calculated as
. Panel B shows the 25th, 50th, 75th, and mean returns across the mutual
funds with at least one investment into a private firm that subsequently went public via IPO. Returns are based on the assumption that preferred stock converts into common stock at the IPO, but do not include warrants, convertible bonds/notes, stock units, etc. Panel C shows the distribution across private firms held by mutual funds, of mutual funds’ valuations, where the sample is restricted to: funds that report value per share, holdings of preferred and common stock, and firms with more than one mutual fund investor reporting a valuation in the same month.
Dispersion is calculated as
, and is measured at each semi-annual point for which
we collect holdings from the underlying mutual fund filings.
Panel A: Distribution across mutual funds -% of funds’ investments that exited via IPO or M&A
Quartile 1 Median Quartile 3 Mean First VC round date 1990 – 2016
% MF inv’ts that exited via IPO 14.3% 33.3% 66.7% 42.6% % MF inv’ts that exited via M&A 0% 0% 10.3% 10.1%
First VC round date 1990 - 1999 % MF inv’ts that exited via IPO 0% 0% 50% 25.6% % MF inv’ts that exited via M&A 0% 0% 50% 24.3% First VC round date 2001 - 2010 % MF inv’ts that exited via IPO 20% 47.7% 90% 49.2% % MF inv’ts that exited via M&A 0% 0% 5.5% 4.1% First VC round date 2001 - 2016
% MF inv’ts that exited via IPO 0% 33.3% 50% 37.2% % MF inv’ts that exited via M&A 0% 0% 0% 1.5%
Panel B: Distribution across mutual funds - funds’ returns in firms that went IPO
Quartile 1 Median Quartile 3 Mean Raw return 49.9% 149.8% 438.8% 320.5% Holding period (mths) 10.7 12.2 14.3 14.3 Mthly returns 2.9% 4.9% 10.5% 10.4% % of cases where fund also receives warrants, bonds, notes, units, etc.
0.0% 0.0% 100% 31.5%

Panel C: Distribution across private firms – dispersion in mutual funds’ valuations
Average [median] # entities holding firm
Dispersion in Valuation across Mutual Funds
# Firms
# Firm-Periods
# Funds # Families Q1 Median Q3 90th pctl
95th pctl
Private firms held by >1 MF
134 933 9.29 [6.00]
2.65 [1.00]
0.00 0.00 0.07 0.34 1.02