MUST Jasaan Campus Graduates Tracer Study …euacademic.org/UploadArticle/1665.pdfRuel S. Salvador,...
33
2194 ISSN 2286-4822 www.euacademic.org EUROPEAN ACADEMIC RESEARCH Vol. III, Issue 2/ May 2015 Impact Factor: 3.4546 (UIF) DRJI Value: 5.9 (B+) MUST Jasaan Campus Graduates Tracer Study Academic Year 2000-2001 to Academic Year 2009- 2010 Engr. RUEL S. SALVADOR Prof. FERDINAND M. ORAIZ Engr. MARICEL C. MANDAWE Mindanao University of Science and Technology Jasaan Campus, Jasaan Misamis Oriental Philippines Abstract: This graduate tracer study is mainly a survey intended to trace the graduates of MPSC/MUST to their place of employment or self- employment after graduation. To obtain the needed information, the researchers used a questionnaire developed by the CHED. It is known as Graduate Tracer Survey Study and served as the data gathering instrument. The subjects of the study were the 216 of the 458 MPSC/MUST graduates who responded and submitted themselves for the survey from the different academic programs offered by the University Campus. These were the graduates from School Year 2000-2001 to School Year 2009-2010. Findings of the study revealed that the MPSC/MUST Jasaan Campus graduates of SY 2000-2001 to SY 2009-2010 majority of them are employed as regular or permanent in their present and current job either technician and associate professionals and clerks. Most of the respondents work in companies or organizations that have to do with manufacturing and construction. A quite number of respondents work abroad. Majority of them, their current or present job is their first job which is related to the course they took in college. As to the whether the education they get from MPSC/MUST Jasaan Campus contributed their success in life, majority of the respondents answer ‘strong agree’.
Transcript of MUST Jasaan Campus Graduates Tracer Study …euacademic.org/UploadArticle/1665.pdfRuel S. Salvador,...

2194
ISSN 2286-4822
www.euacademic.org
EUROPEAN ACADEMIC RESEARCH
Vol. III, Issue 2/ May 2015
Impact Factor: 3.4546 (UIF)
DRJI Value: 5.9 (B+)
MUST Jasaan Campus Graduates Tracer Study
Academic Year 2000-2001 to Academic Year 2009-
2010
Engr. RUEL S. SALVADOR
Prof. FERDINAND M. ORAIZ
Engr. MARICEL C. MANDAWE Mindanao University of Science and Technology
Jasaan Campus, Jasaan Misamis Oriental
Philippines
Abstract:
This graduate tracer study is mainly a survey intended to trace
the graduates of MPSC/MUST to their place of employment or self-
employment after graduation. To obtain the needed information, the
researchers used a questionnaire developed by the CHED. It is known
as Graduate Tracer Survey Study and served as the data gathering
instrument.
The subjects of the study were the 216 of the 458 MPSC/MUST
graduates who responded and submitted themselves for the survey
from the different academic programs offered by the University
Campus. These were the graduates from School Year 2000-2001 to
School Year 2009-2010.
Findings of the study revealed that the MPSC/MUST Jasaan
Campus graduates of SY 2000-2001 to SY 2009-2010 majority of them
are employed as regular or permanent in their present and current job
either technician and associate professionals and clerks. Most of the
respondents work in companies or organizations that have to do with
manufacturing and construction. A quite number of respondents work
abroad. Majority of them, their current or present job is their first job
which is related to the course they took in college. As to the whether the
education they get from MPSC/MUST Jasaan Campus contributed
their success in life, majority of the respondents answer ‘strong agree’.

Ruel S. Salvador, Ferdinand M. Oraiz, Maricel C. Mandawe - MUST Jasaan Campus
Graduates Tracer Study Academic Year 2000-2001 to Academic Year 2009-2010
EUROPEAN ACADEMIC RESEARCH - Vol. III, Issue 2 / May 2015
2195
Key words: Graduate tracer study; Employment; Employable
graduates; Satellite Campus
Background and Rationale
Recognizing the importance of evaluating the status of an
educational institution’s alumni is crucial to its growth if not to
its existence. Perhaps the most important objective of the
college education is employment. Most parents send their
children to college with the hope that after graduation their
children will be able to find a decent and stable job. This holds
true especially among Filipino parents who look at the value of
college education as the most important legacy they can give
their children and as the most effective means of getting a job
that would help build the future of their children (Mercado,
2010).
However, with the present quality of education and the
pressing demand of the workforce in the industry, many
parents and graduates get disappointment due to the inability
of the graduates to get employed. This is partly because these
graduates lack necessary skills and qualifications required by
the industry (Mercado, 2010). This need is recognized by
government agencies that govern the quality of instruction in
Higher Education Institutions (HEI’s) like Mindanao
University of Science and Technology (MUST) Jasaan Campus.
Aware of the present situation, the MUST Jasaan Campus, a
satellite campus of MUST located in the municipality of
Jasaan, Misamis Oriental through its Research Division
encourages the administrator and faculty of MUST Jasaan
Campus to initiate the conduct of Graduate Tracer Study (GTS)
among its graduates to obtain data that would show if MUST
Jasaan Campus are offering courses and producing graduates
that meet the needs of industry and society. Likewise, through
the GTS, MUST Jasaan Campus would be able to align their

Ruel S. Salvador, Ferdinand M. Oraiz, Maricel C. Mandawe - MUST Jasaan Campus
Graduates Tracer Study Academic Year 2000-2001 to Academic Year 2009-2010
EUROPEAN ACADEMIC RESEARCH - Vol. III, Issue 2 / May 2015
2196
efforts with the manpower needs of the industry and society to
make its existence be justified.
Statement of the Problem
The study aims to trace the MPSC/MUST Jasaan Campus
graduates on their training, employability and
accomplishments after completing a college degree from the
University Campus to their place of employment or self-
employment. Specifically, the graduate tracer study sought
answers to the following questions:
1. What are the biographic characteristics of MUST Jasaan
Campus graduates with regard to:
a. civil status;
b. sex;
c. age;
d. region of origin;
e. province of origin; and
f. location of residents.
2. What are the educational qualification of the
respondents in term of:
a. educational attainment;
b. scholastic honor received;
c. professional examination passed;
d. training/advance studies;
e. competencies learned in college that were useful in
the first job; and
f. if self-employed, what skills acquired in college were
helpful in self-employment.
3. What situational factors influenced the qualification of
respondents?
a. reasons for taking the course; and
b. reasons for pursuing advanced studies.
4. What is the employment situation of the respondents in
term of:

Ruel S. Salvador, Ferdinand M. Oraiz, Maricel C. Mandawe - MUST Jasaan Campus
Graduates Tracer Study Academic Year 2000-2001 to Academic Year 2009-2010
EUROPEAN ACADEMIC RESEARCH - Vol. III, Issue 2 / May 2015
2197
a. current employment situation (employed or not);
b. present employment situation;
c. present occupation;
d. first job;
e. relatedness of the first job to college course;
f. length of stay in first job;
g. Waiting time before landing on the first job;
h. job level position;
i. initial gross monthly earning in first job; and
j. relevance of college curriculum to first job.
5. What situational factors influenced the employment
situation of the respondents?
a. reasons for staying on the job;
b. reason for accepting first job;
c. reasons for changing job;
d. reasons why not employed; and
e. how respondents found their first job.
6. Which programs have the highest percentage of
graduates employed?
7. Which programs have the highest potentials for highest
initial earning?
8. What is the profile of graduates who are most employed?
9. What is the perception of the graduates of MPSC/Jasaan
Campus in terms of the following, to wit:
a. whether the education obtained contribute to their
success in life;
b. its existence in providing students seeking higher
education;
c. suggestion to improved the curricular programs; and
d. the reasons why studied at MPSC/MUST Jasaan
Campus.

Ruel S. Salvador, Ferdinand M. Oraiz, Maricel C. Mandawe - MUST Jasaan Campus
Graduates Tracer Study Academic Year 2000-2001 to Academic Year 2009-2010
EUROPEAN ACADEMIC RESEARCH - Vol. III, Issue 2 / May 2015
2198
Significance of the Study
It is hoped that this study will yield results and findings that
will be relevant basis for enhancing the MPSC Jasaan Campus
now MUST Jasaan Campus curricular programs as a higher
learning institution in the eastern part of Misamis Oriental.
This study will benefit the following:
Governing Board and the Administration. This study will
provide them an information and overview the performance of
MPSC Jasaan Campus now MUST Jasaan Campus from 2001
to 2010 based on the results and finding of the study and
hopefully come up with an institutional policies to make the
campuses more responsive in meeting its mission, vision, goals
and objectives.
Faculty and Staff. The finding of this study will justify the
qualification and training needs of the faculty and staff to
improve their competencies in imparting quality instructions in
order to achieve higher employability rate of its graduates even
if they are graduates from the satellite campuses.
Parents. The results of the study will serve as information on
the role and the effort done by the MUST Jasaan Campus in
providing quality and highly competitive higher education
programs to their children.
Future Researchers. This study will serve as reference to the
researcher for their future studies.
Conceptual Framework
The conceptual frame of the study is based on the approved
CHED funded GTS initiated study. It shows the variables that
are at play in the GTS research. In this study, the independent

Ruel S. Salvador, Ferdinand M. Oraiz, Maricel C. Mandawe - MUST Jasaan Campus
Graduates Tracer Study Academic Year 2000-2001 to Academic Year 2009-2010
EUROPEAN ACADEMIC RESEARCH - Vol. III, Issue 2 / May 2015
2199
variables are assumed to affect the dependent variables. The
independent variables are the characteristics and qualification
of graduates, which includes biographical, educational, and
situational profile of the graduates. The dependent variables
are the employment factors such as type of employment,
current employment situation, employment status, occupation,
classification of company or organization where respondents
work, place of work, relatedness of the first job to the course in
college, job reach time or waiting time before landing the first
job, job level position, initial gross monthly earning in the first
job, and reason for accepting and staying on the job. The
conceptual framework is roughly diagramed below.
Independent Variables Dependent Variables
Biographical Characteristics of MUST Jasaan
Campus Graduates
Civil Status
Sex
Age
Region of origin
Province of origin
Location of residence Educational Qualification of MUST Jasaan
Campus Graduates
Educational Attainment
Honors or awards received
Licensure Examination passed
Training attended after college
Reason for pursuing advanced studies
Skills or competencies found most useful in the first job
Situational Characteristics of MUST Jasaan
Campus Graduates
Reasons for taking the course
Employment factors
Type of Employment
Current Employment Situation
Employment Status
Occupation
Company or organization
Place of work
Job level position
Initial gross monthly
earning
Reason for accepting and
staying of the job
About MPSC/MUST
Figure1. Conceptual framework
of the Graduate Tracer Study
(GTS)

Ruel S. Salvador, Ferdinand M. Oraiz, Maricel C. Mandawe - MUST Jasaan Campus
Graduates Tracer Study Academic Year 2000-2001 to Academic Year 2009-2010
EUROPEAN ACADEMIC RESEARCH - Vol. III, Issue 2 / May 2015
2200
Methodology
This graduate tracer study is mainly a survey intended to trace
graduates from their school of origin to their place of
employment or self-employment. To obtain the needed
information, this research study used a questionnaire
developed by the CHED. It is called Graduate Tracer Survey
Study and served as the data gathering instrument.
The subjects of the study were 216 MPSC/MUST Jasaan
Campus whose names were drawn randomly from the master
list of 458 graduates of the different academic programs offered
by the University Campus. These were the graduates from the
three-year technician program form School Year 2000-2001 to
School Year 2006-2007 and the degree program form SY 2007-
2008 to SY 2008-2010. Slovin formula was used in determining
the number of respondents included in the sample.
The graduates included in the sample were asked to
personally accomplish the survey form sent to them via snail
mail, email or contact persons. Telephone and cellular phones
were also used to interview the respondents and to verify
information in the survey form.
The quantitative data obtained through questionnaire
were subjected to a statistical test to determine the percentage
of frequency of occurrence of the different categories singled out
in the questionnaire.
Since the researchers used the questionnaire used by
CHED in its bigger and wider study hence, there is no need to
validate the survey questionnaire. A descriptive write up was
made of the analysis of data (Rodriguez, 2006, p.39).

Ruel S. Salvador, Ferdinand M. Oraiz, Maricel C. Mandawe - MUST Jasaan Campus
Graduates Tracer Study Academic Year 2000-2001 to Academic Year 2009-2010
EUROPEAN ACADEMIC RESEARCH - Vol. III, Issue 2 / May 2015
2201
Results and Discussion
I. Biographic Profile of the Respondents
Table 1 Biographic Characteristics of MUST Jasaan Campus
Graduates of SY 2000-2001 to SY 2009-2010
Biographic Profile Frequency Percentage
Civil Status
Single 73 33.79%
Married 140 64.81%
Separated 1 0.46%
Single Parent 2 0.94%
Sex
Male 174 80.55%
Female 45 19.45%
Age
Below 20
21-22 years old
23-24 years old 12 5.55%
25-26 years old 35 16.20%
27-28 years old 43 19.91%
29-30 years old 54 25%
Above 30 72 33.33%
Region of Origin
Region 10 214 99.08%
Region 9 1 0.46%
CAR 1 0.46%
Province of Origin
Misamis Oriental 212 98.15%
Bukidnon 2 0.92%
Agusan del Norte 1 0.465%
Zamboanga del Norte 1 0.465%
Location of Residence
City 3 1.39%
Municipality 213 98.61%
A biographic profile of the respondents of the MUST Jasaan
Campus graduates who acted as respondents in the study
shows a majority of them are married (64.81%); male (80.55%);
above 30 (33.33%); residing in Region 10 (99.08%); from
province of Misamis Oriental (98.15%) and residing in the
municipality (98.61%).

Ruel S. Salvador, Ferdinand M. Oraiz, Maricel C. Mandawe - MUST Jasaan Campus
Graduates Tracer Study Academic Year 2000-2001 to Academic Year 2009-2010
EUROPEAN ACADEMIC RESEARCH - Vol. III, Issue 2 / May 2015
2202
II. Educational Qualification of the Respondents
Table 2: Educational Attainment of the Respondents
Discipline Frequency Percentage
Architectural Drafting Technology 10 4.63%
Automotive Engineering Technology/ Automotive
Technology
50 23.15%
Food Processing Technology/
Food Service Management
20 9.26%
Electrical Engineering Technology/ Electrical
Technology
60 27.78%
BS in Information Technology 41 18.98%
BS in Electrical Technology & Management 20 9.26%
BSE – Technology & Livelihood Education 10 4.63%
BSIT major in Automotive Technology 5 2.31%
Total 216 100%
Table 2 shows the educational attainment of the respondents. A
majority of them comes from the field of Electrical Engineering
Technology/Electrical Technology (27.78%). This is expected
since graduates of SY 2000-2001 to SY 2009-2010 come from
this program, which for the longest period of time (2001-2006) it
has been the flagship of the campus in terms of number of
enrollees. This is followed by graduates of Automotive
Engineering Technology/Automotive Technology (23.15%); BS
in Information Technology (18.98%); Food Processing
Technology/ Service Management and BS Electrical Technology
and Management are tied at 9.26%; Architectural Drafting
Technology and BSE-Technology and Livelihood Education are
also tied at 4.63%; and finally BS in Auto-Mechanical
Technology (2.31%) come the last in rank. About 1.85% of the
respondents received scholastic honors, cum laude (see Table
3).
Table 3: Scholastic Honors Received
Honors or Awards
Received
Frequency Percentage
Summa Cum Laude 0 0%
Magna Cum Laude 0 0%
Cum Laude 4 1.85%
Other Awards 0 0%
Ruel S. Salvador, Ferdinand M. Oraiz, Maricel C. Mandawe - MUST Jasaan Campus
Graduates Tracer Study Academic Year 2000-2001 to Academic Year 2009-2010
EUROPEAN ACADEMIC RESEARCH - Vol. III, Issue 2 / May 2015
2203
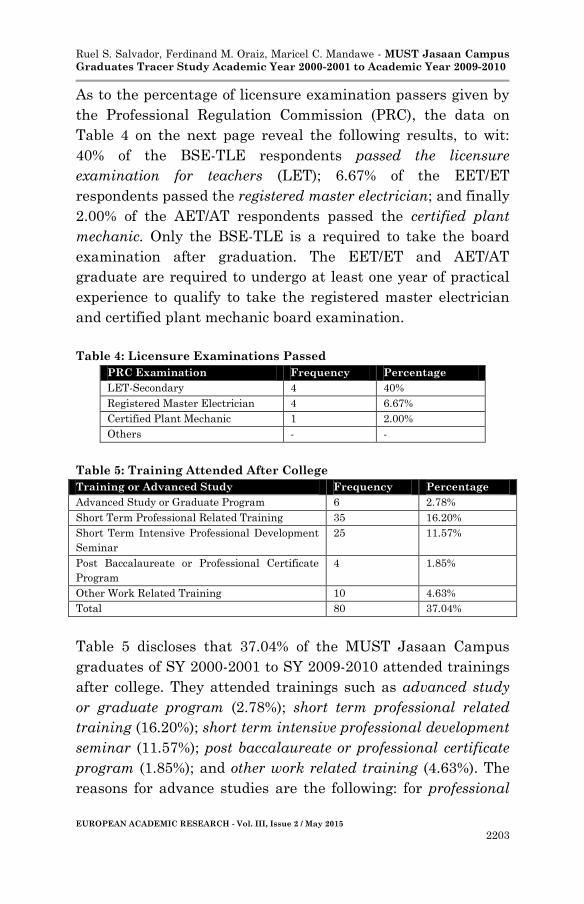
As to the percentage of licensure examination passers given by
the Professional Regulation Commission (PRC), the data on
Table 4 on the next page reveal the following results, to wit:
40% of the BSE-TLE respondents passed the licensure
examination for teachers (LET); 6.67% of the EET/ET
respondents passed the registered master electrician; and finally
2.00% of the AET/AT respondents passed the certified plant
mechanic. Only the BSE-TLE is a required to take the board
examination after graduation. The EET/ET and AET/AT
graduate are required to undergo at least one year of practical
experience to qualify to take the registered master electrician
and certified plant mechanic board examination.
Table 4: Licensure Examinations Passed
PRC Examination Frequency Percentage
LET-Secondary 4 40%
Registered Master Electrician 4 6.67%
Certified Plant Mechanic 1 2.00%
Others - -
Table 5: Training Attended After College
Training or Advanced Study Frequency Percentage
Advanced Study or Graduate Program 6 2.78%
Short Term Professional Related Training 35 16.20%
Short Term Intensive Professional Development
Seminar
25 11.57%
Post Baccalaureate or Professional Certificate
Program
4 1.85%
Other Work Related Training 10 4.63%
Total 80 37.04%
Table 5 discloses that 37.04% of the MUST Jasaan Campus
graduates of SY 2000-2001 to SY 2009-2010 attended trainings
after college. They attended trainings such as advanced study
or graduate program (2.78%); short term professional related
training (16.20%); short term intensive professional development
seminar (11.57%); post baccalaureate or professional certificate
program (1.85%); and other work related training (4.63%). The
reasons for advance studies are the following: for professional

Ruel S. Salvador, Ferdinand M. Oraiz, Maricel C. Mandawe - MUST Jasaan Campus
Graduates Tracer Study Academic Year 2000-2001 to Academic Year 2009-2010
EUROPEAN ACADEMIC RESEARCH - Vol. III, Issue 2 / May 2015
2204
development (1.85%) and for promotion (0.92%). This implies
that despite the benefits they get from taking advance study or
graduate program, only a small number of respondents about
2.78% pursue rather they focus on professional related training
and seminars. Table 6 provides data on this.
Table 6: Reasons for Pursuing Advanced Studies
Reasons Frequency Percentage
Professional Development 4 1.85%
Promotion 2 0.92%
Other Reasons - -
Among the skills or competencies learned in college,
communications skills appeared to be the skill that is most
useful to the graduates in their first job. This is expected
considering that all applicants will always undergo interview as
part of the recruitment process. This was disclosed by 83.33% of
the respondents. This is followed by the critical thinking skills
(73.61%) and closely with problem-solving skills at 72.22%. This
is also expected since MUST Jasaan Campus graduates are
technology based oriented as such critical thinking and
problem-solving are the essential skills needed to carrying their
respective job. The other skills are as follows: information
technology skills (65.28%); and human relation skills (50.92%).
What appeared to be the skill that was least useful to the
graduates in their first job was the entrepreneurship skill as
this was identified by only 23.15% of the respondents.
Data presented in Table 7 on the next page implies that
that the graduates find these skills learned in college crucial to
their job. Since only a measly 5.59% of the respondents are self-
employed, they cited entrepreneurship skill as the skill that
was most useful in self-employment.

Ruel S. Salvador, Ferdinand M. Oraiz, Maricel C. Mandawe - MUST Jasaan Campus
Graduates Tracer Study Academic Year 2000-2001 to Academic Year 2009-2010
EUROPEAN ACADEMIC RESEARCH - Vol. III, Issue 2 / May 2015
2205
Table 7: Skills or Competencies Found most useful In the First Job
Skills or Competencies Frequency Percentage
Communication skills 180 83.33%
Human Relation skills 110 50.92%
Information Technology skills 141 65.28%
Critical thinking skills 159 73.61%
Problem-Solving skills 156 72.22%
Entrepreneurship skills 50 23.15%
Other skills - -
This finding indicates that, among other skills and
entrepreneurship skill and good human relations are important
factors in self- employment.
III. Situational Factors that Influenced the
Qualification of Respondents
Table 8: Reasons for taking the Courses/Pursuing the Degrees in the
Undergraduate and Graduate Levels
Undergraduate
Graduate
Reasons Frequency Percent Rank Frequency Percent Rank
High grades
in the course
or subject
areas related
to the course
16 7.41% 2 33.33%
Good Grades
in High
school
22 10.18% 3 50.00%
Influence of
parents and
relatives
63 29.17% 4 2 33.33%
Peer
Influence 51 23.61% 6.5 3 50.00%
Inspired by a
role model 41 18.98% 5 83.33% 2
Strong
Passion For
the
Profession
51 23.61% 6.5 1 16.67%
Prospect for
immediate 120 55.56% 2 2 33.33%

Ruel S. Salvador, Ferdinand M. Oraiz, Maricel C. Mandawe - MUST Jasaan Campus
Graduates Tracer Study Academic Year 2000-2001 to Academic Year 2009-2010
EUROPEAN ACADEMIC RESEARCH - Vol. III, Issue 2 / May 2015
2206
employment
Status or
prestige of
the
profession
27 12.50% 4 66.67% 3
Availability
of course
offering in
school
122 56.48% 1 1 16.67%
Prospect of
career
advancement
39 18.06% 7 2 33.33%
Affordability
for the family 110 50.92% 3 3 50.00%
Prospect for
attractive
compensation
31 14.35% 6 100.00% 1
Opportunity
for
employment
abroad
61 28.24% 5 3 50.00%
No particular
choice or no
better idea
18 8.33% 2 33.33%
Other
Reasons - - 0 - -
Table 8 presents data relative to career choice. These include
reasons for taking the course or pursuing the degree at the
undergraduate and graduate levels. The table also shows
responses of those who earned an undergraduate degree and
those who finished or are working on their graduate studies. A
total of 14 reasons given in the questionnaire were ranked
according to the number of respondents who cited them as the
reason for their career choice.
Among those respondents who finished an
undergraduate degree, more than 18% singled out seven out of
the fourteen reasons given in the questionnaire. Following the
order of their ranking, these were: availability of course offering
in the school was cited by 56.48%; prospect for immediate
employment was cited by 55.56%; affordability for the family
comes third as cited by 50.92% and influence of parents and

Ruel S. Salvador, Ferdinand M. Oraiz, Maricel C. Mandawe - MUST Jasaan Campus
Graduates Tracer Study Academic Year 2000-2001 to Academic Year 2009-2010
EUROPEAN ACADEMIC RESEARCH - Vol. III, Issue 2 / May 2015
2207
relatives cited by 29.17% comes fourth; opportunity to work
abroad which was cited by 28.247% comes fifth in the rank.
Other reasons worth mentioning are peer influence and strong
passion for profession are tied at 23.61%; and prospect of career
advancement which was cited by 18.06%.
The data show that the respondents were pragmatic in
their career choice. They consider first and foremost the
availability of course offering of the school and the economic
benefit they would derive from their chosen courses. Most
importantly they do not only consider job prospect but also their
parent financial capability in the course they have chosen as
well as their parent and relative influence whom maybe an
alumni of the school.
On the other hand, three out of fourteen reasons given
in the questionnaire were singled out by the six respondents
who pursued advanced studies or graduate program after
college. The top among the list is prospect for attractive
compensation at 100%. This is followed by inspired by a role
model at 83.33 % and status or prestige of the profession at
66.67 % come second and third in rank respectively.
IV. Employment Situation of the Respondents
Part IV of the study pertains to the employment status of the
respondents. The data in Table 9 in the next page establish
whether the respondents are currently employed or not and the
reasons for unemployment. Data reveal that 82.87% of the
respondents are employed while 14.35% are currently not
employed and 2.78% have never been employed since
graduation.
Table 9: Current Employment Situation of the Respondents
Item Frequency Percentage
Yes 179 82.87%
No 31 14.35%
Never
Employed 6 2.78%

Ruel S. Salvador, Ferdinand M. Oraiz, Maricel C. Mandawe - MUST Jasaan Campus
Graduates Tracer Study Academic Year 2000-2001 to Academic Year 2009-2010
EUROPEAN ACADEMIC RESEARCH - Vol. III, Issue 2 / May 2015
2208
Table 10: Reasons Why Not Employed
Reasons Frequency Percentage
Family concern and decided not to find a job 13 35.14%
End of Contract and Still on the process of renewal 9 24.32%
Advance or further study 7 18.92%
Health-related reason(s) 2 5.41%
Did not look for a job - -
Lack of work experience - -
Other reasons: (Got Married after Graduation) 6 16.22%
No job opportunity - -
Among those respondents who are not employed or never been
employed since graduation from college, 35.14% indicated
family concerns and decided not to find a job as their reasons
for unemployment while 24.32% indicate end of contract and
still on the process of renewal as their reason for
unemployment. Other reasons were: advance or further study
(18.92%); got into marriage after graduation (16.222%); and
health-related (5.41%). No one among the unemployed
respondents cited reasons such as they did not look for a job,
lack of work experience and no job opportunity as their reasons
for unemployment. Table 10 provides relevant data on this.
The next three tables focus on the employment status
and occupation of the respondents as well as their designation
and the classification of the company or organization where
respondent work.
Table 11: Present Employment Status of the Respondents
Employment Status Frequency Percentage
Regular or Permanent 90 50.28%
Temporary 27 15.08%
Contractual 32 17.88%
Self-Employed 10 5.59%
Casual 20 11.17%
Among respondents who are presently employed, 50.28% are
regular or permanent; 15.08% are temporary; 11.17% are
casual; 15.08% are contractual and 5.59% are self-employed.
Table 11 provides data on this while Table 12 provides data on

Ruel S. Salvador, Ferdinand M. Oraiz, Maricel C. Mandawe - MUST Jasaan Campus
Graduates Tracer Study Academic Year 2000-2001 to Academic Year 2009-2010
EUROPEAN ACADEMIC RESEARCH - Vol. III, Issue 2 / May 2015
2209
the present occupation (designation) of employed respondents.
The present occupations were classified or clustered based on
the Philippine Standard Occupation Classification (PSOC) and
was used as point of reference in so far as work designations of
respondents are concerned.
Table 12: Present Occupation of the Respondents
Occupation Frequency Percentage
Teacher or Instructor 9 5.03%
Clerk 37 20.67%
Official of Government, and special-interest
organization, Corporate Executive, Managers,
Managing Proprietors and Supervisors
20
11.17%
Trades and Related Workers 19 10.61%
Technician and Associate Professionals 45 25.14%
Service Workers and Shop and Market Sales
Workers
8 4.47%
Plant and Machine Operators and Assemblers 41 22.91%
Laborer and Unskilled - -
Farmer or Fisherman - -
With regard to the type of occupation, 25.14% were hired as
technician and associate professionals; 22.91% were plant and
machine operators and assemblers; and 20.67% were clerks. The
other types of occupation were official of government, and
special-interest organization, corporate executive, managers,
managing proprietor and supervisor (11.17%); trades and
related workers (10.61%); teacher or instructor (5.03%); and
service workers and shop and market sales workers (4.47%).
With regard to the classification of company or
organization where respondents work, Table 13 on the next
page provides pertinent data on classified company or
organization as based on DTI classification or clustering.
Since MUST Jasaan Campus offers science and
technology courses, 26.82% indicated manufacturing as the
area they serve. Since all courses are technology based
programs 19.55% indicated construction firm while 11.17%
indicated electricity, gas and water supply as the company or
organization they work on. Other types of company or

Ruel S. Salvador, Ferdinand M. Oraiz, Maricel C. Mandawe - MUST Jasaan Campus
Graduates Tracer Study Academic Year 2000-2001 to Academic Year 2009-2010
EUROPEAN ACADEMIC RESEARCH - Vol. III, Issue 2 / May 2015
2210
organization where respondents work include the following:
wholesale and retail trade; repair of motor vehicles, motorcycles
and personal and household goods (8.38%); education (7.26%);
and public administration and defense; compulsory social
security (6.70%).
Table 13: Classification of Company or Organization Where
Respondents Work
Classification of Company or
Organization
Frequency Percentage
Education 13 7.26%
Wholesale and Retail Trade; repair of
motor vehicles , motorcycles and
personal and household goods
15
8.38%
Financial Intermediation 10 5.59%
Public Administration and defense;
Compulsory Social Security
12 6.70%
Hotels and Restaurant 6 3.35%
Manufacturing 48 26.82%
Transport, Storage ad Communication 5 2.79%
Health and Social Work 2 1.12%
Construction 35 19.55%
Real Estate, Renting and Business
Activities
6 3.35%
Other Community, Social and Personal
Services Activities
5 2.79%
Agriculture, Hunting and Forestry 2 1.12%
Electricity, Gas and Water Supply 20 11.17%
Fishing - -
Mining and Quarrying - -
Private Household with Employed
Persons
- -
Extra-Territorial Organization and
Bodies
- -
Table 14 below provides data on place of work of the
respondents. Majority of the respondents, that is, 88.83% work
locally or in the Philippines while 11.17% work abroad.

Ruel S. Salvador, Ferdinand M. Oraiz, Maricel C. Mandawe - MUST Jasaan Campus
Graduates Tracer Study Academic Year 2000-2001 to Academic Year 2009-2010
EUROPEAN ACADEMIC RESEARCH - Vol. III, Issue 2 / May 2015
2211
Table 14: Place of Work of Respondents
Place Frequency Percentage
Local 159 88.83%
Abroad 20 11.17%
The next part of the study focuses on the job itself. Table 15
shows data on the first job landed and specifically presents
whether present job is the first job or not.
The Table 15 below reveal that for 58.66% of the
respondents, their current job is their first job while 41.34% of
the respondents, their current job is no longer the job that they
had after graduation from college.
Table 15: Whether Present Job is First Job or Not
Item Frequency Percentage
YES 105 58.66%
NO 74 41.34%
Table 16 on the next page reveal that 83.80% perceived that the
courses they took in college have some bearing on the first job
they held. Only about 16.20% felt that the courses they took in
college are not related to the first job that they held.
Table 16: Whether First Job is related to the Course in College
Item Frequency Percentage
YES 150 83.80%
NO 29 16.20%
Table 17 indicates that for 26.26% of the respondents, their
length of stay in their first job was one year to less than two
years. For 20.67%, their length of stay in the first job was from
two years to less than three years and for 19.55%, it was one
month to six months. This is in consonance with the labor law
that temporary assignments should not be longer than six
months.

Ruel S. Salvador, Ferdinand M. Oraiz, Maricel C. Mandawe - MUST Jasaan Campus
Graduates Tracer Study Academic Year 2000-2001 to Academic Year 2009-2010
EUROPEAN ACADEMIC RESEARCH - Vol. III, Issue 2 / May 2015
2212
Table 17: Length of Stay in First Job
Length of Stay Frequency Percentage
3 years to less than 4 Years 8 4.47%
2 Years to less than 3 Years 37 20.67%
1 Year to less than 2 Years 47 26.26%
7 to 11 Months 30 16.78%
1 to 6 months 35 19.55%
Less a Month 5 2.79%
Others 7 3.91%
After the six months probationary period, the employer has to
either let the employee go or make him/her permanent which
would entitle the employee to all the benefits due for
permanent employees.
The next two tables have something to do with job
research. Table 18 indicates how first job was found while Table
19 indicates job research time or waiting time.
Table 18: How First Job Was Found/Secured
Item Frequency Percentage
Response to an Advertisement 50 27.93%
As Walk-in Applicant 67 37.43%
Recommended by Someone 12 6.70%
Information from Friends 19 10.61%
Arranged by School 3 1.68%
Family Business 2 1.68%
Job Fair or PESO 26 14.52%
Others - -
Table 18 indicates how first job was found by the respondents.
37.43% indicate walk-in application; 27.35% indicated response
to an advertisement; and 14.52% indicated job fair or PESO.
Table 19: Job Search Time Waiting Time
Item Frequency Percentage
1 to 6 Months 79 44.13%
7 to 11 Months 53 29.61%
Less Than a Month 13 7.26%
1 Year to less than 2 Years 23 12.85%
2 Years to less than 3 Years 7 3.91%
3 years to less than 4 Years 4 2.23%
Other - -

Ruel S. Salvador, Ferdinand M. Oraiz, Maricel C. Mandawe - MUST Jasaan Campus
Graduates Tracer Study Academic Year 2000-2001 to Academic Year 2009-2010
EUROPEAN ACADEMIC RESEARCH - Vol. III, Issue 2 / May 2015
2213
Table 19 provides data on how long a MUST Jasaan Campus
graduate has to wait before landing the first job after
graduation. The data reveal that, an MUST Jasaan Campus
graduate has to wait one to six months from the date of
graduation before s/he lands the first job. This was revealed by
44.13% of the respondents. Some 29.61% have to wait 7 to 11
months but some 12.85% had to wait one to less than two years
waiting time before they are able to secure their first job after
graduation.
An interesting result shows a good percentage of
graduates have only to wait less than a month after graduation
in order to get a job at 7.26%. They are hired before graduation
and started their job after graduation. Some were those who
work in companies or businesses owned by the family or those
who decided to be self-employed by running or starting their
own business.
The Table 20 presents data that has to do with job level
position of respondents in their first job after college and in
their current or present job.
Data presented in Table 20 reveal 50.84% and 53.07% of
the respondents held professional, technical or supervisory
position in their first job and current or present job
respectively. This is expected because all courses of MUST
Jasaan Campus are technology based programs, hence majority
of the respondents entry level are technicians and
professionals. Another interesting finding in this part of the
study is the increase in the number of self-employed graduates.
Table 20: Level of Position
Level of Position First Job Current or Present Job
Frequency Percentage Frequency Percentage
Rank or Clerical 82 45.81% 71 39.66%
Professional, Technical
or supervisory
91 50.84% 95 53.07
Managerial or
Executive
1 0.55% 3 1.68%
Self-employed 5 2.79% 10 5.59%

Ruel S. Salvador, Ferdinand M. Oraiz, Maricel C. Mandawe - MUST Jasaan Campus
Graduates Tracer Study Academic Year 2000-2001 to Academic Year 2009-2010
EUROPEAN ACADEMIC RESEARCH - Vol. III, Issue 2 / May 2015
2214
While only 2.79% were self-employed after college graduation,
some 5.59% are self-employed in their current or presented job
level position. This means that some respondents who were
employed as rank or clerical employees after college graduation
have decided to be self-employed. This movement or change in
job level position is evident in the increase in number of
respondents who indicated “self-employed in their current or
presented job level position. Also noticeable is the increase in
number of respondents who indicated professional, technical or
supervisory positions in their current or present job. This
means that some respondents who were employed as rank or
clerical after graduation have been promoted to professional,
technical or supervisory positions in their current or present job
level position.
Table 21 below focuses on the initial gross monthly
earning in the first job after college. Data reveal that the figure
frequently cited by respondents with regard to their initial
gross monthly earning in the first job after college is P5, 000.00
to less than P10, 000.00.
Table 21: Initial Gross Monthly Earning in the First Job
Initial Gross Monthly Earning Frequency Percentage
P5,000 to less P10,000 104 58.10%
P10,000 to less than P15,000 43 24.02%
Below P5,000 2 1.11%
P15,000 to less than P20,000 7 3.91%
P20,000 to less than P25,000 3 1.68%
P25,000 above 20 11.17%
This was cited by a majority or 58.10%. Some 24.02% cited P10,
000.00 to P15, 000.00 while some 11.17% of the respondents
who are currently working abroad cited above P25,000 as their
initial gross monthly income. The others cited as follows:
P15,000 to less than P20,000 (3.91%); P20,000 to less than
P25,000 (1.68%); and below P5,000 (1.11%). Therefore it can be
deduced from these data that the average initial gross monthly
earning of respondents in their first job after college is P5,

Ruel S. Salvador, Ferdinand M. Oraiz, Maricel C. Mandawe - MUST Jasaan Campus
Graduates Tracer Study Academic Year 2000-2001 to Academic Year 2009-2010
EUROPEAN ACADEMIC RESEARCH - Vol. III, Issue 2 / May 2015
2215
000.00 to less than P10, 000.00 which is in accordance with the
regional minimum wage. The last item in this part of the study
has to do with relevance of the job to the course. Table 22
presents data relative to this.
Table 22: Relevance of the Job to the Course Completed
Relevance of the Job to course Frequency Percentage
YES 153 85.47%
NO 26 14.53%
Data presented in the Table 22 indicate that 85.47% of the
respondents believe that the course they took in college has
some bearing to their current job. Respondents find the course
they finish in college to be relevant to the job that they have at
present.
V. Situational Factors That Influenced the
Employment Situation of the Respondents
Table 23 indicates that salaries and benefits have been the top
reasons for the respondents to stay on the job they have at
present. This was indicated by 52.51%. Another reason which
cited by 36.31% was the job related to special skills. The third
reason, cited by 29.05%, is related to course or program of
study.
Table 23: Reasons for Staying on the Job
Reasons Frequency Percentage
Salaries & Benefits 94 52.51%
Career and Challenge 30 16.76%
Related to Special Skills 65 36,31%
Related to Course or program of Study 52 29.05%
Proximity to Residence 20 11.17%
Peer Influence 15 8.48%
Family Influence 8 4.47%
Other Reasons 2 1.11%
As pointed out earlier, there were some 29 respondents or
16.20% who indicated that their first job after college is not
related to the course they finished. With regards to reasons for

Ruel S. Salvador, Ferdinand M. Oraiz, Maricel C. Mandawe - MUST Jasaan Campus
Graduates Tracer Study Academic Year 2000-2001 to Academic Year 2009-2010
EUROPEAN ACADEMIC RESEARCH - Vol. III, Issue 2 / May 2015
2216
accepting the job even if it is not related to the course
completed in college, ‘salaries and benefits’ top the list, as
indicated by 15.08%. This is followed by ‘career and challenge
(10.06%) and related to special skills which was cited by 8.38%’
comes third. All these data are presented in Table 24.
Table 24: Reasons for Accepting the Job even if not related to Course
completed in College
Reasons Frequency Percentage
Salaries & Benefits 27 15.08%
Career and Challenge 18 10.06%
Related to Special Skills 15 8.38%
Proximity to Residence 11 6.14%
Other Reasons - -
Table 25 on the next page presents data that have to do with
reasons for changing job. Data reveal that, as in the reasons for
staying on the job and for accepting the jobs, ‘salaries and
benefits’ remain as the top reason indicated by 35.75% while
‘career and challenge’ comes second as indicated by 17.32%. The
third reason cited by 10.06% is that the job that the
respondents have changed into ‘related to special skills’ while
‘proximity to residence’ with 9.50 seems to be the least reason
for changing job.
Table 25: Reasons for Changing Job
Reasons Frequency Percentage
Salaries & Benefits 64 35.75%
Career and Challenge 31 17.32%
Related to Special Skills 18 10.06%
Proximity to Residence 17 9.50%
Other Reasons - -
It is now safe to say that ‘salaries and benefits’ remains to be
the top reason considered by respondents in staying on the job,
for accepting the job even if it is not related to the course
completed in college; and in changing job. This is to be expected
since salaries and benefits among other factors are oftentimes
Ruel S. Salvador, Ferdinand M. Oraiz, Maricel C. Mandawe - MUST Jasaan Campus
Graduates Tracer Study Academic Year 2000-2001 to Academic Year 2009-2010
EUROPEAN ACADEMIC RESEARCH - Vol. III, Issue 2 / May 2015
2217
considered significant in deciding whether to accept the job or
not.
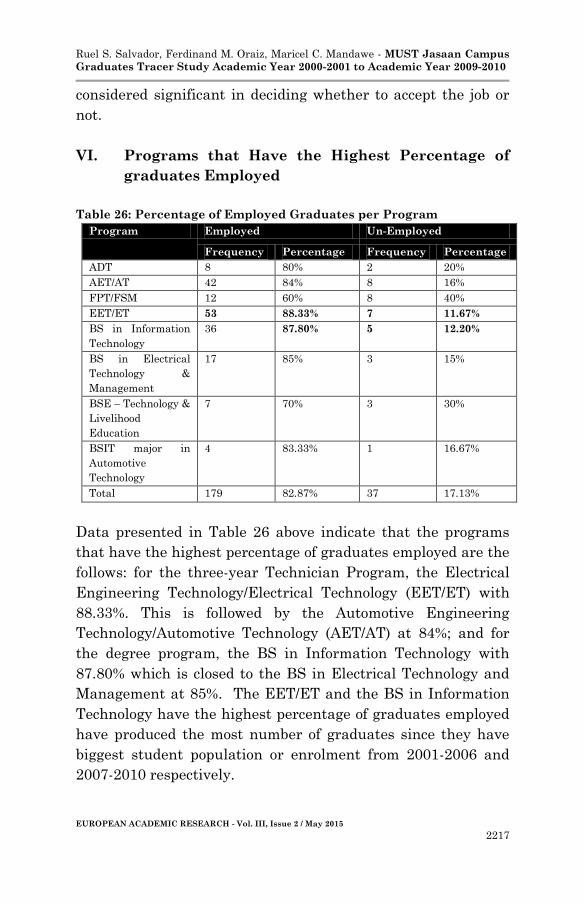
VI. Programs that Have the Highest Percentage of
graduates Employed
Table 26: Percentage of Employed Graduates per Program
Program Employed Un-Employed
Frequency Percentage Frequency Percentage
ADT 8 80% 2 20%
AET/AT 42 84% 8 16%
FPT/FSM 12 60% 8 40%
EET/ET 53 88.33% 7 11.67%
BS in Information
Technology
36 87.80% 5 12.20%
BS in Electrical
Technology &
Management
17 85% 3 15%
BSE – Technology &
Livelihood
Education
7 70% 3 30%
BSIT major in
Automotive
Technology
4 83.33% 1 16.67%
Total 179 82.87% 37 17.13%
Data presented in Table 26 above indicate that the programs
that have the highest percentage of graduates employed are the
follows: for the three-year Technician Program, the Electrical
Engineering Technology/Electrical Technology (EET/ET) with
88.33%. This is followed by the Automotive Engineering
Technology/Automotive Technology (AET/AT) at 84%; and for
the degree program, the BS in Information Technology with
87.80% which is closed to the BS in Electrical Technology and
Management at 85%. The EET/ET and the BS in Information
Technology have the highest percentage of graduates employed
have produced the most number of graduates since they have
biggest student population or enrolment from 2001-2006 and
2007-2010 respectively.

Ruel S. Salvador, Ferdinand M. Oraiz, Maricel C. Mandawe - MUST Jasaan Campus
Graduates Tracer Study Academic Year 2000-2001 to Academic Year 2009-2010
EUROPEAN ACADEMIC RESEARCH - Vol. III, Issue 2 / May 2015
2218
VII. Programs that Have the Highest Potentials for
Highest Initial Earning
Data presented in Table 27 on the next page indicate the
highest initial earning of respondents per program. The highest
potential earning of a majority of respondents are as follos:
P5,000.00 to less than P10,000.00 for ADT graduates (62.50%);
for BSIT graduates (66.67); for EET/ET graduates (67.92%);
and for FPT/FSM graduates (83.33%). This is expected since
the minimum wage is above P5,000.00. P10,000 to less than
P15,000.00 for BSE-TLE graduates; for AET/AT graduates
(33.33%); for BS ETM graduates (58.82%); for BSIT-AT
graduates (75.00%); and. P15,000.00 to less than P20,000.00 for
BSE-TLE graduates (42.86%).
Table 27: Highest Initial Earning per Program
Program Employed
Graduates
Below
P5,000
P5,000
to less
than
10,000
P10,000
to less
than
P15,000
P15,000
to less
than
P20,000
P20,000
to less
than
P25,000
P25,000
above
ADT 8 5
(62.50)
2
(25.00)
1
(12.50)
AET/AT 42 20
(47.62)
14
(33.33)
8
(19.05)
FPT/FSM 12 10
(83.33)
2
(16.67)
EET/ET 53 36
(67.92)
4
(7.55)
4
(7.55)
1
(1.89)
8
(15.09)
BSIT 36 2
(5.56)
24
(66.67)
6
(16.67)
2
(5.56)
2
(5.56)
BS ETM 17 6
(35.29)
10
(58.82)
1
(5.88)
BSE-TLE 7 2
(28.57)
2
(28.57)
3
(42.86)
BSIT-AT 4 1
(25.00)
3
(75.00)
Likewise, it also provides an idea as to which programs have
the highest potential initial earning. The respondents who are
currently working abroad indicated the highest initial earning,
that is above P25,000.00. The others are as follows: for AET/AT

Ruel S. Salvador, Ferdinand M. Oraiz, Maricel C. Mandawe - MUST Jasaan Campus
Graduates Tracer Study Academic Year 2000-2001 to Academic Year 2009-2010
EUROPEAN ACADEMIC RESEARCH - Vol. III, Issue 2 / May 2015
2219
graduates (19.05%); for EET/ET graduates (15.09); for ADT
graduates (12.50%); and BS ETM graduates (5.88%). The
second indicated highest initial earning is P20,000.00 to less
than P 25,000.00 by 5.56% of BSIT graduates and EET/ET
graduate at 1.89%.
Finally, data in Table 27 also provide an idea as to
which programs have the highest potentials for highest initial
earning. The indicated highest earning for the three-year
technician program is above P25,000.00 by 19.05% of the
AET/AT and 15.09% of the EET/ET graduates respectively.
While for the degree programs, the highest initial earning is
above P25,000.00 by 5.88% of the BS ETM and 5.58% of the
BSIT graduates respectively. Judging from these results,
therefore, the programs that have the highest potential initial
earning are as follows: for the three-year technician program,
the EET/ET which ranks first; AET/AT ranks second; ADT
ranks third; and FPT/FSM ranks fourth. While in the degree
programs, the BSETM ranks first; BSIT ranks second; BSE-
TLE ranks third; and BSIT-AT which rank fourth.
VIII. About MPSC/MUST Jasaan Campus
The Table 28 on the next page shows the summary of the
respondent perception of the question, ‘do you think that the
education you get from MPSC/MUST Jasaan Campus
contribute to your success?’. The data reveal that majority of
the respondents answer for ‘strongly agree’ (53.70%); for ‘agree’
(31.13%); for undecided (5.66%); and for no comment (9.56%).
No among the respondents answer ‘disagree and strongly
disagree’ (0%). The grand of 4.10 indicate that majority of the
respondents agree, that the education they get from
MPSC/MUST contributed to their success in life.

Ruel S. Salvador, Ferdinand M. Oraiz, Maricel C. Mandawe - MUST Jasaan Campus
Graduates Tracer Study Academic Year 2000-2001 to Academic Year 2009-2010
EUROPEAN ACADEMIC RESEARCH - Vol. III, Issue 2 / May 2015
2220
Table 28: Do you think that the Education you get from MPSC/MUST
Jasaan campus contributed to your Success?
item Rating Frequency Percentage
Strongly Agree 5 116 53.70%
Agree 4 67 31.02%
Undecided 3 13 6.02%
Disagree 2 - -
Strongly Disagree 1 - -
No Comment 0 20 9.56%
Mean 4.10
Table 29: Do you think that the Existence MPSC/MUST Jasaan
Campus give an opportunity to the students seeking Higher
Education?
Item Rating Frequency Percentage
Strongly Agree 5 124 57.41%
Agree 4 61 28.24%
Undecided 3 3 1.39%
Disagree 2 0 0%
Strongly Disagree 1 0 0%
No Answer 0 28 12.96%
Mean 4.04
Likewise, data in Table 29 above provide the information to
answer the question ‘Do you think that the existence of
MPSC/MUST Jasaan Campus give an opportunity to the
student seeking higher education?’. It shows that 57.41% of the
respondents answer for ‘strongly agree’; for agree (28.24%); for
undecided (1.39%); and for no comment (12.96%). The overall
mean is 4.04, which implies that majority of the respondents
agree that existence of MPSC/MUST Jasaan Campus gives
opportunity the students seeking higher education.
Table 30: Suggestion to Improve the Academic Program of
MPSC/MUST
Suggestions Frequency Percentage
Improved/Provide Additional Equipment &
Facilities
195 90.28%
Provide More Actual Training and
Workshop
178 82.41%
Hiring of Competent/specialized Faculty 87 40.28%

Ruel S. Salvador, Ferdinand M. Oraiz, Maricel C. Mandawe - MUST Jasaan Campus
Graduates Tracer Study Academic Year 2000-2001 to Academic Year 2009-2010
EUROPEAN ACADEMIC RESEARCH - Vol. III, Issue 2 / May 2015
2221
Accreditation 40 18.52%
Offer additional subjects like business,
accounting, advanced technical subjects
34 15.74%
Offering BS Program 24 11.11%
Offer Additional Courses 18 8.33%
Discipline the Students 12 5.56%
Student speak English During Classes 12 5.56%
No Comment 7 3.24%
Table 30 above provides the suggestion of the respondents on
how to improve the academic programs of MPSC/MUST Jasaan
Campus. The data reveal that improved/provide additional
equipment and facilities top among the ten suggested areas of
improvement at 90.28%.
This is followed by provide more actual training and
workshop (82.41%) of which can be achieved if additional
equipment and facilities will be provided to the University
Campus. Hiring of competent/specialized faculty and Offering
BS program (40.28%) comes third. This is expected because
some of our graduates in the three-year Technician Program
continued to the main campus for additional year in order to
graduate a Bachelor’s degree. This was already addressed
starting 2006 when first batch of Bachelor’s degree program
graduated.
Another interesting result shows that the respondents
see the importance of having quality education through the
accreditation (18.52%). At present, two of the existing
programs of MUST Jasaan Campus namely: the BS
Information Technology and the BS Electrical Technology and
Management passed the preliminary survey conducted by the
Accrediting Agency for Chartered Colleges and Universities of
the Philippines (AACCUP). By third quarter of 2015, the
University campus is schedule for Level I for the BS
Information Technology and BS Electrical Technology and
Management while the BS Auto-Mechanical Technology will
undergo the preliminary survey. Other suggestions were as
follows: offer subject like business accounting and advanced

Ruel S. Salvador, Ferdinand M. Oraiz, Maricel C. Mandawe - MUST Jasaan Campus
Graduates Tracer Study Academic Year 2000-2001 to Academic Year 2009-2010
EUROPEAN ACADEMIC RESEARCH - Vol. III, Issue 2 / May 2015
2222
technical subject (15.74%); offer additional courses (8.33%);
discipline the students and speak English during classes
(5.56%); and no comment (3.24%).
Table 31: Reason Why Studied at MPSC/MUST Jasaan Campus
Reasons Frequency Percentage
A State College/University 120 55.55%
Proximity to Residence 156 72.22%
Affordable/Low Tuition Fees 116 53.70%
Has Competent/Good Faculty 89 41.20%
My Choice of Course is Offered 95 43.98%
Accept Scholarship Grants 105 48.61%
Program is comparable to Main Campus 65 30.09%
Assured Employment 143 66.20%
No Comment 12 5.56%
Others (I Love it, I trust It and
recommended by Parents & Friends
25 11.57%
Finally, Table 31 above provides the information pertains the
reasons why studied at MPSC/MUST Jasaan Campus. The data
show the proximity to residence (72.22%) top among reasons
give by the respondents. This is expected since most of our
students are coming from the nearby municipality of Jasaan.
This is followed by assured employment (66.20%). This implies
that the respondent really confident that they can find job after
finishing a degree program at MPSC/MUST Jasaan Campus. A
state college/university (55.55%) comes third. Remember that
MPSC/MUST Jasaan Campus is the only state
college/university located in the eastern part of Misamis
Oriental offering science and technology programs. The fourth
reason is affordable/low tuition fees (53.70%).
This is also expected since MPSC/MUST is a public
institution where in as provided by law, the university should
not charge more than the tuition fees of private institution
offering the same program. Other reasons were as follows:
accept scholarship grants (48.62%); my choice of score is offered
(43.98%); has competent/good faculty (41.20%); others (11.57%);
and no comments (5.56%).
Ruel S. Salvador, Ferdinand M. Oraiz, Maricel C. Mandawe - MUST Jasaan Campus
Graduates Tracer Study Academic Year 2000-2001 to Academic Year 2009-2010
EUROPEAN ACADEMIC RESEARCH - Vol. III, Issue 2 / May 2015
2223
Conclusion
Based on findings of the study, the following conclusions were
derived:
1. A majority of MPSC/MUST Jasaan Campus who
participated as respondents in this study were married,
male, above 30 years old, residing in Region 10, specifically
from the province of Misamis Oriental.
2. A majority of the respondents came from the field of
Electrical Engineering Technology/Electrical Technology. A
small percentage of the respondents about 1.89% received
scholastic honors during their college graduation and a
quite number have passed the licensure examination given
by the Professional Regulations Commission. They Attended
trainings such as short term professional related training
after graduation from college, not so much for promotion but
for professional development. They find communication
skills, critical thinking skills and problem solving very
useful in their first job.
3. The MPSC/MUST graduates of SY 2000-2001 to SY 2009-
2010 took the course they finished because they believe
that the availability of course offering of the school; for
prospect for immediate employment; and for affordability of
the family to support their college education. They also
considered the influence of parents and relative and
opportunity for employment abroad.
4. With regards to employment situation of the respondents, a
majority of them are employed although a number are not
employed due to family concerns and that they decided not
to find a job after graduation. Some are not currently
employed since their contact ends and they are on the
process of renewal or searching another job. The other
reason are employed for advance study and got married
after graduation. Those who are employed are mostly
regular or permanent in their present or current job either

Ruel S. Salvador, Ferdinand M. Oraiz, Maricel C. Mandawe - MUST Jasaan Campus
Graduates Tracer Study Academic Year 2000-2001 to Academic Year 2009-2010
EUROPEAN ACADEMIC RESEARCH - Vol. III, Issue 2 / May 2015
2224
in technician and associate professional or as clerk. Most of
the respondents work in companies or organizations that
have to do with manufacturing, construction, electricity, gas
and water supply and wholesale and retail trade; repair of
motor vehicle, motorcycles and personal and household
goods. A quite number of respondents work abroad.
For many of them, their current or present job is their
present job which is related to the course they took in
college. Most of them have been staying in their job for one
year to less than two years now. Most of them got their job
through walk-in application making them wait for one to six
month in their job search. With initial gross monthly
earning of P5,000.00 to less than P10,000.00, most of the
employed graduates’ job entry is the professional, technical
or supervisory position and rank and clerical positions. The
graduates believe that the course they completed in college
is relevant on their current or present job.
5. The top reasons for the respondents to stay in the job, to
accept the job even if they feel that the job is not related to
the course completed in college, and to change job is salaries
and benefits. They also mentioned career challenge and
related to special skills.
6. With regards to programs that have the highest percentage
of graduates employed, the programs are as follow: for the
three-year technician program, the Electrical Engineering
Technology/Electrical technology and Automotive
Engineering Technology/Automotive Technology the first
and the second rank respectively while for the degree
programs, the BS Electrical Management and Technology
and the BS Information Technology got the first and the
second rank respectively.
7. The following programs have the highest potentials for
highest initial earning: Engineering Technology/Electrical
Technology and Automotive Engineering
Technology/Automotive Technology the first and the second

Ruel S. Salvador, Ferdinand M. Oraiz, Maricel C. Mandawe - MUST Jasaan Campus
Graduates Tracer Study Academic Year 2000-2001 to Academic Year 2009-2010
EUROPEAN ACADEMIC RESEARCH - Vol. III, Issue 2 / May 2015
2225
rank respectively while for the degree programs, the BS
Electrical Management and Technology and the BS
Information Technology got the first and the second rank
respectively.
8. With regards to question ‘Do you think that the education
you get from MPSC/MUST Jasaan Campus contribute to
your success?’ and ‘Do you think that the existence of
MPSC/MUST Jasaan Campus gives an opportunity to the
students seeking higher education?’, majority of the
respondents answers strong agree. Although quite a
number answers undecided and no comments. The top
suggestion for the respondents on how to improve the
academic program of MPSC/MUST Jasaan Campus is
improved/provide additional equipment and facilities. This
is followed by provide more actual training and workshop.
They also mentioned hiring of competent/specialized faculty
and accreditation. Finally, the top reason of the respondents
on the question ‘why you study at MPSC/MUST Jasaan
Campus?’ majority answers proximity to residence. This is
followed by assured employment. Others are as follows: a
state college/university, affordable/low tuition fee and
accept scholarship grant.
9. MPSC/MUST graduates are employable. Likewise, it also
justifies the contribution and existence of MPSC/MUST
Jasaan Campus as a higher learning institution in the
eastern part of Misamis Oriental
5.1 Recommendation
The following recommendations are made based on the
importance of the data obtained from a study such as this:
1. That this Graduate Tracer Study be a regular activity of the
MUST Jasaan Campus and a GTS be conducted when the
time MUST produces its first graduates for the degree
program in 2007 until 2014. This can be done by program in

Ruel S. Salvador, Ferdinand M. Oraiz, Maricel C. Mandawe - MUST Jasaan Campus
Graduates Tracer Study Academic Year 2000-2001 to Academic Year 2009-2010
EUROPEAN ACADEMIC RESEARCH - Vol. III, Issue 2 / May 2015
2226
order determine the viability of the its program in terms of
employability;
2. That the GTS includes the respondents in the industry
sector and employers to determine the extent of perceived
mismatch of academic and technical preparation provided
by educational institutions to student-clienteles and skills
needed in the industry in order to come up with an industry
based curriculum; and
3. The MUST administration should invest to the satellite
campuses in terms of providing them with a state-of-the-art
facilities and equipment, infrastructure and hiring of
competent faculty to assure that the graduates from the
satellite campuses can compete with other graduates from
other HEI’s and also in preparation of the ASEAN
INTEGRATION 2015.
BIBLIOGRAPHY
Commission on Higher Education. (2006). Graduate Tracer
Study Manual and Lectures. Manila
Rodriguez, S. (2006), University of the East Graduate Tracer
Study (School Year 2000-2001 to School Year 2003-
2004). Manila: University of the East
Mercado, F. (2010), A Tracer Study of MSEUF Graduates
Institute of Graduate Studies and Research, Enverga
University
ACKNOWLEDGEMENT
The researchers would like to thank the MUST Administration
particularly the Research Division for the opportunity to conduct this
graduate tracer study. To all the graduates who in one way or another
responded and submitted themselves as respondents. To our Almighty
God who is the dispenser of all for the courage and strength in order
accomplish this study. And to all, thank you.