Muslims have a much higher presence in the towns of Uttar ... 25 UP-Urban.pdf · Centre for Policy...
9
Centre for Policy Studies www.cpsindia.org 1 Muslims have a much higher presence in the towns of Uttar Pradesh In our earlier note on Uttar Pradesh, we noticed that the overall share of Muslims and growth in their share is not very high outside a pocket of eight districts in the western UP. In that note, we also indicated that the share and growth of urban Muslims in this pocket is considerably higher than in the total population. The issue of the exodus of Hindus from some of the towns of this pocket, especially towns like Kairana and Kandhla, has suddenly acquired salience. In view of this, we present further details of the religious demography of urban Uttar Pradesh. Share of Muslims in the urban population of the State is much higher than their average share in the total population. They form 32.2 percent of the urban population, while they form less than 20 percent of the total and only 15.6 percent of the rural population. What is even more important is that they have an overwhelming presence in several towns. Muslims are in a majority in 231 of the total 915 towns counted in the State in 2011. Among these 231 towns, there are 15 where the share of Muslims is above 90 percent, 37 where their share is between 80 and 90 percent and another 47 where they form 70 to 80 percent of the population. Of the 231 Muslim-majority towns in the State, 103 are in the 8 districts of West UP where the Muslim presence is otherwise high. But the remaining 128 are spread over the whole State, and there are Muslims-majority towns in even those districts where their overall presence is very low. There are urban pockets of very high Muslim presence in almost every part of the State. Therefore, their influence in the State is much deeper and more widespread than what is indicated by their share in the total population of the State. The share of Muslims in the towns of Uttar Pradesh has been growing quite rapidly. In 1981, when there were a total of 607 towns in the State, the number of Muslim-majority towns was 101; that number has now expanded to 231. In many towns, the increase in the share of Muslims during the last three or four decades has been very sharp; in several instances, this has implied a decline in the absolute number, and not merely the share, of the Indian Religionists. Such decline usually implies large-scale out-migration of the latter from those towns. In the following we describe different dimensions of this high and growing Muslim influence in the urban areas of Uttar Pradesh.
Transcript of Muslims have a much higher presence in the towns of Uttar ... 25 UP-Urban.pdf · Centre for Policy...
Centre for Policy Studies www.cpsindia.org 1
Muslims have a much higher presence in the towns of Uttar Pradesh
In our earlier note on Uttar Pradesh, we noticed that the overall share of Muslims and
growth in their share is not very high outside a pocket of eight districts in the western
UP. In that note, we also indicated that the share and growth of urban Muslims in this
pocket is considerably higher than in the total population. The issue of the exodus of
Hindus from some of the towns of this pocket, especially towns like Kairana and
Kandhla, has suddenly acquired salience. In view of this, we present further details of the
religious demography of urban Uttar Pradesh.
Share of Muslims in the urban population of the State is much higher than their average
share in the total population. They form 32.2 percent of the urban population, while they
form less than 20 percent of the total and only 15.6 percent of the rural population. What
is even more important is that they have an overwhelming presence in several towns.
Muslims are in a majority in 231 of the total 915 towns counted in the State in 2011.
Among these 231 towns, there are 15 where the share of Muslims is above 90 percent, 37
where their share is between 80 and 90 percent and another 47 where they form 70 to 80
percent of the population.
Of the 231 Muslim-majority towns in the State, 103 are in the 8 districts of West UP
where the Muslim presence is otherwise high. But the remaining 128 are spread over the
whole State, and there are Muslims-majority towns in even those districts where their
overall presence is very low. There are urban pockets of very high Muslim presence in
almost every part of the State. Therefore, their influence in the State is much deeper and
more widespread than what is indicated by their share in the total population of the State.
The share of Muslims in the towns of Uttar Pradesh has been growing quite rapidly. In
1981, when there were a total of 607 towns in the State, the number of Muslim-majority
towns was 101; that number has now expanded to 231.
In many towns, the increase in the share of Muslims during the last three or four decades
has been very sharp; in several instances, this has implied a decline in the absolute
number, and not merely the share, of the Indian Religionists. Such decline usually implies
large-scale out-migration of the latter from those towns.
In the following we describe different dimensions of this high and growing Muslim
influence in the urban areas of Uttar Pradesh.
Centre for Policy Studies www.cpsindia.org 2
Total and Urban Muslims in Uttar Pradesh
Total and Urban Muslims in UP, 1971-2011
Total Pop Urban Pop Total M Urban M
1971 8,38,78,581 1,16,53,740 1,33,28,316 35,53,060
1981 10,51,74,283 1,87,49,979 1,71,83,263 55,06,875
1991 13,20,61,653 2,59,71,831 2,34,04,386 83,23,864
2001 16,61,97,921 3,45,39,582 3,07,40,158 1,10,73,861
2011 19,98,12,341 4,44,95,063 3,84,83,967 1,43,27,910
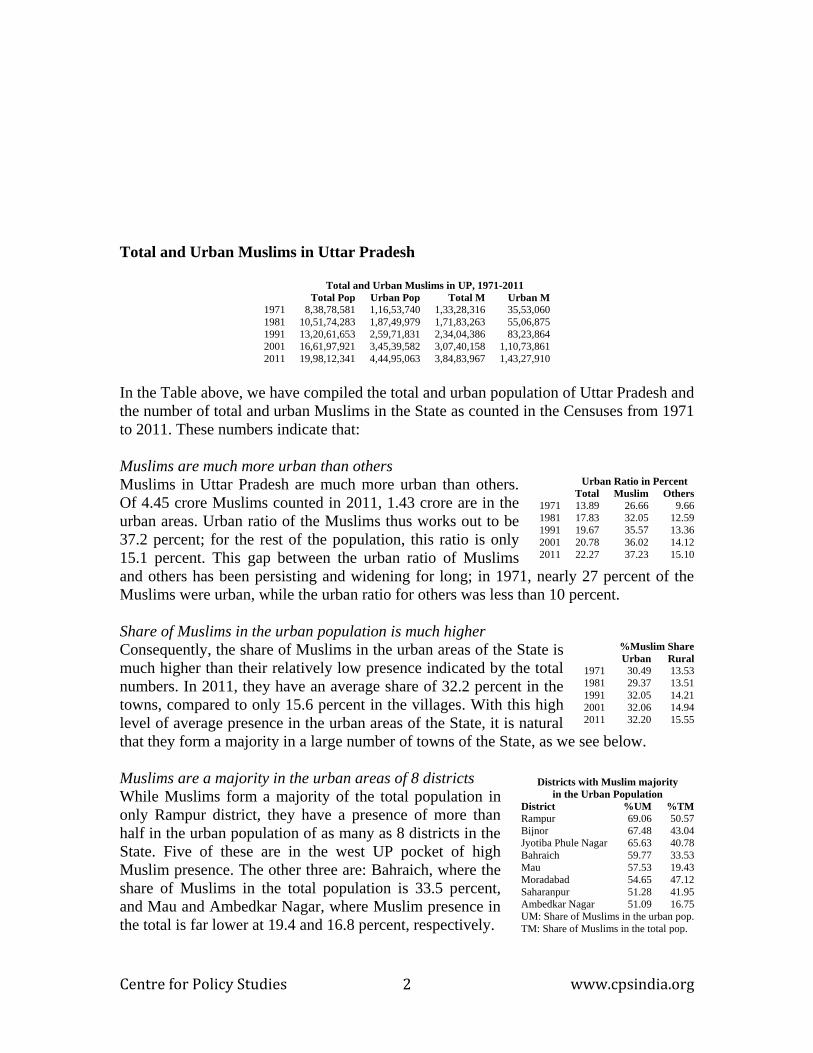
In the Table above, we have compiled the total and urban population of Uttar Pradesh and
the number of total and urban Muslims in the State as counted in the Censuses from 1971
to 2011. These numbers indicate that:
Muslims are much more urban than others
Muslims in Uttar Pradesh are much more urban than others.
Of 4.45 crore Muslims counted in 2011, 1.43 crore are in the
urban areas. Urban ratio of the Muslims thus works out to be
37.2 percent; for the rest of the population, this ratio is only
15.1 percent. This gap between the urban ratio of Muslims
and others has been persisting and widening for long; in 1971, nearly 27 percent of the
Muslims were urban, while the urban ratio for others was less than 10 percent.
Share of Muslims in the urban population is much higher
Consequently, the share of Muslims in the urban areas of the State is
much higher than their relatively low presence indicated by the total
numbers. In 2011, they have an average share of 32.2 percent in the
towns, compared to only 15.6 percent in the villages. With this high
level of average presence in the urban areas of the State, it is natural
that they form a majority in a large number of towns of the State, as we see below.
Muslims are a majority in the urban areas of 8 districts
While Muslims form a majority of the total population in
only Rampur district, they have a presence of more than
half in the urban population of as many as 8 districts in the
State. Five of these are in the west UP pocket of high
Muslim presence. The other three are: Bahraich, where the
share of Muslims in the total population is 33.5 percent,
and Mau and Ambedkar Nagar, where Muslim presence in
the total is far lower at 19.4 and 16.8 percent, respectively.
Urban Ratio in Percent
Total Muslim Others
1971 13.89 26.66 9.66
1981 17.83 32.05 12.59
1991 19.67 35.57 13.36
2001 20.78 36.02 14.12
2011 22.27 37.23 15.10
%Muslim Share
Urban Rural
1971 30.49 13.53
1981 29.37 13.51
1991 32.05 14.21
2001 32.06 14.94
2011 32.20 15.55
Districts with Muslim majority
in the Urban Population District %UM %TM
Rampur 69.06 50.57
Bijnor 67.48 43.04
Jyotiba Phule Nagar 65.63 40.78
Bahraich 59.77 33.53
Mau 57.53 19.43
Moradabad 54.65 47.12
Saharanpur 51.28 41.95
Ambedkar Nagar 51.09 16.75
UM: Share of Muslims in the urban pop.
TM: Share of Muslims in the total pop.
Centre for Policy Studies www.cpsindia.org 3
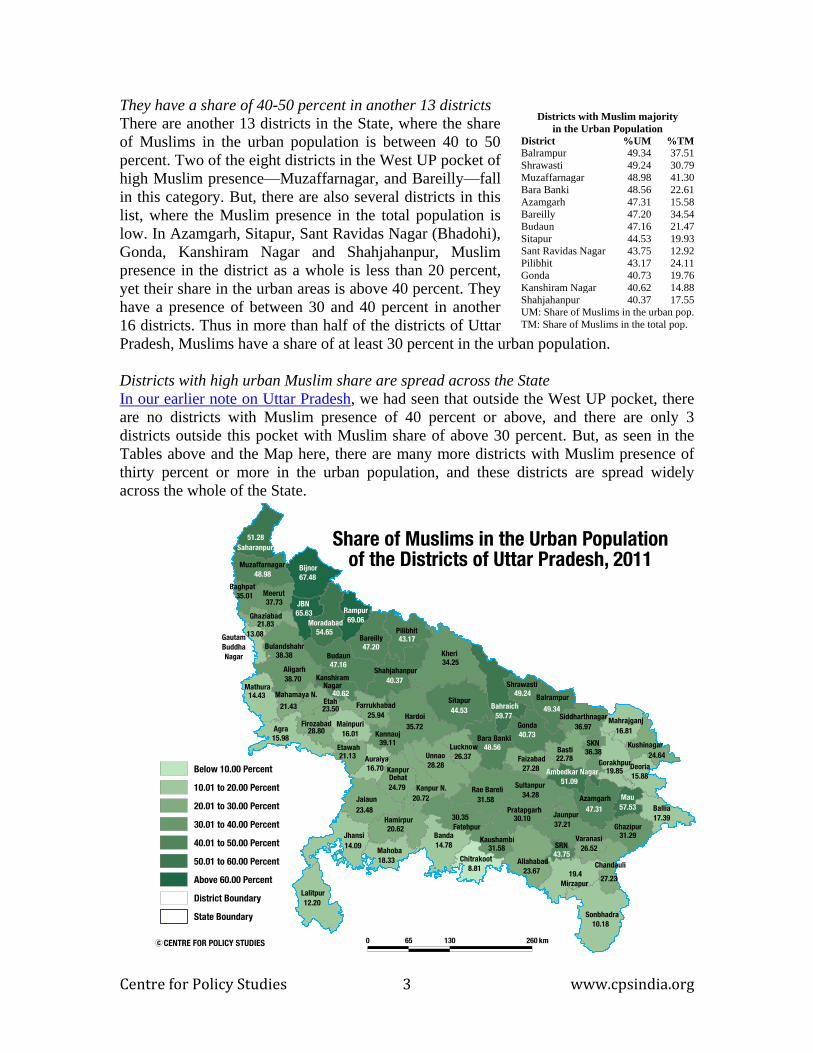
They have a share of 40-50 percent in another 13 districts
There are another 13 districts in the State, where the share
of Muslims in the urban population is between 40 to 50
percent. Two of the eight districts in the West UP pocket of
high Muslim presence—Muzaffarnagar, and Bareilly—fall
in this category. But, there are also several districts in this
list, where the Muslim presence in the total population is
low. In Azamgarh, Sitapur, Sant Ravidas Nagar (Bhadohi),
Gonda, Kanshiram Nagar and Shahjahanpur, Muslim
presence in the district as a whole is less than 20 percent,
yet their share in the urban areas is above 40 percent. They
have a presence of between 30 and 40 percent in another
16 districts. Thus in more than half of the districts of Uttar
Pradesh, Muslims have a share of at least 30 percent in the urban population.
Districts with high urban Muslim share are spread across the State
In our earlier note on Uttar Pradesh, we had seen that outside the West UP pocket, there
are no districts with Muslim presence of 40 percent or above, and there are only 3
districts outside this pocket with Muslim share of above 30 percent. But, as seen in the
Tables above and the Map here, there are many more districts with Muslim presence of
thirty percent or more in the urban population, and these districts are spread widely
across the whole of the State.
Districts with Muslim majority
in the Urban Population District %UM %TM
Balrampur 49.34 37.51
Shrawasti 49.24 30.79
Muzaffarnagar 48.98 41.30
Bara Banki 48.56 22.61
Azamgarh 47.31 15.58
Bareilly 47.20 34.54
Budaun 47.16 21.47
Sitapur 44.53 19.93
Sant Ravidas Nagar 43.75 12.92
Pilibhit 43.17 24.11
Gonda 40.73 19.76
Kanshiram Nagar 40.62 14.88
Shahjahanpur 40.37 17.55
UM: Share of Muslims in the urban pop.
TM: Share of Muslims in the total pop.
Centre for Policy Studies www.cpsindia.org 4
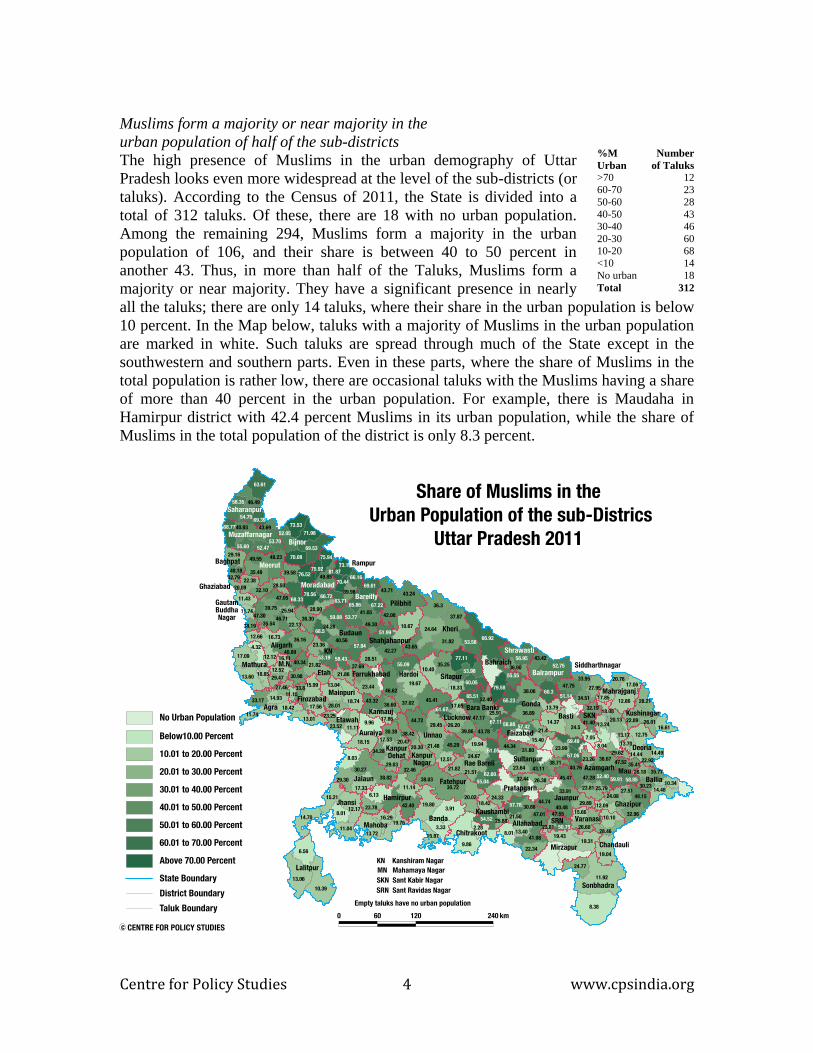
Muslims form a majority or near majority in the
urban population of half of the sub-districts
The high presence of Muslims in the urban demography of Uttar
Pradesh looks even more widespread at the level of the sub-districts (or
taluks). According to the Census of 2011, the State is divided into a
total of 312 taluks. Of these, there are 18 with no urban population.
Among the remaining 294, Muslims form a majority in the urban
population of 106, and their share is between 40 to 50 percent in
another 43. Thus, in more than half of the Taluks, Muslims form a
majority or near majority. They have a significant presence in nearly
all the taluks; there are only 14 taluks, where their share in the urban population is below
10 percent. In the Map below, taluks with a majority of Muslims in the urban population
are marked in white. Such taluks are spread through much of the State except in the
southwestern and southern parts. Even in these parts, where the share of Muslims in the
total population is rather low, there are occasional taluks with the Muslims having a share
of more than 40 percent in the urban population. For example, there is Maudaha in
Hamirpur district with 42.4 percent Muslims in its urban population, while the share of
Muslims in the total population of the district is only 8.3 percent.
%M
Urban
Number
of Taluks
>70 12
60-70 23
50-60 28
40-50 43
30-40 46
20-30 60
10-20 68
<10 14
No urban 18
Total 312
Centre for Policy Studies www.cpsindia.org 5
Muslims in the Towns of Uttar Pradesh
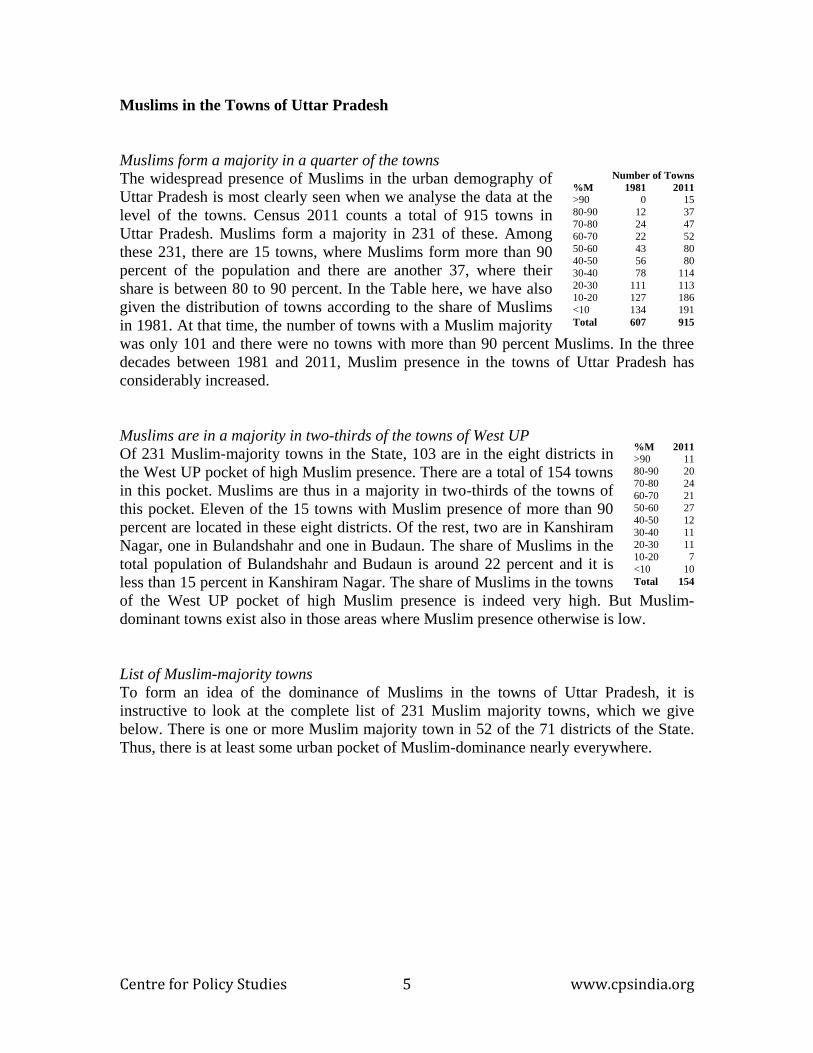
Muslims form a majority in a quarter of the towns
The widespread presence of Muslims in the urban demography of
Uttar Pradesh is most clearly seen when we analyse the data at the
level of the towns. Census 2011 counts a total of 915 towns in
Uttar Pradesh. Muslims form a majority in 231 of these. Among
these 231, there are 15 towns, where Muslims form more than 90
percent of the population and there are another 37, where their
share is between 80 to 90 percent. In the Table here, we have also
given the distribution of towns according to the share of Muslims
in 1981. At that time, the number of towns with a Muslim majority
was only 101 and there were no towns with more than 90 percent Muslims. In the three
decades between 1981 and 2011, Muslim presence in the towns of Uttar Pradesh has
considerably increased.
Muslims are in a majority in two-thirds of the towns of West UP
Of 231 Muslim-majority towns in the State, 103 are in the eight districts in
the West UP pocket of high Muslim presence. There are a total of 154 towns
in this pocket. Muslims are thus in a majority in two-thirds of the towns of
this pocket. Eleven of the 15 towns with Muslim presence of more than 90
percent are located in these eight districts. Of the rest, two are in Kanshiram
Nagar, one in Bulandshahr and one in Budaun. The share of Muslims in the
total population of Bulandshahr and Budaun is around 22 percent and it is
less than 15 percent in Kanshiram Nagar. The share of Muslims in the towns
of the West UP pocket of high Muslim presence is indeed very high. But Muslim-
dominant towns exist also in those areas where Muslim presence otherwise is low.
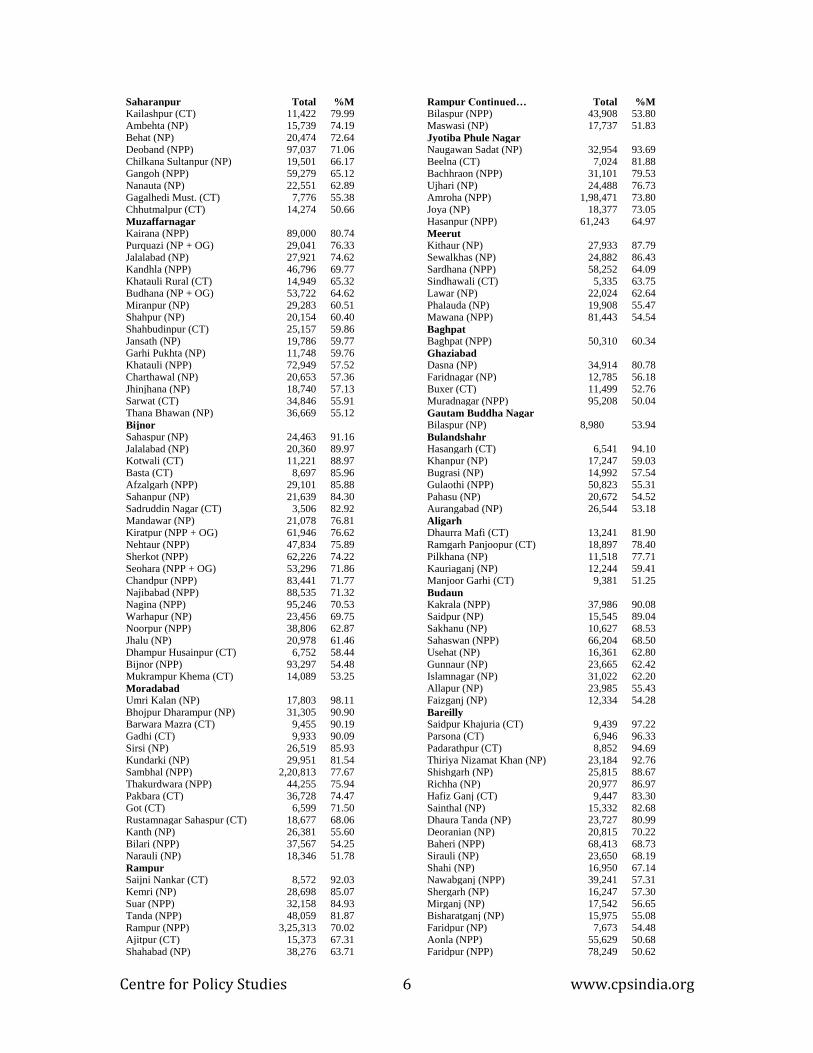
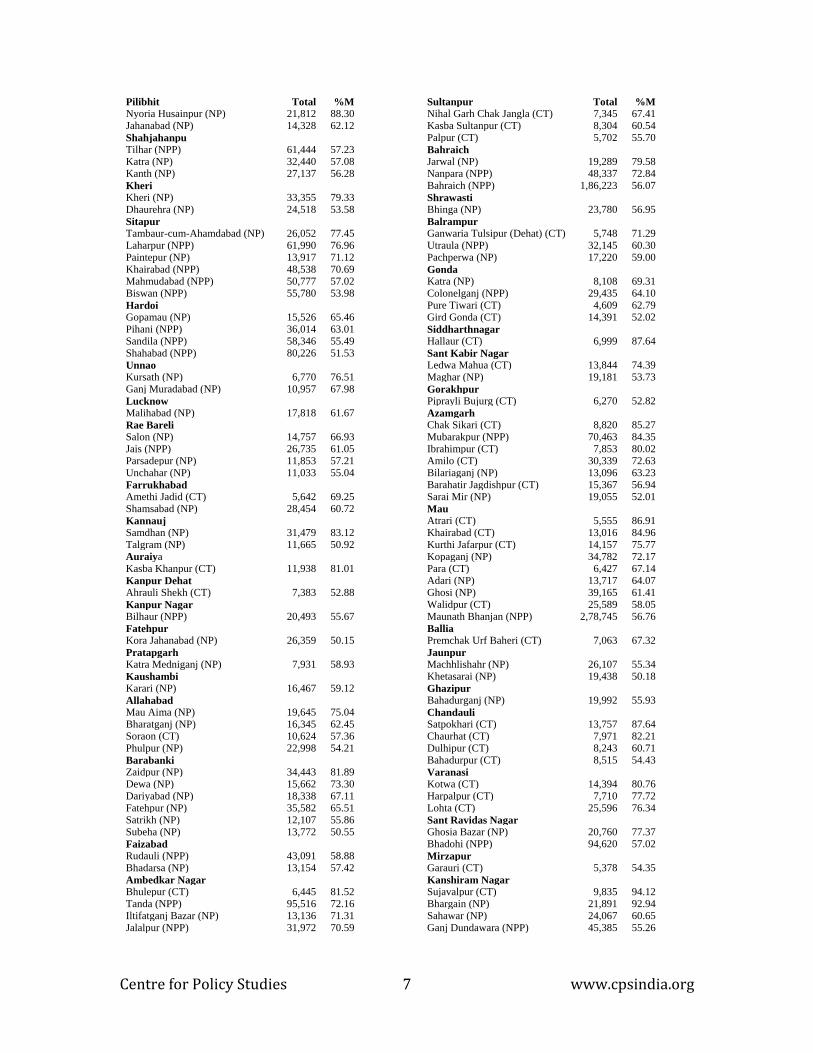
List of Muslim-majority towns
To form an idea of the dominance of Muslims in the towns of Uttar Pradesh, it is
instructive to look at the complete list of 231 Muslim majority towns, which we give
below. There is one or more Muslim majority town in 52 of the 71 districts of the State.
Thus, there is at least some urban pocket of Muslim-dominance nearly everywhere.
Number of Towns
%M 1981 2011
>90 0 15
80-90 12 37
70-80 24 47
60-70 22 52
50-60 43 80
40-50 56 80
30-40 78 114
20-30 111 113
10-20 127 186
<10 134 191
Total 607 915
%M 2011
>90 11
80-90 20
70-80 24
60-70 21
50-60 27
40-50 12
30-40 11
20-30 11
10-20 7
<10 10
Total 154
Centre for Policy Studies www.cpsindia.org 6
Saharanpur Total %M Rampur Continued… Total %M Kailashpur (CT) 11,422 79.99 Bilaspur (NPP) 43,908 53.80 Ambehta (NP) 15,739 74.19 Maswasi (NP) 17,737 51.83 Behat (NP) 20,474 72.64 Jyotiba Phule Nagar Deoband (NPP) 97,037 71.06 Naugawan Sadat (NP) 32,954 93.69 Chilkana Sultanpur (NP) 19,501 66.17 Beelna (CT) 7,024 81.88 Gangoh (NPP) 59,279 65.12 Bachhraon (NPP) 31,101 79.53 Nanauta (NP) 22,551 62.89 Ujhari (NP) 24,488 76.73 Gagalhedi Must. (CT) 7,776 55.38 Amroha (NPP) 1,98,471 73.80 Chhutmalpur (CT) 14,274 50.66 Joya (NP) 18,377 73.05
Muzaffarnagar
Hasanpur (NPP) 61,243 64.97 Kairana (NPP) 89,000 80.74 Meerut Purquazi (NP + OG) 29,041 76.33 Kithaur (NP) 27,933 87.79 Jalalabad (NP) 27,921 74.62 Sewalkhas (NP) 24,882 86.43 Kandhla (NPP) 46,796 69.77 Sardhana (NPP) 58,252 64.09 Khatauli Rural (CT) 14,949 65.32 Sindhawali (CT) 5,335 63.75 Budhana (NP + OG) 53,722 64.62 Lawar (NP) 22,024 62.64 Miranpur (NP) 29,283 60.51 Phalauda (NP) 19,908 55.47 Shahpur (NP) 20,154 60.40 Mawana (NPP) 81,443 54.54 Shahbudinpur (CT) 25,157 59.86 Baghpat Jansath (NP) 19,786 59.77 Baghpat (NPP) 50,310 60.34 Garhi Pukhta (NP) 11,748 59.76 Ghaziabad Khatauli (NPP) 72,949 57.52 Dasna (NP) 34,914 80.78 Charthawal (NP) 20,653 57.36 Faridnagar (NP) 12,785 56.18 Jhinjhana (NP) 18,740 57.13 Buxer (CT) 11,499 52.76 Sarwat (CT) 34,846 55.91 Muradnagar (NPP) 95,208 50.04 Thana Bhawan (NP) 36,669 55.12 Gautam Buddha Nagar
Bijnor
Bilaspur (NP) 8,980 53.94 Sahaspur (NP) 24,463 91.16 Bulandshahr Jalalabad (NP) 20,360 89.97 Hasangarh (CT) 6,541 94.10 Kotwali (CT) 11,221 88.97 Khanpur (NP) 17,247 59.03 Basta (CT) 8,697 85.96 Bugrasi (NP) 14,992 57.54 Afzalgarh (NPP) 29,101 85.88 Gulaothi (NPP) 50,823 55.31 Sahanpur (NP) 21,639 84.30 Pahasu (NP) 20,672 54.52 Sadruddin Nagar (CT) 3,506 82.92 Aurangabad (NP) 26,544 53.18 Mandawar (NP) 21,078 76.81 Aligarh Kiratpur (NPP + OG) 61,946 76.62 Dhaurra Mafi (CT) 13,241 81.90 Nehtaur (NPP) 47,834 75.89 Ramgarh Panjoopur (CT) 18,897 78.40 Sherkot (NPP) 62,226 74.22 Pilkhana (NP) 11,518 77.71 Seohara (NPP + OG) 53,296 71.86 Kauriaganj (NP) 12,244 59.41 Chandpur (NPP) 83,441 71.77 Manjoor Garhi (CT) 9,381 51.25 Najibabad (NPP) 88,535 71.32 Budaun Nagina (NPP) 95,246 70.53 Kakrala (NPP) 37,986 90.08 Warhapur (NP) 23,456 69.75 Saidpur (NP) 15,545 89.04 Noorpur (NPP) 38,806 62.87 Sakhanu (NP) 10,627 68.53 Jhalu (NP) 20,978 61.46 Sahaswan (NPP) 66,204 68.50 Dhampur Husainpur (CT) 6,752 58.44 Usehat (NP) 16,361 62.80 Bijnor (NPP) 93,297 54.48 Gunnaur (NP) 23,665 62.42 Mukrampur Khema (CT) 14,089 53.25 Islamnagar (NP) 31,022 62.20
Moradabad
Allapur (NP) 23,985 55.43 Umri Kalan (NP) 17,803 98.11 Faizganj (NP) 12,334 54.28 Bhojpur Dharampur (NP) 31,305 90.90 Bareilly Barwara Mazra (CT) 9,455 90.19 Saidpur Khajuria (CT) 9,439 97.22 Gadhi (CT) 9,933 90.09 Parsona (CT) 6,946 96.33 Sirsi (NP) 26,519 85.93 Padarathpur (CT) 8,852 94.69 Kundarki (NP) 29,951 81.54 Thiriya Nizamat Khan (NP) 23,184 92.76 Sambhal (NPP) 2,20,813 77.67 Shishgarh (NP) 25,815 88.67 Thakurdwara (NPP) 44,255 75.94 Richha (NP) 20,977 86.97 Pakbara (CT) 36,728 74.47 Hafiz Ganj (CT) 9,447 83.30 Got (CT) 6,599 71.50 Sainthal (NP) 15,332 82.68 Rustamnagar Sahaspur (CT) 18,677 68.06 Dhaura Tanda (NP) 23,727 80.99 Kanth (NP) 26,381 55.60 Deoranian (NP) 20,815 70.22 Bilari (NPP) 37,567 54.25 Baheri (NPP) 68,413 68.73 Narauli (NP) 18,346 51.78 Sirauli (NP) 23,650 68.19
Rampur
Shahi (NP) 16,950 67.14 Saijni Nankar (CT) 8,572 92.03 Nawabganj (NPP) 39,241 57.31 Kemri (NP) 28,698 85.07 Shergarh (NP) 16,247 57.30 Suar (NPP) 32,158 84.93 Mirganj (NP) 17,542 56.65
Tanda (NPP) 48,059 81.87 Bisharatganj (NP) 15,975 55.08 Rampur (NPP) 3,25,313 70.02 Faridpur (NP) 7,673 54.48 Ajitpur (CT) 15,373 67.31 Aonla (NPP) 55,629 50.68 Shahabad (NP) 38,276 63.71 Faridpur (NPP) 78,249 50.62
Centre for Policy Studies www.cpsindia.org 7
Pilibhit Total %M Sultanpur Total %M Nyoria Husainpur (NP) 21,812 88.30 Nihal Garh Chak Jangla (CT) 7,345 67.41 Jahanabad (NP) 14,328 62.12 Kasba Sultanpur (CT) 8,304 60.54
Shahjahanpu
Palpur (CT) 5,702 55.70 Tilhar (NPP) 61,444 57.23 Bahraich Katra (NP) 32,440 57.08 Jarwal (NP) 19,289 79.58 Kanth (NP) 27,137 56.28 Nanpara (NPP) 48,337 72.84
Kheri
Bahraich (NPP) 1,86,223 56.07 Kheri (NP) 33,355 79.33 Shrawasti Dhaurehra (NP) 24,518 53.58 Bhinga (NP) 23,780 56.95
Sitapur
Balrampur Tambaur-cum-Ahamdabad (NP) 26,052 77.45 Ganwaria Tulsipur (Dehat) (CT) 5,748 71.29 Laharpur (NPP) 61,990 76.96 Utraula (NPP) 32,145 60.30 Paintepur (NP) 13,917 71.12 Pachperwa (NP) 17,220 59.00 Khairabad (NPP) 48,538 70.69 Gonda Mahmudabad (NPP) 50,777 57.02 Katra (NP) 8,108 69.31 Biswan (NPP) 55,780 53.98 Colonelganj (NPP) 29,435 64.10
Hardoi
Pure Tiwari (CT) 4,609 62.79 Gopamau (NP) 15,526 65.46 Gird Gonda (CT) 14,391 52.02 Pihani (NPP) 36,014 63.01 Siddharthnagar Sandila (NPP) 58,346 55.49 Hallaur (CT) 6,999 87.64 Shahabad (NPP) 80,226 51.53 Sant Kabir Nagar
Unnao
Ledwa Mahua (CT) 13,844 74.39 Kursath (NP) 6,770 76.51 Maghar (NP) 19,181 53.73 Ganj Muradabad (NP) 10,957 67.98 Gorakhpur
Lucknow
Piprayli Bujurg (CT) 6,270 52.82 Malihabad (NP) 17,818 61.67 Azamgarh
Rae Bareli
Chak Sikari (CT) 8,820 85.27 Salon (NP) 14,757 66.93 Mubarakpur (NPP) 70,463 84.35 Jais (NPP) 26,735 61.05 Ibrahimpur (CT) 7,853 80.02 Parsadepur (NP) 11,853 57.21 Amilo (CT) 30,339 72.63 Unchahar (NP) 11,033 55.04 Bilariaganj (NP) 13,096 63.23
Farrukhabad
Barahatir Jagdishpur (CT) 15,367 56.94 Amethi Jadid (CT) 5,642 69.25 Sarai Mir (NP) 19,055 52.01 Shamsabad (NP) 28,454 60.72 Mau
Kannauj
Atrari (CT) 5,555 86.91 Samdhan (NP) 31,479 83.12 Khairabad (CT) 13,016 84.96 Talgram (NP) 11,665 50.92 Kurthi Jafarpur (CT) 14,157 75.77 Auraiya
Kopaganj (NP) 34,782 72.17
Kasba Khanpur (CT) 11,938 81.01 Para (CT) 6,427 67.14
Kanpur Dehat
Adari (NP) 13,717 64.07 Ahrauli Shekh (CT) 7,383 52.88 Ghosi (NP) 39,165 61.41
Kanpur Nagar
Walidpur (CT) 25,589 58.05 Bilhaur (NPP) 20,493 55.67 Maunath Bhanjan (NPP) 2,78,745 56.76
Fatehpur
Ballia Kora Jahanabad (NP) 26,359 50.15 Premchak Urf Baheri (CT) 7,063 67.32
Pratapgarh
Jaunpur Katra Medniganj (NP) 7,931 58.93 Machhlishahr (NP) 26,107 55.34
Kaushambi
Khetasarai (NP) 19,438 50.18 Karari (NP) 16,467 59.12 Ghazipur
Allahabad
Bahadurganj (NP) 19,992 55.93 Mau Aima (NP) 19,645 75.04 Chandauli Bharatganj (NP) 16,345 62.45 Satpokhari (CT) 13,757 87.64 Soraon (CT) 10,624 57.36 Chaurhat (CT) 7,971 82.21 Phulpur (NP) 22,998 54.21 Dulhipur (CT) 8,243 60.71
Barabanki
Bahadurpur (CT) 8,515 54.43 Zaidpur (NP) 34,443 81.89 Varanasi Dewa (NP) 15,662 73.30 Kotwa (CT) 14,394 80.76 Dariyabad (NP) 18,338 67.11 Harpalpur (CT) 7,710 77.72 Fatehpur (NP) 35,582 65.51 Lohta (CT) 25,596 76.34 Satrikh (NP) 12,107 55.86 Sant Ravidas Nagar Subeha (NP) 13,772 50.55 Ghosia Bazar (NP) 20,760 77.37
Faizabad
Bhadohi (NPP) 94,620 57.02 Rudauli (NPP) 43,091 58.88 Mirzapur Bhadarsa (NP) 13,154 57.42 Garauri (CT) 5,378 54.35
Ambedkar Nagar
Kanshiram Nagar Bhulepur (CT) 6,445 81.52 Sujavalpur (CT) 9,835 94.12 Tanda (NPP) 95,516 72.16 Bhargain (NP) 21,891 92.94 Iltifatganj Bazar (NP) 13,136 71.31 Sahawar (NP) 24,067 60.65 Jalalpur (NPP) 31,972 70.59 Ganj Dundawara (NPP) 45,385 55.26
Centre for Policy Studies www.cpsindia.org 8
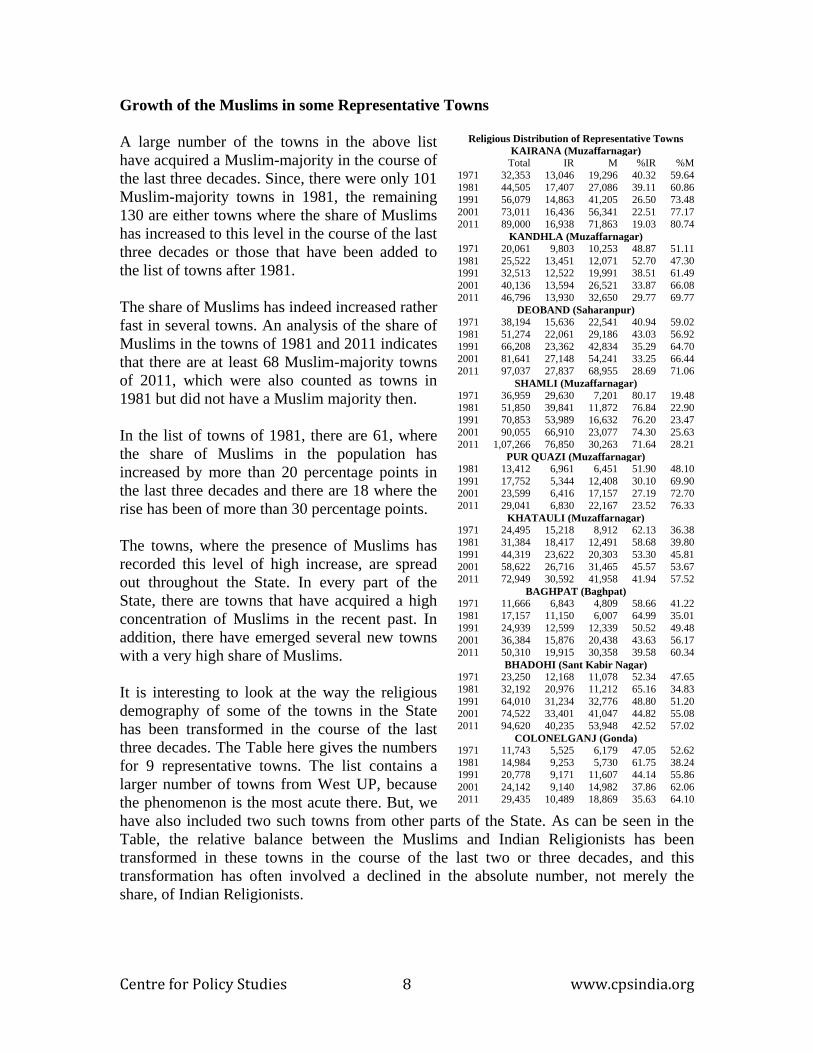
Growth of the Muslims in some Representative Towns
A large number of the towns in the above list
have acquired a Muslim-majority in the course of
the last three decades. Since, there were only 101
Muslim-majority towns in 1981, the remaining
130 are either towns where the share of Muslims
has increased to this level in the course of the last
three decades or those that have been added to
the list of towns after 1981.
The share of Muslims has indeed increased rather
fast in several towns. An analysis of the share of
Muslims in the towns of 1981 and 2011 indicates
that there are at least 68 Muslim-majority towns
of 2011, which were also counted as towns in
1981 but did not have a Muslim majority then.
In the list of towns of 1981, there are 61, where
the share of Muslims in the population has
increased by more than 20 percentage points in
the last three decades and there are 18 where the
rise has been of more than 30 percentage points.
The towns, where the presence of Muslims has
recorded this level of high increase, are spread
out throughout the State. In every part of the
State, there are towns that have acquired a high
concentration of Muslims in the recent past. In
addition, there have emerged several new towns
with a very high share of Muslims.
It is interesting to look at the way the religious
demography of some of the towns in the State
has been transformed in the course of the last
three decades. The Table here gives the numbers
for 9 representative towns. The list contains a
larger number of towns from West UP, because
the phenomenon is the most acute there. But, we
have also included two such towns from other parts of the State. As can be seen in the
Table, the relative balance between the Muslims and Indian Religionists has been
transformed in these towns in the course of the last two or three decades, and this
transformation has often involved a declined in the absolute number, not merely the
share, of Indian Religionists.
Religious Distribution of Representative Towns
KAIRANA (Muzaffarnagar)
Total IR M %IR %M
1971 32,353 13,046 19,296 40.32 59.64
1981 44,505 17,407 27,086 39.11 60.86
1991 56,079 14,863 41,205 26.50 73.48
2001 73,011 16,436 56,341 22.51 77.17
2011 89,000 16,938 71,863 19.03 80.74
KANDHLA (Muzaffarnagar)
1971 20,061 9,803 10,253 48.87 51.11
1981 25,522 13,451 12,071 52.70 47.30
1991 32,513 12,522 19,991 38.51 61.49
2001 40,136 13,594 26,521 33.87 66.08
2011 46,796 13,930 32,650 29.77 69.77
DEOBAND (Saharanpur)
1971 38,194 15,636 22,541 40.94 59.02
1981 51,274 22,061 29,186 43.03 56.92
1991 66,208 23,362 42,834 35.29 64.70
2001 81,641 27,148 54,241 33.25 66.44
2011 97,037 27,837 68,955 28.69 71.06
SHAMLI (Muzaffarnagar)
1971 36,959 29,630 7,201 80.17 19.48
1981 51,850 39,841 11,872 76.84 22.90
1991 70,853 53,989 16,632 76.20 23.47
2001 90,055 66,910 23,077 74.30 25.63
2011 1,07,266 76,850 30,263 71.64 28.21
PUR QUAZI (Muzaffarnagar)
1981 13,412 6,961 6,451 51.90 48.10
1991 17,752 5,344 12,408 30.10 69.90
2001 23,599 6,416 17,157 27.19 72.70
2011 29,041 6,830 22,167 23.52 76.33
KHATAULI (Muzaffarnagar)
1971 24,495 15,218 8,912 62.13 36.38
1981 31,384 18,417 12,491 58.68 39.80
1991 44,319 23,622 20,303 53.30 45.81
2001 58,622 26,716 31,465 45.57 53.67
2011 72,949 30,592 41,958 41.94 57.52
BAGHPAT (Baghpat)
1971 11,666 6,843 4,809 58.66 41.22
1981 17,157 11,150 6,007 64.99 35.01
1991 24,939 12,599 12,339 50.52 49.48
2001 36,384 15,876 20,438 43.63 56.17
2011 50,310 19,915 30,358 39.58 60.34
BHADOHI (Sant Kabir Nagar)
1971 23,250 12,168 11,078 52.34 47.65
1981 32,192 20,976 11,212 65.16 34.83
1991 64,010 31,234 32,776 48.80 51.20
2001 74,522 33,401 41,047 44.82 55.08
2011 94,620 40,235 53,948 42.52 57.02
COLONELGANJ (Gonda)
1971 11,743 5,525 6,179 47.05 52.62
1981 14,984 9,253 5,730 61.75 38.24
1991 20,778 9,171 11,607 44.14 55.86
2001 24,142 9,140 14,982 37.86 62.06
2011 29,435 10,489 18,869 35.63 64.10
Centre for Policy Studies www.cpsindia.org 9
There are also a few towns, where the share of Muslims has declined. Looking at the
data, it seems that some kind of ferment is going on in the urban demography of the
State, with the different communities seeking to consolidate their numbers in different
towns; the consolidation, however, seems largely in favour of the Muslims.
Such transformation has serious social, economic and political consequences. It is the
business of the social scientists to study such phenomenon from various perspectives.
Summing Up
1. Muslims have a much higher influence in the urban areas of Uttar Pradesh than what is
indicated by their average share in the total population of the State.
2. They have a share of 37.2 percent in the urban population of the State, compared to
their share of only 19.3 percent in the total population.
3. This is, of course, because of the higher concentration of Muslims in the urban areas.
Of the Muslims in the State, 37.2 percent are urban. The urban ratio of the rest of the
population in the State is only 15.1 percent.
4. The level of urbanisation of the Muslims is such that they form a majority in the urban
population of 8 districts of the State and they have a share of between 40 and 50 percent
in another 13 districts. These districts with high Muslim presence in the urban areas are
spread throughout the State.
5. The dominance of Muslims in the urban demography of the State looks deeper and
more widespread when we analyse the data at the sub-district (taluk) level. Muslims form
a majority in the urban population of 106 of the 294 urban taluks of the State, and they
have a share of 40 to 50 percent in another 43.
6. Among 106 taluks with a majority of Muslims in the urban population, there are 12
where the share of Muslims is above 70 percent and another 23 where their share is
between 60 to 70 percent.
7. Muslim dominance looks even more intense at the town level. Census 2011 counts a
total of 915 towns in Uttar Pradesh. Muslims form a majority in 231 of these. These
Muslim-majority towns are spread all across the State.
8. Among 231 Muslim-majority towns in the State, there are 15 where Muslims form
more than 90 percent of the population and there are another 37 where their share is
between 80 to 90 percent.
9. Analysis of the data for the earlier decades shows that the dominance of Muslims in
the towns of Uttar Pradesh has been rising sharply, particularly after 1981.
10. There were only 607 towns counted in 1981 and Muslims formed a majority of only
101 amongst them. The number of Muslims majority towns has thus increased from 101
to 231 in these three decades.
11. The data strongly indicates that the rapid rise in the share of Muslims in the towns of
Uttar Pradesh during the last two or three decades has involved or led to an out-migration
of other communities, mainly Hindus, from several towns.