MUSINA LOCAL MUNICIPALITY - MFMA
45
1 MUSINA LOCAL MUNICIPALITY 2011-12 ANNUAL PERFORMANCE REPORT
Transcript of MUSINA LOCAL MUNICIPALITY - MFMA

1
MUSINA LOCAL MUNICIPALITY
2011-12 ANNUAL PERFORMANCE REPORT

CAT Gra REG CiviIrwiMus090 PrivMus090 Tel:FaxE-m BAN ABS
TEGORY
ade 03 Loc
GISTERE
c Centre nstreet sina 00
vate Bag Xsina 00
015 x: 086 5mail: musin
NKERS
SA Bank
OF MUN
cal Munic
ED OFFIC
X611
- 517 0049 na.gov.za
NICIPALIT
cipality
E
534 61
a
TY
100
2

3
VISION
Vehicle of affordable quality services and stability through socio-economic development and
collective leadership
MISSION To be a community driven municipality with a developing and adapting infrastructure, serving all
people in a focussed, efficient and accountable manner
MUNICIPALITY’S BROAD OBJECTIVES The Municipality’s strategies seek to achieve the following broad objectives: To deliver basic services to communities in a sustainable manner in the quest to create a better life for all, To create an environment for local economic growth and job creation, focusing on the competitive advantages of the Municipality. To provide responsible and accountable political and administrative leadership to local communities, To mobilize the broadest section of the local communities behind the Municipality’s endeavours to develop communities with other government departments, public institutions, private sector, NGO�s and CBO�s as the Municipality’s critical partners.
OVERVIEW OF THE MUNICIPALITY 1.1 MUSINA LOCAL MUNICIPALITY
Musina local municipality was established in terms of the Municipal Structures Act, 117 of 1998, which provides for the establishment of municipalities, their categories, competencies, powers and functions. Musina local municipality is a category 3 plenary Council consisting of 12 Councillors, 6 ward councillors and 6 proportional representatives.
Musina Local Municipality falls within the Vhembe District Municipality, which is made up of four local municipalities, namely Musina, Makhado, Thulamela and Mutale, of which Musina Local Municipality is bounded by Makhado Local Municipality to the South and Mutale local Municipality to the east. Musina is also bounded in the South West by the Local Municipality of Blouberg which falls within the Capricorn District Municipality. Musina Local Municipality is located in the very North of the Limpopo Province, bordering Botswana and Zimbabwe. Musina Local Municipality covers an area of approximately 757 829 ha that extends from the confluence of the Mogalakwena and Limpopo rivers in the West to the confluence of the Nwanedi and Limpopo rivers in the

4
East and from Tshipise and Mopane in the South to Botswana/Zimbabwe borders in the North. The municipal area consists mainly of commercial farms and only 0.08% of the total area is urban in nature.
The spatial structure of the municipality falls within the second order settlement as depicted by the hierarchy as contained in the Spatial Rational and therefore the spatial framework is aligned to the NSDP, ASGISA and the LEGDP. The settlement hierarchy of Musina municipality as per the spatial rationale is as follows:
1.2 POWERS AND FUNCTIONS
The powers and functions were assigned to Musina local municipality in accordance with Section 156 of the Constitution and all Section 84(2) of the Structures Act together with Section 85 adjustments to Musina local municipality on Waste, Roads, Cemeteries, Tourism and public works.
a) The facilitation for the provision and maintenance of child care facilities.
b) Development of local tourism.
c) Municipal planning, municipal roads
d) Municipal public transport.
e) Municipal public works relating to the municipality’s functions.
f) Administer trading regulations.
g) Administer billboards and display of advertisements in public areas.
h) Administer cemeteries, funeral parlours and crematoria.
i) Cleansing.
j) Control of public nuisances.
k) Control of undertakings that sell liquor to the public.
l) Ensure the provision of facilities for the accommodation, care and burial of animals.
m) Fencing and fences.
n) Licensing of dogs.
o) Licensing and control of undertakings that sell food to the public.
p) Administer and maintenance of local amenities.
q) Development and maintenance of local sport facilities.
r) Develop and administer markets.
s) Development and maintenance of municipal parks and recreation.
t) Regulate noise pollution.
u) Administer pounds.

5
v) Development and maintenance of public places.
w) Refuse removal, refuse dumps disposal.
x) Administer street trading.
y) The imposition and collection of taxes and surcharges on fees as related to the municipality functions.
z) Receipt and allocation of grants made to the municipality.
aa) Imposition and collection of taxes, levies and duties as related to municipality function.
bb) Storm water management systems.
cc) Provision and maintenance of water and sanitation.

6
Mayor CM Phiri

7
CHAPTER 1 1.1 MAYOR'S FOREWORD It is with great pleasure that I hereby present the Annual Report of Musina Municipality for the 2011/12 financial year. This report outlines the achievements and challenges experienced by our Municipality. The Municipality takes pride in serving the community as an extension of good governance and implementation of those decisions taken in the best interests of the people of Musina. In the execution of our tasks at hand as well as in the process of service delivery, mistakes were occasionally made either by councillors or officials, but I am nonetheless convinced that the community of Musina will be satisfied with the general management of the municipality. Some of the major challenges that have been addressed during the past year included unemployment, poverty, unfilled vacancies, as well as social problems arising due to our massive population growth. I have to thank each resident of Musina who has contributed significantly to the development of our municipality. Together we endeavour to overcome all our major challenges. I would like to express my gratitude towards all Councillors and staff members for again making the 2011/12 financial year a successful year for service delivery. I wish to thank each individual and every organization who unselfishly served their fellow citizens and who constructively contributed towards building and turning Musina into a better place for all. We are aptly aware of the challenges facing us, but I believe the Municipality has the ability to overcome these challenges and again raise the bar in service delivery standards. The people of Musina are assured of a working municipality, both in terms of its ability to deliver, and as a council with energy, enthusiasm and unwavering commitment to a better future for all. In the spirit of cooperative governance, we built the soundest relationship with national and provincial departments to ensure that there is synergy and cohesion in service delivery. We collaborated with other municipalities across the country in order to share best practice and expertise so that the mandate to create a better life was accelerated. We had a cohort of committed workers who gave their best performance to assist us in realizing our objectives as a municipality.
All of these efforts, as the report shows, confirm that we were indeed committed in working together to build a better life.
___________________________ MAYOR CM PHIRI

8
1.2. MUNICIPAL MANAGER’S OVERVIEW MUNICIPAL MANAGER'S OVERVIEW The purpose of this report is to comply with the Municipal Finance Management Act regarding reporting regulations which requires that specific developments and challenges of the municipality be reported in the prescribed formats.
We were able to achieve our targets in relation to improvements made to service delivery in an attempt to align our services to the IDP. Our financial indicators are a true reflection of our goal of efficient accountability and sound administration of the municipality.
On behalf of the administration, it is my pleasure to pass gratitude to our political component, sector departments, the NGO’s, civil society and most importantly our local stakeholders for the contributions they made towards the achievements as indicated in this report.
1.3. ORGANISATIONAL DEVELOPMENT OVERVIEW ORGANISATIONAL DEVELOPMENT PERFORMANCE Delete Directive note once comments completed – Provide an overview of key Organisational Development issues based on information contained in Chapter 4
CHAPTER 2: GOVERNANCE
2.1 PUBLIC ACCOUNTABILITY AND PARTICIPATION
2.1.1 OVERVIEW OF PUBLIC ACCOUNTABILITY AND PARTICIPATION Key to the accountability processes in terms of both the Structures and the Systems Acts is the facilitation and implementation of the following forums: • Quarterly Community report back meetings by Ward Councilors • Quarterly Mayoral Imbozos • Ward Committee monthly assessment meetings • Annual Mayoral Address • Half year Progress Report by the Mayor • Annual IDP/Budget community and focused groups’ consultation meetings 2.1.2 PUBLIC MEETINGS COMMUNICATION, PARTICIPATION AND FORUMS
The IDP representative forum is Chaired by the Mayor and the stakeholders are: Councillors,

9
Ward committees, Organised labour, Community based organisations, Nongovernmental organisations, Sector departments, Parastatals, Organised business organisations, Farmers organisations. The meetings of the IDP representatives forum is held once in every phase of the IDP namely: Preparatory, Analysis, Strategies, Projects, Integration and Approval and we do quarterly reports on our performance based on the SDBIP to all IDP representatives forum meetings. The stakeholders agreed to have the meetings in the evening to accommodate other stakeholders who are employed and further that the timing of the IDP compilation is regulated by the Municipal Systems Act on when it commences and its ending period. Presently in our data base and based on attendance registers of our meetings we usually have more than 100 stakeholders representatives attending our meetings. Members of the IDP Representatives Forum will be encouraged and urged to hold consultative and feedbacks meetings with the structures and constituencies they represent in order to get their inputs and communicate feedback reports from IDP Representatives Forum for further mandate.
Mayor CM Phiri
(ANC)

10
Councillor F Mafela (ANC) Ward 1
Councillor S Phiri (ANC) Ward 2
Councillor SFL Ndhlovu (Chief whip – ANC – Ward 3)
Councillor LB Ndou (ANC)
Ward 4 Councillor GL Milanzi (ANC)
Ward 5 Councillor JC Kaunda (ANC)
Ward 6
Councillor JS Banda (PR - ACDP)
Councillor EE Khoza (PR Cope)
Councillor P Tlou (PR - PAC)
Councillor – ES SHirilele (PR - ANC)
Councillor E Ramoyada (PR - ANC)

11
2.1.3 COUNCILLORS INTRODUCTION TO GOVERNANCE The municipality has during the year under review established key governance structures to ensure that adequate internal mechanisms are employed to facilitate good governance. COMPONENT A: POLITICAL AND ADMINISTRATIVE GOVERNANCE INTRODUCTION TO POLITICAL AND ADMINISTRATIVE GOVERNANCE POLITICAL GOVERNANCE EXECUTIVE AND COUNCIL This component includes: Executive office (Mayor, Councillors, and Municipal Manager). INTRODUCTION TO EXECUTIVE AND COUNCIL The Musina governance structure comprises of the Council, Mayor, the Managers and . Table 1.1 outlines and responsibilities, oversight and accountability of each structure. Table 1.1 Governance Structure Musina STRUCTURE RESPONSIBLE FOR OVERSIGHT OVER ACCOUNTABLE TO
Council Approve policies and budget
Mayor, Audit committee Community
Mayor
Policies, budget, outcomes, management and oversight over Manager
Municipality Manager Council
Municipal Manager Outputs and implementation The administration Mayor
CFO and EMT Outputs and implementation
Financial management and operational functions
Municipal Manager
The Musina Council is constituted by 6 elected Councillors; 3 Councillors are ward representatives and 3 represent their political parties on a proportional basis. The parties in Council are illustrated in table 1.2
PARTY Total seats (2011 / 2016) Ward seats PR seats
ANC 9 6 3 COPE 1 0 1 PAC 1 0 1
ACDP 1 0 1

12
The work of the Council is coordinated by Mayor who is elected by Council. The mayor is assisted by Councillors in performing her duties. The administration is headed by the Municipal Manager as the Chief Accounting Officer. The Municipal Manager is further responsible and accountable for the formation and development of an economical, effective, efficient and accountable administration as well as the management of the provision service in a sustainable and equitable manner within the municipality. The administration is made up of the following directorates headed by Executive Management Teams: Finance, Corporate Services, Community services, Technical and Economic Development and Planning. Key Milestones of the Council for 2011/2012 • Conducted successful Ward Committee elections and an induction workshop • Facilitated community involvement in planning processes including IDP and budget
Employees: The Executive and Council – Municipal Manager
Job Level
2010/11 2011/12 Employees Posts Employees Vacancies
(fulltime equivalents)
Vacancies (as a % of total posts)
No. No. No. No. % Sect 57 1 1 0 1
0 - 3 3 5 4 1 4 - 6 1 1 0 1 7 - 9 4 13 1 12
10 - 12 8 0 0 0 16 - 18 0 0 0 0 Total 16 20 5 15 75 %
Note: MFMA S52(a): The Mayor must provide general political guidance over the fiscal and financial affairs of the municipality. The following committees of Council are in place: (a) Oversight Committee (MPAC) (b) Finance Committee (c) Local Labour Forum (d) Events Committee (e) Audit & Performance Committee Part-time councillors is chairpersons of the committees. A Municipal Council comprising of 12 councillors for the 2011/2016 term of Council is in place and established in accordance with the Municipal Structures Act. Council established and elected councillors to serve on portfolio committees in accordance with the Municipal Structures Act.

13
Portfolios Responsible Councillors
Community Services
Sports, Arts and Culture
Councillor ES Shirilele;
Councillor LB Ndou
Councillor G Phiri
Health and education
Housing Unit / Allocation
Disaster Management
Safety and Security
Transport
Technical Department
Planning Councillor F Mafela
Councillor E Ramoyada Housing and Electricity
Roads, water and Sewerage
Finance Department Finance Committee Councillor GN Milanzi
Corporate Services Administration
Councillor LB Ndou Land and Traditional Affairs
Corporate Services Sub committees
Local Labour Forum
IDP and LED
Tourism
Councillor SFL Ndhlovu Marketing
Development
Special Programmes
Youth
Mayor’s Office Disability
Gender
Senior Citizens
Council established the positions of Mayor and Chief Whip as fulltime office bearers.

14
Public Participation
The municipality in compliance to the Constitution of the Republic of South Africa and other legislations governing local government annually prioritizes the involvement of local communities in the planning and execution of the municipal programmes. Such involvement takes the following shape, community Izimbizo, Annual Report Consultative Meetings, IDP/Budget Community Consultations, IDP/Budget Representative Fora, Open Council Meetings.
COMMENT ON THE EFFECTIVENESS OF THE PUBLIC MEETINGS HELD: The public meetings were very effective because they gave a good understanding to the communities on how government operates. This is because during those meetings, sector departments were also invited to render services to the communities. After getting inputs from the communities, these meetings also helped the municipality in planning and implementing projects, taking into consideration the needs of the society. Council Meetings Musina Local Municipality has adopted a schedule detailing all the meetings of the Council starting from the meetings by management, portfolio committee, and ultimately council itself. Such meetings took place as planned and it was only where there were serious clashes of dates that a shift was negotiated. For the financial year 2011/2012 all the planned council meetings were held as planned.
Ward Committee meetings and Ward Committee Establishment. The municipality has established Ward Committees in all 6 Wards. All Ward Committees are functional and meet frequently and are administratively supported from the Office of the Mayor.
Payment of stipends to the Ward Committees will be implemented in the 2012 /2013 Financial Year.
Integrated Development Plan (Review and Implementation) The development and review of the integrated development plan for the financial year 2011/2012 was done internally through the involvement of the IDP/Budget steering committee and council. Communities and interested stakeholders were consulted on the formulation of IDP/Budget priorities and setting of targets. To consolidate community and stakeholder consultations, meetings were held as per the approved Process Plan. The final IDP/Budget document was adopted by the Council on the 29th April 2011 earlier than planned due to the pressure of the local government municipal elections.

15
2.1.4 IDP PARTICIPATION AND ALIGNMENT
IDP Participation and Alignment Criteria* Yes/No
Does the municipality have impact, outcome, input, output indicators?
Yes
Does the IDP have priorities, objectives, KPIs, development strategies?
Yes
Does the IDP have multi-year targets? Yes
Are the above aligned and can they calculate into a score? Yes
Does the budget align directly to the KPIs in the strategic plan? Yes
Do the IDP KPIs align to the Section 57 Managers Yes
Do the IDP KPIs lead to functional area KPIs as per the SDBIP? Yes
Do the IDP KPIs align with the provincial KPIs on the 12 Outcomes
Yes
Were the indicators communicated to the public? Yes
Were the four quarter aligned reports submitted within stipulated time frames?
Yes
Performance Management System The implementation of the performance management system for the financial year 2011/2012 was realized although with a little measure of success. Only the Technical and Community Services Managers completed performance agreements. The other section 57 positions were vacant. No performance assessments were undertaken and only progress review of the service delivery and budget implementation plan was done on a quarterly basis the council. No performance bonuses were paid. 2.2 CORPORATE GOVERNANCE Administrative Governance Structures. The municipality established administration in accordance with the provisions of both the Municipal Structures Act and Municipal Systems Act with the Municipal Manager as head of administration and accounting officer. The following administrative structures were established to bolster good governance:

16
a) Local Labour Forum b) Supply Chain Management Committees - Bid Specifications Committee - Bid Evaluations Committee - Bid Adjudication Committee c) Budget & IDP Steering Committee d) Finance Committee e) Audit and Performance Committee Audit functions During the year under review the municipality shared the service of an Audit Committee with Vhembe District Municipality. The purpose of the Audit Committee is to monitor oversight, quality assurance and compliance enforcement roles. The municipality appointed a Section Head: Internal Audit in 2011. The lack of an Internal Audit function has contributed to some of the un-favourable findings on the Audit opinion by the Auditor General. INTERGOVERNMENTAL RELATIONS The municipality participates in various intergovernmental structures locally, at a district level and even at a provincial level. Locally structures of intergovernmental relations include the water sector forum, roads and transport forum, energy forum, local economic development forum, and disaster management forum. Various sector departments and relevant stakeholders are the main participants in the activities of such forums. In the district the municipality partakes in the district IDP Managers forum, CFO’s forum, Municipal Managers Forum, District Speakers and Mayors forum. In the province the municipality participates in the Premier-Mayors� forum, provincial municipal managers� forum as well as the Provincial Planning and Development Forum. BY-LAWS The MSA 2000 S11(3)(m) provides municipal councils with the legislative authority to pass and implement bylaws for the betterment of the community within the terms of the legislation. The municipality has by-laws in place. However, enforcement thereof remains a challenge. There is a need, moreover, to raise public education and awareness to ensure easy compliance and enforcement of approved by-laws. Through by-laws, the municipality must, in future, regulate other critical areas that remain unregulated currently to curb un-favourable practices and to protect the interests of residents, business, environment and the state.

17
2.2.1 RISK MANAGEMENT
In terms of section 62 1(c) of the MFMA a municipality should have and maintain an effective, effective and transparent system of risk management. During the year under review the risk unit was not operational and its functions were partly performed by internal audit unit.
The risk unit was established in the current financial year and the policies as well as the strategies are being reviewed for the new financial year.
2.2.3 FRAUD AND ANTI-CORRUPTION
The municipality did not have the functional strategy during the year under review but currently shares the anti-fraud and corruption with the one operating in the district for all the local municipalities under the district. The policy and strategy are the same as used in the district for the current financial year.
2.2.4 SUPPLY CHAIN MANAGEMENT OVERVIEW SUPPLY CHAIN MANAGEMENT
The council has adopted a SCM policy in terms of SCM regulation 3. The SCM unit consists of two full time staff; two positions (Manager and
Accountant SCM) are unfilled and awaiting appointments. A report on the implementation of the SCM policy is presented to the Mayor on a
quarterly basis. Needs assessments are undertaken for each acquisition and preferential policy
objectives identified. Threshold values in the SCM policy are aligned with values stipulated in regulation
12. Municipal bid documents comply with MFMA circular 25. Records of tenders and all other bids received and awards made. All bid committees were established and appointed by the Accounting officer. Note: MFMA S110-119; SCM Regulations 2005; and relevant MFMA circulars set out
required processes and guidance manuals to help ensure that SCM arrangements provide appropriate goods and services, offer best value for money and minimize the opportunities for fraud and corruption.

18
CHAPTER 3 - SERVICE DELIVERY PERFORMANCE (PERFORMANCE REPORT)
INTRODUCTION COMPONENT A: BASIC SERVICES This component includes: water; waste water (sanitation); electricity; waste management; and housing services; and a summary of free basic services.
Proportion of Households with minimum level of Basic services 2008/09 2009/10 2010/11 2011/12 Electricity service connections 96.9% 95.4% 95% 88.7%
Water - available within 200 m from dwelling 98.8% 98.8% 100.00
% 100.00
% Sanitation - Households with at least VIP service 98.8% 98.8% 98.8% 98.8% Waste collection - kerbside collection once a week 98.7% 98.8% 98.8% 98.8%
3.1 WATER PROVISION INTRODUCTION TO WATER PROVISION Note: Recent legislation includes the Water Services Act 1997 and the General Enabling Act 2005 Musina Local Municipality is not a Water Services Authority (W.S.A.) but a Water Services Provider (W.S.P.). In the rural areas Vhembe District Municipality provides the Infrastructure and Musina does the provision. In the urban areas Musina does the extraction, purification, reticulation and billing and also connect all new customers.
Total Use of Water by Sector (cubic meters)
Agriculture Forestry Industrial Domestic Unaccountable water losses
2010/11 0 0 994810 3479619 490771 2011/12 0 0 1260936 3992964 472851
T3.1.2

19
COMMENT ON WATER USE BY SECTOR: Musina Local Municipality does not supply any water to Agriculture or forestry but only to Industrial/Commercial and Domestic. 3.1 WASTE WATER (SANITATION) PROVISION INTRODUCTION TO SANITATION PROVISION Musina Local Municipality is a WSP and Vhembe District Municipality the W.S..A. In the rural and urban areas Vhembe District Municipality provides the infrastructure and Musina Local Municipality does the operation. All households have basic access and 82% are on a high level of service.
0
10
20
30
40
50
60
70
Agriculture Forestry Industrial Domestic Unaccountablewater losses
Cubic
met
er
Water use by Sector
2009/10
2010/11

20
Water Service Delivery Levels
Households
Description 2009/10 2010/11 2011/12 Actual Actual Actual Actual
No. No. No. No.
Water: (above min level)
Piped water inside dwelling 7710 7814 7991 7991
Piped water inside yard (but not in dwelling) 0 0 0
Using public tap (stand pipes ) 1548 1837 1837 1 837
Other water supply (within 200m)
Minimum Service Level and Above sub-total 9258 9651 9828 9828
Minimum Service Level and Above Percentage 98.8% 100% 100% 100%
Water: (below min level)
Using public tap (more than 200m from dwelling)
Other water supply (more than 200m from dwelling 116
No water supply
Below Minimum Service Level sub-total 116
Below Minimum Service Level Percentage 1,2%
Total number of households* 9374 9651 9828 9828
* - To include informal settlements T3.1.3
Households - Water Service Delivery Levels below the minimum
Households Description 2009/10 2010/11 2011/12 2011/12
Actual Actual Actual Original Budget
Adjusted Budget Actual
No. No. No. No. No. No.
Formal Settlements
Total households 9374 9651 9828 9828 9828 9828
Households below minimum service level 116 0 0 0 0 0
Proportion of households below minimum service level 1,2% 0% 0% 0% 0% 0%
Informal Settlements
Total households 0 0 0 0 0 0
Households ts below minimum service level 0 0 0 0 0
Proportion of households ts below minimum service level 0% 0% 0%

21
3.2 WASTE MANAGEMENT (THIS SECTION TO INCLUDE: REFUSE COLLECTIONS, WASTE DISPOSAL, STREET CLEANING AND RECYCLING) INTRODUCTION TO WASTE MANAGEMENT Musina Local Municipality strives very hard to maintain a clean environment. Services of SMMEs have been procured to provide cleaning services across the streets of the three CBDs. In addition, waste is collected weekly from the doorsteps of the residents. Last year, 87% solid waste was collected on time. Community participation is paramount in this regard. Public awareness and cleaning campaigns are organized on a regular basis in order to promote cleanliness. A total of 7 awareness and cleaning campaigns, respectively were undertaken last year.
Households - Solid Waste Service Delivery Levels below the minimum
Households
Description
2009/10 2010/11 2011/12 2011/12
Actual Actual Actual Original Budget
Adjusted Budget Actual
No. No. No. No. No. No.
Formal Settlements
Total households 9374 9651 9828 9828 9828 9828
Households below minimum service level 116 116 116 116 116 116
Proportion of households below minimum service level 1,2% 1,2% 1,2% 1.2% 1.2% 1.2%
Informal Settlements
Total households 0 0 0 0 0 0
Households ts below minimum service level 0 0 0 0 0 0
Proportion of households ts below minimum service level 0% 0% 0%
T3.4.3

22
Solid Waste Service Delivery Levels
Households
Description 2008/09 2009/10 2010/11 2011/12
Actual Actual Actual Actual
No. No. No. No.
Solid Waste Removal: (Minimum level)
Removed at least once a week
Minimum Service Level and Above sub-total 9258 9535 9712 9712
Minimum Service Level and Above percentage 98.8% 98.8% 98.8% 98.8%
Solid Waste Removal: (Below minimum level)
Removed less frequently than once a week
Using communal refuse dump
Using own refuse dump
Other rubbish disposal
No rubbish disposal 116 116 116 116
Below Minimum Service Level sub-total 116 116 116 116
Below Minimum Service Level percentage 1.2% 1.2% 1.2% 1.2%
Total number of households 9374 9651 9828 9828
Employees: Solid Waste Management Services
Job Level
2010/11 2011/12
Employees Posts Employees Vacancies (fulltime
equivalents)
Vacancies (as a % of total posts)
No. No. No. No. %
0 ‐ 3 0 0 0 0
4 ‐ 6 0 0 0 0
7 ‐ 9 0 1 1 0
10 ‐ 12 5 5 3 2
13 ‐ 15 0 0 0 0
16 ‐ 18 35 35 32 3
19 ‐ 20
Total 40 41 36 5

23
Financial Performance 2011/2012: Solid Waste Management Services
R'000
Details 2011/11 2011/12
Actual Original Budget
Adjustment Budget
Actual Variance to Budget
Total Operational Revenue (excluding tariffs) 6 030 7 660 7 660 6 555 1 105
Expenditure:
Employees 3 357 3 919 3 919 3 913 6
Repairs and Maintenance 1 137 4 531 4 531 4 529 2
Other 626 729 729 865 136
Total Operational Expenditure 5 120 9 179 9 179 9 307 128
Net Operational (Service) Expenditure 910 1 519 1 519 2 752 1233

24
3.3 ELECTRICITY INTRODUCTION TO ELECTRICITY Electricity provision is central to our communities and has a major impact in improving everyday lives of our people. It also has a major impact on combating crime Musina Local Municipality has the licence for electrical distribution in urban areas and Eskom in the rural areas. Musina Local Municipality connects each and every house as they are constructed. There is no backlog in urban areas. Application for electrification in the rural areas is made to Eskom.
Electricity Service Delivery Levels
Households - Electricity Service Delivery Levels below the minimum
Households
Description
2009/10 2010/11 2011/12 2011/12
Actual Actual Actual Original Budget
Adjusted Budget
Actual
No. No. No. No. No. No.
Formal Settlements
Total households 9374 9651 9828 9828 9828 9828 Households below minimum service level 431 483 1112 1112 1112 1112 Proportion of households below minimum service level 4.6% 5.0% 11.3% 11.3% 11.3% 11.3%
Informal Settlements
Total households 0 0 0 0 0 0 Households ts below minimum service level 0 0 0 0 0 0 Proportion of households ts below minimum service level
T3.3.4
8,6008,8009,0009,2009,4009,6009,800
Electricity (at leastmin.service level)
Electricity - prepaid(min.service level)
Electricity (<min.service level)
Electricity - prepaid(< min. service
level)
Electricity
2007/08 2008/09 2009/10 2010/11

25
Employees: Electricity Services
Job Level
2010/11 2011/12
Employees Posts Employees Vacancies (fulltime
equivalents)
Vacancies (as a % of total posts)
No. No. No. No. %
0 ‐ 3 1 1 1 0
4 ‐ 6 4 3 3 0
7 ‐ 9 1 1 1 0
10 ‐ 12 2 2 2 0
13 ‐ 15 0 0
16 ‐ 18 40 40 18 22
19 ‐ 20
Total 48 0 24 22
Financial Performance 2011/12: Electricity Services
R'000
Details
2010/11 2011/12
Actual Original Budget
Adjustment Budget
Actual Variance to Budget
Total Operational Revenue (excluding tarrifs) 54 723 54 339 72 354 70 603 1 751
Expenditure:
Employees 4 117 5 146 5 146 5 145 1
Repairs and Maintenance 1 292 1 512 1 512 1 503 9
Other 31 434 35 846 38 786 37 888 898
Total Operational Expenditure 36 843 42 504 45 444 44 536 908
Net Operational (Service) Expenditure 17 880 11 835 26 910 26 067 843

26
3.4 HOUSING
Employees: Housing Services
Job Level
2010/11 2011/12
Employees Posts Employees Vacancies (fulltime
equivalents)
Vacancies (as a % of total posts)
No. No. No. No. %
0 – 3 0 1 0 1
4 – 6
7 – 9 1 1 1 0
10 – 12
13 – 15
16 ‐ 18 2 3 1 2
19 ‐ 20
Total 2 5 2 3 60 %
Financial Performance 2011/12: Housing Services
R'000
Details
2010/11 2011/12
Actual Original Budget
Adjustment Budget
Actual Variance to Budget
Total Operational Revenue (excluding tarrifs)
Expenditure:
Employees
Repairs and Maintenance
Other 27 27 2 25
Total Operational Expenditure 27 27 2 25
Net Operational (Service) Expenditure 27 27 2 25
COMMENT ON THE PERFORMANCE OF THE HOUSING SERVICE OVERALL: Musina Local Municipality have applied and submitted for both disaster and emergency houses to the Department of Local Government and Housing. No houses were allocated for the required housing programmes

27
COMMENT ON FREE BASIC SERVICES AND INDIGENT SUPPORT: COMPONENT A: BASIC SERVICES This component includes: roads; transport; and waste water (storm water drainage). INTRODUCTION TO ROAD TRANSPORT 3.5 ROADS INTRODUCTION TO ROADS Musina Local Municipality has a severe shortage in the budget to maintain roads. Until the financial resources are available the maintenance will be insufficient.
Employees: Roads and Other
Post Level
2010/11 2011/12 Employees Posts Employees Vacancies
(fulltime equivalents)
Vacancies (as a % of total posts)
No. No. No. No. % 1 - 3 1 1 1 0 4 - 6 7 - 9
10 - 12 2 4 2 2 Minimum 11 15 11 4
Total 14 20 14 6 30%
28
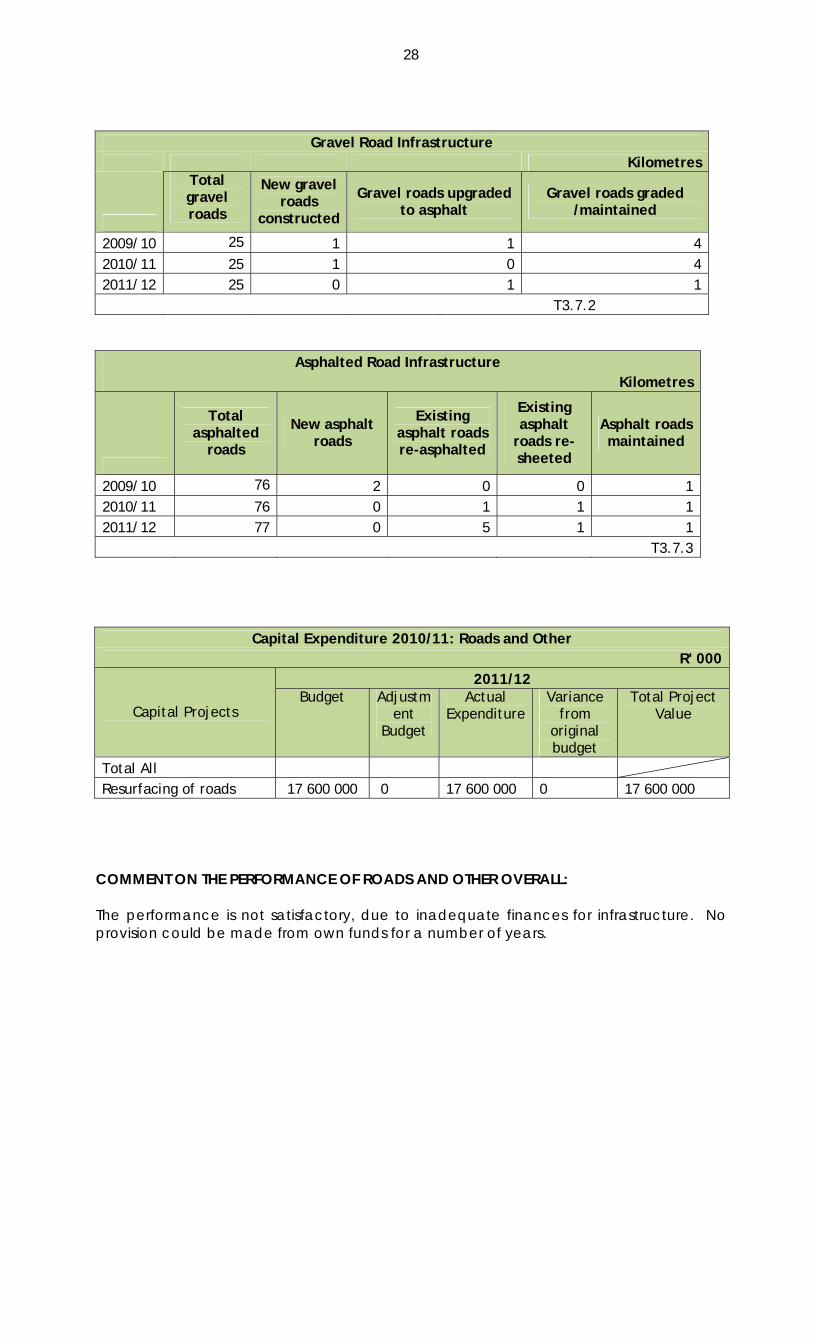
Gravel Road Infrastructure Kilometres
Total gravel roads
New gravel roads
constructed
Gravel roads upgraded to asphalt
Gravel roads graded /maintained
2009/10 25 1 1 4 2010/11 25 1 0 4 2011/12 25 0 1 1 T3.7.2
Asphalted Road Infrastructure Kilometres
Total asphalted
roads
New asphalt roads
Existing asphalt roads re-asphalted
Existing asphalt
roads re-sheeted
Asphalt roads maintained
2009/10 76 2 0 0 1 2010/11 76 0 1 1 1 2011/12 77 0 5 1 1 T3.7.3
Capital Expenditure 2010/11: Roads and Other
R' 000
Capital Projects
2011/12 Budget Adjustm
ent Budget
Actual Expenditure
Variance from
original budget
Total Project Value
Total All Resurfacing of roads 17 600 000 0 17 600 000 0 17 600 000
COMMENT ON THE PERFORMANCE OF ROADS AND OTHER OVERALL: The performance is not satisfactory, due to inadequate finances for infrastructure. No provision could be made from own funds for a number of years.

29
3.6 COMPONENT D: COMMUNITY & SOCIAL SERVICES
Employees: Libraries; Archives; Museums; Galleries; Community Facilities; Other
Job Level
2010/11 2011/12
Employees Posts Employees Vacancies (fulltime
equivalents)
Vacancies (as a % of total posts)
No. No. No. No. %
0 ‐ 3
4 ‐ 6 1 2 1 1 50 %
7 ‐ 9
10 ‐ 12
13 ‐ 15
16 ‐ 18
19 ‐ 20
Total 1 2 1 1 50 %
Financial Performance 2011/12: Libraries; Archives; Museums; Galleries; Community Facilities; Other
R'000
Details
2010/11 2011/12
Actual Original Budget
Adjustment Budget
Actual Variance to Budget
Total Operational Revenue (excluding tariffs) 9 8 8 8 0
Expenditure:
Employees 159 400 400 167 233
Repairs and Maintenance 0 10 10 0 10
Other 33 97 97 18
Total Operational Expenditure 192 507 507 185 243
Net Operational (Service) Expenditure 183 499 499 177 243

30
3.7 CEMETERIES (falls under Civils and Parks)
Financial Performance 2011/12: Cemeteries
R'000
Details
2010/11 2011/12
Actual Original Budget
Adjustment Budget
Actual Variance to Budget
Total Operational Revenue (excluding tarrifs) 85 81 81 84 3
Expenditure:
Employees 201 688 688 186 502
Repairs and Maintenance 1 3 3 0 3
Other 4 11 11 9 2
Total Operational Expenditure 206 702 702 195 507
Net Operational (Service) Expenditure 121 621 621 111 504
3.8 CHILD CARE; AGED CARE; SOCIAL PROGRAMMES
The Municipality facilitated the distribution of food parcels to the aged people and this was in line with the social programmes .This function is the competency of the District ,but our role here is that of facilitations. Many of the organisation within the Municipality are running community projects as social programmes aimed at improving the role played by the National Office towards the NGO `s which is operating within Musina boundary.

31
3.9 MUNICIPAL INFRASTRUCTURE GRANT EXPENDITURE
Municipal Infrastructure Grant (MIG)* Expenditure 2011/12 on Service backlogs
R' 000
Details
Budget Adjust- ment
Budget
Actual Variance Major conditions applied by donor
(continue below if necessary)
Budget Adjustment Budget
Infrastructure - Road transport R5600 R0.00 R5600 R5600 R0.00 Conditions Met
Roads, Pavements & Bridges
Storm water
Infrastructure - Electricity
Generation
Transmission & Reticulation
Street Lighting
Infrastructure - Water
Dams & Reservoirs
Water purification
Reticulation
Infrastructure - Sanitation
Reticulation
Sewerage purification
Infrastructure - Other
Waste Management
Transportation
Gas
Other Specify:
Sport Centre R4700 R0.0 R4700 R4700 R0.00 Conditions Met
Thusong Centre R1800 R0.0 R1800 R1800 R0.00 Conditions Met
Total R12100 R0.0 R12100 R12100 R0.00 Conditions Met

32
CHAPTER 4: LOCAL ECONOMIC DEVELOPMENT COMMENT ON LOCAL ECONOMIC DEVELOPMENT PERFORMANCE OVERALL: Musina Municipality is characterized by a relatively equal urban-rural population split with nearly half of the population in Musina Municipality residing in the urban areas centered around Musina town. Commercial activities are also almost exclusively concentrated in these areas. Opportunities therefore exist to build on the current strength of this economic node to further support the growth and expansion of businesses in this centre, thereby increasing the range of goods and services provided in Musina Municipality and ensuring that local communities do not have to travel to towns outside of the Municipality to do their shopping.
Musina Municipality and Musina town in particular also benefits from an advantageous strategic location in relation to the N1 and the Beitbridge and Pondrift border posts. This creates opportunities for this locational benefit to be exploited and marketed to potential investors, in order to attract larger enterprises. Furthermore, by capitalizing on its location and improving its transport and logistics services to ensure the reliable movement of goods and services, the Municipality can reduce transaction costs for investors.
In 2011/12 Musina municipality received major private investments developments from the private sector mainly, the development of a Chinese wholesaler with an investment injection of R600 million, the development of a coal mine by Coal of Africa with an investment of R680 million, the development of Venetia mine underground project with an investment of R10 billion, The development of Limpopo Eco-Industrial park with an initial investment of R25 million. The development of Musina to Africa Strategic Supply Hub Initiative (MUTASSHI) but the investment is not yet costed.
Due to financial constraints our municipality is not able to implement capital projects using own income and solely rely on government grants and support from the private sector. In 2011/2012 the municipality was allocated R10 million for infrastructure development and all the projects are derived from the IDP priorities namely; Madimbo sports centre, Nancefield Extension 6 sports centre and Malale community hall. The municipality was able to complete all the projects in time and the expenditure was 100%. The jobs created were 378.
The projects planned for the coming financial years as approved by MIG (Municipal Infrastructure Grant) are as follows: 12/13 Malale sports centre at R3 million, Thusong centre in Nancefield Extension 6 and 8 at R2 million, Community hall in Madimbo at R4, 6 million and a Park in Nancefield at R1,8 million. 13/14 Market in Nancefield Extension at R3 million, Market in Madimbo at R3 million, Thusong centre Nancefield Extension 7 at R2,2 million, Park in Nancefield Extension 8 at R2,7 million and renovation of sports centre in Nancefield Extension 5 at R4,5 million.

33
Economic Employment by Sector
Sector 2009/10 2010/11 2011/12
No. No. No
Agric, forestry and fishing 54% 54% 54%
Mining and quarrying 18% 18% 18%
Manufacturing 5% 5% 5%
Wholesale and retail trade 6% 6% 6%
Finance, property, etc. 4% 4% 4%
Govt, community and social services 23% 23% 23%
Infrastructure services 2% 2% 2%
Total
SOURCE: STATS SA 2001 AND COMMUNITY SURVEY 2007.
COMMENT ON LOCAL JOB OPPORTUNITIES: In 2011/12 Musina municipality received major private investments developments from the private sector mainly, the development of the Chinese wholesaler with an investment injection of R600 million, the development of a coal mine by Coal of Africa with an investment of R680 million the development of Venetia mine underground project with an investment of R10 billion, The development of Limpopo Eco-Industrial park with an initial investment of R25 million. The development of Musina To Africa Strategic Supply Hub Initiative (MUTASSHI) but the investment is not yet costed.

34
Jobs Created during 2011/12 by LED Initiatives (Excluding EPWP projects)
Total Jobs created / Top 3
initiatives
Jobs created
Jobs lost/displace
d by other initiatives
Net total jobs
created in year
Method of validating jobs created/lost
No. No. No.
Total (all initiatives)
198 0 198
300 0 300
378 0 378
Initiative A (11/12)
Initiative B (11/12)
Initiative C (11/12)
Job creation through EPWP* projects
Year
EPWP Projects
Jobs created through EPWP projects
No. No.
09/10 3 198
10/11 5 2090
11/12 3 254

35
Employees: Local Economic Development Services Job Level 2011/12
Posts Employees Vacancies (fulltime equivalents)
Vacancies (as a % of total posts)
No. No. No. % 0 - 3 1 0 0 4 - 6 1 1 1 7 - 9 4 0 4 10 - 12 0 0 0 13 - 15 0 0 0 16 - 18 0 0 0 19 - 20 0 0 0 Total 6 1 5
Financial Performance 2011/12: Local Economic Development Services R'000 Details 2011/12 000’
Original Budget
Adjustment Budget
Actual Variance to Budget
Total Operational Revenue (excluding tarrifs)
Expenditure: Employees 479 479 475 4 Repairs and Maintenance
Other 239 239 158 81 Total Operational Expenditure
718 718 633 85
Net Operational (Service) Expenditure
718 718 633 85

36
CHAPTER 5- ORGANIZATIONAL DEVELOPMENT PERFORMANCE
5. 1 HUMAN RESOURCE SERVICES Human Resource The Human Resource Division as a strategic partner in the Integrated Development and Planning (IDP) and its implementation, has managed to support all departments in implementing IDP objectives. The division, amongst other areas of support has played a role in administering staff provisioning, personnel maintenance, labour relation, training and development and organizational development during the financial year 2011/2012. Staff Provisioning In the financial year 2011/12, the Municipality started with the process to fill three very key strategic positions which were vacant for a significant period of time and it will be filled within the first quarter of the next financial year. The positions are Chief Finance Officer, Economic Development and Planning Manager and Manager Corporate Services. Organizational Structure
The Organizational Structure of the Municipality will be reviewed and adopted in 2012/13 for implementation.
SERVICE STATISTICS FOR HUMAN RESOURCE SERVICES AND ADMINISTRATION
Employees: Human Resource Services and Admin Job Level 2011/12
Posts Employees
Vacancies (fulltime equivalents)
Vacancies (as a % of total posts)
No. No. No. 0 - 3 2 2 0 4 - 6 11 3 8 7 - 9 4 2 2 10 - 12 2 1 1 13 - 15 1 1 0 16 - 18 7 7 0 19 - 20 Total 27 16 11

37
Financial Performance 2011/12: Human Resource Services R'000 Details 2011/12 000’
Original Budget
Adjustment Budget
Actual Variance to Budget
Total Operational Revenue (excluding tarrifs)
Expenditure: Employees 436 436 0 436 Repairs and Maintenance
Other 1 147 1 147 1 005 142 Total Operational Expenditure
1 583 1 583 1 005 578
Net Operational (Service) Expenditure
1 583 1 583 1 005 578
Submission of Report The Municipal Employment Equity Report was successfully submitted to the Department of Labour on the 01 October 2011. Training and Development The Municipality has managed to submit the Workplace Skills Plan (WSP) and Annual Training Report (ATR) to Local Government Sector Education Training Authority (LGSETA).
5.2 INFORMATION AND COMMUNICATION TECHNOLOGY (ICT) SERVICES Employees: ICT Services Job Level 2011/12
Posts Employees Vacancies (fulltime equivalents)
Vacancies (as a % of total posts)
No. No. No. % 0 - 3 1 1 4 - 6 1 0 1 7 - 9 10 - 12 13 - 15 16 - 18 19 - 20 Total 2 1 1 50 %

38
Financial Performance 2011/12: ICT Services R'000 Details 2011/12 000’
Original Budget
Adjustment Budget
Actual Variance to Budget
Total Operational Revenue (excluding tarrifs)
Expenditure: Employees 373 373 334 39 Repairs and Maintenance
12 12 1 11
Other 3 133 3 133 1 525 1 608 Total Operational Expenditure
3 518 3 518 1 860 1 658
Net Operational (Service) Expenditure
3 518 3 518 1 860 1 658
Variances are calculated by dividing the difference between the Actual and Original Budget by the Actual.
COMMENT ON THE PERFORMANCE OF ICT SERVICES OVERALL: A IT policy is in place, but the section is under staffed. Provision was made on the Organogram for an IT Officer to assist the Section head. It is envisioned that the position will be filled in the next financial year.

39
5.3 PROPERTY; LEGAL; RISK MANAGEMENT AND PROCUREMENT SERVICES INTRODUCTION TO PROPERTY; LEGAL; RISK MANAGEMENT AND PROCUREMENT SERVICES The Section is understaffed and as a result the target to review policies and by laws cannot always be reached.
Employees: Property; Legal; Risk Management; and Procurement Services Job Level 2011/12
Posts Employees Vacancies (fulltime equivalents)
Vacancies (as a % of total posts)
No. No. No. % 0 - 3 2 1 1 4 - 6 4 2 2 7 - 9 4 0 4 10 - 12 13 - 15 16 - 18 19 - 20 Total 10 3 7 70 %
Financial Performance 2011/12: Property; Legal; Risk Management; and Procurement Services R'000 Details 2011/12 000’
Original Budget
Adjustment Budget
Actual Variance to Budget
Total Operational Revenue (excluding tarrifs)
34 34 55 21
Expenditure: Employees 396 396 0 396 Repairs and Maintenance
1 488 1 488 171 1 317
Other 2 053 2 053 2 469 416 Total Operational Expenditure
3 937 3 937 2 640 1 297
Net Operational (Service) Expenditure
3 903 3 903 2 585
COMMENT ON THE PERFORMANCE OF PROPERTY SERVICES OVERALL: During the year under review the Municipality appointed a new Valuer. The Valuation roll for the period July 2012 to June 2017 will be implemented on 1 July 2012.

40
COMPONENT B: MANAGING THE MUNICIPAL WORKFORCE
INTRODUCTION TO MUNICIPAL WORKFORCE MANAGEMENT Note: MSA 2000 S67 requires municipalities to develop and adopt appropriate systems and procedures to ensure fair; efficient; effective; and transparent personnel administration in accordance with the Employment Equity Act 1998. During 2011 / 2012, 96 positions were filled across all sections in the Municipality. Vacant positions were prioritised in order of urgency and is filled as such.
Employees
Description
2010/11 2011/12
Employees Approved Posts
Employees Variance Variance
No. No. No. No. %
Water 63 76 76 0 0
Waste Water (Sanitation) 2 6 6 0 0
Electricity 24 41 28 13 0
Waste Management 36 36 35 1
Housing 03 04 03 1
Waste Water (Storm water Drainage) 0 0 0 0
Roads 41 41 41 0
Transport 30 30 30 0
Planning 03 14 3 11
Local Economic Development 1 6 1 5
Planning (Strategic & Regulatory) 1 3 1 2
Corporate Services (HR) 4 9 4 5
Corporate Services (Admin & Secretariat) 9 21 15 6
Corporate Services (Legal) 2 3 1 2
Corporate Services (ICT) 1 3 1 2
Community Services (Traffic) 16 41 15 26 Community Services (Licensing and Testing
Services) 7 17 5 12
Community Services (Housing) 2 5 2 3
Community Services (Library) 2 8 1 7 Totals 247 364 268 95

41
Number and Period of Suspensions Position Nature of Alleged
Misconduct Date of Suspension
Details of Disciplinary Action taken or Status of Case and Reasons why not Finalised
Date Finalised
Municipal Manager
14/12/2011 None, resigned before disciplinary case started
Resignation 9 September 2012
COMMENT ON SUSPENSIONS AND CASES OF FINANCIAL MISCONDUCT: The Municipal Manager was suspended for alleged ???????. Mr Luruli resigned on 9 September 2012 before a misconduct hearing could be conducted.

42
5.5 CAPACITATING THE MUNICIPAL WORKFORCE Musina Local Municipality has Internal and External Study donations available every year for which employees can apply. Preference is given to Municipal related courses.
SKILLS DEVELOPMENT AND RELATED EXPENDITURE AND ON THE FINANCIAL COMPETENCY REGULATIONS: Budget: External Study Donations:
Budget: (Internal Funding) R50 000.00 Actual R98 500.00
Private Funding R108 000.00
Internal Staff Training:
Budget: R460 000.00 Actual R970 646.00
Total Expenditure: 1 177 146.00
LGSETA Reimbursement: R222 899.79
We intend to increase the budget in the next financial year. On minimum competency, we are placing four Senior Managers on for this financial year and we will put our Accountants with the next intake as we have applied for an extension. We have exceeded our budget by far. This amount excludes accommodation.
Name of Program
Service Provider Beneficiaries Number of
Beneficiaries Gender
CPMD WBS Officials 2 Males
MFMP University of Pretoria Officials 6 Males
Advanced Certificate on
Municipal Governance
UJ Official 1 Male
SDF Training ATS Official 1 Male LLF Skills
Development Training
SALGA 2 Councillors 9 Officials 11 3 Female
8 Males
Examiner Refresher Course
Mangenu Traffic College Official 1 Male
CPLD WBS Officials 2 1 Male 1 Female
Quality Water Management
SNH Business Seminars Official 1 Female

43
Name of Program
Service Provider Beneficiaries Number of
Beneficiaries Gender
Supply Chain Bid Committee
Training
Provincial Treasury Official 1 Male
IDP Leanership Training
Vulindlela Academy Official 1 Male
CFMP University of Pretoria Officials 3 Males
Expenditure Training Fujitsu Officials 3 Males
E Natis Training TASIMA Officials 4 3 Males 1 Female
Payroll Practical Workshop
Payday Official 1 Female
HR Training Payday Officials 2 Females Bonitas Training Bonitas Officials 3 2 Females
1 Male Record
Management IMASA Official 3 1 Female 2 Males
Conveyancing Practice
Centre for Coveyancing
Practice Official 1 Male
Asset Management
Pro-Active College Official 1 Female
AARTO Training Limpopo Traffic College Officials 18 9 Males
9 Females AARTO Training TCS Training Officials 1 Male
LGAAC CPMD Officials 2 1 Female 1 Male
LGAC CPMD Officials 5 1 Male 4 Female
Promis Training Fujitsu Officials 2 Males Financial Services Training
Fujitsu Officials 5 4 Females 1 Male
DTI PRR Workshop
Provincial Treasury Official 2 1 Male
1 Female Payroll Tax Workshop
RROUX & Associates Officials 2 1 Male
1 Female Assets
Accounting IMFO Official 1 Male
VAT Master Class
Katleho Fela Consulting Official 2 1 Male
1 Female IDP Leanership
Training CoGHSTA Official 1 Male
I T Legislation ASTROTECH Official 1 Male
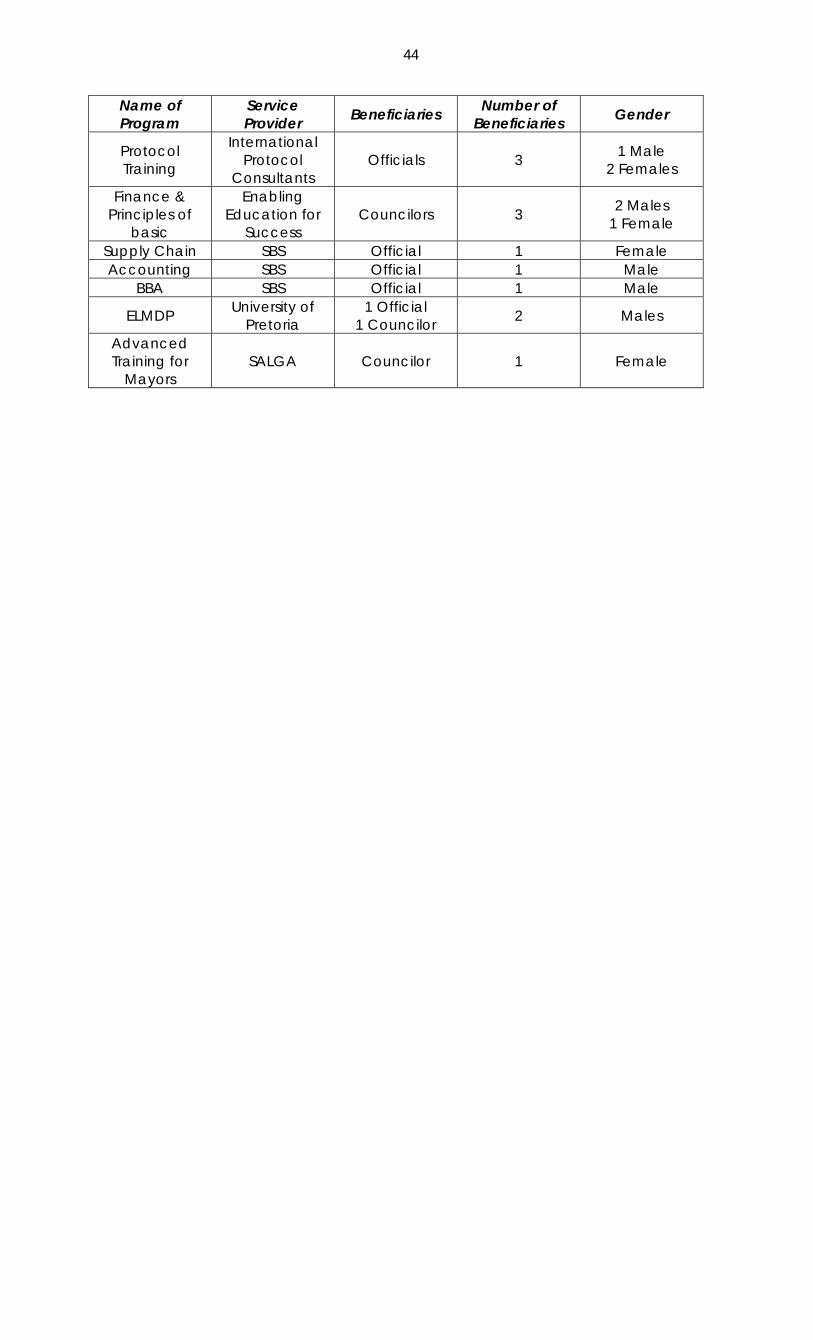
44
Name of Program
Service Provider Beneficiaries Number of
Beneficiaries Gender
Protocol Training
International Protocol
Consultants Officials 3 1 Male
2 Females
Finance & Principles of
basic
Enabling Education for
Success Councilors 3 2 Males
1 Female
Supply Chain SBS Official 1 Female Accounting SBS Official 1 Male
BBA SBS Official 1 Male
ELMDP University of Pretoria
1 Official 1 Councilor 2 Males
Advanced Training for
Mayors SALGA Councilor 1 Female

45
Name of Program
Service Provider Beneficiaries Number of
Beneficiaries Gender
Training for Mayors and Managers
SALGA Councilor 1 Female
Disaster Management DMS 1 Councilor
1 Official 2 Females
Trainer Development
Course
Junagadh University Official 1 Male