Musical Training Enhances Automatic Encoding of … · Musical Training Enhances Automatic Encoding...
12
Musical Training Enhances Automatic Encoding of Melodic Contour and Interval Structure Takako Fujioka 1,4 , Laurel J. Trainor 3 , Bernhard Ross 1,2 , Ryusuke Kakigi 4 , and Christo Pantev 1,2 Abstract & In music, melodic information is thought to be encoded in two forms, a contour code (up/down pattern of pitch changes) and an interval code (pitch distances between successive notes). A recent study recording the mismatch negativity (MMN) evoked by pitch contour and interval deviations in simple melodies demonstrated that people with no formal music education process both contour and interval informa- tion in the auditory cortex automatically. However, it is still unclear whether musical experience enhances both strategies of melodic encoding. We designed stimuli to examine contour and interval information separately. In the contour condition there were eight different standard melodies (presented on 80% of trials), each consisting of five notes all ascending in pitch, and the corresponding deviant melodies (20%) were altered to descending on their final note. The interval con- dition used one five-note standard melody transposed to eight keys from trial to trial, and on deviant trials the last note was raised by one whole tone without changing the pitch contour. There was also a control condition, in which a standard tone (990.7 Hz) and a deviant tone (1111.0 Hz) were presented. The magnetic counterpart of the MMN (MMNm) from musicians and nonmusicians was obtained as the difference between the dipole moment in response to the standard and deviant trials recorded by magnetoencephalography. Significantly larger MMNm was present in musicians in both contour and interval conditions than in nonmusicians, whereas MMNm in the control condition was similar for both groups. The interval MMNm was larger than the contour MMNm in musicians. No hemispheric difference was found in either group. The results suggest that musical training enhances the ability to automati- cally register abstract changes in the relative pitch structure of melodies. & INTRODUCTION Musical ability is an essential component of human nature and there is no known human society past or present without music (Wallin, Merker, & Brown, 2000). Across different societies, musical structure has two aspects, involving time (rhythm) and pitch (Deutsch, 1999), although the particular instantiations differ from one musical system to another. From a perceptual point of view, sequences of tones, or melodies, have two aspects, a contour and an interval code (Dowling, 1978, 1982). The contour representation consists of informa- tion about the up and down pattern of pitch changes, regardless of their exact size, and is common to both speech prosody and musical melody (Patel, Peretz, Tramo, & Labreque, 1998). The interval representation consists of the exact ratio of pitch between successive tones and is specific to music, forming the basis from which scales and harmony can emerge. Behavioral stud- ies have provided evidence that contour is more funda- mental than interval in that both infants and musically untrained adults are able to process contour informa- tion but have difficulties encoding the intervals of unfa- miliar melodies (Trehub, Trainor, & Unyk, 1993; Bartlett & Dowling, 1980; Dowling, 1978; Cuddy & Cohen, 1976). The pitch intervals of unfamiliar melodies are better perceived by trained than untrained musicians (Trainor, Desjardins, & Rockel, 1999; Peretz & Babaı ¨, 1992). How is melodic information processed, stored, and retrieved in the brain, and what is the effect of musical training? Several behavioral studies support the idea that plastic changes in the brain caused by years of training enable superior musical perception and performance. For example, it has been reported that musicians show a left hemispheric dominance in recognizing melodic sequences while nonmusicians show a right hemi- spheric dominance (Bever & Chiarello, 1974). As well, musicians demonstrate better performance in the left hemisphere than the right hemisphere when they are asked to recognize a part of a melodic sequence (Peretz & Babaı ¨, 1992). Recent neuroimaging investigations have begun to identify brain structures relevant for music processing (e.g., Tillmann, Janata, & Bharucha, 2003; Janata et al., 1 The Rotman Research Institute, Baycrest Centre for Geriatric Care, 2 University of Mu ¨nster, 3 McMaster University, 4 National Institute for Physiological Sciences D 2004 Massachusetts Institute of Technology Journal of Cognitive Neuroscience 16:6, pp. 1010–1021
Transcript of Musical Training Enhances Automatic Encoding of … · Musical Training Enhances Automatic Encoding...
Musical Training Enhances Automatic Encodingof Melodic Contour and Interval Structure
Takako Fujioka1,4, Laurel J. Trainor3, Bernhard Ross1,2,Ryusuke Kakigi4, and Christo Pantev1,2
Abstract
& In music, melodic information is thought to be encoded intwo forms, a contour code (up/down pattern of pitch changes)and an interval code (pitch distances between successivenotes). A recent study recording the mismatch negativity(MMN) evoked by pitch contour and interval deviations insimple melodies demonstrated that people with no formalmusic education process both contour and interval informa-tion in the auditory cortex automatically. However, it is stillunclear whether musical experience enhances both strategiesof melodic encoding. We designed stimuli to examine contourand interval information separately. In the contour conditionthere were eight different standard melodies (presented on80% of trials), each consisting of five notes all ascending inpitch, and the corresponding deviant melodies (20%) werealtered to descending on their final note. The interval con-dition used one five-note standard melody transposed to eight
keys from trial to trial, and on deviant trials the last note wasraised by one whole tone without changing the pitch contour.There was also a control condition, in which a standard tone(990.7 Hz) and a deviant tone (1111.0 Hz) were presented. Themagnetic counterpart of the MMN (MMNm) from musiciansand nonmusicians was obtained as the difference between thedipole moment in response to the standard and deviant trialsrecorded by magnetoencephalography. Significantly largerMMNm was present in musicians in both contour and intervalconditions than in nonmusicians, whereas MMNm in thecontrol condition was similar for both groups. The intervalMMNm was larger than the contour MMNm in musicians. Nohemispheric difference was found in either group. The resultssuggest that musical training enhances the ability to automati-cally register abstract changes in the relative pitch structure ofmelodies. &
INTRODUCTION
Musical ability is an essential component of humannature and there is no known human society past orpresent without music (Wallin, Merker, & Brown, 2000).Across different societies, musical structure has twoaspects, involving time (rhythm) and pitch (Deutsch,1999), although the particular instantiations differ fromone musical system to another. From a perceptual pointof view, sequences of tones, or melodies, have twoaspects, a contour and an interval code (Dowling, 1978,1982). The contour representation consists of informa-tion about the up and down pattern of pitch changes,regardless of their exact size, and is common to bothspeech prosody and musical melody (Patel, Peretz,Tramo, & Labreque, 1998). The interval representationconsists of the exact ratio of pitch between successivetones and is specific to music, forming the basis fromwhich scales and harmony can emerge. Behavioral stud-ies have provided evidence that contour is more funda-
mental than interval in that both infants and musicallyuntrained adults are able to process contour informa-tion but have difficulties encoding the intervals of unfa-miliar melodies (Trehub, Trainor, & Unyk, 1993; Bartlett& Dowling, 1980; Dowling, 1978; Cuddy & Cohen, 1976).The pitch intervals of unfamiliar melodies are betterperceived by trained than untrained musicians (Trainor,Desjardins, & Rockel, 1999; Peretz & Babaı, 1992).
How is melodic information processed, stored, andretrieved in the brain, and what is the effect of musicaltraining? Several behavioral studies support the idea thatplastic changes in the brain caused by years of trainingenable superior musical perception and performance.For example, it has been reported that musicians showa left hemispheric dominance in recognizing melodicsequences while nonmusicians show a right hemi-spheric dominance (Bever & Chiarello, 1974). As well,musicians demonstrate better performance in the lefthemisphere than the right hemisphere when they areasked to recognize a part of a melodic sequence (Peretz& Babaı, 1992).
Recent neuroimaging investigations have begun toidentify brain structures relevant for music processing(e.g., Tillmann, Janata, & Bharucha, 2003; Janata et al.,
1The Rotman Research Institute, Baycrest Centre for GeriatricCare, 2University of Munster, 3McMaster University, 4NationalInstitute for Physiological Sciences
D 2004 Massachusetts Institute of Technology Journal of Cognitive Neuroscience 16:6, pp. 1010–1021
2002; Koelsch et al., 2002; Ohnishi et al., 2001; Satoh,Takeda, Nagata, Hatazawa, & Kuzuhara, 2001; Halpern& Zatorre, 1999; Platel et al., 1997; Zatorre, Evans, &Meyer, 1994). For example, a functional magnetic reso-nance imaging (fMRI) study has shown that listening tomusic produces an enhanced activation in the planumtemporale and the left posterior dorsolateral prefrontalcortex in musicians, in comparison to pure tones (Oh-nishi et al., 2001). Long-term musical training has bothanatomical and functional consequences. For example,anatomical asymmetries in the auditory cortices of mu-sicians were reported using high-resolution MRI. Theleft planum temporale was larger than the right inskilled musicians, especially in those with absolute pitch(the ability to recognize and name the pitch of a musicaltone without reference to a comparison tone) (Schlaug,Jancke, Huang, & Steinmetz, 1995). Furthermore, thespecific anterior subregion of the corpus callosum wasfound to be larger in musicians who commenced musi-cal training before the age of seven (Schlaug, Jancke,Huang, Staiger, & Steinmetz, 1995). Functional differ-ences in musicians have also been demonstrated, mainlyin the sensorimotor and in the auditory systems. Violin-ists practice rapid independent movement of the fingersof their left hand on the fingerboard of their instrumentevery day for many years. Somatosensory-evoked mag-netic fields reveal the results of this experience in largercortical representations of the left-hand fingers of musi-cians in comparison to either the right-hand fingers ofmusicians or the fingers of control subjects who neverplayed a violin (Elbert, Pantev, Wienbruch, Rockstroh, &Taub, 1995). In contrast, behavioral and functional MRIstudies on pianists (Jancke, Shah, & Peters, 2000; Jancke,Schlaug, & Steinmetz, 1997) have found less asymmet-rical activity in the motor cortices of musicians than inthose of control subjects, since keyboard performancerequires similar motor control skills for both hands.Furthermore, transcranial magnetic stimulation (TMS)data demonstrated that bimanual motor activities inkeyboard musicians were less inhibited than in normalsubjects (Ridding, Brouwer, & Nordstrom, 2000), as ispredicted from the observation of an enlarged corpuscallosum in musicians (Schlaug, Jancke, Huang, Staiger,et al., 1995). Musicians and nonmusicians also differ intheir evoked responses from auditory cortex. A magne-toencephalography (MEG) study reveals that musiciansshow larger amplitude auditory evoked N1m responses(peaking at about 100 msec after stimulus onset) forpiano sounds (Pantev et al., 1998) and an electroen-cephalography (EEG) study reveals that they showlarger P2 and N1c responses (Shahin, Bosnyak, Trainor,& Roberts, 2003). Furthermore, the effect of N1m en-hancement is specific to the instrument of training(Pantev, Roberts, Schulz, Engelien, & Ross, 2001). Eventrelated potential (ERP) studies have also demonstrateddifferences between musicians and nonmusicians inlater processing that is likely outside primary or second-
ary sensory areas. Besson, Faıta, & Requin (1994) andTrainor et al. (1999) report enhanced late positive wavesbetween 300 and 600 msec. Relations between function-al and anatomical measures are also emerging. Schneideret al. (2002) combined structural information from MRIand functional information from MEG to reveal a corre-lation between Heschl’s gyrus enlargement and en-hanced evoked magnetic field response in the latencyof 19–30 msec in musicians. In summary, the comparisonof brain responses between skilled musicians and naivesubjects can give us new insights into brain plasticityassociated with musical training.
The ability to encode an acoustical context is reflectedelectrophysiologically in the mismatch negativity (MMN)component of ERPs. The MMN and its magnetic coun-terpart, the MMNm, are elicited within about 100 to200 msec after any discriminable change that occurs in-frequently in a repeatedly presented auditory stimuli,even when the stimulus is not attended (Picton et al.,2000; Naatanen & Picton, 1987; Naatanen, 1992). TheMMN reflects processing in neural memory traces bywhich the auditory cortex handles representations ofthe recent acoustic past and its repetitive aspects. Thesources of the MMN have been located mainly in thesupratemporal plane (Alho, 1995) by dipole modeling(Scherg, Vajsar, & Picton, 1989) and scalp current den-sity (SCD) maps obtained from EEG (Giard, Perrin,Pernier, & Bouchet, 1990) and MEG (Levanen, Ahonen,Hari, McEvoy, & Sams, 1996). The contribution of fron-tal generators of MMN has been also suggested not onlyby SCD (Giard et al., 1990) but also by lesion studies(Alain, Woods, & Knight, 1998; Alho, Woods, Algazi,Knight, & Naatanen, 1994). MMN is elicited not onlyfor changes in single acoustic features, but also for morecomplex and abstract features. Recent studies show thatMMN can be obtained even by changes in an auditorypattern (Alain, Cortese, & Picton, 1999; Alain, Woods, &Ogawa, 1994) and a change from ascending to descend-ing tone pairs (Saarinen, Paavilainen, Schroger, Terva-niemi, & Naatanen, 1992). Furthermore, MMN is affectedby experience such as phoneme categorization in aparticular language (Phillips et al., 2000; Cheour et al.,1998; Naatanen et al., 1997). Even after a short time ofintense listening training, the increase in MMN ampli-tude parallels the increased discrimination performancewith tone frequency discrimination (Menning, Roberts,& Pantev, 2000) or with foreign phoneme categories(Menning, Imaizumi, Zwitserlood, & Pantev, 2002).These studies indicate that the conscious process of dis-crimination and the unconscious process of extractingchanges in memory traces interact and that these twoprocesses are affected by training.
The goal of the present study is to investigate therelationship between long-term musical training andautomatic melodic processing. Changes in both pitchcontour (Trainor, McDonald, & Alain, 2002; Tervaniemi,Rytkonen, Schroger, Ilmoniemi, & Naatanen, 2001; Paa-
Fujioka et al. 1011
vilainen, Jaramillo, & Naatanen, 1998; Tervaniemi, Maury,& Naatanen, 1994; Saarinen et al., 1992) and pitch in-terval (Trainor et al., 2002) can evoke MMN responsesfrom nonmusicians even when the pitch level arechanged from trial to trial. However, no study to datehas assessed musical training effects separately in con-tour and interval encoding. We investigated the MMNmresponses to contour and interval changes in bothmusicians and nonmusicians. The stimuli were designedto clearly separate contour and the interval encoding.Factors in the musical context other than contourand interval, such as out-of-key changes, familiarity ofmelody, and the range of pitch leaps, were carefullycontrolled. A control condition examining frequencydeviations to single tones was also included.
RESULTS
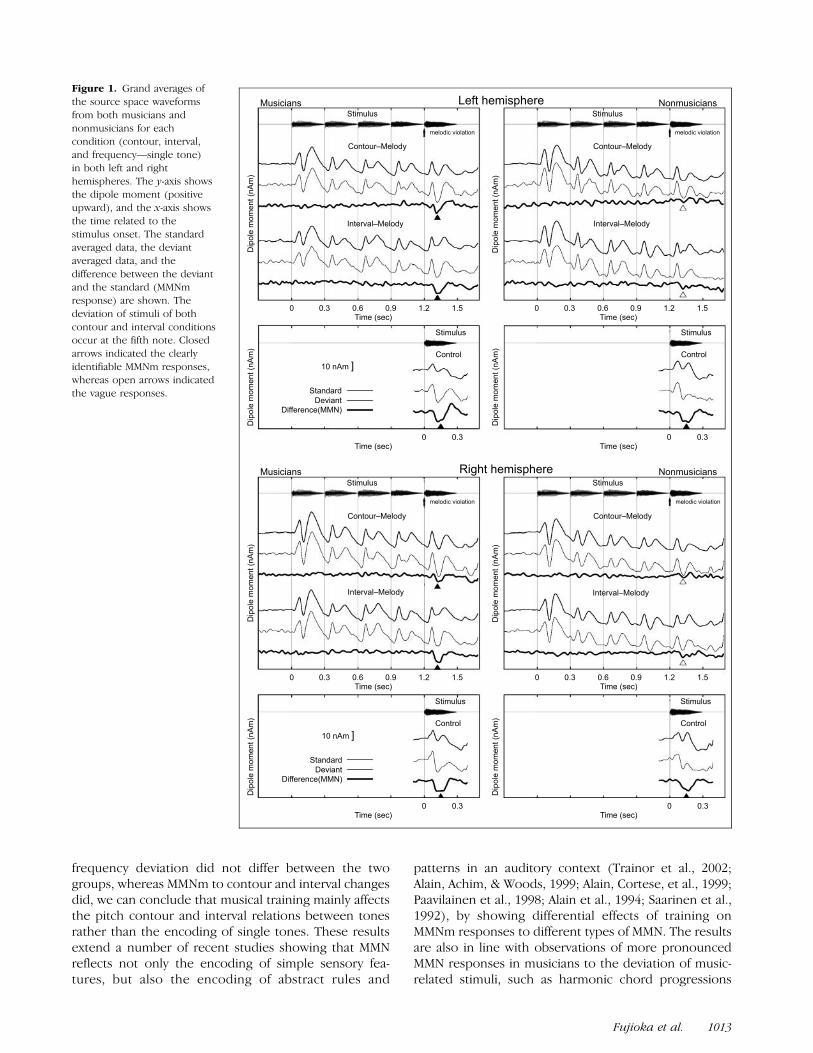
Clear auditory evoked magnetic fields (AEFs) were ob-tained from both musicians and nonmusicians in all sti-mulus conditions. The grand-averaged dipole momentwaveforms for both groups are shown in Figure 1. P1m–N1m–P2m responses from the first to the fourth notewere observed in both melodic conditions and in bothgroups. Those waveforms showed similar slow baselineshifts over the duration of the stimulus in both groups.Despite the smaller signal- to-noise ratio in the deviants(smaller number of trials) than standards, highly repro-ducible response patterns were obtained in both melodicconditions. After the onset of the fifth note, musiciansshowed clear MMNm responses in both hemispheres forboth contour and interval conditions. In contrast, non-musicians showed unclear responses in both contour andinterval conditions. In the single tone control condition,on the other hand, both groups showed clear MMNmresponses to the frequency change of the stimulus.
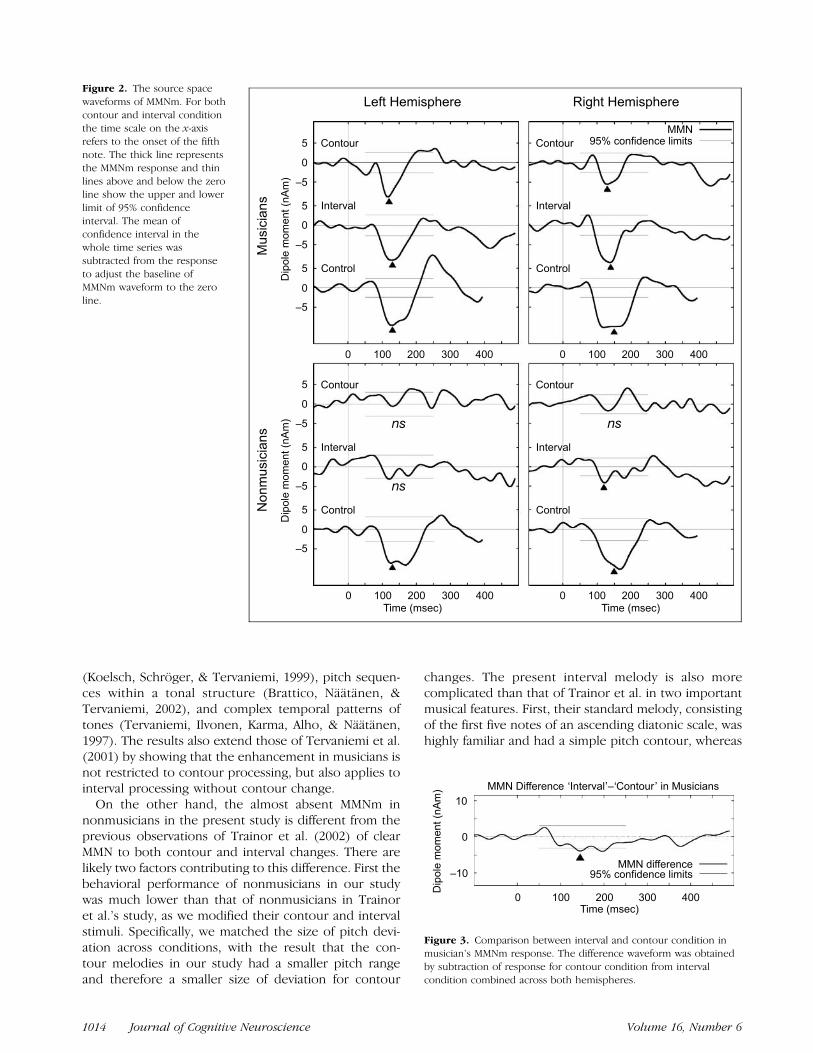
The magnified MMNm waveforms after onset of thedeviation are shown in Figure 2 with the mean of 95%confidence limits calculated using bootstrap resamplingfrom every data point (shown as horizontal lines aroundzero from 50 to 250 msec after onset of deviation). Thisallows us to identify the MMNm response significantlydifferent from zero as the parts lying outside the limits.According to the analysis, musicians showed highlysignificant MMNm responses for the deviation of melo-dies at 100 to 200 msec after onset. In contrast, theMMNm responses in nonmusicians reached significanceonly in the right hemisphere for the interval condition.For both groups, the MMN evoked by single tonefrequency deviation was highly significant between 95and 200 msec after stimulus onset.
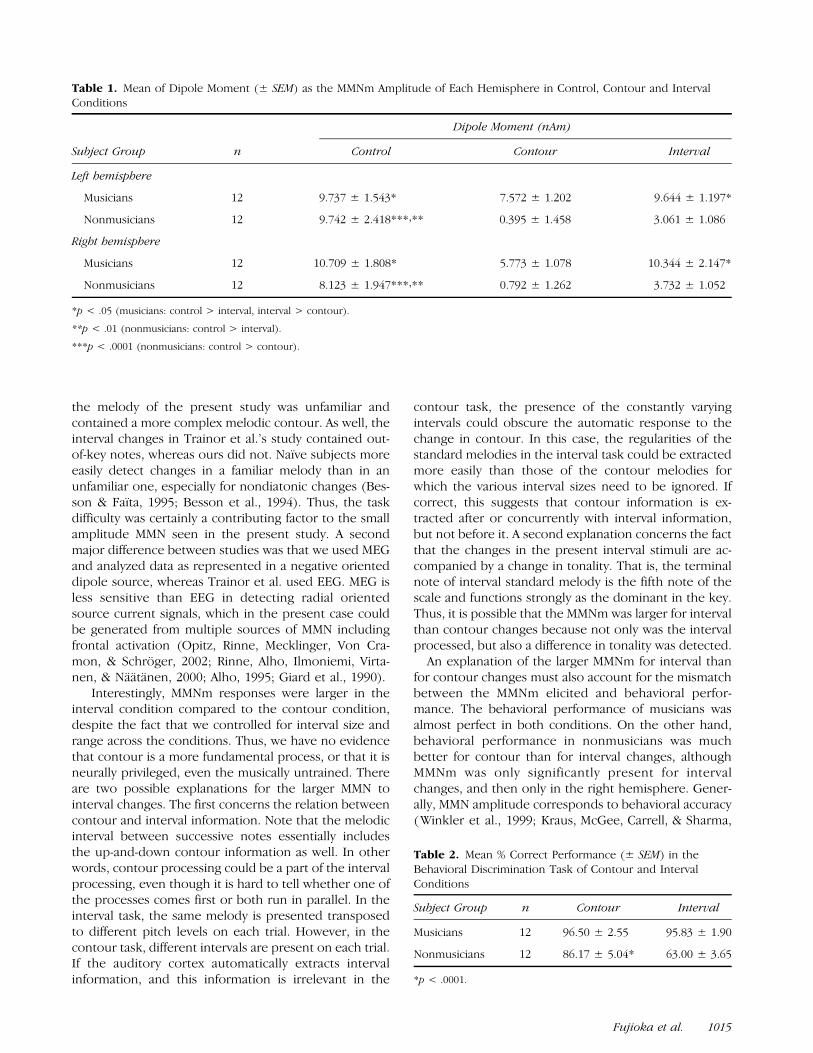
The magnitude of MMNm for the two melodic con-ditions in the musician group was compared using thesame analysis method. As shown in Figure 3, musiciansshowed significantly larger MMNm in the interval thanin the contour condition. The data in nonmusicians
was not compared, since the contour MMNm was notpresent significantly above baseline levels.
The MMNm peaks were slightly later in the intervalcondition compared to the contour condition, as dis-played in Figure 2. However, individual response var-ied widely in morphology (i.e., single or double peak).This prevented an unambiguous identification of theMMNm peak latency in single subjects, which is requiredfor statistics on the latency differences between the stim-ulus conditions.
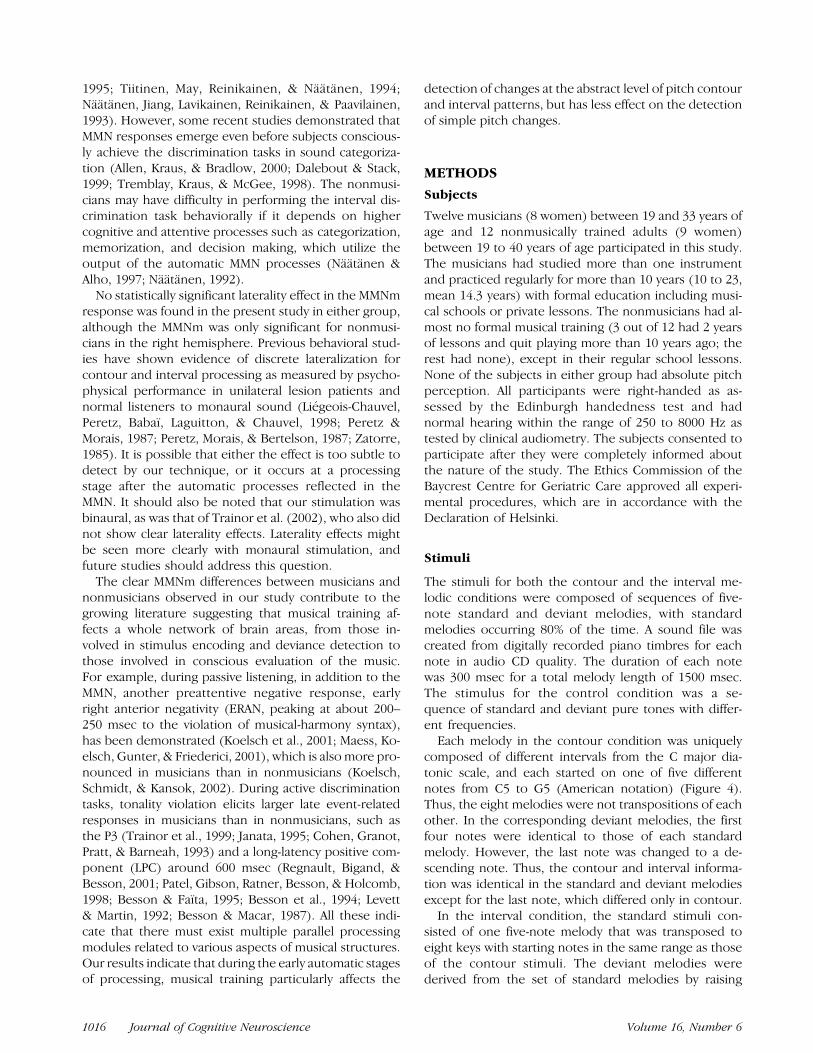
The amplitudes of MMNm calculated around the peaklatency of the grand-averaged waveforms are shown inTable 1. The MMNm was significantly larger in musiciansthan nonmusicians according to the analysis of variance(ANOVA), F(1,22) = 12.787, p < .01. MMNm was alsosignificantly different across conditions (contour, inter-val, control), F(2,44) = 16.552, p < .0001, and there wasa significant interaction between group and condition,F(2,44) = 4.02, p < .05. In musicians, the MMNm wassignificantly larger in the control and the interval than inthe contour condition ( p < .05). The larger amplitudein the interval condition compared to the contourcondition can also be seen in Figure 3. In nonmusicians,the MMNm amplitude was larger in control than bothcontour ( p< .0001) and interval conditions ( p< .01) asalso clearly seen in the waveforms depicted in Figure 2.The factor hemisphere was not significant in any con-ditions for either group, nor did hemisphere interactwith any other factors.
The results of the behavioral tests are reported inTable 2. The performance of musicians was significantlybetter than that of nonmusicians according to theANOVA, F(1,22) = 23.865, p < .0001. Musicians ex-hibited good performance in both contour (96.50%)and interval (95.83%) conditions and they did not showsignificant differences between tasks. Nonmusicians per-formed at 63.0% in the interval task, which was abovethe chance levels of 50%, t(11) = 3.564, p <.01. How-ever, their performance of 86.17% in the contour taskwas significantly better, t(11) = 5.946, p < .0001, than inthe interval task.
DISCUSSION
In the present study, musicians showed significantlylarger MMNm responses than nonmusicians to devia-tions in melodic contour and interval structure, whereasboth groups showed similar MMNm responses to fre-quency deviation in a single pure tone. As well, bothgroups tended to show larger MMNm responses tointerval than to contour changes. The results stronglysupport the hypothesis that musical experience leads tospecific changes in the neural mechanisms for process-ing of abstract, but not sensory, melodic information.The contour and interval processing must be performedat the level of melodic patterns because the overall pitchlevels shifts from trial to trial. Because MMNm for simple
1012 Journal of Cognitive Neuroscience Volume 16, Number 6
frequency deviation did not differ between the twogroups, whereas MMNm to contour and interval changesdid, we can conclude that musical training mainly affectsthe pitch contour and interval relations between tonesrather than the encoding of single tones. These resultsextend a number of recent studies showing that MMNreflects not only the encoding of simple sensory fea-tures, but also the encoding of abstract rules and
patterns in an auditory context (Trainor et al., 2002;Alain, Achim, & Woods, 1999; Alain, Cortese, et al., 1999;Paavilainen et al., 1998; Alain et al., 1994; Saarinen et al.,1992), by showing differential effects of training onMMNm responses to different types of MMN. The resultsare also in line with observations of more pronouncedMMN responses in musicians to the deviation of music-related stimuli, such as harmonic chord progressions
Figure 1. Grand averages of
the source space waveforms
from both musicians and
nonmusicians for eachcondition (contour, interval,
and frequency—single tone)
in both left and right
hemispheres. The y-axis showsthe dipole moment (positive
upward), and the x-axis shows
the time related to thestimulus onset. The standard
averaged data, the deviant
averaged data, and the
difference between the deviantand the standard (MMNm
response) are shown. The
deviation of stimuli of both
contour and interval conditionsoccur at the fifth note. Closed
arrows indicated the clearly
identifiable MMNm responses,whereas open arrows indicated
the vague responses.
Fujioka et al. 1013
(Koelsch, Schroger, & Tervaniemi, 1999), pitch sequen-ces within a tonal structure (Brattico, Naatanen, &Tervaniemi, 2002), and complex temporal patterns oftones (Tervaniemi, Ilvonen, Karma, Alho, & Naatanen,1997). The results also extend those of Tervaniemi et al.(2001) by showing that the enhancement in musicians isnot restricted to contour processing, but also applies tointerval processing without contour change.
On the other hand, the almost absent MMNm innonmusicians in the present study is different from theprevious observations of Trainor et al. (2002) of clearMMN to both contour and interval changes. There arelikely two factors contributing to this difference. First thebehavioral performance of nonmusicians in our studywas much lower than that of nonmusicians in Trainoret al.’s study, as we modified their contour and intervalstimuli. Specifically, we matched the size of pitch devi-ation across conditions, with the result that the con-tour melodies in our study had a smaller pitch rangeand therefore a smaller size of deviation for contour
changes. The present interval melody is also morecomplicated than that of Trainor et al. in two importantmusical features. First, their standard melody, consistingof the first five notes of an ascending diatonic scale, washighly familiar and had a simple pitch contour, whereas
Figure 3. Comparison between interval and contour condition inmusician’s MMNm response. The difference waveform was obtained
by subtraction of response for contour condition from interval
condition combined across both hemispheres.
Figure 2. The source space
waveforms of MMNm. For both
contour and interval condition
the time scale on the x-axisrefers to the onset of the fifth
note. The thick line represents
the MMNm response and thin
lines above and below the zeroline show the upper and lower
limit of 95% confidence
interval. The mean ofconfidence interval in the
whole time series was
subtracted from the response
to adjust the baseline ofMMNm waveform to the zero
line.
1014 Journal of Cognitive Neuroscience Volume 16, Number 6
the melody of the present study was unfamiliar andcontained a more complex melodic contour. As well, theinterval changes in Trainor et al.’s study contained out-of-key notes, whereas ours did not. Naıve subjects moreeasily detect changes in a familiar melody than in anunfamiliar one, especially for nondiatonic changes (Bes-son & Faıta, 1995; Besson et al., 1994). Thus, the taskdifficulty was certainly a contributing factor to the smallamplitude MMN seen in the present study. A secondmajor difference between studies was that we used MEGand analyzed data as represented in a negative orienteddipole source, whereas Trainor et al. used EEG. MEG isless sensitive than EEG in detecting radial orientedsource current signals, which in the present case couldbe generated from multiple sources of MMN includingfrontal activation (Opitz, Rinne, Mecklinger, Von Cra-mon, & Schroger, 2002; Rinne, Alho, Ilmoniemi, Virta-nen, & Naatanen, 2000; Alho, 1995; Giard et al., 1990).
Interestingly, MMNm responses were larger in theinterval condition compared to the contour condition,despite the fact that we controlled for interval size andrange across the conditions. Thus, we have no evidencethat contour is a more fundamental process, or that it isneurally privileged, even the musically untrained. Thereare two possible explanations for the larger MMN tointerval changes. The first concerns the relation betweencontour and interval information. Note that the melodicinterval between successive notes essentially includesthe up-and-down contour information as well. In otherwords, contour processing could be a part of the intervalprocessing, even though it is hard to tell whether one ofthe processes comes first or both run in parallel. In theinterval task, the same melody is presented transposedto different pitch levels on each trial. However, in thecontour task, different intervals are present on each trial.If the auditory cortex automatically extracts intervalinformation, and this information is irrelevant in the
contour task, the presence of the constantly varyingintervals could obscure the automatic response to thechange in contour. In this case, the regularities of thestandard melodies in the interval task could be extractedmore easily than those of the contour melodies forwhich the various interval sizes need to be ignored. Ifcorrect, this suggests that contour information is ex-tracted after or concurrently with interval information,but not before it. A second explanation concerns the factthat the changes in the present interval stimuli are ac-companied by a change in tonality. That is, the terminalnote of interval standard melody is the fifth note of thescale and functions strongly as the dominant in the key.Thus, it is possible that the MMNm was larger for intervalthan contour changes because not only was the intervalprocessed, but also a difference in tonality was detected.
An explanation of the larger MMNm for interval thanfor contour changes must also account for the mismatchbetween the MMNm elicited and behavioral perfor-mance. The behavioral performance of musicians wasalmost perfect in both conditions. On the other hand,behavioral performance in nonmusicians was muchbetter for contour than for interval changes, althoughMMNm was only significantly present for intervalchanges, and then only in the right hemisphere. Gener-ally, MMN amplitude corresponds to behavioral accuracy(Winkler et al., 1999; Kraus, McGee, Carrell, & Sharma,
Table 1. Mean of Dipole Moment (± SEM) as the MMNm Amplitude of Each Hemisphere in Control, Contour and IntervalConditions
Dipole Moment (nAm)
Subject Group n Control Contour Interval
Left hemisphere
Musicians 12 9.737 ± 1.543* 7.572 ± 1.202 9.644 ± 1.197*
Nonmusicians 12 9.742 ± 2.418***,** �0.395 ± 1.458 3.061 ± 1.086
Right hemisphere
Musicians 12 10.709 ± 1.808* 5.773 ± 1.078 10.344 ± 2.147*
Nonmusicians 12 8.123 ± 1.947***,** 0.792 ± 1.262 3.732 ± 1.052
*p < .05 (musicians: control > interval, interval > contour).
**p < .01 (nonmusicians: control > interval).
***p < .0001 (nonmusicians: control > contour).
Table 2. Mean % Correct Performance (± SEM) in theBehavioral Discrimination Task of Contour and IntervalConditions
Subject Group n Contour Interval
Musicians 12 96.50 ± 2.55 95.83 ± 1.90
Nonmusicians 12 86.17 ± 5.04* 63.00 ± 3.65
*p < .0001.
Fujioka et al. 1015
1995; Tiitinen, May, Reinikainen, & Naatanen, 1994;Naatanen, Jiang, Lavikainen, Reinikainen, & Paavilainen,1993). However, some recent studies demonstrated thatMMN responses emerge even before subjects conscious-ly achieve the discrimination tasks in sound categoriza-tion (Allen, Kraus, & Bradlow, 2000; Dalebout & Stack,1999; Tremblay, Kraus, & McGee, 1998). The nonmusi-cians may have difficulty in performing the interval dis-crimination task behaviorally if it depends on highercognitive and attentive processes such as categorization,memorization, and decision making, which utilize theoutput of the automatic MMN processes (Naatanen &Alho, 1997; Naatanen, 1992).
No statistically significant laterality effect in the MMNmresponse was found in the present study in either group,although the MMNm was only significant for nonmusi-cians in the right hemisphere. Previous behavioral stud-ies have shown evidence of discrete lateralization forcontour and interval processing as measured by psycho-physical performance in unilateral lesion patients andnormal listeners to monaural sound (Liegeois-Chauvel,Peretz, Babaı, Laguitton, & Chauvel, 1998; Peretz &Morais, 1987; Peretz, Morais, & Bertelson, 1987; Zatorre,1985). It is possible that either the effect is too subtle todetect by our technique, or it occurs at a processingstage after the automatic processes reflected in theMMN. It should also be noted that our stimulation wasbinaural, as was that of Trainor et al. (2002), who also didnot show clear laterality effects. Laterality effects mightbe seen more clearly with monaural stimulation, andfuture studies should address this question.
The clear MMNm differences between musicians andnonmusicians observed in our study contribute to thegrowing literature suggesting that musical training af-fects a whole network of brain areas, from those in-volved in stimulus encoding and deviance detection tothose involved in conscious evaluation of the music.For example, during passive listening, in addition to theMMN, another preattentive negative response, earlyright anterior negativity (ERAN, peaking at about 200–250 msec to the violation of musical-harmony syntax),has been demonstrated (Koelsch et al., 2001; Maess, Ko-elsch, Gunter, & Friederici, 2001), which is also more pro-nounced in musicians than in nonmusicians (Koelsch,Schmidt, & Kansok, 2002). During active discriminationtasks, tonality violation elicits larger late event-relatedresponses in musicians than in nonmusicians, such asthe P3 (Trainor et al., 1999; Janata, 1995; Cohen, Granot,Pratt, & Barneah, 1993) and a long-latency positive com-ponent (LPC) around 600 msec (Regnault, Bigand, &Besson, 2001; Patel, Gibson, Ratner, Besson, & Holcomb,1998; Besson & Faıta, 1995; Besson et al., 1994; Levett& Martin, 1992; Besson & Macar, 1987). All these indi-cate that there must exist multiple parallel processingmodules related to various aspects of musical structures.Our results indicate that during the early automatic stagesof processing, musical training particularly affects the
detection of changes at the abstract level of pitch contourand interval patterns, but has less effect on the detectionof simple pitch changes.
METHODS
Subjects
Twelve musicians (8 women) between 19 and 33 years ofage and 12 nonmusically trained adults (9 women)between 19 to 40 years of age participated in this study.The musicians had studied more than one instrumentand practiced regularly for more than 10 years (10 to 23,mean 14.3 years) with formal education including musi-cal schools or private lessons. The nonmusicians had al-most no formal musical training (3 out of 12 had 2 yearsof lessons and quit playing more than 10 years ago; therest had none), except in their regular school lessons.None of the subjects in either group had absolute pitchperception. All participants were right-handed as as-sessed by the Edinburgh handedness test and hadnormal hearing within the range of 250 to 8000 Hz astested by clinical audiometry. The subjects consented toparticipate after they were completely informed aboutthe nature of the study. The Ethics Commission of theBaycrest Centre for Geriatric Care approved all experi-mental procedures, which are in accordance with theDeclaration of Helsinki.
Stimuli
The stimuli for both the contour and the interval me-lodic conditions were composed of sequences of five-note standard and deviant melodies, with standardmelodies occurring 80% of the time. A sound file wascreated from digitally recorded piano timbres for eachnote in audio CD quality. The duration of each notewas 300 msec for a total melody length of 1500 msec.The stimulus for the control condition was a se-quence of standard and deviant pure tones with differ-ent frequencies.
Each melody in the contour condition was uniquelycomposed of different intervals from the C major dia-tonic scale, and each started on one of five differentnotes from C5 to G5 (American notation) (Figure 4).Thus, the eight melodies were not transpositions of eachother. In the corresponding deviant melodies, the firstfour notes were identical to those of each standardmelody. However, the last note was changed to a de-scending note. Thus, the contour and interval informa-tion was identical in the standard and deviant melodiesexcept for the last note, which differed only in contour.
In the interval condition, the standard stimuli con-sisted of one five-note melody that was transposed toeight keys with starting notes in the same range as thoseof the contour stimuli. The deviant melodies werederived from the set of standard melodies by raising
1016 Journal of Cognitive Neuroscience Volume 16, Number 6

the final note by a whole tone (1/6th of an octave), achange that remained within the key of the melody(Figure 4) and did not change the contour. The firstnotes of all contour and interval melodies were betweenC5 and G5, and the last notes were between G5 and F6.The interval size deviations in the contour melodiesranged from a minor second to a major third (1/12 to4 of an octave) and its mean value was a major secondaround the median position of termination (B5), whichwas the same value of deviation exploited in the intervalconditions.
Each melody was separated by a 900-msec silent in-terval. The experimental session consisted of 900 trialsof the contour and 900 trials of the interval condition,which were divided into successive blocks of 300 trialstaking 12 min each. The successive deviant trials wereseparated with at least two standards. In the contourcondition, the order of melody variations was pseudo-random. To avoid the appearance of the same notewithin two successive trials of the interval condition,which might be recognized as ‘‘odd’’ or ‘‘primed’’despite the interval deviation, the transposition fromtrial to trial was set to be an upward major third and adownward minor third, until the starting note becameG5. Thus, the repeating tonality change resulted in theseries ‘‘C-E-C#-F-D-F#-D#-G’’.
The control condition consisted of two succes-sive blocks of 500 pure tones of 300 msec duration,presented with an ISI of 450 msec. The frequency of the80% standard tones was 990.7 Hz (B5) and of the 20%deviant tones 1111.0 Hz (C#6). The size of the changewas a whole tone, which equals the mean size of that
used in the contour and interval conditions. The tem-poral envelopes of the tones were derived from those ofthe B5 and C#6 piano tones, respectively.
Hearing thresholds for each subject were determinedfor the left and right ears for two sounds: the B5 pianosound and the pure tone of 990.7 Hz. In all conditionsthe stimuli were presented at 60 dB above those thresh-olds (the piano thresholds were used for the contourand interval tasks, and the pure tone threshold for thecontrol condition).
MEG Recordings
The magnetic field responses were recorded with a 151-channel whole-cortex magnetometer system (OMEGA,CTF Systems Inc, Port Coquitlam, Canada). The averageintersensor spacing of this device is approximately3.1 cm. The MEG pickup coils of 2 cm in diameter areconfigured as first-order axial gradiometers with a 5-cmbaseline. The MEG signals were band-pass filtered be-tween 0.1 and 100Hz and sampled at a rate of 312.5 sec�1.In the melodic conditions, the duration of a recordingepoch was 2.2 sec including a 0.4-sec prestimulus period.In the control condition, one epoch was 0.5 sec induration including a 0.1-sec prestimulus interval. Theonset of the first note of each stimulus synchronizedthe stimulus presentation and the data acquisition aswell. For both melodic conditions three successive re-cordings, consisting of 300 trials each, were performed,resulting in 72 min total recording time. Two successiverecordings of 500 trials each were performed within15 min in the control condition.
Figure 4. Musical stimuli for
the contour (left column) and
interval (right column) tasks.
In each case, the first fournotes of the melodies form a
common sequence, which is
followed by the standard and
deviant terminal note. In thecontour case, the interval size
changes among melodies, but
the standard terminal notesalways rise, whereas the
deviant terminal notes always
fall. In the interval case, the
deviant terminal note ishigher by a whole tone than
standard terminal notes, but
the contour of the melody
does not change.
Fujioka et al. 1017

The recordings were performed in a sitting positionwithin the magnetically shielded room. The subjectswere instructed not to pay attention to the sound stimuliand to watch soundless movies of their own choice,which were projected onto a screen placed in front ofthe chair. The subject’s compliance was verified by videomonitoring. The recording session began with the con-trol condition for all subjects. For half of the participantsthe contour condition was presented first, while for theother half the interval condition was presented first. Noexplanation about the stimuli was provided.
Data Analysis
The recorded magnetic field data were averaged selec-tively for the standard and deviant stimuli and allstimulus types. In order to detect the eye-artifact con-taminated epochs, the magnetic field amplitude in achannel located just over the eyes was examined. If itexceeded 1.0 pT in the latency interval between �0.2 to1.5 sec, the data were excluded from the averaging.
The analysis technique of signal space projection(SSP) (Tesche et al., 1995) was applied to the MEG data,which combined the multichannel magnetic field datainto a single time series of magnetic dipole moment.The weighting factor of each MEG sensor contributing tothe result was the sensitivity of each sensor to a sourceat the specified location in the brain. This forms a virtualsensor, which is maximally sensitive to a source at thespecified origin and orientation and less sensitive toother sources. This results in considerable discrimina-tion against the sensor noise and uncorrelated brainactivity from distant brain regions. The SSP is a usefulmethod under the assumption of a single time-varyingsource at a fixed location. A necessary prerequisite forthe SSP is the determination of the source origin andorientation. Therefore, a source analysis using a singleequivalent current dipole (ECD) model for the N1mcomponent (latency around 100 msec after the stimulusonset) of the AEF to the first note of the melodyregardless of standard or deviant condition was donein both hemispheres for each recorded dataset. For eachsubject, the average of these dipole locations and ori-entations across all stimulus conditions served as anestimate for the source in the auditory cortex. Basedon these source coordinates the dipole moment wave-forms over the whole stimulus-related epochs werecalculated for all stimulus conditions. This methodallows the averaging of dipole moment waveforms fromrepeated measurements in the same subject or betweensubjects. Grand average dipole moment waveformsacross both groups of subjects were obtained selectivelyfor the standard and deviant stimuli. Individual differ-ence waveforms were calculated by subtracting theresponse to the standard from that to the deviantstimuli. MMNm responses were examined after theonset of the fifth note in the melodic conditions and
after the onset of the pure tone stimulus in the controlcondition. The baselines of all responses were adjustedto the mean in a 100-msec interval previous to the onsetof the deviation. The 95% confidence intervals for thegrand-averaged response waveforms and the differencewaveforms were estimated from nonparametric boot-strap resampling analysis (Davison & Hinkley, 1997).This method empirically establishes the distribution ofthe mean from repeated samples of the data itself andallows estimating confidence limits without the assump-tion of the underlying distribution. This analysis wasapplied to all data points of the difference waveformsand allowed identifying those time intervals with ampli-tudes significantly different from zero. Although thismethod allowed us to measure peak amplitudes andlatencies, signal-to-noise ratio was not sufficient to com-pare source locations across the different conditions.
In order to identify the amplitude of MMNm in theindividual data, the peak latencies of grand-averageddifference waveforms were identified in all 12 cases withdifferent parameters (two groups: musicians and non-musicians; three conditions: control, contour, and inter-val; two hemispheres). The latency interval was definedas mean of those peak latencies. The single subject’sMMNm amplitude was defined as the mean value of thewaveforms within the 40-msec time interval centered atthe mean peak latency. This procedure was necessarybecause the identification of peak latency and amplitudein the individual data was not always feasible. Theamplitudes of MMNm were statistically examined by arepeated measures ANOVA with one between-subjectsfactor (group) and two within-subjects factors (condi-tion and hemisphere). The post hoc comparison wascalculated with Fisher’s PLSD tests using the level ofsignificance as 5%.
Behavioral Test
After the MEG recordings, all subjects participated in abehavioral test consisting of two contour and intervaldiscrimination tasks. The tests were designed as twoalternative forced-choice tasks (2AFC) with two melo-dies presented sequentially on each trial. The subjectswere instructed to judge whether both melodies werethe same or different in terms of one of contour orinterval structure. One melody of each trial was chosenfrom the set of standard stimuli, whereas the othermelody was either another standard melody (same) ora deviant melody (different). The melodies were pre-sented in the same order as in the MEG recordings(randomized for the contour task, the same order in theinterval task). The same and different pairs occurredwith equal probability. The presentation of stimuli andthe recording of the subject’s responses were controlledby specially developed software on a desktop computer.The stimuli were presented at an intensity of about60 dBSL through headphones and the subjects re-
1018 Journal of Cognitive Neuroscience Volume 16, Number 6

sponded by a mouse click on buttons shown on thecomputer monitor. The silent interval between the firstand the second melody was 900 msec. The next trialstarted after the subject’s response. The subjects wereinstructed in detail about the tasks and briefly trainedby a few trials with feedback until they understood thetask correctly. In the actual testing condition no feedbackwas provided.
All behavioral data were examined statistically byrepeated measures ANOVA with one between-subjectsfactor (group: musicians vs. nonmusicians) and onewithin-subjects factor (task: contour vs. interval). Thepost hoc comparison was done with paired t tests forboth tasks.
Acknowledgments
We thank Dr. Claude Alain for helpful comments on a previousversion of the manuscript, Ms. Judy Vendramini and Ms.Haydeh Shaghaghi for technical assistance, and the studentsfrom the Faculty of Music, University of Toronto, for theirparticipation. This research has been supported by theInternational Foundation for Music Research, CA, USA.
Reprint requests should be sent to Dr. Christo Pantev, Institutefor Biomagnetism and Biosignalanalysis, Munster Univer-sity Hospital, University of Munster, Kardinal-von-Galen-Ring 10, 48129 Munster, Germany, or via e-mail: [email protected].
REFERENCES
Alain, C., Achim, A., & Woods, D. L. (1999). Separatememory-related processing for auditory frequency andpatterns. Psychophysiology, 36, 737–744.
Alain, C., Cortese, F., & Picton, T. W. (1999). Event-relatedbrain activity associated with auditory pattern processing.NeuroReport, 10, 2429–2434.
Alain, C., Woods, D. L., & Knight, R. T. (1998). A distributedcortical network for auditory sensory memory in humans.Brain Research, 812, 23–37.
Alain, C., Woods, D. L., & Ogawa, K. H. (1994). Brain indices ofautomatic pattern processing. NeuroReport, 6, 140–144.
Alho, K. (1995). Cerebral generators of mismatch negativity(MMN) and its magnetic counterpart (MMNm) elicited bysound changes. Ear and Hearing, 16, 38–51.
Alho, K., Woods, D. L., Algazi, A., Knight, R. T., & Naatanen,R. (1994). Lesions of frontal cortex diminish the auditorymismatch negativity. Electroencephalography and ClinicalNeurophysiology, 91, 353–362.
Allen, J., Kraus, N., & Bradlow, A. (2000). Neural representationof consciously imperceptible speech sound differences.Perception and Psychophysics, 62, 1383–1393.
Bartlett, J. C., & Dowling, W. J. (1980). Recognition oftransposed melodies: A key-distance effect in developmentalperspective. Journal of Experimental Psychology: HumanPerception and Performance, 6, 501–515.
Besson, M., & Faıta, F. (1995). An event-related potential (ERP)study of musical expectancy: Comparisons of musicianswith non-musicians. Journal of Experimental Psychology:Human Perception and Performance, 21, 1278–1296.
Besson, M., Faıta, F., & Requin, J. (1994). Brain wavesassociated with musical incongruities differ for musiciansand non-musicians. Neuroscience Letters, 168, 101–105.
Besson, M., & Macar, F. (1987). An event-related potentialanalysis of incongruity in music and other non-linguisticcontexts. Psychophysiology, 24, 14–25.
Bever, T. G., & Chiarello, R. J. (1974). Cerebral dominancein musicians and nonmusicians. Science, 185, 537–539.
Brattico, E., Naatanen, R., & Tervaniemi, M. (2000). Contexteffects on pitch perception in musicians and nonmusicians:Evidence from event-related-potential recordings. MusicPerception, 19, 199–222.
Cheour, M., Ceponiene, R., Lehtokoski, A., Luuk, A., Allik, J.,Alho, K., & Naatanen, R. (1998). Development oflanguage-specific phoneme representations in the infantbrain. Nature Neuroscience, 1, 351–353.
Cohen, D., Granot, R., Pratt, H., & Barneah, A. (1993).Cognitive meanings of musical elements as disclosed byevent-related potential (ERP) and verbal experiments.Music Perception, 11, 153–184.
Cuddy, L. L., & Cohen, A. J. (1976). Recognition of transposedmelodic sequences. Quarterly Journal of ExperimentalPsychology, 28, 255–270.
Dalebout, S. D., & Stack, J. W. (1991). Mismatch negativity toacoustic differences not differentiated behaviorally. Journalof the American Academy of Audiology, 10, 388–399.
Davison, A. C., & Hinkley, D. V. (1997). Bootstrap methods andtheir application. Cambridge: Cambridge University Press.
Deutsch, D. (1999). The psychology of music (2nd ed.). SanDiego: Academic Press.
Dowling, W. J. (1978). Scale and contour: Two componentsof a theory of memory for melodies. Psychological Review,85, 341–354.
Dowling, W. J. (1982). Contour in context: Comments onEdworthy. Psychomusicology, 2, 47.
Elbert, T., Pantev, C., Wienbruch, C., Rockstroh, B., & Taub,E. (1995). Increased cortical representation of the fingersof the left hand in string players. Science, 270, 305–307.
Giard, M. H., Perrin, F., Pernier, J., & Bouchet, P. (1990).Brain generators implicated in the processing of auditorystimulus deviance: A topographic event-related potentialstudy. Psychophysiology, 27, 627–640.
Halpern, A. R., & Zatorre, R. J. (1999). When that tune runsthrough your head: A PET investigation of auditory imageryfor familiar melodies. Cerebral Cortex, 9, 697–704.
Janata, P. (1995). ERP measures assay the degree of expectancyviolation of harmonic contexts in music. Journal ofCognitive Neuroscience, 7, 153–164.
Janata, P., Birk, J. L., Van Horn, J. D., Leman, M., Tillmann, B.,& Bharucha, J. J. (2002). The cortical topography of tonalstructures underlying Western music. Science, 298,2167–2170.
Jancke, L., Schlaug, G., & Steinmetz, H. (1997). Hand skillasymmetry in professional musicians. Brain and Cognition,34, 424–432.
Jancke, L., Shah, N. J., & Peters, M. (2000). Corticalactivations in primary and secondary motor areas forcomplex bimanual movements in professional pianists.Brain Research Cognitive Brain Research, 10, 177–183.
Koelsch, S., Gunter, T. C., Schroger, E., Tervaniemi, M.,Sammler, D., & Friederici, A. D. (2001). Differentiating ERANand MMN: An ERP study. NeuroReport, 12, 1385–1389.
Koelsch, S., Gunter, T. C., Von Cramon, D., Zysset, S.,Lohmann, G., & Friederici, A. D. (2002). Bach speaks: Acortical ‘‘language-network’’ serves the processing ofmusic. Neuroimage, 17, 956–966.
Koelsch, S., Schmidt, B. H., & Kansok, J. (2002). Effects ofmusical expertise on the early right anterior negativity: An
Fujioka et al. 1019
event-related brain potential study. Psychophysiology, 39,657–663.
Koelsch, S., Schroger, E., & Tervaniemi, M. (1999). Superiorpre-attentive auditory processing in musicians. NeuroReport,10, 1309–1313.
Kraus, N., McGee, T., Carrell, T. D., & Sharma, A. (1995).Neurophysiologic bases of speech discrimination. Earand Hearing, 16, 19–37.
Levanen, S., Ahonen, A., Hari, R., McEvoy, L., & Sams, M.(1996). Deviant auditory stimuli activate human left andright auditory cortex differently. Cerebral Cortex, 6,288–296.
Levett, C., & Martin, F. (1992). The relationship betweencomplex music stimuli and the late components of theevent-related potential. Psychomusicology, 11, 125–140.
Liegeois-Chauvel, C., Peretz, I., Babaı, M., Laguitton, V., &Chauvel, P. (1998). Contribution of different cortical areasin the temporal lobes to music processing. Brain, 121,1853–1867.
Maess, B., Koelsch, S., Gunter, T. C., & Friederici, A. D. (2001).Musical syntax is processed in Broca’s area: An MEG study.Nature Neuroscience, 4, 540–545.
Menning, H., Imaizumi, S., Zwitserlood, P., & Pantev, C. (2002).Plasticity of the human auditory cortex induced bydiscrimination learning of non-native, mora-timedcontrasts of the Japanese language. Learning andMemory, 9, 253–267.
Menning, H., Roberts, L. E., & Pantev, C. (2000). Plasticchanges in the auditory cortex induced by intensivefrequency discrimination training. NeuroReport, 11,817–822.
Naatanen, R. (1992). Attention and brain function. Hillsdale,NJ: Erlbaum.
Naatanen, R., & Alho, K. (1997). Mismatch negativity—Themeasure for central sound representation accuracy.Audiology Neurootology, 2, 341–353.
Naatanen, R., Jiang, D., Lavikainen, J., Reinikainen, K.,& Paavilainen, P. (1993). Event-related potentials reveala memory trace for temporal features. NeuroReport, 5,310–312.
Naatanen, R., Lehtokoski, A., Lennes, M., Cheour, M.,Huotilainen, M., Iivonen, A., Vainio, M., Alku, P., Ilmoniemi,R. J., Luuk, A., Allik, J., Sinkkonen, J., & Alho, K. (1997).Language-specific phoneme representations revealed byelectric and magnetic brain responses. Nature, 385,432–434.
Naatanen, R., & Picton, T. (1987). The N1 wave of the humanelectric and magnetic response to sound: A review and ananalysis of the component structure. Psychophysiology, 24,375–425.
Ohnishi, T., Matsuda, H., Asada, T., Aruga, M., Hirakata, M.,Nishikawa, M., Katoh, A., & Imabayashi, E. (2001). Functionalanatomy of musical perception in musicians. CerebralCortex, 11, 754–760.
Opitz, B., Rinne, T., Mecklinger, A., Von Cramon, D., &Schroger, E. (2002). Differential contribution of frontaland temporal cortices to auditory change detection: fMRIand ERP results. Neuroimage, 15, 167–174.
Paavilainen, P., Jaramillo, M., & Naatanen, R. (1998). Binauralinformation can converge in abstract memory traces.Psychophysiology, 35, 483–487.
Pantev, C., Oostenveld, R., Engelien, A., Ross, B., Roberts,L. E., & Hoke, M. (1998). Increased auditory corticalrepresentation in musicians. Nature, 392, 811–814.
Pantev, C., Roberts, L. E., Schulz, M., Engelien, A., & Ross, B.(2001). Timbre-specific enhancement of auditory corticalrepresentations in musicians. NeuroReport, 12, 169–174.
Patel, A. D., Gibson, E., Ratner, J., Besson, M., & Holcomb, P. J.
(1998). Processing syntactic relations in language and music:An event-related potential study. Journal of CognitiveNeuroscience, 10, 717–733.
Patel, A. D., Peretz, I., Tramo, M., & Labreque, R. (1998).Processing prosodic and musical patterns: Aneuropsychological investigation. Brain and Language,61, 123–144.
Peretz, I., & Babaı, M. (1992). The role of contour and intervalsin the recognition of melody parts: Evidence from cerebralasymmetries in musicians. Neuropsychologia, 30, 277–292.
Peretz, I., & Morais, J. (1987). Analytic processing in theclassification of melodies as same or different.Neuropsychologia, 25, 645–652.
Peretz, I., Morais, J., & Bertelson, P. (1987). Shifting eardifferences in melody recognition through strategyinducement. Brain and Cognition, 6, 202–215.
Phillips, C., Pellathy, T., Marantz, A., Yellin, E., Wexler, K.,Poeppel, D., McGinnis, M., & Roberts, T. (2000). Auditorycortex accesses phonological categories: An MEG mismatchstudy. Journal of Cognitive Neuroscience, 12, 1038–1055.
Picton, T. W., Alain, C., Otten, L., Ritter, W., & Achim, A. (2000).Mismatch negativity: Different water in the same river.Audiology Neurootology, 5, 111–139.
Platel, H., Price, C., Baron, J. C., Wise, R., Lambert, J.,Frackowiak, R. S., Lechevalier, B., & Eustache, F. (1997).The structural components of music perception. Afunctional anatomical study. Brain, 120, 229–243.
Regnault, P., Bigand, E., & Besson, M. (2001). Different brainmechanisms mediate sensitivity to sensory consonance andharmonic context: Evidence from auditory event-relatedbrain potentials. Journal of Cognitive Neuroscience, 13,241–255.
Ridding, M. C., Brouwer, B., & Nordstrom, M. A. (2000).Reduced interhemispheric inhibition in musicians.Experimental Brain Research, 133, 249–253.
Rinne, T., Alho, K., Ilmoniemi, M. K., Virtanen, J., & Naatanen,R. (2000). Separate time behaviors of the temporal andfrontal mismatch negativity sources. Neuroimage, 12,14–19.
Saarinen, J., Paavilainen, P., Schroger, E., Tervaniemi, M., &Naatanen, R. (1992). Representation of abstract attributesof auditory stimuli in the human brain. NeuroReport, 3,1149–1151.
Satoh, M., Takeda, K., Nagata, K., Hatazawa, J., & Kuzuhara,S. (2001). Activated brain regions in musicians during anensemble: A PET study. Brain Research Cognitive BrainResearch, 12, 101–108.
Scherg, M., Vajsar, J., & Picton, T. W. (1989). A source analysisof the late human auditory evoked potentials. Journal ofCognitive Neuroscience, 1, 336–355.
Schlaug, G., Jancke, L., Huang, Y., Staiger, J. F., & Steinmetz,H. (1995). Increased corpus callosum size in musicians.Neuropsychologia, 33, 1047–1055.
Schlaug, G., Jancke, L., Huang, Y., & Steinmetz, H. (1995). Invivo evidence of structural brain asymmetry in musicians.Science, 267, 699–701.
Schneider, P., Scherg, M., Dosch, H. G., Specht, H. J., Gutschalk,A., & Rupp, A. (2002). Morphology of Heschl’s gyrus reflectsenhanced activation in the auditory cortex of musicians.Nature Neuroscience, 5, 688–694.
Shahin, A., Bosnyak, D., Trainor, L. J., & Roberts, L. E. (2003).Enhancement of neuroplastic P2 and N1c auditory evokedpotentials in musicians. Journal of Neuroscience, 23,5545–5552.
Tervaniemi, M., Ilvonen, T., Karma, K., Alho, K., & Naatanen,R. (1997). The musical brain: Brain waves reveal theneurophysiological basis of musicality in human subjects.Neuroscience Letters, 226, 1–4.
1020 Journal of Cognitive Neuroscience Volume 16, Number 6

Tervaniemi, M., Maury, S., & Naatanen, R. (1994). Neuralrepresentations of abstract stimulus features in the humanbrain as reflected by the mismatch negativity. NeuroReport,5, 844–846.
Tervaniemi, M., Rytkonen, M., Schroger, E., Ilmoniemi, R. J.,& Naatanen, R. (2001). Superior formation of corticalmemory traces for melodic patterns in musicians. Learningand Memory, 8, 295–300.
Tesche, C. D., Uusitalo, M. A., Ilmoniemi, R. J., Huotilainen, M.,Kajola, M., & Salonen, O. (1995). Signal-space projections ofMEG data characterize both distributed and well-localizedneuronal sources. Electroencephalography and ClinicalNeurophysiology, 95, 189–200.
Tiitinen, H., May, P., Reinikainen, K., & Naatanen, R. (1994).Attentive novelty detection in humans is governed bypre-attentive sensory memory. Nature, 372, 90–92.
Tillmann, B., Janata, P., & Bharucha, J. J. (2003). Activationof the inferior frontal cortex in musical priming. BrainResearch Cognitive Brain Research, 16, 145–161.
Trainor, L. J., Desjardins, R. N., & Rockel, C. (1999). Acomparison of contour and interval processing in musiciansand nonmusicians using event-related potentials. AustralianJournal of Psychology, 51, 147–153.
Trainor, L. J., McDonald, K. L., & Alain, C. (2002). Automaticand controlled processing of melodic contour and intervalinformation measured by electrical brain activity. Journalof Cognitive Neuroscience, 14, 1–13.
Trehub, S. E., Trainor, L. J., & Unyk, A. M. (1993). Music andspeech perception in the first year of life. In H. W. Reese &L. P. Lipsitt (Eds.), Advances in child development andbehavior (Vol. 24, pp. 1–35). New York: Academic Press.
Tremblay, K., Kraus, N., & McGee, T. (1998). The time courseof auditory perceptual learning: Neurophysiological changesduring speech-sound training. NeuroReport, 9, 3557–3560.
Wallin, N. L., Merker, B., & Brown, S. (2000). The origins ofmusic. Cambridge: MIT Press.
Winkler, I., Kujala, T., Tiitinen, H., Sivonen, P., Alku, P.,Lehtokoski, A., Czigler, I., Csepe, V., Ilmoniemi, R. J., &Naatanen, R. (1999). Brain responses reveal the learning offoreign language phonemes. Psychophysiology, 36, 638–642.
Zatorre, R. J. (1985). Discrimination and recognition oftonal melodies after unilateral cerebral excisions.Neuropsychologia, 23, 31–41.
Zatorre, R. J., Evans, A. C., & Meyer, E. (1994). Neuralmechanisms underlying melodic perception and memoryfor pitch. Journal of Neuroscience, 14, 1908–1919.
Fujioka et al. 1021