Murray Waters Irrigation Supply Channels Covering the Six ... · PIRVic Project Manager, ... pome...
34
Pesticide Monitoring in Goulburn- Murray Waters Irrigation Supply Channels Covering the Six Irrigation Areas [2004 -2005 Irrigation Season Study Report : Interim Report -1] June 2005 DEPARTMENT OF DEPARTMENT OF DEPARTMENT OF DEPARTMENT OF PRIMARY INDUSTRIES PRIMARY INDUSTRIES PRIMARY INDUSTRIES PRIMARY INDUSTRIES
Transcript of Murray Waters Irrigation Supply Channels Covering the Six ... · PIRVic Project Manager, ... pome...

Pesticide Monitoring in Goulburn-
Murray Waters Irrigation Supply
Channels Covering the Six Irrigation
Areas [2004 -2005 Irrigation Season
Study Report :::: Interim Report -1]
June 2005
DEPARTMENT OF DEPARTMENT OF DEPARTMENT OF DEPARTMENT OF
PRIMARY INDUSTRIESPRIMARY INDUSTRIESPRIMARY INDUSTRIESPRIMARY INDUSTRIES

Published: Primary Industries Research Victoria
Environmental Health and Chemistry
Department of Primary Industries, Werribee
General disclaimer
DPI : This publication may be of assistance to you but the State of Victoria and its employees do not guarantee that the
publication is without flaw of any kind or is wholly appropriate for your particular purposes and therefore disclaims all
liability for any error, loss or other consequences which may arise from relying on any information in the publication’
G-MW : ‘The information in this report may be of assistance to you but the Goulburn- Murray Rural Water Authority (G-
MW) or its employees do not guarantee that the information is without flaw of any kind or is wholly appropriate for
your particular purposes and therefore disclaims all liability for any error, loss or other consequences which may arise
from relying on any information in the report’
Copyright The State of Victoria, Department of Primary Industries, 2004 and Goulburn Murray Rural Water Authority
(G-MW), Tatura, Victoria
This publication is copyright. No part may be reproduced by any process except in accordance with the provisions of the
Copyright Act 1968.
Authorised by the Victorian Government, 621 Sneydes Road, Werribee 3030
Printed by PIRVic Werribee, Victoria.

Pesticide Monitoring in Goulburn-Murray Water’s Irrigation Supply Channels Covering the Six Irrigation Areas (2004-2005 Irrigation Season Study Report)
Gavin Rose
PIRVic Project Manager, Primary Industries Research Victoria,
Werribee Centre
Golam Kibria
G-MWs Project Manager, Goulburn Murray Rural Water Authority
(G-MW), Tatura, Victoria
June 2005
Department of Primary Industries

Pesticide Monitoring in Irrigation Supply Channels
i
Citation
Rose, G and Kibria, G. (2005). Pesticide Monitoring in Goulburn-Murray Water’s Irrigation Supply
Channels covering the Six Irrigation Areas [2004-2005 Irrigation Season Study Report]. Report
Prepared under a research collaboration agreement between G-MW and PIRVic. Goulburn Murray
Rural Water Authority (G-MW), Tatura and Primary Industries Research, Vic, Werribee
Correspondence Address: Golam Kibria
Goulburn Murray Rural Water Authority
PO Box 165
Victoria
Australia 3616
Acknowledgments
The authors acknowledge the help and cooperation received from following:
G-MW : Central Goulburn Irrigation Area (Max Cail, Gary Whyte); Murray-Valley (Dave Derby,
Rob Williams); Shepparton (Mark Newton); Rochester-Campaspe (David Fehring), Torrumbarry
(Ian Hetherington); Pyramid–Boort ( David Hellsten); Goulburn Weir (Steve Hall), and EMPA2
Reference Team Members
Primary Industries Research Victoria (PIRVic Werribee-State Chemistry laboratory): Pei Zhang,
Dr Jun Du, Dr Craige Trenerry
Centre for Ecotoxicology, Department of Environment & Conservation and NSW : Dr Ross
Hyne and Melissa Aistrope
Others : Nolan-Itu (Rob Medley) and ; Ecowise-WSL (Andrew Higgins)

1. Executive Summary
During 2004-2005 irrigation seasons, a pesticide monitoring study was conducted at the 14
potential risk sites located within the six Goulburn-Murray Water irrigation areas in northern
Victoria. The risk sites included intensive orchards (pome & stone) and vineyards, vegetable
(intensive tomatoes), reference sites, channel outfall, stock & domestic and town supply, and
aquaculture. The study includes deployment and retrieval of passive samplers, spot water
sampling and analysis and interpretation of results of targeted pesticides and related heavy metals.
The monitoring found three agriculture chemicals on a regular basis across the six irrigation areas.
These are : endosulfan (an organochlorine insecticide), atrazine (herbicide) and copper (fungicide).
Endosulfan was detected at 8 of the 14 sites in passive samplers. The 8 sites where endosulfan was
found on a regular basis are Torganah, Mooroopna, Ardmona, Kyabram, Corop, West Boort,
Appin and Kangaroo lake. Atrazine was detected at 9 of the 14 sites (spot water samples);
however it was found on a regular basis only at West Boort. Copper was detected at most sites, but
at elevated levels at Torganah, Mooroopna, West Boort, Kerang Town, and Kangaroo Lakes. The
three agriculture chemicals that were frequently detected were associated with intensive orchards
(stone, pome fruit) and vineyards, vegetable (tomatoes) and pastures (legume plants).
By comparison with national water quality guidelines (ANZECC - drinking, recreational,
irrigation, ecosystems protection and aquaculture) and ecotoxicological data (mammalian, fish,
algae and daphnia, Tomlin (2000)), the water quality was found to be within the national standards
for most purposes. However, water endosulfan levels at Mooroopna, Ardmona, and Kyabram
estimated from passive sampler’s levels would have exceeded the recommended ANZECC
guidelines for the purpose of aquaculture. As there are no national guidelines for atrazine for all
purposes, Canadian Environmental Quality Standards (2003) for irrigation, and livestock and
drinking were used for comparison. The atrazine levels found were within the Canadian
Guidelines for drinking, recreation, agriculture water uses and aquatic life protection but it is
generally believed that the presence of atrazine in irrigation water may be hazardous to some
agriculture crops. Copper levels detected in irrigation channel water were found to be safe for
drinking, irrigation, and livestock. Copper exceeded the ANZECC guidelines trigger value of
1.4µg/L (95% protection of aquatic life) for slightly modified disturbed systems at all sites, except
for the two reference sites (Nagambie and Burr-amine). As there are no sample data to identify the
origin of these levels, these levels are possibly attributable to natural or agriculture sources.
It is recommended that Goulburn Murray Water (G-MW) should continue to monitor pesticides in
channels for at least another irrigation season. This will help to validate the data collected and
identify ‘hot spots’ to reduce risks from such sites.
The current report is the first of the two years monitoring results of pesticides and related heavy
metals in the six irrigation areas.

Pesticide Monitoring in Irrigation Supply Channels
v
2. Contents
1. Executive Summary.............................................................................................v
2. Contents............................................................................................................... vi
3. Background ...........................................................................................................1
4. Scope of the work ................................................................................................2
5. Objectives..............................................................................................................5
6. Study Description................................................................................................6
6.1 Pesticide monitoring strategy ..................................................................................6
6.2 Monitoring sites.......................................................................................................7
6.3 Monitoring Schedule ...............................................................................................7
6.4 Description of Relevant Methods.............................................................................8
Preparation of passive samplers .................................................................................................... 8
Deployment and retrieval of passive samplers ................................................................................
Spot sampling................................................................................................................................ 8
6.5 Analytical technique ................................................................................................9
Passive samples ............................................................................................................................. 9
Spot samples .................................................................................................................................. 9
6.6 Quality assurance
6.7 OHS Issues
7. Results..................................................................................................................10 7.1 Passive Sampler solvent samples-TRIMPS........................................................................... 11
7.2 Passive Sampler solvent samples-TRIMPS plus dodecanol:.............................................. 14
7.3 Spot Water Samples ................................................................................................................. 14
8. Discussion ...........................................................................................................19
9. Conclusion……………………………………………………………………..23

10. Recommendations .............................................................................................23
11. Glossary ...............................................................................................................24
12. References ...........................................................................................................24
13. Appendices..........................................................................................................25
Appendix I. Pesticides and their log kow values........................................................................26


Pesticide Monitoring in Irrigation Supply Channels
1
3. Background
Goulburn-Murray Water (G-MW) is the largest rural water supply authority in Australia,
supplying water for irrigation, domestic and stock drinking and town supplies. G-MW’s region
covers 68,000 square kilometres from the Great Dividing Range north to the River Murray and
from Corryong down river to Nyah near Swan hill. The bulk of water is supplied through
gravity irrigation channels (7,150 km) to dairy farms, orchards (stone, pome fruit, olive),
vineyards, crops (canola, beans, wheat, rice), tomatoes and aquaculture. These agricultural
enterprises use a range of pesticides to control pests and weeds. It is suspected that water
contaminated with pesticides can be unfit for human consumption, stock drinking, fish
farming, irrigation and food processing. It is sometimes necessary to outfall small volumes of
channel waters into natural waterways. Any pesticide contained in this outfall water could
impact on aquatic biota living in these natural waters. It is therefore essential to ascertain the
levels of chemical contaminants (pesticides and related heavy metals) in G-MW’s supply
channels to establish risk levels and ensure that appropriate measures can be taken to reduce
risks from such chemicals
A preliminary pesticide use survey (conducted in 2001 by G-MW) found that more than 75
pesticides (36 herbicides, 23 insecticides, 17 fungicides) were used in different farming sectors
across the six Irrigation Areas (Central Goulburn, Shepparton, Murray Valley, Rochester-
Campaspe, Torrumbarry, and Pyramid-Hill); see Krake et al (2001). Consequently, G-MW
engaged the Commonwealth Scientific Industrial and Research Organisation (CSIRO) to make
a first tier assessment of the risks associated with these pesticides to water quality and through
changed water quality to humans, stock, food industries, pastures, and aquaculture and aquatic
flora, fauna and aquatic ecosystems. The State Environment Protection Policy for the Waters of
Victoria (EPA, 2003) does not assign beneficial uses to "artificial irrigation channels". This
includes G-MW's irrigation channels. Whilst the policy makes clear that this should not to be
taken as authorisation of illegal contamination of such channels, it means that aquatic
ecosystems in the channels are not afforded the same level of legal protection as those in
natural waterways into which the channels sometimes outfall. Therefore it will be useful to
know the relationship between pesticide and heavy metal concentrations in the channels and
guideline reference thresholds for the protection of aquatic ecosystems, but the key
consideration will be how those concentrations in channel outfalls elevate concentrations in
receiving natural waterways and the relationship of those values to the guideline thresholds
(EPA 2003).
The risk assessment found that, 10 pesticides (out of 75 pesticides assessed) are of highest risks
to humans, stock, food industries, pastures, and aquaculture and aquatic flora, fauna and
aquatic ecosystems (see Kookana et al. 2003). The 10 pesticides that were assessed to be of
highest overall risk to all receptors were ; organophosphates ( OP), azinphos-methyl,
omethoate, parathion methyl and chlorpyrifos; fungicides (F), copper hydroxide, mancozeb
and thiram; synthetic pyrethroids (SP), esfenvalerate and bifenthrin and the carbamate (C)
methomyl. The CSIRO study recommended monitoring of 10 high risk pesticides in G-MW
irrigation channels to establish high risk sites within G-MW irrigation areas. However, both
CSIRO and DPI (State Chemistry laboratory) suggested inclusion of some medium risk
Pesticide Monitoring in Irrigation Supply Channels
2
pesticides such as endosulfan, atrazine , molinate during pesticide monitoring in channels
Accordingly, a pilot study (Central Goulburn Irrigation Area) was conducted in 2003-2004 to
trial new passive sampling techniques to monitor pesticides concentrations in G-MW channels.
The trial included the preparation of passive samplers, their deployment and retrieval of
passive samplers in channels for pesticides analysis. Spot sampling of channel waters was also
undertaken for comparison with passive samplers and for analysis of selected heavy metals.
The pilot study found that the passive sampling techniques are viable and effective techniques
for monitoring of pesticides in channels (see Rose and Kibria 2004). The pilot study model has
been extended to the channels in the six irrigation areas and will run for two irrigation seasons.
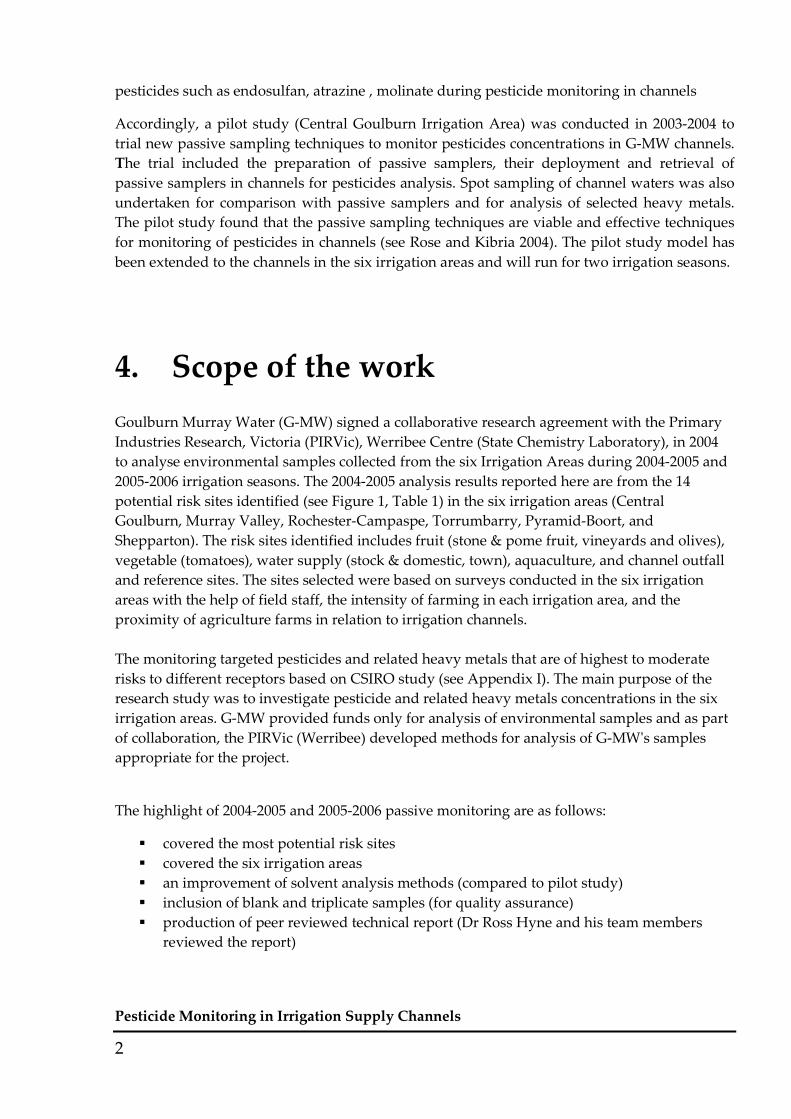
4. Scope of the work
Goulburn Murray Water (G-MW) signed a collaborative research agreement with the Primary
Industries Research, Victoria (PIRVic), Werribee Centre (State Chemistry Laboratory), in 2004
to analyse environmental samples collected from the six Irrigation Areas during 2004-2005 and
2005-2006 irrigation seasons. The 2004-2005 analysis results reported here are from the 14
potential risk sites identified (see Figure 1, Table 1) in the six irrigation areas (Central
Goulburn, Murray Valley, Rochester-Campaspe, Torrumbarry, Pyramid-Boort, and
Shepparton). The risk sites identified includes fruit (stone & pome fruit, vineyards and olives),
vegetable (tomatoes), water supply (stock & domestic, town), aquaculture, and channel outfall
and reference sites. The sites selected were based on surveys conducted in the six irrigation
areas with the help of field staff, the intensity of farming in each irrigation area, and the
proximity of agriculture farms in relation to irrigation channels.
The monitoring targeted pesticides and related heavy metals that are of highest to moderate
risks to different receptors based on CSIRO study (see Appendix I). The main purpose of the
research study was to investigate pesticide and related heavy metals concentrations in the six
irrigation areas. G-MW provided funds only for analysis of environmental samples and as part
of collaboration, the PIRVic (Werribee) developed methods for analysis of G-MW's samples
appropriate for the project.
The highlight of 2004-2005 and 2005-2006 passive monitoring are as follows:
� covered the most potential risk sites
� covered the six irrigation areas
� an improvement of solvent analysis methods (compared to pilot study)
� inclusion of blank and triplicate samples (for quality assurance)
� production of peer reviewed technical report (Dr Ross Hyne and his team members
reviewed the report)

Pesticide Monitoring in Irrigation Supply Channels
3
Reference point for
Goulburn System at SMC,
CGIA, Goulburn Weir, Nagambie
Upstream of town supply
(CGIA), Tatura, regulator
RN 385 (3/5)
Downstream of intensive
orchards, SIA, below
fingerboards regulator (12)
Reference point for Murray
System, 8 Mile regulator-
Occupational Bridge, MVIA
Downstream of intensive
orchards/upstream of outfall,
MVIA, Torganah (1)
Upstream of town supply,
Scada 8ft regulator,
Katamattie, MVIA, (7/3)
Channel outfall-Outfall to Goulburn
River (CGIA) : Ebbots regulator,
Scada 1564, Mooroopna, ( 15/6/4)
Downstream of intensive tomato
crop, (CGIA) : Wyuna West,
Kyabram, RN TN1131 minus 20/8-
TN 1132 flow (8)
Upstream of town supply,
Kerang, last regulator, of 14/2,
TIA, (14/2)
downstream of vineyard,
Ramsar lake, Kangaroo
Lake, TIA, (7)
Downstream of intensive orchards-
(CGIA) : Gaffying regulator 339,
Ardmona, (4)
downstream of intensive
tomato, vine and upstream
of town supply, Corop-
Colbinabbin, RCIA, (1)
downstream of tomato,
upstream of aquaculture
and outfall, Appin, reg
PH 1106, PBIA, (8/2)
downstream of olive,
upstream of D&S, and
town supply, Scada PH
1309, West Boort, PBIA,
(5)
Map showing pesticide passive sampling sites for the 2004-2006 irrigation
seasons. Total 14 sites including town supply, aquaculture, orchards, vine,
olive1, outfall and reference point

Pesticide Monitoring in Irrigation Supply Channels
4
Table 1: Pesticide monitoring sites in the six irrigation areas during 2004-2005 and
2005-2006 irrigation seasons
Site number & Irrigation Area
Active region
Location and GPS Prime targets Comments
1-Murray Valley
Irrigation Area
(MVIA)
Torgannah
Channel-1
MV Highway, Koonoomoo Rd,
Purgatory Lane
GPS 55-359093E, 59-76183N
Intensive orchards (stone &
pome fruit)
Upstream- intensive orchards,
pasture
Downstream- outfall to
Torgannah lagoon, hobby farm
2- MVIA Burramine
Channel-Yarrawonga Main
8 mile regulator, Occupational
bridge (Burramine Rd-MV
Highway), 20km North from
Cobram
GPS 55-394622E, 60-15073N
Reference point for Murray
system
Channel offtake
Upstream –pasture, crop
3- MVIA Katamatite
Channel 7/3
Cobram-Benall Rd, Scada 8ft
regulator (okanes regulator)
GPS 55-383996E, 60-07565N
Town supply & outfall
Upstream-pasture, crop
Downstream-outfall to Booscy
Creek-Broken creek &
town supply (water to 300
people)
4-Shepparton
Irrigation Area
(SIA)
Shepparton
Channel 12, below Fingerboards
regulator (asset number ST45682).
GPS 55-356447E, 59-77465N
Intensive Orchards (stone &
pome fruit)
Upstream-intensive orchards
Downstream-pasture,
(horticulture, crops, S&D)
5-Central
Goulburn
Irrigation Area
(CGIA)
Mooroopna
Channel 15/6/4
Ebbots regulator, Scada 1564,
GPS 55-356435E, 59-75124N
Channel outfall Upstream-channels of
Murchison, Toolamba,
Ardmona pass through
orchards, tomatoes and pastures
dairy
Downstream-outfall to
Goulburn River
6- CGIA Ardmona
Channel 4
Gaffying regulator, Regulator 339,
GPS 55-346409E, 5951889-N
Intensive orchards (stone &
pome fruit)
Upstream orchards, pasture
Downstream-pasture
7-CGIA Kyabram
Channel 8
Mercuris regulator-Regulator No
TN 1131 minus 20/8-TN 1132 flow
GPS 55-330243E, 59-85958N
Tomatoes Upstream-Tomatoes
Downstream-Pasture
8-CGIA Tatura
Channel 3/5
Regulator RN 385
GPS 55-340603E, 59-63685N
Town supply
Upstream-pasture and crop
Downstream- town supply
(supplies water to Tatura Milk,
Rosella, and Tatura residents)

Pesticide Monitoring in Irrigation Supply Channels
5
9- CGIA Nagambie
Stuart Murray Canal
Goulburn Weir
GPS 55-340603E; 59-63684N
Reference point for Goulburn
System
Channel offtake
Upstream-vineyards, tomatoes,,
pasture, crop, fish farms
10- Rochester-
Campaspe
Irrigation Area
(R-CIA)
Corop
Rochester Channel 1 (WWC),
Downstream of Bickley's Regulator,
(Regulator 100)
GPS 55-303680E; 59-72344N
Tomatoes & Vines & Town
supply
Upstream-vine & tomatoes
Downstream- town supply,
D&S, pasture supply
11-Pyramid
Boort Irrigation
Area (PBIA)
West Boort
Channel 5 (WWC), 36 mile
regulator , SCADA control (PM
regulator no PH 1309)
GPS 54-7374790E; 59-97514N
Orchards (olive) & Town
Supply
Upstream-olives
Downstream- Stock & domestic
(160), town supply
12-P-BIA Appin
Channel 8/2, regulator no IPM PH
1106 (2218/2231)
GPS 54-755344E; 60-17025N
Tomatoes & Aquaculture &
Outfall
Upstream-tomatoes, crop
(wheat, canola)
Downstream-Aquaculture
Murray Cod), outfall to Lake
Meran and Loddon River
13. Torrumbarry
Irrigation area (
TIA)
Kerang
town
Channel 14/2, regulator-last
regulator of 14/2, 1 km upstream of
Loddon-Murray Water channel
offtake
Access Rd : Collins Rd-Bendigo HW
GPS 54-750149E; 60-61599N
Town supply Upstream-pasture
Downstream-townsupply
14 TIA Kangaroo
Lake
Channel 7 (main channel to Swan
Hill)
Mystic Park Rd-MV Highway
GPS 54-750151E; 60-61600N
Vine yard
Upstream-vine, pasture
Downstream-vine, horticulture,
pasture
Downstream of Ramsar Lake
Downstream of all Kerang
Channels
5. Objectives • To monitor time integrated accumulation of pesticides in passive samplers with solvent
2,2,4 - trimethylpentane and solvent mixture 1,- dodecanol : 2,2,4 - trimethylpentane
• To monitor range and quantity of pesticides and heavy metals in spot samples with
respect to different monitoring sites for quality assurance of results obtained with
passive sampling technique
• Provide some information on pesticide usage in the study area and enhance the DPI’s
ability to sustain irrigated agricultural industries

Pesticide Monitoring in Irrigation Supply Channels
6
6. Study Description 6.1 Pesticide monitoring strategy
Routine sampling can monitor chemical contaminants in the aquatic environment. However if
concentrations are low, or vary over time and have to be measured over a long period of time,
it can be expensive and require intensive sampling. An alternative would be to use a sampling
technique that takes place in situ (directly in the environment) and can be used for longer
periods of time, and be able to accumulate substances where concentrations are low or variable.
It would also be an advantage to be able to screen the presence of a large number of substances
and operate virtually unattended. This alternative technique is known as ‘passive sampling’. In
this instance, the passive sampling technique developed (Dr Ross Hyne, Centre for
Ecotoxicology, NSW) for monitoring of pesticides in aquatic environment has been adopted,
Leonard, Hyne and Pablo (2002). The technique is limited to pesticides with log Kow >2.5, (see
Glossary).
A ‘passive sampler’ is a non-biological object capable of accumulating substances against a
concentration gradient without supply of power or energy. The passive samplers work by the
laws of diffusion and provide time-integrated concentrations of contaminants in an
environment. For common pesticides laboratory studies using spiked water solutions have
provided concentration factors curves which enable water concentrations to be predicted with
reasonable accuracy from passive sampler concentrations. There is a good relationship between
pesticides concentrations determined using trimethylpentane containing passive samplers with
those calculated from daily river-water extraction; therefore it is a good device for assessing, for
example, river–water quality. Furthermore, the membrane based passive samplers are a
promising tool for the time–integrated monitoring of hydrophobic contaminants such as
pesticides in aquatic ecosystems. The time integrated pesticide water concentrations
determined facilitate to compare with the national and international water quality guideline
values for drinking, recreation, irrigation, livestock, aquatic ecosystems protection and
aquaculture. Hyne et al. (2004), Leonard, Hyne and Pablo (2002) . However, despite the
advantages with ‘passive samplers’ they are generally limited to hydrophobic or liposoluble
substances with high Kow values. In order to monitor pesticides in G-MW supply channels
(listed in Appendix I), the following monitoring strategies were undertaken:
1. Deployment of passive samplers with solvent 2,2,4 trimethylpentane (TRIMPS)
(target for pesticides with high partition coefficient or Kow values (>3.5), mainly
organochlorine (OC) and synthetic pyrethroids (SP)
2. Deployment of passive samplers with solvent mixture 1,Dodecanol : 2,2,4
Trimethylpentane (3:2) (target for pesticides with low partition coefficient or Kow
(>2.5 but less than 3.5), and mainly herbicides (H), organophosphates (OP) and
carbamates (C)
3. Spot samples (targeted for all pesticides listed in Appendix I including OP, OC,
H, SP, C and heavy metals (Cu, Cd, Zn, Pb)
Pesticide Monitoring in Irrigation Supply Channels
7
6.2 Monitoring sites
Sampling Area : G-MWs Six Irrigation Areas including Central Goulburn, Rochester-
Campaspe, Murray-Valley, Shepparton, Torrumbarry and Pyramid-Boort
Number of pesticide monitoring sites : 14 (see Table 1, page 4)
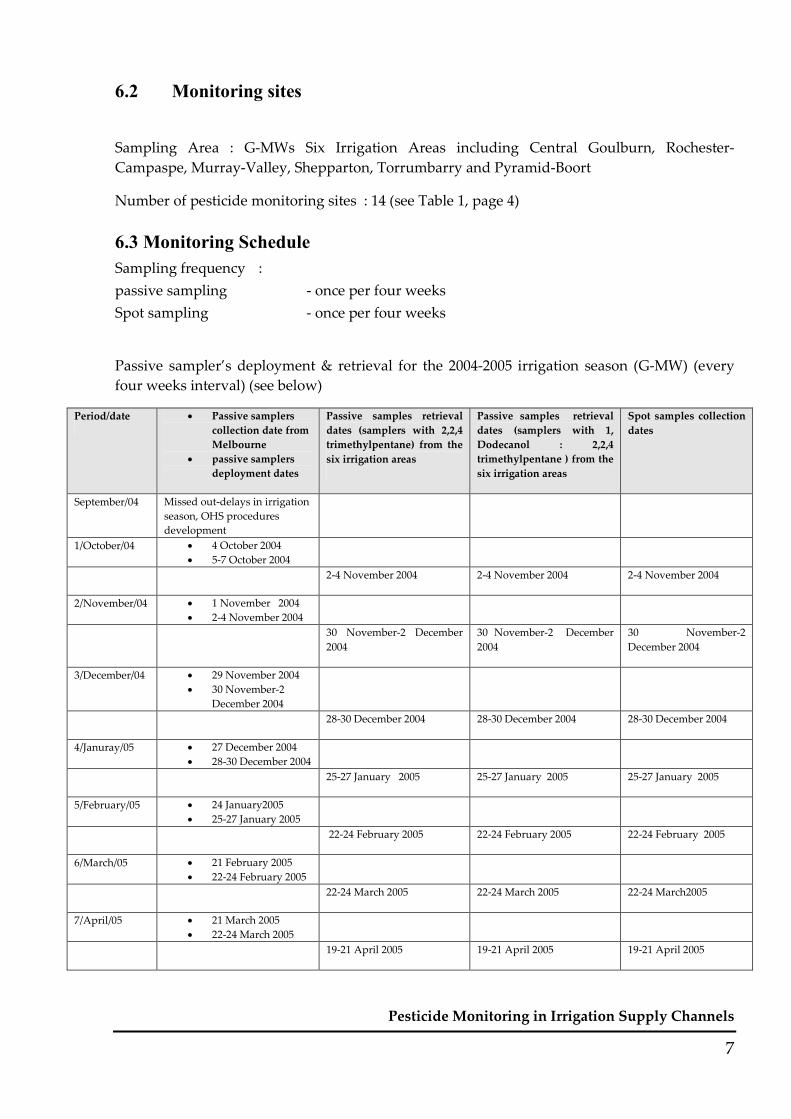
6.3 Monitoring Schedule
Sampling frequency :
passive sampling - once per four weeks
Spot sampling - once per four weeks
Passive sampler’s deployment & retrieval for the 2004-2005 irrigation season (G-MW) (every
four weeks interval) (see below)
Period/date • Passive samplers
collection date from
Melbourne
• passive samplers
deployment dates
Passive samples retrieval
dates (samplers with 2,2,4
trimethylpentane) from the
six irrigation areas
Passive samples retrieval
dates (samplers with 1,
Dodecanol : 2,2,4
trimethylpentane ) from the
six irrigation areas
Spot samples collection
dates
September/04 Missed out-delays in irrigation
season, OHS procedures
development
1/October/04 • 4 October 2004
• 5-7 October 2004
2-4 November 2004 2-4 November 2004 2-4 November 2004
2/November/04 • 1 November 2004
• 2-4 November 2004
30 November-2 December
2004
30 November-2 December
2004
30 November-2
December 2004
3/December/04 • 29 November 2004
• 30 November-2
December 2004
28-30 December 2004 28-30 December 2004 28-30 December 2004
4/Januray/05 • 27 December 2004
• 28-30 December 2004
25-27 January 2005 25-27 January 2005 25-27 January 2005
5/February/05 • 24 January2005
• 25-27 January 2005
22-24 February 2005 22-24 February 2005 22-24 February 2005
6/March/05 • 21 February 2005
• 22-24 February 2005
22-24 March 2005 22-24 March 2005 22-24 March2005
7/April/05 • 21 March 2005
• 22-24 March 2005
19-21 April 2005 19-21 April 2005 19-21 April 2005

Pesticide Monitoring in Irrigation Supply Channels
8
6.4 Duration of monitoring
For pesticides monitoring, 2004-2005 and 2005-2006 irrigation season was divided into the
following :
Initial irrigation seasons - August- September, October
Mid irrigation seasons - November, December, January
Late irrigation seasons - February, March and April
6.5 Description of Relevant Methods
Preparation of passive samplers Passive samplers were prepared at the Ecowise -WSL, Richmond Laboratory following the
occupational health and safety (OHS) procedures developed by G-MW (Kibria 2003). Two
types of passive samplers were used, one with solvent 2,2,4-trimethylpentane (TRIMPS) plus
reference material tri-n-butylphosphate (TBP) and the other with solvent mixture of 1,
dodecanol : 2,2,4-trimethylpentane (3:2) plus monolinuron Pestanal® [(N′-(4-chlorophenyl)-N-
methoxy-N-methylurea] as reference material (full details of preparation of passive samplers
are given in Kibria 2003). Addition of tributylphosphate internal standard used in TRIMPS for
sample period 1-5 was discontinued after sample period 5. This was to allow for
organophosphates residues to be determined without interference on GC from
tributylphospate (see Table 2). Addition of monolinuron internal standard used in Dodecanol +
TRIMPS for sample period 1-5 was discontinued after sample period 5. This was to allow for
pesticides residues to be determined without interference on GC from monolinuron (see Table
7).
Deployment and retrieval of passive samplers Nolan-ITU was engaged to perform deployment and retrieval of passive samplers and spot
samples. The samplers were deployed in risk sites for a period of time (28 days). After 28 days,
the passive samplers were retrieved, and the solvent from the deployed bags were collected
into a glass vial (23x46mm) and dispatched off to DPI, State Chemistry Laboratory, Werribee
for analysis via a courier.
Spot sampling Spot sampling was done once every four weeks. A grab sampler was used to collect 2L of water
(into polyethylene terphthalate (PET) bottle - gamma sterile) from each site. Spot samples were
dispatched off to DPI for analysis via a courier.

Pesticide Monitoring in Irrigation Supply Channels
9
6.6 Analytical technique
Passive samples The trimethyl pentane (TRIMPS) samples were diluted and then injected to a gas
chromatograph with a pulsed flame photometric detector (GC-PFPD) for organohosphates.
Endosulfan and synthetic pyrethroids were detected by injection onto a GC with electron
capture detection (GC-ECD). Fungicides, herbicides and carbamates were determined by
injection on GC with a nitrogen-phosphorus detector (GC-NPD). Tributyl phosphate was
determined on each sample as the sampling rate internal standard using the GC-NPD screen
test. In each case the sample injection was simultaneously screened on two capillary columns of
different stationary phase polarity, usually 5% phenyl on dimethylpolysiloxane and 50%
phenyl on dimethylpolysiloxane.
TRIMPS plus dodecanol samples were injected on a liquid chromatography-triple quadrupole
mass spectrometer (LC-MSMS) in full scan mode. Monolinuron was determined on each
sample using a photodiode array detector set at wavelength = 245 nm in series with the mass
spectrometer. Pesticides were determined using positive ion mode with electrospray interface.
The mass spectrometer was set up in multiple reaction monitoring mode with selected ion
fragmentation for each parent ion. A 2.1 mm id by 150 mm length Waters Xterra C18 reverse
phase column was used with a 10 µL injection. The mobile phase was a linear gradient starting
with 20% methanol in 5mM ammonium acetate buffer (pH = 7) with a final mixture of 90%
methanol in acetate buffer.
Spot samples A 1.0 L subsample of water was extracted with 100mL of dichloromethane (DCM), then re-
extracted twice with 50 mL of DCM. The DCM extracts are combined and dried through a
sodium sulphate column. The extract is reduced and inverted into hexane which is reduced to
1mL. The final extract is analysed with GC-PFPD (pulsed flame photometric detector) for OPs
and GC-NPD (nitrogen phosphorous detector), for carbamates and molinate, trifluralin,
pendimethalin, atrazine and chlorothalonil. Organochlorines and synthetic pyrethroids are
analysed by GC-ECD (electron capture detecto).
Taufluvalinate is extracted after sample acidification and determined on GC-ECD.
Metals were determined by sub-sampling of a representative aliquot of the sample and
acidification. Samples were then analysed by Inductively Coupled Plasma Mass Spectrometry
(ICP-MS).
6.7 Quality assurance
For each batch of passive sampler solvent a blank TRIMPs and blank TRIMPS+dodecanol
solution were retained for testing. In addition a blank of each sampler solvent was retained
immediately before the subsequent deployment to confirm the pesticide free status of the

Pesticide Monitoring in Irrigation Supply Channels
10
samplers. Each sampling involved the deployment of triplicate membrane devices. Each of the
three samplers for TRIMPS and TRIMPS+dodecanol were retrieved at the end of the sampling
period and consigned separately in vials for testing at DPI, Werribee. Two of the three solvent
samples in each case were randomly tested to determine internal standard and pesticide levels.
The triplicate sample was retained as a confirmatory and alternative quality assurance sample.
Normally two solvent samples tested and showing no residues would deem the triplicate
sample as unnecessary.
6.8 Occupational health and safety issues
A site specific risk assessment (hazard/aspect identification) was conducted, and a safe work
instructions (risk control measures) was developed for all of the 14 sampling sites

Pesticide Monitoring in Irrigation Supply Channels
11
7. Results 7.1 Passive Sampler solvent samples-TRIMPS
Fourteen site samples for seven separate sampling periods, as listed in the Table 1, were
screened for the following pesticides at the limit of reporting (LORs) stated (see Table 2). The
internal standard TBP was quantified in each sample but no correlation was found with
documented flow rates in the sampling channel.
Table 2: Pesticides sampled by passive samplers with solvent trimethylpentane and their limit of
reporting (LOR)
Pesticides LOR, (µg/L) : period 1-7 LOR, (µg/L) : period 6-7
ORGANOCHLORINE
α Endosulfan
β Endosulfan
Endosulfan sulfate
1
1
4
PYRETHROIDS
Esfenvalerate
Bifenthrin
Taufluvalinate
10
10
10
ORGANOPHOSPHATES
Phorate
Parathion methyl
Azinphos methyl
Chlorpyrifos
50
50
50
50
Passive samplers (with solvent trimethylpentane or TRIMPS) deployed at channels were able to
pick up both organochlorine (endosulfan) and synthethic pyrethroids (bifenthrin, esfenvalerate,
Taufluvalinate) pesticides. These pesticides, having a high log Kow (2.96-6.22) and
hydrophobic in nature, are expected to be sampled by TRIMPS. Period 6 & 7 included
additional pesticides as listed in Table 2. Endosulfan was detected at 8 of the 14 sites on a

Pesticide Monitoring in Irrigation Supply Channels
12
regular basis (see Table 3). Endosulfan was detected at elevated levels at 3 sites (Mooroopna,
Ardmona and Kyabram). These sites are in proximity to intensive horticultural (orchards and
tomato) industries. Endosulfan is registered for insect control on a number of crops including
pome fruit, stone fruit and vegetables.
Chlorpyrifos was detected at elevated levels at Shepparton on two occasions (60 and 37.5µg/L
respectively)
Table 3 : Total Endosulfan (concentrated) detected (µg/L) in trimethylpentane
containing passive samplers (TRIMPS) retrieved during 2004-05 irrigation season
Site Period 1 Period 2 Period 3 Period 4 Period 5 Period 6 Period
7
Comments
1.Torgannah (MV) trace trace trace trace trace trace intensive orchards
2.Burramine (MV) reference point for Murray System
3.Katamatite (MV) town supply & outfall to Booscy
Creek-Broken creek
4.Shepparton (S) intensive orchards
5.Mooroopna (CG) 41.5 4.5 trace trace trace orchards, tomatoes & pastures
outfall to Goulburn River
6.Ardmona (CG) 7 trace trace intensive orchards
7. Kyabram (CG) 3 trace 13 21 4 trace intensive tomatoes
8.Tatura (CG) town supply
9.Nagambie reference point for Goulburn
System
10.Corop (R-C) 1 trace 2 1 trace trace trace tomatoes and vines
downstream town supply
11.West Boort (P-B) trace trace trace trace trace trace intensive orchards (olive)
stock & domestic & town supply
12.Appin (P-B) trace trace trace trace trace intensive tomatoes
outfall and aquaculture,
13.Kerang town (T) town supply
14.Kangaroo Lake (T)
trace trace trace 3.5 trace trace trace viticulure, pasture, horticulture
& Ramsar Lake
Note: Total endosulfan is calculated by adding α-endosulfan, β-endosulfan and endosulfan sulfate. Trace levels are set at 50% of
the LOR for summation.
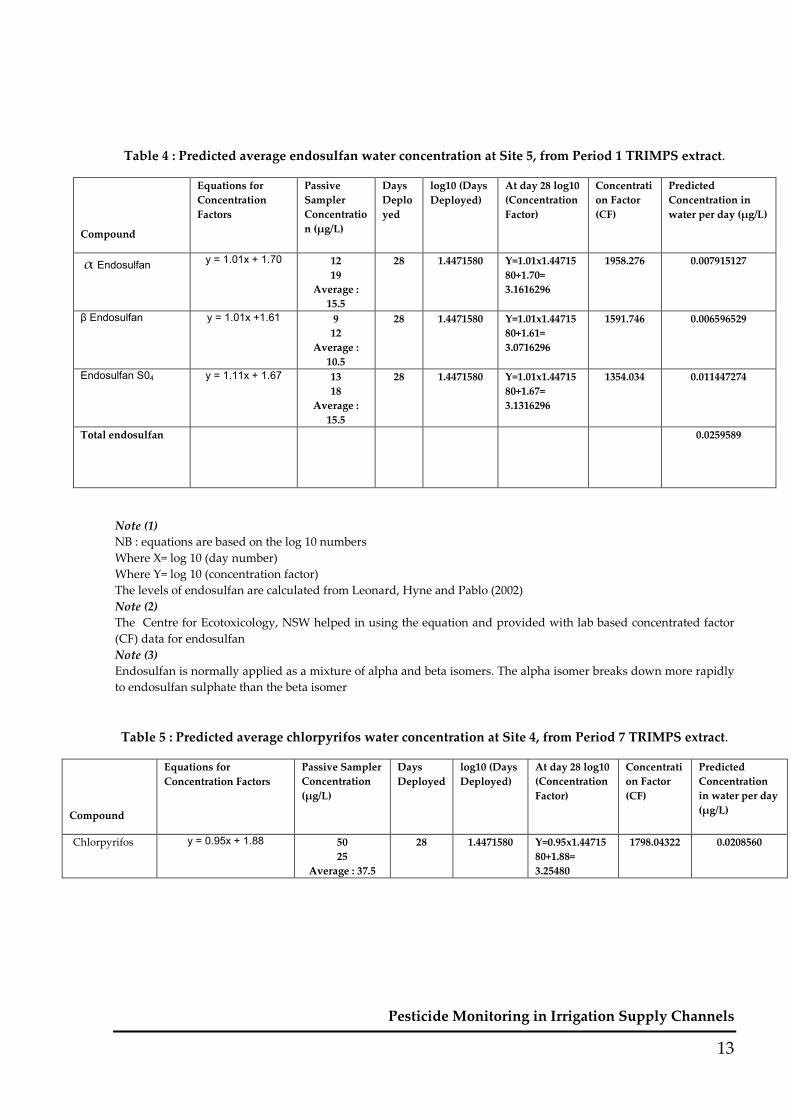
The above analysis results (Table 3) is based on concentrated endosulfan sampled in passive
samplers over a period of 28 days. This concentration was converted into time-integrated
water concentrations using the concentration factor (CF) for α Endosulfan, β Endosulfan and
Endosulfan sulfate following Leonard, Hyne and Pablo (2002). Table 4 shows an example of
calculating α-endosulfan, β-endosulfan and endosulfan sulfate and total endosulfan (for site 5,
period 1, where maximum endosulfan was detected). Table 5 shows an example of calculating
chlorpyrifos (for site 4, period 7). Table 6 provides predicted water concentrations for all of the
14 sites.
Pesticide Monitoring in Irrigation Supply Channels
13
Table 4 : Predicted average endosulfan water concentration at Site 5, from Period 1 TRIMPS extract.
Compound
Equations for
Concentration
Factors
Passive
Sampler
Concentratio
n (µg/L)
Days
Deplo
yed
log10 (Days
Deployed)
At day 28 log10
(Concentration
Factor)
Concentrati
on Factor
(CF)
Predicted
Concentration in
water per day (µg/L)
α Endosulfan y = 1.01x + 1.70 12
19
Average :
15.5
28 1.4471580 Y=1.01x1.44715
80+1.70=
3.1616296
1958.276 0.007915127
β Endosulfan y = 1.01x +1.61 9
12
Average :
10.5
28 1.4471580 Y=1.01x1.44715
80+1.61=
3.0716296
1591.746 0.006596529
Endosulfan S04 y = 1.11x + 1.67 13
18
Average :
15.5
28 1.4471580 Y=1.01x1.44715
80+1.67=
3.1316296
1354.034 0.011447274
Total endosulfan 0.0259589
Note (1)
NB : equations are based on the log 10 numbers
Where X= log 10 (day number)
Where Y= log 10 (concentration factor)
The levels of endosulfan are calculated from Leonard, Hyne and Pablo (2002)
Note (2)
The Centre for Ecotoxicology, NSW helped in using the equation and provided with lab based concentrated factor
(CF) data for endosulfan
Note (3)
Endosulfan is normally applied as a mixture of alpha and beta isomers. The alpha isomer breaks down more rapidly
to endosulfan sulphate than the beta isomer
Table 5 : Predicted average chlorpyrifos water concentration at Site 4, from Period 7 TRIMPS extract.
Compound
Equations for
Concentration Factors
Passive Sampler
Concentration
(µg/L)
Days
Deployed
log10 (Days
Deployed)
At day 28 log10
(Concentration
Factor)
Concentrati
on Factor
(CF)
Predicted
Concentration
in water per day
(µg/L)
Chlorpyrifos y = 0.95x + 1.88 50
25
Average : 37.5
28 1.4471580 Y=0.95x1.44715
80+1.88=
3.25480
1798.04322 0.0208560

Pesticide Monitoring in Irrigation Supply Channels
14
Table 6 : Predicted average endosulfan water concentration at different sites using the
regression equation and the concentration factor (based on raw data)
Site Period 1 Period 2 Period 3 Period 4 Period 5 Period 6 Period 7 Comments
1.Torgannah (MV) 0.001477 0.001477 0.001477 0.001477 0.001477 0.001477 intensive orchards
2.Burramine (MV) reference point for Murray
System
3.Katamatite (MV) town supply & outfall to
Booscy Creek-Broken creek
4.Shepparton (S) intensive orchards
5.Mooroopna (CG) 0.025959 0.003268 0.001477 0.001477 0.001477 orchards, tomatoes &
pastures
outfall to Goulburn River
6.Ardmona (CG) 0.004207 0.001477 0.002046 intensive orchards
7. Kyabram (CG) 0.002429 0.001791 0.008704 0.003284
0.012532 0.001477 intensive tomatoes
8.Tatura (CG) town supply
9.Nagambie reference point for
Goulburn System
10.Corop (R-C) 0.001732 0.001477 0.002685 0.001987 0.001477 0.001477 0.001477 tomatoes and vines
downstream town supply
11.West Boort (P-B) 0.001477 0.001477 0.001477 0.001732 0.001477 0.001477 intensive orchards (olive)
stock & domestic & town
supply
12.Appin (P-B) 0.001477 0.001477 0.001477 0.001477 0.001477 intensive tomatoes
outfall and aquaculture,
13.Kerang town (T) town supply
14.Kangaroo Lake (T)
0.001477 0.001477 0.002046 0.002585 0.001477 0.001477 0.001477 viticulure, pasture,
horticulture
& Ramsar Lake
7.2 : Passive Sampler solvent samples dodecanol and trimethylpentane or polyethylene isooctane dodecanol (PID)
Fourteen site samples for seven separate sampling periods as listed in the Table 1 were
screened for the following pesticides at the LORs stated (see Table 7). The internal standard
monolinuron was quantified in each sample but no correlation was found with the documented
flow rates

Pesticide Monitoring in Irrigation Supply Channels
15
Table 7: Pesticides sampled by passive samplers with solvent mixture dodecanol : trimethylpentane (3:2) and their limit of reporting (LOR)
Pesticides LOR, µg/L period 1-7 LOR, µg/L period 6-7
ORGANOPHOSPHATES
Azinphos methyl
Omethoate
Phorate
Parathion methyl
Chlorpyrifos
30 (period 1-5)
20 (period 1-5)
20
5
100
100
100
CARBAMATES
Methomyl
Thiodicarb
10
10
HERBICIDES
Atrazine
Molinate
10
10
SYNTHETIC PYRETHROIDS
Esfenvalerate
Bifenthrin
Taufluvalinate
50
50
50
ORGANOCHLORINE
α Endosulfan
β Endosulfan
Endosulfan sulfate
5
5
10
Pendimethalin
Chlorothalonil
300
300

Pesticide Monitoring in Irrigation Supply Channels
16
Passive samplers with dodecanol and trimethylpentane mixed solvent deployed at channels
were able to extract organophosphates (azinphos methyl, omethoate), carbamates (methomyl,
thiodicarb,) and herbicides (atrazine and molinate). These pesticides having lower Kow values
(compared to pesticides extracted by TRIMPS were expected to be picked up by this type of
sampler. No pesticides were detected at or above the stated levels. Period 6 & 7 included
additional pesticides as listed in Table 7.
7.3 Spot Water Samples
Fourteen site samples for seven separate sampling periods as listed in the Table 1 above were
screened for the following pesticides at the LORs stated (Table 8).
Table 8 : Pesticides sampled in spot samples and their limit of reporting (LOR)
Pesticides LOR, µg/L
ORGANOPHOSPHATES
Azinphos methyl
Parathion methyl
Phorate
Chlorpyrifos
Omethoate
0.02
0.02
0.02
0.01
0.03
ORGANOCHLORINE
α Endosulfan
β Endosulfan
Endosulfan sulfate
0.005-0.01
0.005-0.01
0.01-0.02
CARBAMATES
Methomyl
Thiodicarb
0.05
0.04
PYRETHROIDS
Esfenvalerate
Bifenthrin
Taufluvalinate
0.02
0.02
0.02
HERBICIDES
Molinate
Trifluralin
Pendimethalin
Atrazine
Chlorothalonil
0.05
0.1
0.05
0.01
0.1

Pesticide Monitoring in Irrigation Supply Channels
17
The spot water samples were analysed for organophophates (phorate, parathion methyl,
chlorpyriofos, omethoate, azinphos methyl), organochlorine (endosulfan), carbamates
(methomyl, thiodicarb), synthetic pyrethroids (bifenthrin, esfenvalerate, tau-fluvalinate) and
herbicides (trifluralin, pendimethlalin, atrazine and molinate) and the fungicide chlorothalonil,
Out of 18 pesticides, four pesticides (endosulfan, chlorpyrifos, parathion methyl and atrazine)
were detected above the LOR (see Table 9). Endosulfan was detected at two sites (Shepparton
and Nagambie) whereas chlorpyrifos and parathion methyl was detected at one site
(Ardmona). Atrazine was detected 9 out of 14 sites (no site showed at elevated levels).
Atrazine was found on a regular basis at Mooroopna, Nagambie, West Boort and Appin.
Table 9: Pesticides detected in spot samples during 2004-05 irrigation season (µg/L)
Site Period 1 Period 2 Period 3 Period 4 Period 5 Period 6 Period 7 Comments
1.Torgannah
(MV)
intensive orchards
2.Burramine
(MV) reference point for Murray
System
3.Katamatite
(MV) town supply & outfall to
Booscy Creek-Broken creek
4.Shepparton
(S)
Endosulfa
n (trace)
Atrazine (0.01) Atrazine
(0.020)
Atrazine
(0.020)
intensive orchards
5.Mooroopna
(CG)
Atrazine
(0.01)
Atrazine (0.01) Atrazine
(0.017)
Atrazine
(trace)
orchards, tomatoes &
pastures
outfall to Goulburn River
6.Ardmona
(CG)
Chlorpyrifos
(trace),
Parathion
methyl
(trace)
Atrazine (0.01)
Atrazine
(0.014)
Parathion
methyl
(trace)
Atrazine
(0.02)
intensive orchards
7. Kyabram
(CG)
Atrazine
(0.01)
Atrazine
(0.01)
intensive tomatoes
8.Tatura (CG) Atrazine (0.01) Atrazine
(0.018)
Atrazine
(0.02)
town supply
9.Nagambie Endosulfa
n (trace)
Atrazine (0.02 ) Atrazine
(0.01)
Atrazine
(0.019)
Atrazine
(0.02)
reference point for
Goulburn System
10.Corop (R-
C)
Atrazine
(0.011)
Atrazine
(trace)
tomatoes and vines
downstream town supply
11.West Boort
(P-B)
Atrazine)
(0.01)
Atrazine)
(0.01)
Atrazine
(0.01)
Atrazine
(0.01)
Atrazine
(0.018)
Atrazine
(0.01)
intensive orchards (olive)
stock & domestic & town
supply
12.Appin (P-B) Atrazine)
(0.02)
Atrazine
(0.01)
Atrazine
(0.012)
Atrazine
(0.02)
intensive tomatoes
outfall and aquaculture,
13.Kerang
town (T)
Atrazine
(0.01 )
town supply
14.Kangaroo
Lake (T)
vineyard
& Ramsar Lake

Pesticide Monitoring in Irrigation Supply Channels
18
Fourteen site samples for seven separate sampling periods as listed in the Table 1 above were
screened for the following heavy metals at the LORs stated (Table 10).
Table 10 : Heavy metals and their limit of reporting (LOR)
Heavy metals LOR, µg/L
Copper 0.9
Zinc 1.2
Lead 0.21
Cadmium 0.4
The spot samples were tested for levels of copper, zinc, lead and cadmium and determined at
the levels reported. Cu was detected on regular basis at elevated levels (>1.4µg/L) at
Torgannah, Mooroopna, Shepparton, West Boort, Appin, Kerang and Kangaroo Lake (Table
11). These sites are under intensive orchards and vegetables growing areas where copper is
registered for use as a fungicide.
Table 11. Copper µg/L detected in spot water samples above the LOR during 2004-05
irrigation season
Site Period
1
Period 2 Period 3 Period
4
Period 5 Period 6 Period 7 Comments
1.Torgannah (MV) 1.2 2.6 1.3 1.6 2.2 1.1 1.2 intensive orchards
2.Burramine (MV) reference point for Murray
System
3.Katamatite (MV) 1.6 1.0 town supply & outfall to
Booscy Creek-Broken creek
4.Shepparton (S) 3.6 1.1 1.6 1.3 intensive orchards
5.Mooroopna
(CG)
1.2 1.4 1.4 2.2 1.0 1.6 orchards, tomatoes &
pastures
outfall to Goulburn River
6.Ardmona (CG) 1.0 1.3 intensive orchards
7. Kyabram (CG) 1.3 1.2 1.6 1.2 1.0 1.2 1.2 intensive tomatoes
8.Tatura (CG) 1.2 1.1 1.0 town supply
9.Nagambie reference point for
Goulburn System
10.Corop (R-C) 1.4 1.4 1.2 tomatoes and vines
downstream town supply
11.West Boort (P-
B)
1.8 1.3 1.4 1.8 1.3 1.5 1.8 intensive orchards (olive)
stock & domestic & town
supply
12.Appin (P-B) 1.9 1.1 1.1 1.9 1.3 1.7 1.7 intensive tomatoes
outfall and aquaculture,
13.Kerang town
(T)
1.9 1.9 2.4 3.9 2.3 2.4 2.0 town supply
14.Kangaroo Lake
(T)
1.6 1.9 1.6 2.3 2.6 2.4 2.7 vineyard
& Ramsar Lake

Pesticide Monitoring in Irrigation Supply Channels
19
8. Discussion 8.1 :Pesticides in passive samples
The analysis of passive samplers (TRIMPS) has revealed elevated levels of endosulfan at
Mooroopna, Ardmona and Kyabram, where intensive horticulture (orchards, vineyards and
Tomato growing) is being practiced. Endosulfan is registered and available for use on a range
of horticultural crops. Endosulfan was not detected in the matching spot water sample taken at
the time solvent samples were removed from these three sites. Due to the level measured being
in a concentrated solvent sample from a semi permeable membrane device, no direct
comparison can be made with the national water quality guidelines. However, the concentrated
endosulfan levels detected were converted into water concentration (Table 12) using the
regression equation of Leonard, Hyne and Pablo (2002).
Table 12: Predicted Endosulfan Concentration in TRIMPS &
Guideline Values for Different Water Uses
Site Predicted Maximum Endosulfan
concentration in TRIMPS (µg/L)
Comments : Water Uses & Guideline Values
A= Raw Water for Drinking (40 µg/L) ;
B=Recreation (40 µg/L);
C= Protection of Aquatic Ecosystems (99% protection) (0.03
µg/L);
D=Aquaculture (<0.003 µg/L) Site 1 (MV) 0.001477, 0.001477, 0.001477, 0.001477,
0.001477
Safe for all purposes (A,B,C,D)
Upstream- Intensive orchards (stone & pome fruit)
Site 2 (Ref-Murray)
Site 3 (MV)
Site 4 (S)
Site 5 (CG) 0.025959, 0.003268, 0.001477, 0.001477,
0.001477, 0.001477
Safe for all purposes (A,B,C) except Aquaculture
Upstream- Intensive orchards, tomatoes
Site 6 (CG) 0.004207, 0.002046, 0.001477 Safe for all purposes (A,B,C) except Aquaculture
Upstream-Intensive orchards (stone & pome fruit)
Site 7 (CG) 0.012531, 0.008704, 0.003268, 0.002429,
0.001791
Safe for all purposes (A,B,C) except Aquaculture
Upstream-Intensive tomatoes
Site 8 (CG )
Site 9 (Ref -Goulburn)
Site 10 (R-C) 0.002648, 0.001987, 0.001860, 0.001477,
0.001477
Safe for all purposes (A,B,C,D)
Upstream-Vineyards and Intensive orchards
Site 11 (P-B) 0.001477, 0.001477, 0.001477 Safe for all purposes (A,B,C,D)
Upstream-Intensive orchards (Olives)
Site 12 (P-B) 0.002585, 0.001477, 0.001477, 0.001477 Safe for all purposes (A,B,C,D)
Upstream-Intensive tomatoes, crops
Site 13 (T)
Site 14 (T)
0.0020465, 0.002585, 0.001477,
0.001477, 0.001477
Safe for all purposes (A,B,C,D)
Upstream-vineyards
Note: Total endosulfan is calculated by adding α-endosulfan, β-endosulfan and endosulfan sulfate. Trace levels are set at 50% of
the LOR for summation.
1ANZECC (1996), 2ANZECC (2000)

Pesticide Monitoring in Irrigation Supply Channels
20
The predicted endosulfan concentration in water per day was then compared with the
guideline values. The estimated results showed that endosulfan concentration in water may not
have been exceeded the guideline values for the protection of either freshwater ecosystems
(95% or 99% protection), or raw water to be used for drinking water supply and recreational
uses and is of a good water quality for the above purposes (see Table 10). However, water at
some sites, such as Mooroopna (period-1,3), Ardmona (period 1), Kyabram (period 3,5), have
exceeded the guideline values of endosulfan for aquaculture (See Table 10 ). The predicted
endosulfan water concentration in Table 10 relate to the 28 day deployment. If the predicted
levels were present for only 50% of the deployment then predicted values will approximately
increase 100%. This will increase the predicted endosulfan concentration at Torganah, Corop,
West Boort, Appin and Kangaroo Lake to ANZECC ‘Aquaculture’ guideline levels.
The predicted chlorpyrifos concentrations showed that water at Shepparton was safe for
livestock and human drinking and recreational uses but have exceeded the guideline values for
aquatic eco-systems protection and aquaculture (See Table 13).
Table 13 : Predicted Chlorpyrifos concentration in TRIMPS and Guideline Values for
different Water uses
Site
Predicted maximum -
minimum chlorpyrifos conc.
in TRIMPS (µg/L) at different
sites
Comments : Water Uses & Guideline Values
A= Raw Water for Drinking (2.0 µg/L) ;
B=Recreation (2.0 µg/L);
C=Livestock ((24.0 µg/L);
D= Protection of Aquatic Ecosystems (95% protection)
(0.01 µg/L);
E=Aquaculture (<0.001 µg/L) Site 1 (MV)
Site 2 (Ref-Murray)
Site 3 (MV)
Site 4 (S)
Site 5 (CG) 0.0333696, 0.020856 Safe for all purposes (A, B) except aquatic system protection and
aquaculture
Upstream- Intensive orchards, tomatoes
Site 6 (CG)
Site 7 (CG)
Site 8 (CG )
Site 9 (Ref.-Goulburn)
Site 10 (R-C)
Site 11 (P-B)
Site 12 (P-B)
Site 13 (T) Site 14 (T)
1Canadian Environmental Quality Guidelines (2003); 2ANZECC (1996),; 3ANZECC (2000),
8.2 : Pesticides in spot water samples
The herbicide atrazine was detected at a number of sites including Shepparton, Mooroopna,
Ardmona, Kyabram, Tatura, Nagambie, West Boort, Appin, Kerang town, which could of

Pesticide Monitoring in Irrigation Supply Channels
21
concern (see Table 14). It is likely that the atrazine detected was used to control weeds in forage
legumes and orchards. The non detection of atrazine in dodecanol and trimethylpentane
samplers (PID) is not inconsistent with spot sample levels as the sampler solvent LORs are
higher.
The level detected in spot water samples was in the range of 0.01-0.02 µg/L. which is far below
the ANZECC (2000) guideline values (13 µg/L) for the protection of freshwater aquatic
ecosystems (95% protection). Since there are no ANZECC guidelines of atrazine for irrigation,
livestock and drinking water therefore Canadian Environmental Guidelines values (2003) were
used for comparison. Overall, the atrazine level detected in spot samples did not exceed the
recommended guideline values for different water uses (see table 14 below). However, it is
believed that the presence of atrazine in irrigation water may be hazardous to crops.
Table 14 : Atrazine concentration in spot water samples and guideline values for different
water uses
Site Atrazine concentration
in spot water samples
(µg/L)
Comments : Water Uses & Guideline Values
A= Raw Water for Drinking (5 µg/L) ;
B=Irrigation (10 µg/L);
C=Livestock (5 µg/L),
D= Protection of Aquatic Ecosystems (95% protection) (13
µg/L); Site 1 (MV)
Site 2 (Ref-Murray)
Site 3 (MV)
Site 4 (S) 0.01, 0.020 Safe for all purposes (A,B,C,D)
Upstream-intensive orchards (stone & pome fruit)
Site 5 (CG)
0.01, 0.01, 0.017
Safe for all purposes (A,B,C,D)
Upstream-Vineyards and Intensive orchards
Site 6 (CG)
0.01, 0.014
Safe for all purposes (A,B,C,D)
Upstream-Intensive orchards (stone & pome fruit)
Site 7 (CG)
0.01
Safe for all purposes (A,B,C,D)
Upstream-Intensive tomatoes
Site 8 (CG ) 0.01, 0.018 Safe for all purposes (A,B,C,D)
Upstream-pastures, crop
Site 9 (Ref.-Goulburn) 0.02, 0.01, 0.019 Safe for all purposes (A,B,C,D)
Upstream-vine, tomatoes, pastures, aquaculture
Site 10 (R-C) 0.01 Safe for all purposes (A,B,C,D)
Upstream-Vineyards and Intensive tomatoes
Site 11 (P-B) 0.01, 0.01, 0.01, 0.01, 0.018 Safe for all purposes (A,B,C,D)
Upstream-Intensive orchards (Olives)
Site 12 (P-B)
0.02, 0.01, 0.012
Safe for all purposes (A,B,C,D)
Upstream-Intensive tomatoes, crops
Site 13 (T)
0.01
Safe for all purposes (A,B,C,D)
Upstream-pastures
Site 14 (T)
1Canadian Environmental Quality Guidelines (2003); 2ANZECC (2000)
The detection of endosulfan and atrazine at Nagambie (reference site for Goulburn system)
may be attributed from upstream farming activities; pastures (lucerne), tomatoes, vineyards
(see table 9)

Pesticide Monitoring in Irrigation Supply Channels
22
The reporting of chlorpyrifos and parathion methyl (trace amounts) at Ardmona sampling site
(spot sample) is expected to be associated with organophosphate insecticide usage in stone fruit
orchards (see table 9). Historically, DPI residue surveys reveal parathion methyl and
chlorpyrifos applications in local stone fruit orchards.
Heavy metals in spot water samples
The heavy metals results for copper reveals that water in the 14 sites was of good quality for
most primary purposes including irrigation, livestock, drinking, and recreation (Table 15 ).
However, there were 7 sites (Torganah, Shepparton, Mooroopna, West Boort, Appin, Kerang
and Kangaroo Lake) where copper levels exceeded the recommended trigger value of 1.4µg/L
for the protection of 95% aquatic species. Those sites are under intensive horticulture and
copper use would be associated with fungal disease control in intensive orchards, vineyards
and tomatoes. A considerable number of copper fungicides are registered by the APVMA for
fungal disease control in fruit and vegetable crops. As there is no sample data to identify the
origin of these levels, these levels are possibly attributable to natural or agriculture sources. No
other heavy metals were found at elevated levels at any of the 14 sites investigated.
Table 15 : Copper concentration in spot water samples and guideline values for different
water uses
Site Copper concentration in spot
water samples (µg/L) Comments : Water Uses & Guideline Values
A= Raw Water for Drinking (1000 µg/L) ;
B=Irrigation (200 µg/L);
C=Livestock (400-5000 µg/L), D=Aquaculture (<5
µg/L) Site 1 (MV) 2.6, 2.2, 1.6, 1.3 Safe for all purposes (A,B,C,D)
Upstream-intensive orchards (stone & pome fruit), pastures
Site 2 (Ref-Murray)
Site 3 (MV) 1.6, 1.0 Safe for all purposes (A,B,C,D)
Upstream-pastures, crops
Site 4 (S) 3.6, 1.6, 1.3, 1.1 Safe for all purposes (A,B,C,D)
Upstream-intensive orchards (stone & pome fruit)
Site 5 (CG) 2.2, 1.9, 1.6, 1.4, 1.4, 1.2, 1.0 Safe for all purposes (A,B,C,D)
Upstream-Vineyards and Intensive orchards
Site 6 (CG) 1.3, 1.0 Safe for all purposes (A,B,C,D)
Upstream-Intensive orchards (stone & pome fruit)
Site 7 (CG) 1.6, 1.3, 1.2, 1.2, 1.2, 1.2, 1.0 Safe for all purposes (A,B,C,D)
Upstream-Intensive tomatoes
Site 8 (CG ) 1.2, 1.1, 1.0 Safe for all purposes (A,B,C,D)
Upstream-pastures, crop
Site 9 (Ref.-Goulburn)
Site 10 (R-C) 1.4, 1.4, 1.2 Safe for all purposes (A,B,C,D)
Upstream-Vineyards and Intensive tomatoes
Site 11 (P-B) 1.8, 1.8, 1.8, 1.5, 1.4, 1.3, 1.3 Safe for all purposes (A,B,C,D)
Upstream-Intensive orchards (Olives)
Site 12 (P-B) 1.9, 1.9, 1.7, 1.7, 1.3, 1.1, 1.1 Safe for all purposes (A,B,C,D)
Upstream-Intensive tomatoes, crops
Site 13 (T) 3.9, 2.4, 2.4, 2.4, 2.3, 1.0, 1.9, 1.9 Safe for all purposes (A,B,C,D)
Upstream-pastures
Site 14 (T)
2.7, 2.6, 2.4, 2.3, 1.9, 1.6, 1.6 Safe for all purposes (A,B,C,D)
Upstream-vineyards

Pesticide Monitoring in Irrigation Supply Channels
23
9. Conclusions Endosulfan has been detected on a regular basis in trimetylpentane solvent from passive
samplers at eight sites. These sites show associations with intensive orchards, vineyards,
tomato production and forage production. Atrazine has been detected sporadically in spot
samples at nine sites. Copper has been detected at 10 sites at elevated levels on a repeated basis.
The chosen two reference sites have been validated by reporting minimal residues (Nagambie)
or not detected (Burramine). Reported residues indicate levels below ANZECC guideline
values for drinking, recreational, freshwater ecosystems and irrigation and livestock. ANZECC
guideline values for aquaculture have been reached or exceeded for predicted endosulfan
levels at a majority of monitoring sites. ANZECC guideline values for freshwater ecosystems
for copper levels have been reached or exceeded at a majority of monitoring sites.
These findings are heavily constrained by the unavoidable absence of data from the early part
of the season before November. With that important caveat in mind, it is concluded that the
results for the first year's monitoring program do not indicate that the high and medium risk
pesticides selected are likely to render water in Goulburn-Murray Water's irrigation channels
unfit for irrigation or stock or human consumption. Similarly, adverse impacts on aquatic
ecosystems in receiving natural waterways due to concentrations of the high and medium risk
pesticides selected in channel outfalls are also unlikely.
Copper concentrations in a significant number of channels is likely to adversely impact on
aquatic ecosystems. It is not clear whether these elevated copper concentrations are sourced
from pesticides. More importantly, adverse impacts on aquatic ecosystems in receiving
natural waterways due to copper concentrations in channel outfalls are unlikely.
However, it is concluded that elevated endosulfan levels in the water in G-MW channels is
likely to render that water unfit for aquaculture at a significant number of locations.
For high risk sites identified after two years monitoring it is suggested that more intensive
sampling on a seven to fourteen day passive sampler deployment period should be considered.
10. Recommendations It is recommended that Goulburn Murray Water (G-MW) should continue to monitor
pesticides in channels for at least another irrigation season. This will help to validate the data
collected and identify ‘hot spots’ to reduce risks from such sites.

Pesticide Monitoring in Irrigation Supply Channels
24
11. Glossary Analyte; component in sample targeted for determination and quantitation.
Guideline : Numerical concentration or narrative statements recommended to support and
maintain a designated water use.
Limit of detection (LOD) : is defined as the level at which an analyte can identified but not
quantified accurately
Limit of Reporting (LOR) : is the level at which the analyte can be identified and accurately
quantified.
Kow (Octanol-water portioning coefficient) : a measurement of how a chemical is distributed at
equilibrium between octanol and water. The parameter is used in the assessment of
environmental fate and transport of organic chemicals
Hydrophobic or liphophilic : having a strong aversion for water (water hating/non-polar), fat
soluble and water insoluble (eg. DDT)
Hydrophilic : strong affinity for water (water loving) water soluble and fat insoluble (eg. Phenol)
Partitioning co-efficient : measure of the sorption phenomenon, whereby a pesticide is divided
between the soil and water phase
Organochlorine (OC) : organic compounds containing chlorine
Heavy metals : environmentally toxic metals of high atomic weight (having atomic weight
between 63.546 and 200.595)
Synthetic Pyrethroids (SP) : usually synthetic pesticides related to pyrethrum
Organophosphates (OP) : compounds based on organophosphate structure
12. References Australian and New Zealand Environment and Conservation Council (ANZECC) and
Agriculture and Resource Management Council of Australia and New Zealand (ARMCANZ),
(2000).Australian and New Zealand Guidelines for Fresh and Marine Water Quality, Volume 1,
The Guidelines(Chapters1-7).
Australian and New Zealand Environment and Conservation Council (ANZECC) (1992).
Australian Water Quality Guidelines for Fresh and Marine Water Quality. Chapter 1-4.
Canadian Environmental Quality Guidelines (2003) : Summary Table of Existing Canadian
Environmental Quality Guidelines. Environment Canada.
EPA (2003) State Environment Protection policy (Waters of Victoria)
Hyne , R.V., Pablo, F., Aistrope, M., Leonard, A. W. and Ahmad, N (2004). Comparison of time

Pesticide Monitoring in Irrigation Supply Channels
25
integrated pesticide concentrations determined from field-deployed passive samplers with
daily river-water extractions. Environmental Toxicology and Chemistry, 23 (9) : 2090-2098.
Kibria, G. (2003). Occupational and Health and Safety Procedures for Laboratory and Field
based Works for EMPA2 (pesticides and Channels Contamination).. G-MW Docs Ref 1053172v2
.22p.
Kookana, R., Barnes, M., Correll, R. and Kibria, G. (2003). First tier assessment of the risks
associated with pesticides used in Goulburn-Murray Irrigation Areas - A pesticide risk
reduction program for G-MW Channels. Report prepared under a research collaboration
agreement between G-MW & CSIRO. Goulburn-Murray Rural Water Authority (G-MW),
Tatura and CSIRO, Adelaide.103p.
Krake, K and Breewel, L. and Kibria,G. (2001). Pesticide and Channel Contamination. Pesticide
used in G-MW Irrigation Areas. G-MW Aquatic Plant Services. G-MW Docs Reference 704342.
25p.
Leonard, A W and Hyne, R V and Pablo, F. (2002). Trimethyl pentane-containing passive
samplers for predicting time-integrated concentration s of pesticides in water; laboratory and
field studies. Environmental Toxicology and Chemistry, 21 (12) : 2591-2599
Rose, G. and Kibria, G. (2004). Pesticide monitoring in Goulburn-Murray Waters Irrigation
Supply Channels-Results of Pilot Study. Department of Primary Industries, State of Victoria
and Goulburn-Murray Rural Water Authority (G-MW), Tatura. 22p.
Tomlin, C.D.S. (2000). The Pesticide Manual. 12th Edition. The British Crop Protection Council.
Surrey, U.K. 1249p.

Pesticide Monitoring in Irrigation Supply Channels
26
13. Appendices Appendix I. Pesticides and their log Kow
Main Group Pesticides Kow
Organophosphates Azinphos methyl
Parathion methyl
Omethoate
Phorate
Chlorpyrifos
2.96
3.0
-0.74
3.92
4.7
Organochlorines Endosulfan 4.74
Carbamates Methomyl
Thiodicarb
0.093
1.4
Synthetic Pyrethroids Esfenvalerate
Bifenthrin
Tau-fluvalinate
6.22
>6
4.26
Herbicides Molinate
Trifluralin
Pendimethalin
Atrazine
Chlorothalonil
2.88
4.83
5.18
2.5
2.92
Fungicide/Heavy metals Copper
Zinc
Lead
Cadmium