Municipal Solid Waste Management in Bulgaria from a Systems
98
Municipal Solid Waste Management in Bulgaria from a Systems Perspective ALEKSANDAR KOLEV Master of Science Thesis Stockholm 2007
Transcript of Municipal Solid Waste Management in Bulgaria from a Systems
Municipal Solid Waste Management in Bulgaria
from a Systems Perspective
A L E K S A N D A R K O L E V
Master of Science ThesisStockholm 2007


Aleksandar Kolev
Master of Science ThesisSTOCKHOLM 2007
MUNICIPAL SOLID WASTE
MANAGEMENT IN BULGARIA FROM A SYSTEMS PERSPECTIVE
PRESENTED AT
INDUSTRIAL ECOLOGY ROYAL INSTITUTE OF TECHNOLOGY
Supervisor:Björn Frostell
Examiner: Ronald Wennersten

TRITA-IM 2007:12 ISSN 1402-7615 Industrial Ecology, Royal Institute of Technology www.ima.kth.se

ABSTRACT
The European Union membership of Bulgaria since January 2007 imposes higher requirements to the national waste management system and demands changes in the current waste management practices. In this context it is of great interest to study the contemporary and possible future development of the Bulgarian municipal solid waste management system.
A systems analysis was carried out to provide better understanding of the Bulgarian municipal solid waste management and to analyze the possibilities for its future development in a sustainable way. Five different scenarios were constructed and compared using the ORWARE model which is a tool for environmental systems analysis that predicts ecological and economic impacts in a life-cycle perspective. The first describes the present municipal waste management system using landfilling as the only municipal solid waste treatment option. The other four describe possible future developments including business as usual and different combinations of municipal solid waste treatment options including landfilling, composting and incineration. Material recycling was included in all future scenarios.
The results from the ORWARE simulations show that landfilling has the overall highest environmental impacts as compared to the other treatment methods. The introduction of composting and incineration proved to has a positive impact on the environment and provides different benefits in terms of recovered nutrients, heat and electricity production. Material recovery and recycling allows the recovery of different materials but is highly energy intensive.
European and Bulgarian policies, legislation and different publications were studied to understand the factors that shape the current and future development of municipal solid waste management. Further, the application of tools incorporating life-cycle thinking, like ORWARE, was put in a broader perspective, i.e. their use in the policy and decision making process.
The results from the research show that environmental policies in the European Union are changing and the focus has changed from managing specific pollutants or activities to managing resources in long term life-cycle perspective. The present concept of waste is outdated in a sustainable society and waste should be considered as a resource. In the future waste management will become a synonym to resource extraction.
The present national environmental policy making does not consider global environmental consequences due to the fact that it is focused on achieving local environmental targets. The incorporation of global life-cycle perspective in the policy making process will allow the consideration of the environmental and social effects irrelevant of where they arise.
Tools, like ORWARE, that incorporate life-cycle thinking are and will be used in environmental policy making. This is proved by many cases of their successful application in aiding local and national authorities to make their decisions. Even though problems may exist in terms of the required skills and knowledge, examples show that good cooperation between policy makers, scientists and other experts will be the key for their extensive and successful application.
i

ii
TABLE OF CONTENTS
ABSTRACT i
TABLE OF CONTENTS iii
ACRONYMS AND ABBREVIATIONS v
LIST OF TABLES vii
LIST OF FIGURES ix
1 INTRODUCTION 1
2 AIM AND OBJECTIVES 5
3 THE STUDY AREA 7
3.1 General information about Bulgaria 7 3.2 Environmental concerns in the European Union membership perspective 9 3.3 Current municipal waste management practice in Bulgaria 10
3.3.1 Municipal solid waste generation and composition 10 3.3.2 Collection and transportation 11 3.3.3 Municipal solid waste disposal 12 3.3.4 Uncollected waste and uncontrolled landfilling 13
3.4 Future development of MSWM in Bulgaria until 2020 13
4 RESEARCH METHODOLOGY 15
4.1 Methodological outline 15 4.2 Limitations 15 4.3 ORWARE related methodology 16
4.3.1 Municipal solid waste inventory and data collection 16 4.3.2 Aggregation of municipal waste data according to types of settlements 17 4.3.3 Systems analysis of waste management 22 4.3.4 General description of ORWARE 23 4.3.5 System boundaries 24 4.3.6 Scenarios 26 4.3.7 ORWARE sub-models 31 4.3.8 Simulations 36
4.4 Inventory of environmental and waste policy related research and topics 37 4.4.1 European environmental policy 37 4.4.2 Bulgarian environmental policy 38 4.4.3 Local/municipal environmental policy in Bulgaria 38
iii

5 RESULTS 39
5.1 Results from the ORWARE model simulations 39 5.1.1 Waste treatment in each scenario 39 5.1.2 Functional unit output 41 5.1.3 Environmental impacts 42 5.1.4 Energy turnover 51 5.1.5 Material recovery 52
5.2 Findings from the EU and Bulgarian waste policy review 53 5.2.1 European waste policy 53 5.2.2 Bulgarian waste policy 55 5.2.3 Environmental decision making tools 60
6 DISCUSSION 63
6.1 The ORWARE model and its application for Bulgaria 63 6.1.1 Data availability and reliability 64 6.1.2 Environmental impacts 65 6.1.3 Energy balance, nutrient and material recovery 66
6.2 Environmental and waste policy making 67 6.2.1 European waste policy 67 6.2.2 Bulgarian waste policy 68 6.2.3 Global life-cycle perspective in national policy 68
6.3 Link between LCTT and policy making 69
7 CONCLUSIONS 71
8 RECOMMENDATIONS 73
9 ACKNOWLEDGEMENTS 75
10 REFERENCES 77
iv

ACRONYMS AND ABBREVIATIONS BGEEA Bulgarian Executive Environmental Agency BGIS Bulgarian Government Information Service BGNSI Bulgarian National Statistical Institute
BioWS National strategy for reducing the quantities of municipal biodegradable constituents for deposition on landfill sites in Bulgaria
BMFA Bulgarian Ministry of Foreign Affairs CEAP European Community Environment Action Programme CEC Commission of the European Communities CFC Chlorofluorocarbons CHP Combined Heat and Power CS Compensatory System(s) EC European Commission EEA European Environment Agency EIA Environmental Impact Assessment EIONET European Environment Information and Observation Network
EMEP Co-operative Programme for Monitoring and Evaluation of the Long-range Transmission of Air Pollutants in Europe
EMS Environmental Management System EPC Environmental Protection Committee EU European Union
EU-10 Cyprus, Czech, Republic, Estonia, Hungary, Latvia, Lithuania, Malta, Poland, Slovak Republic, Slovenia
EU-15 Austria, Belgium, Finland, France, Germany, Greece, Ireland, Italy, Luxembourg, Netherlands, Portugal, Spain, Denmark, Sweden, United Kingdom
EU-25 EU-15 and EU-10 EU-27 EU-15, EU-10, Bulgaria and Romania Eurostat Statistical Office of the European Communities GDP Gross domestic product GWP Global Warming Potential HDPE High Density Polyethylene HFC Hydrofluorocarbons IPP Integrated Product Policy IPPC Integrated Pollution Prevention Control ISPA Instrument for Structural Policies for Pre-Accession KTH Royal Institute of Technology, Stockholm, Sweden LCA Life Cycle Assessment LCT Life-Cycle Thinking
v
LCTT Tools that Incorporate Life-Cycle Thinking LDPE Low Density Polyethylene MFA Material Flow Analysis MiSt MiljöStrategiska verktyg, MOEW Bulgarian Ministry of Environment and Waters MSW Municipal Solid Waste MSWM Municipal Solid Waste Management MSWMS Municipal Solid Waste Management System NATO North Atlantic Treaty Organisation NSME Bulgarian National System for Monitoring of the Environment NWMP Bulgarian National Waste Management Program ORWARE ORganic WAste REsearch, systems analysis tool used for MSWM planning PPS Purchasing Power Standards RA Risk Assessment RT Remaining Time RVF Swedish Association of Waste Management SEA Strategic Environmental Assessment SFA Substance Flow Analysis ST Surveyable Time StO Stolichna obshtina TIA Technology Impact Assessment TS Thematic Strategies TSPRW European Thematic Strategy on Prevention and Recycling of Waste USEIA United States Energy Information Administration USGS United States Geological Survey VOC Volatile Organic Compounds WEEE Waste Electric and Electronic Equipment WFD European Waste Framework Directive WMA Bulgarian Waste Management Act WMP Waste Management Plan WMS Waste Management System WTO World Trade Organization
vi

LIST OF TABLES
Table 3-1 Municipal solid waste generation in Bulgaria, 2000 - 2005 10
Table 3-2 Bulgarian municipal solid waste composition, country average data, 1999 - 2002 11
Table 3-3 Packaging waste recovery and recycling targets, 2005 - 2010 12
Table 3-4 Uncollected municipal solid waste as related to generated and collected amounts, 2000 - 2005 13
Table 3-5 MSW composition in selected regions and countries 14
Table 4-1 Population distribution by dwelling types and planning regions (as of 31.12.2004) 18
Table 4-2 Number of settlements and population by functional type, as per 31.12.2004 19
Table 4-3 BT-Engineering survey: MSW composition in accordance to the number of inhabitants in a settlement 20
Table 4-4 Waste composition and generation rates used for the ORWARE model calculations, 2004 21
Table 4-5 Material recovery rates from household waste, % 27
Table 4-6 Calculation of the total MSW amount based on collected and other waste disposed with it 28
Table 4-7 Waste composition and population distribution according to settlement types, 2004 28
Table 4-8 Waste composition and population distribution according to settlement types, 2020 29
Table 4-9 Source separation in 2020 30
Table 4-10 Functional units for the core and compensatory systems 30
Table 4-11 Scenario summary and main features 31
Table 5-1 Functional unit outputs for the different scenarios 41
Table 5-2 Global Warming Potential of total system, kiloton CO2-equivalents 43
Table 5-3 Photo-oxidant VOC from total system, ton of ethene-equivalent 46
Table 5-4 Quality evaluation of total environmental impact of core system as represented by the five impact categories 50
Table 5-5 Quality evaluation of total environmental impact of total system as represented by the five impact categories 51
Table 5-6 Energy balance in the core system, TJ 51
Table 5-7 Contribution of cardboard and plastics recycling to different impact categories as % of total core system impact 53
Table 5-8 Energy use for cardboard and plastics recycling as % of total core system energy use 53
vii

viii

LIST OF FIGURES
Figure 3-1 Map of the European countries 8
Figure 3-2 GDP per capita in PPS for selected countries, 2003 – 2008 9
Figure 4-1 Hierarchical structure of a system containing sub-systems with higher detail 22
Figure 4-2 Conceptual design of a process sub-model in ORWARE 23
Figure 4-3 Conceptual representation of the MSWM system in ORWARE 24
Figure 4-4 Conceptual model of the total system in ORWARE 26
Figure 4-5 The ORWARE model built for Bulgaria as presented in Simulink 32
Figure 5-1 Distribution of the total generated MSW to different treatment methods 39
Figure 5-2 Distribution of the total managed MSW to different treatment methods, including secondary wastes 40
Figure 5-3 Percent distribution of the total generated MSW to different treatment methods 41
Figure 5-4 Global Warming Potential from core system 42
Figure 5-5 Acidification from core system 43
Figure 5-6 Acidification from total system 44
Figure 5-7 Eutrophication from the core system 44
Figure 5-8 Photo-oxidant VOC from core system 45
Figure 5-9 Photo-oxidants NOx from core system 46
Figure 5-10 Photo-oxidants NOx from total system 47
Figure 5-11 Total environmental impact of core system as represented by the five impact categories 48
Figure 5-12 Total environmental impact of total system as represented by the five impact categories 48
Figure 5-13 Total environmental impact of core system as represented by the five impact categories per ton treated waste 49
Figure 5-14 Total environmental impact of total system as represented by the five impact categories per ton treated waste 49
Figure 5-15 Energy balance for the core system 52
Figure 5-16 Conceptual scheme of the model used for biodegradable waste management in Bulgaria 58
ix

x
1 INTRODUCTION During the last decades the global advances in industry and technology allowed social and economic development that were undreamed of 100 years ago. The speed at which changes are happening is so fast that Change is considered to be the normal operational state of business and economy. More and more products and services flood our society at the expense of non-renewable natural resources and environmental degradation. The question is for how long.
In 1966 Kenneth Boulding uses the term “Spaceship Earth” (Boulding, 1966) referring to the limits that we would be able to expand to. Many other examine the concept of the environmental limits that are posed on the human society including “The limits to growth” (Meadows, 1972 and Meadows et al, 2004) and “Our Common Future” (Bruntland, 1987).
Today it is a common understanding that different limitations exist in our environment and sooner or later they will be reached. The question “When?” is subject of many analyses within the natural and social sciences but the results are quite uncertain. It is fairly easy to estimate when a non-renewable natural resource will be used up; however, it is difficult to estimate when the environment will not be able to render harmless the waste substances that are discharged in it. There are still a lot of unknowns about the natural environment and the interaction processes in it.
Economic and business interests have always been a very strong drive of technological advances and other benefits as well. However, the depletion of many natural resources that have been exploited during the last decades has generated concern not only in environmentalists but also in the ultimate users – the companies that utilize those resources to produce goods and generate the welfare that the society benefits from. Hence, many new technologies are adopted that are more efficient in using resources and energy, as well as in reusing of previously discarded waste streams, known as recovery or recycling.
The use of waste as a resource is not a new idea and has been around for 4000 years (Waste Online, 2004). However, today the variety and amount of waste is much greater. Waste generated as a result of the economic activities is large in amounts, homogeneous in content and generated at a specific site which makes it easier to manage. In contrast, municipal solid waste (MSW) has a relatively low contribution to the total amount of waste generated each year but arises everywhere and is highly variable in composition. The waste composition is highly dependent on the level of economic development of a country and the overall affluence of its inhabitants, reflected in the variety of products available and consumed. The consumer products comprising different components and materials sooner or later show up in the MSW stream. Moreover, as MSW is generated in numerous places, e.g. peoples’ homes, office buildings, industrial facilities, its management tends to become more and more complicated as cities grow in size and area.
Municipal solid waste management (MSWM) is an important and reoccurring issue that municipal authorities all over the world have to tackle. The population growth and rapid urbanization in many countries are proving to outpace the efforts that are made in the waste management planning field. The result is that increasing quantities are discarded into the environment without control causing environmental degradation by influencing air quality, water supplies and spreading infectious diseases. In addition, large amounts of materials and substances that have the possibility to be reused or recycled are lost without utilizing the
1

energy that have been spent for their initial manufacturing. Thus new raw materials and energy have to be used instead in ever increasing quantities. The problem of MSWM is different in different countries. In some it is a question of establishing a whole new system while in other it is about optimization of the existing one.
The MSWM is not only a technical issue but has political, institutional, social, economic, financial (Schübeler, 1996) and ecological aspects. The political aspect is related to setting up specific goals and priorities of the waste management system (WMS), creating a regulatory and legal framework, establishing clear authority and responsibility areas. The institutional aspect includes creating adequate organization structures and providing capacity through procedures and methods to effective municipal solid waste management system (MSWMS) operation. The social aspect of MSWM is related to people’s perception of the problem, their awareness and contribution. Even a highly sophisticated MSWMS cannot operate without people’s participation and cooperation which may include source separation or illegal dumping prevention. The public’s sensitivity and attitude to the impacts of the different waste management options often is a major factor in defining which one will be implemented.
The waste management systems are directly linked to the economic activities within the country. The need of investments for MSWM operations and services tend to increase with economic development because it leads to higher need for those services. Part of the investment and operation costs is covered by fees and taxes that are imposed to the users of the services. Still, low collection rates or inappropriate budgeting can undermine the long-term economic stability of the system. The economic benefits that arise from resource conservation when reusing and recycling waste products are also evident.
The technical aspects of the MSWMS include planning, implementation and maintenance of the collection and transportation, as well as the design and construction of treatment facilities.
Ecological aspect of MSWM is related to the environmental impact from all waste management activities. Those include emissions of toxic substances from MSW to the air and water, loss of arable land to landfills, loss of nutrients with organic waste fractions, loss of metals and other valuable components that can be recycled.
All MSWM aspects pointed out are important components of a complex system and should not be considered separately. Individual solutions will be partial, focused on the symptoms not the causes of the problems and will not lead to long-lasting outcomes.
The incorporation of life-cycle perspective through systems analysis of waste management has a long history (Björklund, 2000). During the last decades a number of procedural (EMS, EIA, SEA) and practical tools (LCA, RA, MFA, SFA) for environmental systems analysis have been developed and used (Moberg, 2006). Presently the European Thematic Strategy on the Prevention and Recycling of Waste (TSPRW) suggests that:
“Environmental policy traditionally focused on the early and the final phases of the life cycle: extraction, processing and manufacturing at one end and waste management at the other. It is now recognised that the environmental impact of many resources is often linked to the use phase [2]. All phases in a resource’s life cycle need to be taken into account as there can be trade-offs between different phases and measures adopted to reduce environmental impact in one phase can increase the impact in another. Clearly, environmental policy needs to ensure that negative
2

environmental impact is minimised throughout the entire life cycle of resources. By applying the life-cycle approach, priorities can be identified more easily and policies can be targeted more effectively so that the maximum benefit for the environment is achieved relative to the effort expended.” (CEC, 2005c)
This shows the commitment of the European Government and all Member states to holistic life-cycle approach in waste management planning. Suggested measure according to that strategy is the development of “basic guidelines to make life-cycle tools easily usable in waste policymaking” (CEC, 2005c) through consultation with the scientific and stakeholder communities.
Since January 2007 Bulgaria has been a full member of the European Union (EU). As part of the accession process the waste legislation in the country was harmonized with the European waste regulations. According to the Bulgarian National Statistical Institute (BGNSI) the MSWMS in Bulgaria covers 88% of the country’s population and this figure has been increasing during the last several years. Despite that, the system is far from developed according to European standards. The ultimate treatment method for MSW in Bulgaria is landfilling which is the least preferable waste management alternative according to the EU waste hierarchy (EC, 1999). A major problem that lies ahead is the implementation of the waste policy and development of the MSWMS to include other treatment options such as incineration, anaerobic digestion or composting. There has been an increasing activity related to source separation of packaging waste which will ultimately decrease the amount of the generated mixed MSW and will ease further treatment. Still, separation systems are in place only in few big cities and are still underdeveloped. The construction of the first large scale composting plant for MSW treatment is under way near Plovdiv, the second largest city in Bulgaria, and is supposed to be commissioned in May 2007. So far, this is the only alternative MSW treatment method implemented in the country besides landfilling.
This master thesis project describes the current municipal waste management system in Bulgaria and investigates the future opportunities for its development. For this purpose the ORWARE computer model is used as a tool to analyse available data and to compare alternative waste management systems. The ORWARE model has been developed in the Royal Institute of Technology (KTH) as a system analysis tool for organic waste management but was subsequently developed to be used for MSW. It allows estimation of environmental impacts using Life Cycle Assessment (LCA) methodology and costs of different waste management systems such as material recovery or incineration. Until now, the model has been used in Sweden as a decision support tool at municipal level. The systematic approach of the model implies that it can be used at national level as proven by a recent study of the organic waste management in Denmark (Baky and Eriksson, 2003).
The global trend within the EU is toward complete prohibition of MSW landfilling without prior treatment. As this treatment method is the most widely used in Bulgaria, it is of great interest to investigate the future opportunities for development of MSWM and what system would be most environmentally and economically sustainable in a national perspective.
3

4

2 AIM AND OBJECTIVES The aim of this study is to provide better understanding of the Bulgarian municipal solid waste management from a systems perspective and to analyze the possibilities for its future development in a sustainable way. This is of particular interest as Bulgaria is a new member of the European Union since January 2007. The membership imposes higher requirements to the national waste management system and demands changes in the current waste management practices.
To reach the aim of this research, five specific objectives were set up and research questions were formulated to help accomplish each one of them:
1. Describe Bulgaria’s contemporary municipal solid waste management system from a systems analysis point of view.
a. What are the methods used for treatment of municipal solid waste in Bulgaria?
b. How the municipal solid waste management is related to other systems such as energy production, nutrient recovery, material recycling, consumption patterns and product manufacture?
c. What are the differences in municipal solid waste generation and composition between the different kinds of settlements based on their size, location, social and economic function?
2. Gather and analyze data about the municipal solid waste in Bulgaria.
a. What sources of data about municipal solid waste are available?
b. What kind of information is available for municipal solid waste generation and composition?
3. Use ORWARE to simulate the current and possible future scenarios for development of the Bulgaria’s municipal solid waste management system.
a. What are the possible scenarios for development of the Bulgarian municipal solid waste management in the context of European Union membership?
b. What are the local factors that may influence the future development Bulgarian municipal solid waste management system?
4. Analyze the results from ORWARE and draw conclusions on which of the simulated scenarios will be most beneficial from environmental and economic stand point.
a. Which scenario has the lowest overall environmental impact?
b. Which scenario provides highest benefits in terms of energy and/or recovered materials?
5. Establish a link between tools that incorporate life-cycle thinking (LCTT) in general and ORWARE in particular and the environmental policymaking process at national and European level.
5

a. What is the contemporary set of environmental impact evaluation tools used by decision makers?
b. How tools that incorporate life-cycle thinking are used in decision making?
c. What is the difference in environmental policy making and decision making at different levels of governance?
d. How LCTT may be used in the policy making process to ensure long term sustainability of the political decisions?
6

3 THE STUDY AREA
3.1 General information about Bulgaria Bulgaria is situated in the South-East part of Europe in the eastern part of the Balkan Peninsular (Figure 3-1). It has an area of 111 thousand square kilometres with a population of 7.7 million people (as per 31.12.2005).
Neighbouring countries are Romania to the North, Greece and Turkey to the South, Serbia and Macedonia to the West. The Eastern border is the Black Sea. The capital Sofia is situated in the western part of the country and has a population of approximately 1.2 million. Bulgaria is situated on the border between the Temperate and Mediterranean climatic zones and the climate is characterized with four distinct seasons.
The history of Bulgaria is long and dates back to 681 when the country was established in its present location. During the last eighteen years the country has undergone significant changes. From 1946 until 1989 Bulgaria was governed by the pro-Soviet Bulgarian Communist party. The political parties outside the Fatherland Front were banned, the economy and banks were nationalized, and the arable land was organized in cooperatives. The date 10 November 1989 marked the beginning of the democratic changes in Bulgaria. A new Constitution was adopted in 1991 which laid the foundation of the democratic development and market economy (BGIS, 2005 and BMFA, 2005).
Between 1946 and 1989, Bulgaria had a Soviet-style economy in which nearly all agricultural and industrial enterprises were state-controlled. A stagnant economy, shortages of food, energy, and consumer goods, an enormous foreign debt, and an obsolete and inefficient industrial complex instigated attempts at market-oriented reform in the 1990s. Traditionally an agricultural country, Bulgaria has been considerably industrialized since World War II. The leading industries are machine building, metalworking, food processing, engineering, and the production of chemicals, textiles, and electronics. Bulgaria's main mineral resources include bauxite, copper, lead, zinc, coal, brown coal (lignite), iron ore, and oil and natural gas. There are many mineral springs. Agriculture accounts for more than 20% of the gross national product and employs about the same percentage of the workforce. The principal crops are wheat, oilseeds, corn, barley, vegetables, and tobacco. Grapes and other fruit, as well as roses, are grown, and wine and brandy production is important. More than 80% of Bulgaria's trade is with former Soviet-bloc countries (Infoplease, 2007).
7

Figure 3-1 Map of the European countries
Source: Petkov, 2007
Current Bulgaria’s foreign policy is oriented to cohesion with the European structures. The country has been a member of the Council of Europe since 1991. In 2004, Bulgaria joined NATO1. In 1995, Bulgaria started the process of accession to the European Union. In 1999, it started the accession negotiations. On 25 April 2005, in Luxembourg was signed the Treaty of Accession of Republic of Bulgaria to the European Union (BGIS, 2005) and Bulgaria joined the EU on 1 January 2007.
According to the World Bank (2005) Bulgaria has made remarkable progress towards long-term economic stability and sustained growth over the last seven years. As a result of the structural reforms and adopted new policies average growth reached the levels of New Member States (NMS-8)2 at about 5 percent per year in 2000-2005. Despite that, Bulgaria is still one of the poorest countries in Central and Eastern Europe. The country’s per capita income, expressed as PPS3 in 2005, was 33% of the average level of European Union-25 (EU-25) which is considered to be 100. For comparison the per capita income for 2005 of
1 North Atlantic Treaty Organisation, http://www.nato.int/ 2 Czech Republic, Estonia, Hungary, Latvia, Lithuania, Poland, Slovak Republic, Slovenia 3 Purchasing Power Standards (PPS) is a common currency into which all national currencies are converted thus eliminating the differences in price levels between countries in the process of conversion and allowing meaningful volume comparisons of GDP and its aggregates.
8

Poland, Lithuania and Slovakia, which are the poorest countries in the NMS-8 group, was 50, 52 and 57 percent of the EU-25 average respectively (Figure 3-2).
Figure 3-2 GDP per capita in PPS for selected countries, 2003 – 2008
0
20
40
60
80
100
120
Bulgaria Lithuania Poland Slovakia Sweden
2003 2004 2005 2006* 2007* 2008*
Source: Eurostat * Projected values
EU 25 index = 100
3.2 Environmental concerns in the European Union membership perspective
The dawn of environmental concern in Bulgaria can be dated back to 1976 when the State Council issued a decree creating an Environmental Protection Committee (EPC), attached to the Council of Ministers, which until then was part of the Ministry of forestry and environmental protection. The tasks assigned to the EPC were defined as follows:
• Organize and coordinate the elaboration of environmental protection regulatory system;
• Coordinate and control the National environmental protecting program;
• Coordinate and control the rational utilization of natural resources;
• Implement a special control on environmental protection.
In 1990 the EPC was transformed into Ministry of Environment with a resolution of the National Assembly and later in 1997 was renamed as Ministry of Environment and Waters (MOEW) which corresponds to the new functions included, namely water management, monitoring and control (MOEW, 2007a).
Currently the MOEW comprises of 2 administrative and 11 specialized directorates, 15 Regional inspectorates, 4 River basin directorates, 3 National park directorates and Executive environmental Agency (BGEEA). The contemporary structure of MOEW and its subordinate organizations evolved to meet the need for reforms in the environmental administration in relation to the accession of Bulgaria in EU. At present it is aligned with the corresponding EU structures and there are no foreseeable significant changes that need implementing.
9

According to Dzhevdet Chakarov (2006), Minister of MOEW, the existing European environmental legislation is fully transposed in Bulgaria and is currently into force. For less than ten years more than 90 major acts were introduced in the Bulgarian environmental law system, eight environmental frameworks and 80 regulations, which may be a clear indicator of the pace at which changes are happening in Bulgaria. This extensive regulatory mechanism has to assure the basis for the future modern environmental management and integration of the environmental standards into other policy areas.
However, the harmonization of the legislation is only the beginning of the process. The major challenge in front of Bulgaria is its implementation. The cost of enforcement of the new environmental requirements for the society is estimated around 10 billion euros (Chakarov, 2006) and most of it has to come from the business sector. The authorities are in close dialog with business representatives during the negotiations and the implementation of the new regulations and are trying to find a balance between environmental targets and economic development. Future efforts will focus on the integration of the environmental targets in all sectoral development programs, promotion of voluntary environmental management and audit, and delegation of more power to local authorities when implementing infrastructural projects.
3.3 Current municipal waste management practice in Bulgaria The following section describes the current state of the MSWM system in Bulgaria and provides information about the generation, collection, transportation and disposal of the MSW.
3.3.1 Municipal solid waste generation and composition BGNSI data about municipal waste shows that the generation rate has fallen from 518 kg/cap/a to 476 kg/cap/a for the years 2000 and 2005 respectively (Table 3-1). However, in 2005 the trend is towards increase of the rate as compared to 2004. Even though the percent of the population that is served by organized municipal waste collection systems and the amount of the collected municipal solid waste are increasing, the total generated amount tends to decrease during the past years.
Table 3-1 Municipal solid waste generation in Bulgaria, 2000 - 2005
Unit 2000 2001 2002 2003 2004 2005 Generated MSW 1,000 t 4,224 4,003 3,945 3,916 3,673 3,595Collected MSW 1,000 t 3,318 3,211 3,199 3,209 3,092 3,237Landfilled MSW 1,000 t 3,271 3,198 3,188 3,194 30,92 3,144Stored temporary MSW 1,000 t 47 13 11 15 0 93Generation rate kg/cap/a 518 505 503 502 472 476Share of population, served by organized municipal waste collection systems
% 78.6 80.2 81.1 82.0 84.2 87.8
Landfill sites number 619 663 677 706 633 537Settlements served by municipal waste collection systems
number 1,190 1,295 1,361 1,465 1,801 2,388
Source: www.nsi.bg
10

In analysis of the situation, BGNSI (2006) suggests that this is due to the migration from rural to urban areas which increases the percent of the served population. Moreover, there is an ongoing decrease of the total population in Bulgaria due to emigration and negative natural increase of the population which was 0.5% in 2005.
The composition of the MSW is reflected by the products that are consumed in the country. At present there are not sufficient analyses of MSW to provide enough reliable data for research projects or for planning purposes such as developing national strategies for MSW management.
As a result of the development of National strategy for reducing the quantities of municipal biodegradable constituents for deposition on landfill sites in Bulgaria (MOEW, 2007b), an interim report was published (Wiegel and Ebert, 2005) with overview of the MSW morphological analyses that have been made until present. The consultants developing the report conclude that the most reliable data available is in a survey made by BT-Engineering (2004).
The other major source of information about MSW composition in Bulgaria is Eurostat which annually publishes data provided by BGNSI and BGEEA. According to Eurostat the final dataset available for Bulgaria is for 2002 and the MSW composition is as presented in Table 3-2.
Table 3-2 Bulgarian municipal solid waste composition, country average data, 1999 - 2002
Constituent Unit 1999 2000 2001 2002 Paper, paperboard, paper products % 8.52 8.68 9.95 11.06 Textiles % 3.13 3.25 3.77 3.82 Plastics % 8.07 8.81 9.45 11.13 Glass % 5.26 5.25 5.08 5.32 Metals % 2.45 2.25 2.34 2.24 Organic material % of which: Food and garden waste % 41.57 39.88 38.73 39.51 Bulky waste % Other waste % 31.00 31.88 30.68 26.92
Source: Eurostat
According to BGNSI during the 2002-2003 period the amount of the MSW in the rural areas has been around 160 kg/cap/a (including 50 kg biodegradable waste), while in the urban areas the amount of MSW, including waste from offices and service buildings, has been around 350 kg/cap/a (including 140 kg biodegradable waste). These figures correspond to 31% and 40% for the organic waste fraction in the respective areas.
3.3.2 Collection and transportation The organized MSW collection systems cover almost 95% of the towns and 33% of the villages which corresponds to 88% of the total population in 2005 and has increased from 85% in 2004 (MOEW, 2007b). A stationary container system is used to collect the MSW and the transportation is carried out with self-loading packer-trucks or container trucks. The transportation is directly to the landfill sites at a distance from 3 to 7 km as in general they are situated near the settlements.
11

At present there are efforts for source separation and collection of packaging waste; however, their effect is still insignificant although it will most probably increase in the near future. This collection system is organized under the producer responsibility requirements to recover and recycle a certain percent of the packaging waste that is generated as a result of the use of their products. There are specific targets set by the legislation which will influence the future development of the MSWM system in Bulgaria (Table 3-3).
Table 3-3 Packaging waste recovery and recycling targets, 2005 - 2010
Unit 2005 2006 2007 2008 2009 2010 Recovery of packaging waste % 25 32 39 42 45 48
Recycling of packaging waste % - - 25 30 35 40
Source: Bulgarian Waste Management Act
The recovery and recycling of some of the fractions in the MSW, such as glass, papers, metals and plastic, is still negligible but will increase in the upcoming years. It is limited to buying back separately collected waste from the population by different manufacturers or waste traders at buying back centres and by conducting periodical campaigns. The organization of these activities is independent from the MSWM systems.
3.3.3 Municipal solid waste disposal At present almost the entire amount of MSW generated in Bulgaria is landfilled. There is a composting plant under construction near Plovdiv that will be commissioned in May 2007 with the capacity to treat 127,000 tons per year of MSW. This is the first MSW treatment facility other than landfill that is being constructed in Bulgaria. The construction of MSW composting or mechanical-biological treatment plants are laid in the plans for development of some of the biggest Bulgarian municipalities and those will have an important role in the future development of the national MSWMS.
Currently 22 regional landfills are constructed under the ISPA4 program meeting all the requirements set by the European standards for such treatment facilities and 33 more will be operational within the next couple of years. Their purpose is to gather the MSW from a number of municipalities in order to close down old landfill sites that do not meet the high environmental standards enforced today. This will also allow for better control of the environmental impacts and monitoring of the amounts and composition of the incoming waste. Most of the now working landfills do not have scales to measure the arriving quantities, there is no control of the composition and the properties of the received waste. That is why the information about the composition and the amounts of the wastes is based on expert assumptions and accounting calculations.
The landfill disposal is subsidized by the users of the service via waste management tax of around 1% of the net household income. This is in the same order as in other European countries. In Bulgaria the tax is calculated on the base of the tax valuation of the property that is served by the organized collection and disposal system.
4 Instrument for Structural Policies for Pre-Accession, http://ec.europa.eu/enlargement/financial_assistance/ispa_en.htm
12

3.3.4 Uncollected waste and uncontrolled landfilling Currently the total amount of the generated MSW (Table 3-1) is statistically estimated on the basis of the collected amount and the percent of the population served by organized municipal waste collection systems. Based on the BGNSI data in 2005 its amount is 358 000 tons which corresponds to almost 10% of the total amount generated in that year (Table 3-4).
Table 3-4 Uncollected municipal solid waste as related to generated and collected amounts, 2000 - 2005
Unit 2000 2001 2002 2003 2004 2005
Generated MSW 1,000 t 4,224 4,003 3,945 3,916 3,673 3,595
Collected MSW 1,000 t 3,318 3,211 3,199 3,209 3,092 3,237
Uncollected MSW 1,000 t 906 792 746 707 581 358
Uncollected MSW as part of Generated % 21.4 19.8 18.9 18.1 15.8 10.0
Uncollected MSW as part of Collected % 27.3 24.7 23.3 22.0 18.8 11.1
Source: www.nsi.bg, own calculations
The uncollected waste is generated in remote rural areas where one or several small settlements use natural features as depressions or dry river beds to dispose their MSW in. People use to burn the dumped waste at a regular basis in order to diminish its quantity and to prevent the spread of infectious diseases through animals that graze or pass close to those areas.
3.4 Future development of MSWM in Bulgaria until 2020 Current trends in the MSW generation rate in Bulgaria show a decrease and stabilization at around 480 kg/cap/a. The commitment of the National Waste Management Program (NWMP) for the 2003-2007 period to decrease the MSW generation rate under 400 kg/cap/a until 2007 will most probably not be fulfilled and the target will be transferred into the upcoming program from 2008. The municipal waste generation rate in Western Europe reaches values of over 600 kg/cap/a in some countries according to Eurostat. The MSW generation rate for Sweden for 2005 was 480.5 kg/cap/a which is 4.3% increase as compared to 2004 (RVF, 2006). This example proves that even though the amount of generated MSW per inhabitant tends to rise with the increase of GDP, high GDP rates as in Sweden can be related with the same generation rate as in Bulgaria. Recently the growth of GDP per capita in Bulgaria is around 5% per year and this trend is expected to continue over the coming years. Considering all these factors it is reasonable to assume that the MSW generation rate will fluctuate around the value of 500 kg/cap/a.
According to BGNSI (as cited by MOEW, 2007b) the current population trends show that by 2020 the population will decrease by 5.4% as compared to 2004, i.e. it should be around 7.34 million. At the same time the internal migration from rural to urban areas will lead to 10% increase of the urban population. This will also lead to an increase of the share of the population that will be covered by the organized municipal waste collection systems which until 2020 is expected to reach 90% and corresponds to a steady 0.3% increase per year.
13

Based on the previous assumptions, the amount of the generated MSW in Bulgaria in 2020 will be approximately 3,700 thousand tons or 504 kg/cap/a – almost the same amount as it is today. This is explained by the significant decrease of the population and the slow increase of MSW generation rate observed in recent years.
However, the composition of the MSW will change to a greater extend as compared to its present morphology. The amount of organic waste decreases with the increase of the level of development in the country mainly at the expense of packaging waste (Table 3-5). It is reasonable to assume that the composition will be similar to the West European average in 2004.
Table 3-5 MSW composition in selected regions and countries
Constituent Unit Western Europe 2004*
Eastern Europe 2004*
Latvia, Alytaus 2005**
Estonia, Tallinn 2005**
Bulgaria 2004*
Paper, paperboard, paper products % 26 14 9 22 11
Textiles % 2 5 4 6 4 Plastics % 7 9 9 8 11 Glass % 6 5 7 9 5 Metals % 4 5 4 3 2 Organic material % 27 42 39 43 40 Bulky waste % 3 0 0 0 0 Other waste % 25 20 28 9 27
Source: * Eurostat ** Sundqvist (2006)
In the future, landfilling will continue to play a major role in the Bulgarian MSWMS. However, alternative MSW treatment methods such as incineration, composting and anaerobic digestion will most probably be included as well as material recovery and recycling of different fractions.
14

4 RESEARCH METHODOLOGY
4.1 Methodological outline The initial scope of this study suggested that ORWARE could be used to evaluate the environmental impact of the contemporary MSWMS in Bulgaria and of its possible future developments. During the initial literature review and data collection phase it became apparent that even though the results of such comparison will provide ground for discussion of possible improvements, the issues cannot be considered without linking them to the environmental policy and decision making. The latter are the factors that can promote or impede the future Bulgarian waste management development in a specific direction. For that reason the scope of this thesis was extended to include analysis of the present waste management policy in Bulgaria and EU. The expected results of this analysis will put the use of tools incorporating life-cycle thinking in a broader perspective namely their role in the environmental policy and decision making.
This way of structuring of the research provided for two separate sub-sections, related to the use of ORWARE as a tool and policy making as a process, not only in the description of the methodology but also in the results and discussion sections that follow. At the end of the discussion a connection between those two “separate” areas of interest for this thesis is drawn.
The study ends with conclusions drawn from the acquired results as well as recommendations concerning future improvements and possible research.
4.2 Limitations One of the major problems related to a systematic study of the waste management system is data availability and reliability. The analyses in this study were performed using data from different sources which is considered to be the best available information at the time the work was commissioned. As not all of the required ORWARE input information was available about Bulgaria, data from similar projects about systems analysis of municipal waste management in Sweden was used.
The ORWARE model has never been used to perform systems analysis at national level with one exception. The vastness and complexity of the MSWMS at that level is very high. In order to describe the whole system, a simplification was needed and it was made by assuming that the variables used in the analysis are related to the size, social and economic function of the different types of settlements. This required average values for MSW generation, composition, transportation and other factors related to municipal slid waste treatment to be used.
The use of data from other studies that are specific for different geographic regions and average values for the ORWARE input parameters is described in the corresponding sections. The assumptions that have been made are also explained and justified.
The ORWARE model gives the opportunity to calculate the costs that are related to the different components of the waste management system. The importance of such evaluation was acknowledged but it requires input data that at the time of conducting this study was not readily available. That is why the economic evaluation is not part of this thesis work.
15

4.3 ORWARE related methodology
4.3.1 Municipal solid waste inventory and data collection In order to perform this study, an inventory of all the information relevant to it had to be collected. During this phase the main sources of information about MSW management in Bulgaria have been identified. Following is a list of the main information sources used with short presentation of their functions and relevance to the topic of this thesis.
4.3.1.1 Bulgarian Executive Environment Agency The Executive Environment Agency of the Ministry of Environment and Waters performs monitoring and collection and aggregation of national data on water, air, soils, radiation and waste. It supports the functions of the Ministry by supplying data and analyses, performing ecological monitoring of the waste producers and disposal facilities, laboratory control of waste and maintenance of waste related database. The Agency also establishes and operates the National System for Monitoring of the Environment (NSME).
Being National Reference Centre of the European Environmental Agency and member of the Basel Convention, BGEEA is required to report data on waste which is the reason for establishing the “Waste” information system as an independent sub-system of NSME. It includes information about quantities and composition of municipal, industrial, construction and hazardous wastes; waste generators; waste recovery and disposal facilities. The information is gathered on a yearly basis through questioners.
4.3.1.2 Bulgarian National Statistical Institute The National Statistical Institute of Republic of Bulgaria is the nation’s statistical body. It is responsible for collection, analysis, storage and dissemination of statistical data concerning demographics, economy including business and trade, social welfare, agriculture and environment. It is also responsible for the upkeep of a number of national statistical classifications including NACE5, PRODAGRO6, NCPA7 and NUTS8. In 1993 BGNSI signed a common declaration for cooperation in the filed of statistics with Eurostat and ever since it is reporting data required by all EU member states. At present the Bulgarian statistical system is in compliance with the European legislation in the field of statistics (Council Regulation (EC) No 322/97 on Community Statistics).
4.3.1.3 European Environmental Agency The European Environment Agency (EEA) was established in 1990 and its work includes coordinating the European Environment Information and Observation Network (EIONET) and an information system, collecting and analyzing shared environmental data from the European Commission services, EEA member countries9, international organizations, conventions and agreements, producing policy relevant advice and making these and other information widely available (EEA, 2003). EEA is the leading public body in Europe dedicated to providing timely, targeted, relevant and reliable information to policy-making
5 National Classification of Economic Activities 6 Nomenclature of Agriculture, Forestry and Fishing Production 7 National Classification of Products by Activities 8 Nomenclature of Territorial Units for Statistics 9 EU-27 and six collaborating non-member countries: Albania, Bosnia and Herzegovina, Croatia, FYR of Macedonia, Montenegro and Serbia.
16
agents and the public, to support sustainable development and to help achieve significant and measurable improvements in Europe’s environment.
The aim of EEA is to help the EU, member state governments and relevant authorities to make informed decisions about improving the environment, integrating environmental considerations into economic policies and moving towards sustainability. To do this, a wide range of information and assessments are provided each year. Those include the state of the environment and trends in it, together with impacts on the environment and the economic and social driving forces behind them, policies and their effectiveness. Scenarios and other techniques are used increasingly during the last years to identify possible future trends, outlooks and problems. Most of the information is made available on the EEA’s website and is translated into the official languages of the EEA member countries which provides for more interested parties to benefit from it (EEA, 2004).
4.3.1.4 Statistical Office of the European Communities (Eurostat) Eurostat is the Statistical Office of the European Communities and its main task is to provide the European Union with high-quality statistical information at European level that enables comparisons between countries and regions. Eurostat consolidates national data gathered in the Member States by their statistical authorities and ensures that it is comparable by use of harmonized methodology. The processed information as well as analysis of current and future trends is published on the Eurostat’s webpage as well as in a number of publications.
The information is gathered and disseminated by Eurostat merged in themes: General and regional statistics, Economy and finance, Population and social conditions, Industry, trade and services, Agriculture and fisheries, External trade, Transport, Environment and energy, Science and technology.
4.3.2 Aggregation of municipal waste data according to types of settlements
4.3.2.1 Population distribution by settlement types In order to use ORWARE, all the available data about the amounts of generated waste in Bulgaria as well as its composition has to be aggregated in a way that will allow further analysis.
It is common sense to assume that the waste composition is related to the type of housing area it is generated from. Big apartment buildings in the capital or any other bug city will produce waste with different composition from that of a house in a small village in the countryside. That is why following the classification made in the BioWS this thesis looks at the following main types of dwelling structures:
• Type A – Inner city and suburbs with blocks of flats. Can be characterized with high population density, common waste collection bins and weak possibility to control waste separation.
• Type B – Suburb single family houses villa type (most with small gardens). Can be characterized with relatively low population density, individual waste collection bins and possibility for better control over waste separation.
• Type C – Single family houses in rural areas and villages. Most of them have big gardens and people grow fruits and vegetables, and raise animals. Can be characterized with low population density and individual waste collection bins.
17

Table 4-1 presents data about the population distribution according to the types of dwelling structures in the different regions within the country.
Table 4-1 Population distribution by dwelling types and planning regions (as of 31.12.2004)
Urban population Rural population in dwelling structures
Type C
Rural population and suburbs in
dwelling structures Type B + C
Planning Regions Total population
Total %
In dwelling structures Type A (60%)
In dwelling structures Type B (40%)
Total % Total %
Bulgaria 7,761,049 5,431,846 70% 3,259,108 2,172,738 2,329,203 30% 45,01,941 58% North - West 503,065 297,373 59% 178,424 118,949 205,692 41% 324,641 65% North Central 1,153,950 784,498 68% 470,699 313,799 369,452 32% 683,251 59% North - East 1,278,112 826,163 65% 495,698 330,465 451,949 35% 782,414 61% South - East 777836 532,450 68% 319,470 212,980 245,386 32% 458,366 59% South Central 1,933,271 1,269,908 66% 761,945 507,963 663,363 34% 1,171,326 61% South - West 2,114,815 1,721,454 81% 1,032,872 688,582 393,361 19% 1,081,943 51% SW: Sofia capital 1,221,157 1,164,749 95% 698,849 465,900 56,408 5% 522,308 43%
Source: BGNSI (2007b) and own calculations
The table reveals that 70% of the Bulgarian population is living in urban areas. Wiegel and Ebert (2005) assume that on average 60% of the urban population dwells in Type A structures and the rest dwells in Type B. Still, more than half of the Bulgarian population is living in family houses and not in apartment buildings. According to the statistical estimations and analysis made by BGNSI, the urban population is expected to increase with 5 to 10% in the next 10 years.
The interim report from the project of development the BioWS suggests that there is no relationship between the MSW generation rates and the number of apartments or houses in a given settlement. A general conclusion is that in smaller cities major part of the population lives in single family houses (Type B and C) as for big cities the majority of the population lives in flats. The bigger the settlement, the smaller the amount of Type B and C dwellings as related to A.
It can be expected that the waste composition will depend not only on the number of inhabitants and type of dwellings but also on the social and economic level of development of the settlement. Such integrative classification is made by the Ministry of Regional Development and Public Works (MRDPW, 2004). According to the methodology published on the ministry’s website the classification includes the following criteria:
• Demographics – population (number), age dependency coefficient (%) (population under 15 and over 65 relative to 100 persons of age between 15 and 65).
• Urbanization – Houses with concrete support structure related to total number of houses (%).
• Infrastructure:
18

o Technical – transportation (types of roads), energy (electrified houses), water (municipal drinking and wastewater management) and communications (post offices, telephones).
o Social – number of hospitals, schools and other social care facilities.
According the above classification there are nine functional types of settlements from Zero to Eight inclusive, with Zero being the highest score (Table 4-2). This allows settlements with different population to be grouped according to the level of development, which is assumed to correspond to a specific MSW composition.
Table 4-2 Number of settlements and population by functional type, as per 31.12.2004
Functional type
Number of Settlements Population Min Population Max Total population
Zero 1 1,138,950 1,138,950 1,138,950 One 17 63,864 341,464 2,117,098 Two 38 14,057 53,488 1,113,249 Three 83 2,564 15,806 707,491 Four 150 663 8,691 504,551 Five 648 179 4,733 976,180 Six 772 146 1,582 541,594 Seven 1,622 7 955 552,101 Eight 2,002 0 381 109,835 Total 5,333 0 1,138,950 7,761,049
Source: BGNSI (2007a and 2007b) and own calculations
4.3.2.2 Waste composition The initial research showed that there are very few analyses of MSW in Bulgaria. A good overview of the available material until now is given by Wiegel and Ebert (2005). After reviewing the presentation and the conclusions of the Bulgarian waste composition data in their report it was considered that the survey made by BT-Engineering in 2003 (BT-Engineering, 2004) gives the best estimations of the composition of the MSW in Bulgaria. The data presented in Table 4-3 is one of the results from the BT-Engineering survey and has undergone statistical evaluation.
The data in Table 4-3 makes no other distinction between the different types of settlements and is focused mainly on the population. The division of the settlements by functional type (Table 4-2) is quite detailed for the purpose of this study and it is difficult to associate waste composition with each one of them based solely on the number of inhabitants.
19

Table 4-3 BT-Engineering survey: MSW composition in accordance to the number of inhabitants in a settlement
Population distribution
under 3,000 inhabitants
3,000 to 25,000 inhabitants
25,000 to 100,000 inhabitants
over 100,000 inhabitants
Waste composition % kg/cap/a % kg/cap/a % kg/cap/a % kg/cap/a A. Organic 1. Food waste 4-6 6-11 12-14 39.5-51 16-18 61-76 20-22 84-100
2. Paper and cardboard 4-6 6-11 6-8 20-29 8-10 30-42 10-12 42-54.5
3. Plastics 5-6 7.5-11 7-9 23-33 7-9 26-38 7-9 29.5-41 4. Textiles 3-4 4.5-7 4-5 13-18.5 3-4 11-17 3-4 12.5-18 5. Rubber 1-1.5 1.5-2.5 0.5-1 1.5-3.5 1-1.5 4-6 1-1.5 4-7 6. Leather 1-1.5 1.5-2.5 1-2 3.5-7.5 1-1.5 4-6 1.5-2.5 6.5-11.5 7. Garden waste 12-16 18-29 12-16 39.5-58.5 9-11 34-46 5-7 21-32 8. Wood 2-2.5 3-4.5 2-2.5 7-9 1.5-2.5 6-10 1.5-2 6.5-9 B. Inorganic 1. Glass 5-6 7.5-11 3-4 10-14.5 5.5-6.5 21-27 7-8 29.5-36.5 2. Metals 2.5-3.5 3.5-6.5 1-1.5 3.5-5.5 2-3 8-13 2.5-3.5 10.5-16 3. Inert 6-7.5 9-13.5 1-1.5 3.5-5.5 2-3 8-13 3-4 12.5-18 C. Others
1. Ash, soil, natural fertilizer, etc. 54.5-39.5 82-70.5 50.5-35.5 166-129.5 44-30 167-126 38.5-24.5 161.5-111.5
Total 100 150-180 100 330-365 100 380-420 100 420-455 Source: BT Engineering, 2004
It is reasonable to assume that the higher the number of the population the higher the impact it will have on the final classification according to functional type (MRDPW, 2004). Further, it is apparent that the different functional types overlap in population number the lower the total population actually is. That is why the nine functional types were aggregated in three groups:
• Large settlements – this group includes the settlements classified as functional type Zero and One, and comprises of 18 settlements including the capital Sofia with 42% of the Bulgarian population. The group is associated with waste composition corresponding to over 100,000 inhabitants in the BT-Engineering report.
• Medium settlements – this group includes the settlements classified as functional type Two, Three and Four and comprises of 271 settlements with 30% of the nation’s population. The group is associated with waste composition in the range between 3,000 and 100,000 inhabitants in the BT-Engineering report.
• Small settlements – this group includes the settlements classified as functional type Five, Six, Seven and Eight and comprises of 5,044 settlements holding 28% of the nation’s total population. The group is associated with waste composition corresponding to 3,000 inhabitants and below in the BT-Engineering report.
The information used as input for ORWARE is presented in Table 4-4.
20

Table 4-4 Waste composition and generation rates used for the ORWARE model calculations, 2004
Settlement distribution Small settlements
(2,179,710 inhabitants)
Medium settlements (2,325,291 inhabitants)
Large settlements (3,256,048 inhabitants)
Waste composition % kg/cap/a % kg/cap/a % kg/cap/a A. Organic 1. Food waste 6.0 10.50 15.0 57.00 21.0 90.30 2. Paper and cardboard 5.0 8.75 8.0 30.40 11.0 47.30 3. Plastics 5.0 8.75 7.0 26.60 9.0 38.70 4. Textiles 3.0 5.25 5.0 19.00 4.0 17.20 5. Rubber 1.0 1.75 1.0 3.80 1.5 6.45 6. Leather 1.0 1.75 1.5 5.70 1.5 6.45 7. Garden waste 14.0 24.50 16.0 60.80 8.0 34.40 8. Wood 2.5 4.38 2.0 7.60 1.5 6.45 B. Inorganic 1. Glass 5.0 8.75 4.0 15.20 7.0 30.10 2. Metals 3.5 6.13 1.5 5.70 3.0 12.90 3. Inert 7.0 12.25 1.5 5.70 3.0 12.90 C. Others 1. Ash, soil, natural fertilizer, etc. 47.0 82.25 37.5 142.50 29.5 126.85
Total 100 175 100 380 100 430
There is a difference between the MSW generation rate that is given as an average of 472 kg/cap/a for the country for 2004 and the average that can be calculated from the ORWARE input data (comparing data in Table 4-4 and Table 3-1). A possible explanation is that in Bulgaria it is a common practice to dispose of construction and demolition, as well as non-hazardous industrial waste along with municipal household waste. The quantities of the generated MSW are assessed on the basis of the transport documents of the collection companies who benefit directly from reporting higher amounts.
Control is also quite loose as only 35 or 5.5% out of the 633 MSW landfills active in 2004 had weighting bridges which is an improvement as compared to 18 or 2% in 2002. Still, it is not enough to provide good information about the actual amounts. BGNSI uses surveys filled by the municipalities and collector companies to estimate collected waste quantities. Extrapolation is used to compensate for the generated quantities by the households not covered in any organized municipal waste collection system.
It was considered that the information presented in the BT-Engineering report was from actual on-site investigation and the figures are accurate for the samples that have been taken. Even though the analysis includes data from different seasons and settlement types, the results may be not so representative for the whole country. Besides that, it is considered that the data is as close to reality as possible and was used for the basis for the ORWARE input.
4.3.2.3 Uncollected waste As mentioned before, about 85% of the population is served by organized MSW collection systems in 2004 and the rest of the generated MSW is disposed of without control. The actual amount is estimated based on the average waste generation rate for the country before presenting the final annual figures by BGNSI. This MSW is generated in remote rural areas where one or more small settlements usually have a local “landfill” that uses natural features
21

such as depressions. It is common practice to burn the dumped waste in order to diminish its quantity and to prevent the spread of infectious diseases as the dumping sites are open and no soil layer is used to cover them.
The composition of the uncollected MSW is assumed to be that of the settlements from which it is generated (Table 4-4). The amounts vary between the three settlement types as the coverage of the MSW collection systems changes. The environmental effects will arise partly from the uncontrolled open air burning and partly from the degradation of the rest of the waste.
4.3.3 Systems analysis of waste management Nowadays the waste management systems are becoming more complex as often a mix of different treatment methods are used in combination. The past practice of using only one treatment option, landfilling, is becoming obsolete in the technically advanced countries but still is the only MSW treatment method in many countries around the world.
The waste management system is not isolated from the rest of society. It has links to the resource extraction, production and consumption patterns in the society as well as to the energy system. The more advanced the waste management system is, the more the interactions between it and the other technical systems are. The interactions with the environment and the social system are none the less complex and important.
The high level of complexity calls for a specific form of analysis that will allow understanding not only the waste management system, core system, but also its relationships with other systems, or external systems up- and downstream. Systems analysis offers such a possibility by representing complex systems with sub-systems that comprise it that also are described in more detail by sub-systems and so on. In this way there is a clear hierarchical structure (Figure 4-1).
Figure 4-1 Hierarchical structure of a system containing sub-systems with higher detail
Source: Björklund, 2000
Systems analysis is a systematic investigation of an existing or imaginative system, its components, their relations to each other as well to other systems (Björklund, 2000). For the purpose of this study systems analysis refers to the process of analysing the complex technical, natural and social systems to help planning, policy and decision making. By understanding the behaviour of the sub-systems and the links between them the effects of different decisions can be assessed and the performance of the whole system can be improved. This also allows avoiding loosing resources to optimize a part of the system that seems
22

straight forward but will have less effect than to optimize an unconsidered sub-system which will actually make a difference.
As previously stated, the complexity of the WMS requires a systems perspective in order to analyse it not only from a technical point of view but also to understand its interactions with other systems within the society. Often computer models are used for practical reasons to allow the creation of scenarios and perform experiments that would otherwise be impossible in the real world. A good description of the history of use and development of waste management models is given by Björklund (2000).
4.3.4 General description of ORWARE ORWARE is a tool for environmental systems analysis of waste management and the acronym comes from the description of its initial function (ORganic WAste REsearch) . It is a computer-based model for calculation of material and substance flows, environmental impacts, and costs of waste management systems. The ORWARE model has been developed in cooperation between four different research institutions in Sweden: KTH - Royal Institute of Technology, IVL - Swedish Environmental Research Institute, JTI – Swedish Institute of Agricultural and Environmental Engineering and SLU – Swedish University for Agricultural Sciences. It was initially intended for assessment of environmental impact from biodegradable waste handling in municipal waste management systems from a systems perspective. Its initial use was in a number of Swedish municipalities (Björklund, 2000).
ORWARE consists of separate sub-models (Figure 4-2), which may be combined to design any waste management system. In each sub-model is calculated the turnover of materials, energy and financial resources (Eriksson et al, 2002). ORWARE is a model primarily for Material Flows Analysis (MFA). The material flows from different sources are followed through different methods for waste treatment to different end uses. Emissions from all steps along that chain are allocated as emissions to air, water and soil. Life Cycle Assessment (LCA) methodology is used for impact analysis and the environmental impact for selected categories are calculated (Dalemo et. al, 1997).
Figure 4-2 Conceptual design of a process sub-model in ORWARE
Source: Eriksson et al, 2002
23

The initial description of the model is given by Dalemo et al (1997). Later it was developed to include the non-biodegradable fraction in the MSW and to calculate costs of waste management. A schematic representation of the waste management system in ORWARE is shown on Figure 4-3. More detailed descriptions of different parts of the model can be found in Björklund (1998), Sonesson (1998) and Dalemo (1999). The present level of development of the model is given by Eriksson et al (2002).
Figure 4-3 Conceptual representation of the MSWM system in ORWARE
Source: Eriksson, 2003
In the conceptual representation of ORWARE (Figure 4-3) at the top are found the different waste sources followed by different transportation and treatment methods (Eriksson et al, 2002). The solid line encloses the core waste management system in which primary and secondary wastes are treated and different products are formed. The primary waste is the one entering the system, while secondary waste is the one generated within the system as a result of the different treatment processes applied.
In the practical implementation of ORWARE, all sub-models are modelled in the Matlab software with its graphical interface Simulink (Mathworks Inc., 2005). This allows the connection between the separate sub-models to form a complex system. For practical purposes the results from the simulations are transferred to Excel worksheets in which data is aggregated and the results from the impact assessment are presented for the selected impact categories.
4.3.5 System boundaries The system boundaries represent a barrier between the system that is studied and the surrounding environment. They determine what shall be analysed and what should be left out of the analysis. In this way the setting of the system boundaries can have great impact on the final results. The system boundaries have three dimensions: time, space and function. They depend on the particular system that is being investigated. In general annual averages are used as input data for the model and the different sub-models as one year is the most commonly defined as temporal boundary. The only exceptions are the landfill and arable land sub-models in which long term effects are also included.
24

The system boundaries in ORWARE are directly related to the main function of the waste management system – collection and treatment of waste. Depending on the structure of the WMS they may also be geographical or political. Energy and resource consumption, production, emissions to air, water and soil are related to the quantity and composition of the material flow through the processes. Besides the core function, additional functions like generation of electricity, district heating, or nitrogen and phosphorus can be delivered from the WMS.
4.3.5.1 Time Every study should be defined for a specific time period (years, centuries, etc) for which inputs and outputs of the system should be included. Therefore, processes like landfilling are challenging to study as the emissions are generated over extended periods of time. ORWARE calculates the impacts caused by the WMS during one year in the selected area. Most of the emissions occur immediately but in the case of landfilling they continue more than 50 years; that is why those effects are included in the results (Bjorklund, 2000).
4.3.5.2 Space According to Björklund (2000), the geographical borders or boundaries of the analysis are determined by for instance political boundaries (e.g. a municipality, county, or nation) or natural boundaries (e.g. an ecosystem, lake or watershed). In ORWARE the space boundary is set by the geographical boundaries of the waste collection system. The impacts of emissions and resource use are included in the analysis despite the fact that they may arise not only from the core system, but from the upstream and downstream systems as well.
4.3.5.3 Functional unit The main function of a waste management system is to treat a certain amount of waste generated within the defined area (Björklund, 2000). Today, many waste management systems provide additional functions like energy or heat generation in addition to waste treatment. As the functional units are used as basis for impact quantification, meaning that all impacts are given per functional unit, all scenarios should fulfil those functions to the same degree. To make results comparable, all scenarios should have exactly the same functional outputs and the ones that do not have them should be compensated for. This is achieved by expanding the system boundaries to include different compensatory processes (Eriksson, 2003).
As the system in ORWARE uses cradle-to-grave perspective borrowed from LCA it should include all the processes that are connected to the life-cycle of the treated waste. This is done by enlarging the core (waste management) system to take into account relevant up-stream (e.g. energy production) and down-stream (e.g. biogas usage) activities and processes. Up-stream material flows related to energy production are included into the ORWARE model (Eriksson, 2003). As are down-stream flows associated with the spread on land of the digestion residue from anaerobic digestion for example.
The compensatory systems (CS) also have up- and down-stream systems that are connected to them. Therefore the conceptual model of the total system in ORWARE is enlarged and comprises of the core (waste management) system, the compensatory system and their respective up- and down-stream systems (Figure 4-4).
25
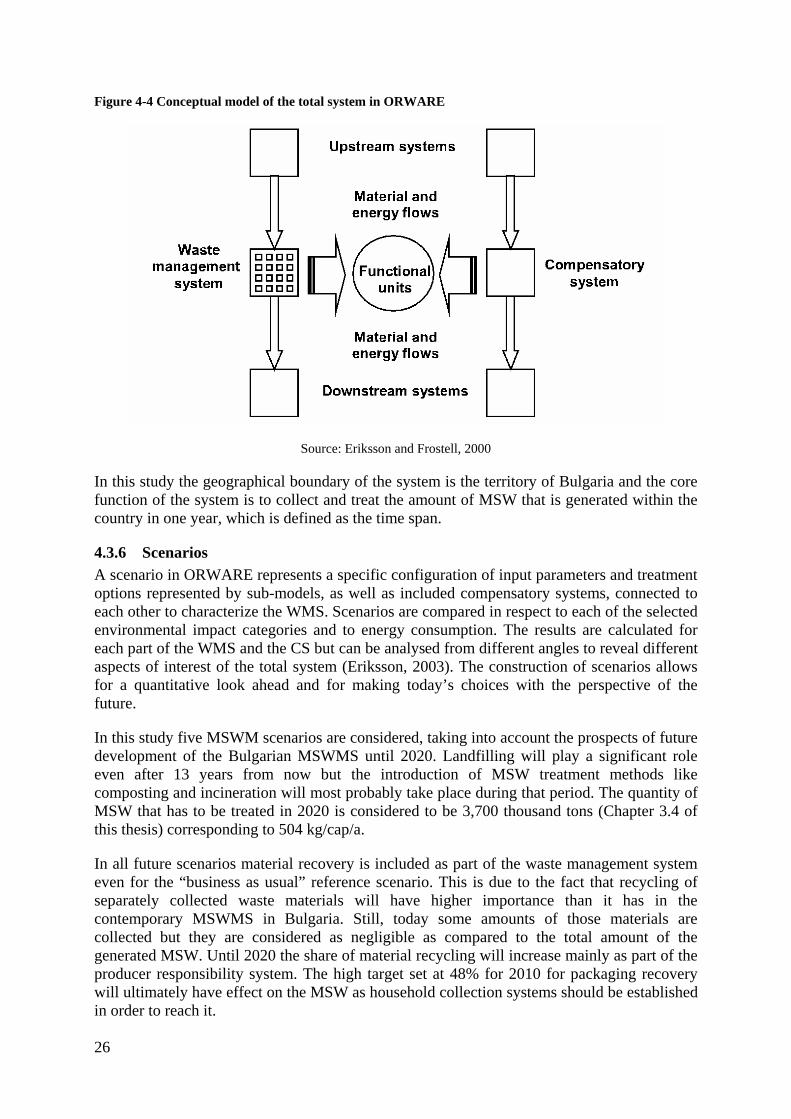
Figure 4-4 Conceptual model of the total system in ORWARE
Source: Eriksson and Frostell, 2000
In this study the geographical boundary of the system is the territory of Bulgaria and the core function of the system is to collect and treat the amount of MSW that is generated within the country in one year, which is defined as the time span.
4.3.6 Scenarios A scenario in ORWARE represents a specific configuration of input parameters and treatment options represented by sub-models, as well as included compensatory systems, connected to each other to characterize the WMS. Scenarios are compared in respect to each of the selected environmental impact categories and to energy consumption. The results are calculated for each part of the WMS and the CS but can be analysed from different angles to reveal different aspects of interest of the total system (Eriksson, 2003). The construction of scenarios allows for a quantitative look ahead and for making today’s choices with the perspective of the future.
In this study five MSWM scenarios are considered, taking into account the prospects of future development of the Bulgarian MSWMS until 2020. Landfilling will play a significant role even after 13 years from now but the introduction of MSW treatment methods like composting and incineration will most probably take place during that period. The quantity of MSW that has to be treated in 2020 is considered to be 3,700 thousand tons (Chapter 3.4 of this thesis) corresponding to 504 kg/cap/a.
In all future scenarios material recovery is included as part of the waste management system even for the “business as usual” reference scenario. This is due to the fact that recycling of separately collected waste materials will have higher importance than it has in the contemporary MSWMS in Bulgaria. Still, today some amounts of those materials are collected but they are considered as negligible as compared to the total amount of the generated MSW. Until 2020 the share of material recycling will increase mainly as part of the producer responsibility system. The high target set at 48% for 2010 for packaging recovery will ultimately have effect on the MSW as household collection systems should be established in order to reach it.
26

4.3.6.1 ORWARE input data Recent data from Sweden about packaging waste collected from households shows that it is possible to achieve a high degree of collection of this type of waste (RVF, 2006). In 2005 83% of the paper, 70% of the cardboard and 96% of the glass were recovered through material recycling from the MSW. Metal and plastic packages have lower recovery rate which is 66% and 20% respectively. Such high recovery rates are quite unlikely for Bulgaria; hence, more modest targets are set for this study (Table 4-5). The last column in the table shows minimum EU average achievable recycling rates according to a recent study made by RDC-Environment and Pira International (2003).
Table 4-5 Material recovery rates from household waste, %
Recovered constituent from MSW Bulgaria 2020
Sweden 2005
EU average
Paper, paperboard, paper products 30 70 60 Plastics 15 20 28 Glass 50 96 53 Metals 20 66 60 Organic material 25 35* -**
* - Assuming 30% organic fraction in the MSW ** - No data about organic materials was available in the report
Source: Own estimations, RVF (2006) and RDC-Environment & Pira International (2003)
The landfilling of biodegradable waste has to decrease to 35% as compared to the 1995 baseline quantity which for Bulgaria has to be 787 thousand tons in 2020 (MOEW, 2007b). This target can be achieved by 25% recovery from the MSW in 2020.
The information about the waste composition as presented in Table 4-4 is used as a basis for the calculation of the input composition used for the 2004 and 2020 scenarios. The main assumption is that the composition of the waste is the composition of the collected household waste. The rest of the amount to come to the reported by the official statistics is other waste that is disposed of at landfills with different origin (Table 4-6). The main part is demolition and construction waste and there are organic components in it which might contribute around 20% of the total amount (Wiegel and Ebert, 2005).
It is hard to determine exactly the composition of the other waste contributing to the total amount of MSW without extensive analysis and control of the waste disposed at landfills. Still, it is reasonable to assume that most of it will be inert material including glass and metal. There will be wood, plastics, paper and textiles in small quantities that will contribute to the combustible rest fraction of the waste. Further, in highly urbanized areas the fraction of concrete, metals and other inert materials will be higher than that in rural areas where components that contribute to the combustible fraction will be more. Table 4-6 shows the assumed values of non-combustible and combustible parts of the other waste.
27

Table 4-6 Calculation of the total MSW amount based on collected and other waste disposed with it
Other waste Waste fraction Settlement distribution
Collected waste Non
combustible Combustible Total other waste
Total MSW
Small settlements (2 179 710 inhabitants, 28%)
% 59 60 40 41 100 kg/cap/a 175 72 48 120 295 1000 t/a 381 157 105 262 643 Medium settlements (2 325 291 inhabitants, 30%)
% 75 70 30 25 100 kg/cap/a 380 88 38 125 505 1000 t/a 884 204 87 291 1174 Large settlements (3 256 048 inhabitants, 42%)
% 75 80 20 25 100 kg/cap/a 430 112 28 140 570 1000 t/a 1400 365 91 456 1856 Country average 2004 (7 761 049 inhabitants, 100%)
% 73 72 28 27 100 kg/cap/a 343 93 36 130 473 1000 t/a 2665 726 283 1008 3673
The ORWARE input requires the data about waste composition to be aggregated into 12 categories (Table 4-7). These are used to combine the data presented in Table 4-4 and Table 4-6 to get the final input values for the different settlement types in 2004.
Table 4-7 Waste composition and population distribution according to settlement types, 2004
Total population 7,761,049
Small settlements (2,179,710 inhabitants, 28%)
Medium settlements (2,325,291 inhabitants, 30%)
Large settlements (3,256,048 inhabitants, 42%)
Waste fractions % kg/cap/a 1,000 t/a % kg/cap/a 1,000 t/a % kg/cap/a 1,000 t/a
Organic waste 16 46 101 30 150 349 27 155 504
Non-combustible rest
36 108 238 27 136 316 30 163 531
Combustible rest 36 106 230 27 137 319 20 117 380 Paper 1 4 8 4 18 42 5 28 92 Cardboard 2 5 11 2 12 28 3 19 62 HDPE 1 4 8 2 11 25 3 15 50 LDPE 2 5 11 3 16 37 4 23 76 Rubber 1 2 4 1 4 9 1 6 21 Diapers 0 0 0 0 0 0 0 0 0 Laminate 0 0 0 0 0 0 0 0 0 Glass 3 9 19 3 15 35 5 30 98 Metal 2 6 13 1 6 13 2 13 42 Total 100 295 643 100 505 1,174 100 570 1,856
In the analysis, the organic waste fraction is a collective name and includes food waste, garden waste, wood textiles and leather. The available data for paper and cardboard is a collective figure and it is assumed that 40% of it is paper and 60% cardboard. The same
28
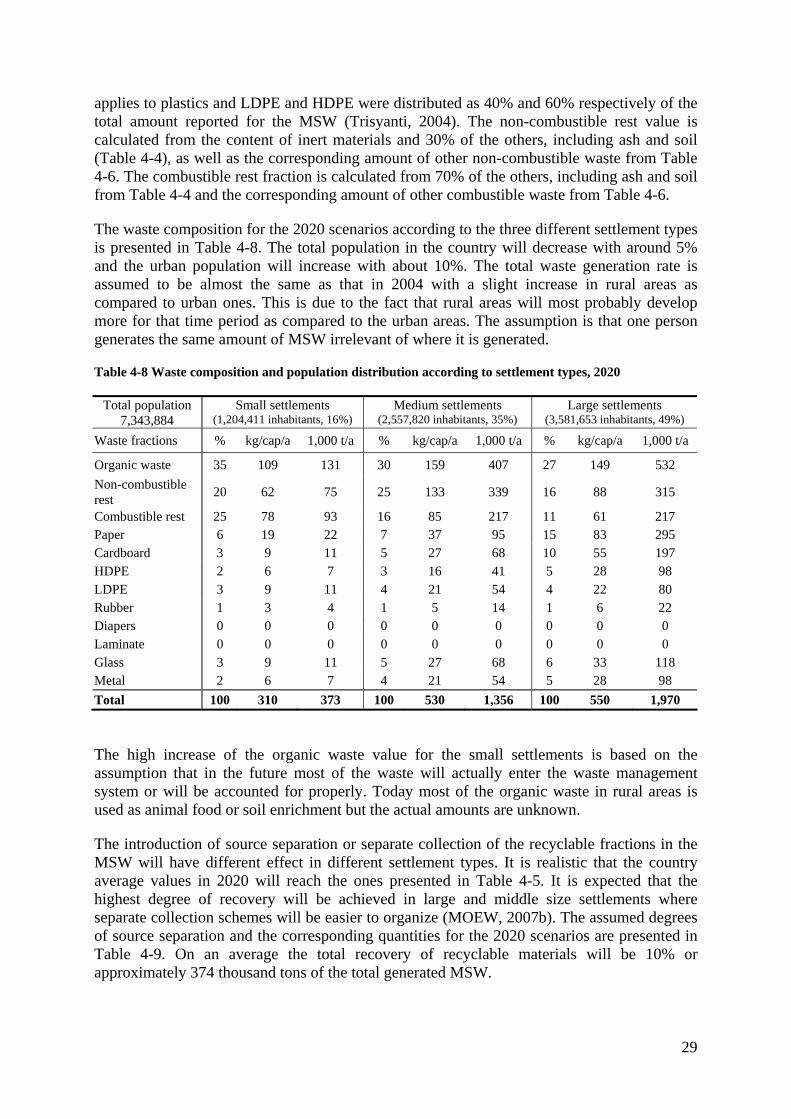
applies to plastics and LDPE and HDPE were distributed as 40% and 60% respectively of the total amount reported for the MSW (Trisyanti, 2004). The non-combustible rest value is calculated from the content of inert materials and 30% of the others, including ash and soil (Table 4-4), as well as the corresponding amount of other non-combustible waste from Table 4-6. The combustible rest fraction is calculated from 70% of the others, including ash and soil from Table 4-4 and the corresponding amount of other combustible waste from Table 4-6.
The waste composition for the 2020 scenarios according to the three different settlement types is presented in Table 4-8. The total population in the country will decrease with around 5% and the urban population will increase with about 10%. The total waste generation rate is assumed to be almost the same as that in 2004 with a slight increase in rural areas as compared to urban ones. This is due to the fact that rural areas will most probably develop more for that time period as compared to the urban areas. The assumption is that one person generates the same amount of MSW irrelevant of where it is generated.
Table 4-8 Waste composition and population distribution according to settlement types, 2020
Total population 7,343,884
Small settlements (1,204,411 inhabitants, 16%)
Medium settlements (2,557,820 inhabitants, 35%)
Large settlements (3,581,653 inhabitants, 49%)
Waste fractions % kg/cap/a 1,000 t/a % kg/cap/a 1,000 t/a % kg/cap/a 1,000 t/a
Organic waste 35 109 131 30 159 407 27 149 532 Non-combustible rest 20 62 75 25 133 339 16 88 315
Combustible rest 25 78 93 16 85 217 11 61 217 Paper 6 19 22 7 37 95 15 83 295 Cardboard 3 9 11 5 27 68 10 55 197 HDPE 2 6 7 3 16 41 5 28 98 LDPE 3 9 11 4 21 54 4 22 80 Rubber 1 3 4 1 5 14 1 6 22 Diapers 0 0 0 0 0 0 0 0 0 Laminate 0 0 0 0 0 0 0 0 0 Glass 3 9 11 5 27 68 6 33 118 Metal 2 6 7 4 21 54 5 28 98 Total 100 310 373 100 530 1,356 100 550 1,970
The high increase of the organic waste value for the small settlements is based on the assumption that in the future most of the waste will actually enter the waste management system or will be accounted for properly. Today most of the organic waste in rural areas is used as animal food or soil enrichment but the actual amounts are unknown.
The introduction of source separation or separate collection of the recyclable fractions in the MSW will have different effect in different settlement types. It is realistic that the country average values in 2020 will reach the ones presented in Table 4-5. It is expected that the highest degree of recovery will be achieved in large and middle size settlements where separate collection schemes will be easier to organize (MOEW, 2007b). The assumed degrees of source separation and the corresponding quantities for the 2020 scenarios are presented in Table 4-9. On an average the total recovery of recyclable materials will be 10% or approximately 374 thousand tons of the total generated MSW.
29

Table 4-9 Source separation in 2020
Total population 7,343,884
Small settlements (1,204,411inhabitants, 16%)
Medium settlements (2,557,820 inhabitants, 35%)
Large settlements (3,581,653 inhabitants, 49%)
Waste fractions % kg/cap/a 1,000 t/a % kg/cap/a 1,000 t/a % kg/cap/a 1,000 t/a
Organic waste 15% 16.28 19.60 30% 47.70 122.01 30% 44.55 159.56 Non-combustible rest - - - - - - - - -
Combustible rest - - - - - - - - - Paper 5% 0.93 1.12 25% 9.28 23.72 25% 20.63 73.87 Cardboard 5% 0.47 0.56 12% 3.18 8.13 15% 8.25 29.55 HDPE 5% 0.31 0.37 10% 1.59 4.07 10% 2.75 9.85 LDPE 5% 0.47 0.56 7% 1.48 3.80 7% 1.57 5.62 Rubber - - - - - - - - - Diapers - - - - - - - - - Laminate - - - - - - - - - Glass 5% 0.47 0.56 60% 15.90 40.67 60% 19.80 70.92 Metal 5% 0.31 0.37 25% 5.30 13.56 25% 6.88 24.62 Average/Total 6% 19.22 23.15 16% 84.43 215.95 19% 104.42 373.99
4.3.6.2 Functional units and ORWARE-Bulgaria scenario summary The functional units that were considered in this study for the different scenarios as well as the corresponding compensatory systems are presented in Table 4-10.
Table 4-10 Functional units for the core and compensatory systems
Functional unit Compensatory system MSW treatment - Paper and cardboard production Virgin material replacement – 87% Plastics production Virgin material replacement – 100% Production of compost Mineral fertilizer (N, P) Electricity production Power production from coal – marginal Production of district heating Production of district heating from oil – marginal
A summary of the five scenarios analysed in this study with their specific characteristics are presented in Table 4-11.
30
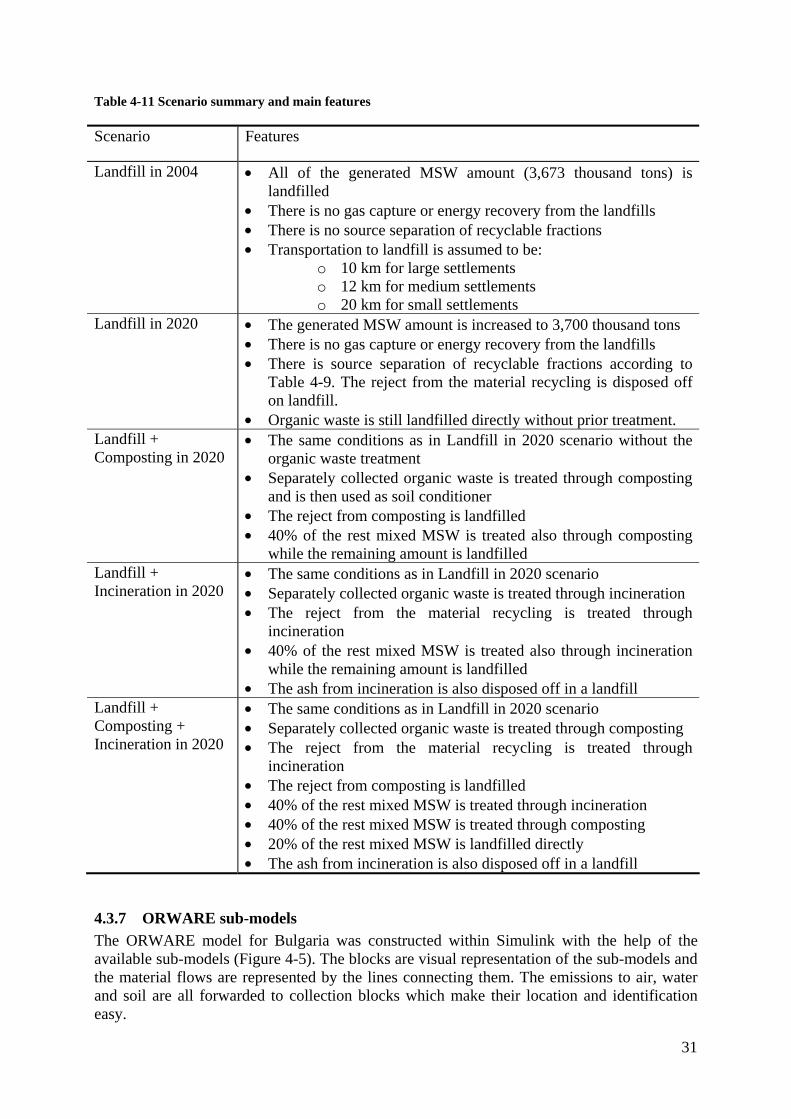
Table 4-11 Scenario summary and main features
Scenario Features
Landfill in 2004 • All of the generated MSW amount (3,673 thousand tons) is landfilled
• There is no gas capture or energy recovery from the landfills • There is no source separation of recyclable fractions • Transportation to landfill is assumed to be:
o 10 km for large settlements o 12 km for medium settlements o 20 km for small settlements
Landfill in 2020 • The generated MSW amount is increased to 3,700 thousand tons • There is no gas capture or energy recovery from the landfills • There is source separation of recyclable fractions according to
Table 4-9. The reject from the material recycling is disposed off on landfill.
• Organic waste is still landfilled directly without prior treatment. Landfill + Composting in 2020
• The same conditions as in Landfill in 2020 scenario without the organic waste treatment
• Separately collected organic waste is treated through composting and is then used as soil conditioner
• The reject from composting is landfilled • 40% of the rest mixed MSW is treated also through composting
while the remaining amount is landfilled Landfill + Incineration in 2020
• The same conditions as in Landfill in 2020 scenario • Separately collected organic waste is treated through incineration • The reject from the material recycling is treated through
incineration • 40% of the rest mixed MSW is treated also through incineration
while the remaining amount is landfilled • The ash from incineration is also disposed off in a landfill
Landfill + Composting + Incineration in 2020
• The same conditions as in Landfill in 2020 scenario • Separately collected organic waste is treated through composting • The reject from the material recycling is treated through
incineration • The reject from composting is landfilled • 40% of the rest mixed MSW is treated through incineration • 40% of the rest mixed MSW is treated through composting • 20% of the rest mixed MSW is landfilled directly • The ash from incineration is also disposed off in a landfill
4.3.7 ORWARE sub-models The ORWARE model for Bulgaria was constructed within Simulink with the help of the available sub-models (Figure 4-5). The blocks are visual representation of the sub-models and the material flows are represented by the lines connecting them. The emissions to air, water and soil are all forwarded to collection blocks which make their location and identification easy.
31

Figure 4-5 The ORWARE model built for Bulgaria as presented in Simulink
There are three decision blocks which direct the waste flows in specific directions according to the scenario that is being simulated: one directing the separately collected organic waste to landfill, composting or incineration; one diverting part of the rest mixed household waste to landfill, composting or incineration; and one for directing the reject from material recycling to landfill or incineration.
The model diagram also shows a number of summation blocks which combine the input material flows into one output as needed for the following treatment option. The ORWARE sub-models are described in more detail in the following sections.
4.3.7.1 Waste sources and fractions Three sources of MSW were modelled in this study: Small, Medium and Large settlements. For each source the different fractions comprising the mixed MSW are determined: organic waste, non-combustible rest, combustible rest, paper, cardboard, HDPE, LDPE, rubber, diapers, laminate, glass and metal. The simulation begins at the point where the MSW is collected and the activities concerning the actual generation are excluded from the system. Each fraction is characterized by a set of parameters describing its chemical composition (Eriksson et al, 2002):
• Parameters of environmental relevance: heavy metals, NOx, SO2, HCl, PCB, dioxins, PAH, AOX, CH4, CO, CHX, CO2, BOD, COD, NH3/NH4, P, NO2−/ NO3 −, etc.
• Parameters of relevance to process performance: C, H, O, N, P, H2O, VS, energy, etc.
• Parameters of economic relevance: CH4, N, P, etc.
32

• Parameters that characterise the material recovery: paper, plastic, metals, etc.
The amounts of these parameters in kilograms per year serve as the basis for the flow calculation through the system. In order to set all the parameters to their site specific value a lot of data from previous chemical analyses should be available. During the initial data mining performed within this study no information was found that concerns chemical analysis of MSW in Bulgaria. It is obvious that the morphology of the waste determines to a great extend the chemical composition but it will vary between different places and in time. Data from the ORWARE Stockholm model was used as input for the parameter vector describing the chemical composition of the MSW (Björklund et al, 2003).
4.3.7.2 Transport There are different types of sub-models describing vehicles for different types of transports. For collection of waste, there are back-packer and front-loader models. For transport of primary and secondary waste like fly ash and slag there are three sub-models: ordinary truck, truck and trailer and barge for transports at sea. Data on average load, average speed, etc. is used as input in all transport sub-models. The output is total energy consumption, time consumption and costs. Emissions are calculated from the energy consumption.
The transport sub-model of ORWARE is further described in Sonesson (1996) and in Sonesson (1998).
For the simulations back-packer trucks are used to collect the MSW from the sources, ordinary trucks to transport the ash and slag from incineration to landfill, and truck with trailer to transport the compost for land application.
4.3.7.3 Landfill The MSW, sludge, fly ash and slag are modelled separately in the landfill sub-model. The sub-models are thought to work as Swedish ‘average landfills’, and the site specific adjustments are few. It is possible to adjust the efficiency of the landfill gas recovery as well as the type of leachate treatment used. Energy consumption in form of electricity and diesel oil is accounted for and product outcome is bio-cell. Energy is generated as heat and/or electricity from gas-fired engines.
Waste landfilled today will cause emissions during a long period of time; that is why it is challenging to compare the emissions from the landfill with the instant emissions from the other processes in the system. To include only instant landfill emissions would underestimate the total impact. The future impacts from landfilling are separated in two time periods, the definitions of which are different between the different landfill types:
• Surveyable time (ST): The time until the most active processes in the landfill has ended and the landfill has reached a pseudo steady-state. That is around 100 years for mixed waste and 10-20 years for sludge and organic waste. In the case of incineration ash and slag, the surveyable time corresponds to the time needed for highly soluble substances such as alkaline salts to leak out to a large extent.
• Remaining time (RT): The time until all of the landfilled material has been spread out in the environment through gas emissions, leaking, erosion and possible inland ices. The remaining time includes the emissions in a kind of worst case scenario.
33

The degradation of the mixed MSW is modelled as being anaerobic during ST. Proteins, fats and easily degradable carbohydrates are converted to CO2 and CH4, 70% of semi-stable carbohydrates, like cellulose, are degraded while lignin and plastic material are not degraded at all. 90% of all nitrogen in the form of ammonium and 2% of the phosphorus are leached into water, as well as 0.1 – 0.3% of the heavy metals (Björklund, 1998).
4.3.7.4 Incineration The incineration sub-model consists of three parts: pre-treatment, incinerator and air pollution control (Eriksson et al, 2002). The pre-treatment provides baling of the incoming waste which makes it possible to store waste and combust it later. In the incinerator the waste is combusted and the outputs are raw gas, slag and fly ash. The raw gas is led to the air pollution control and the clean gas is released as air emissions. A sub-model for flue gas condensing is included which may be used for more efficient energy recovery. The condense water is cleaned before it is emitted. The energy recovered in this sub-model is district heating and/or electricity.
Emission factors are calculated from material balances over each process and are:
• Product related – linearly dependant on the incinerated amount of the substance;
• Process related – dependant on the amount of waste incinerated;
• Threshold related – modelled to generate a constant emission level which most often is set by some kind of regulation.
The air pollution control sub-model is able to remove 95-98% of the dioxin, 99.99% of the dust and 95% of the mercury in the raw gas. However, the clean gas contains 100% of the NOx, CO and CO2 emissions from the raw gas.
The energy recovered from the process is in the form of heat and electricity. The combined heat and power plant (CHP) was used in the model and the total efficiency was 88% - 22% for power and 78% for heat generation.
The incineration sub-model is further described in Björklund (1998).
4.3.7.5 Composting Three different types of composting facilities could be modelled in ORWARE (Eriksson et al, 2002):
• Large-scale reactor composting with/without gas cleaning;
• Large-scale windrow composting with/without gas cleaning;
• Small-scale composting in households.
The models are based on the assumption that the composts are well managed, i.e. no failures occur that will give rise to high emissions of methane and other products of anaerobic conditions. All leachate water is returned to the compost. The degradation process is the same for all three compost types except for the degradation speed. The emissions are theoretically the same. The different compost sub-models generate the same composition of the compost product when processing the same type of waste.
34

The energy consumption of the reactor compost is quite high in terms of electricity, while household composting does not require energy at all. Windrow composting is slightly less energy consuming than the reactor composting. The reactor compost sub-model also gives a possibility to recover some of the heat released during the degradation.
The incoming MSW is screened before the actual process and the reject is transported to landfill or incineration. The aerobic degradation process calculates the composition of the released gas and the mature compost. Under aerobic conditions, organic matter is decomposed to CO2, NH3, N2O, N2, a small amount of CH4, humic acids and cellulose. The different substances that enter the process with the MSW are modelled to degrade to a different extend. Proteins are main nitrogen contributor part of which is found in the mature compost or mineralized in the form of NO3
- or NH4+. Significant amount of the nitrogen is lost as air
emissions.
A more detailed description of the model can be found in Sonesson (1996).
4.3.7.6 Material recycling Presently there are sub-models for recycling of plastics and cardboard and are based on specific Swedish plants (Eriksson et al, 2002). There are no sub-models for glass or metals even though they can be recycled and are assumed to be separated at the source.
The model for plastic recycling represents recycling of polyethylene. Of the incoming plastics to the recycling plant, a certain amount is sorted out as reject and the process itself consumes electricity. The output from the model is emissions to water, waste in the form of sludge and finally plastic granules, which are assumed to replace virgin polyethylene.
In the cardboard recycling model the recycled cardboard needs 15% extra weight to replace virgin cardboard. The cardboard recycling plant give rise to emissions to water, energy related emissions to air, energy consumption and waste in form of bio-sludge and plastic reject.
The material recycling sub-model is further described in Sundqvist et al (2000).
4.3.7.7 Spreading of compost The sub-model for spreading of organic fertiliser uses mature compost from the composting sub-module as input. It can also use the sludge from anaerobic digestion if it is used in the ORWARE model. It is divided into three steps: calculation of spreading areas and transport distances, transport of residues from treatment plant to centre of spreading areas and finally the spreading itself (Eriksson et al, 2002). The maximum spreading of residues per hectare is determined from its contents of phosphorus and nitrogen.
The transport of the residue is performed by truck as described in the Transportation sub-model, see description for the transport sub-models. The distance to and the area of each spreading area is used as input data and the model calculates the total distance and energy consumption. The model determines what kind of spreader, for liquid or dry solids, is needed depending on the dry matter content. The spreading model calculates the emissions from the truck transport and the spreading procedure and also energy consumption for the vehicles.
The spreading sub-model is further described in Sundqvist et al (2000).
35

4.3.7.8 Arable land The model calculates the emissions of nitrogen, applied with the mature compost as soil conditioner, as compared to use of mineral fertiliser (Eriksson et al, 2002). Here are calculated the relative rather than absolute values of the parameters in contrast with the other sub-models. Nitrogen is assumed to exist in three forms: ammonia, nitrate and organically bound. The model gives emissions from mineralisation of organically bound nitrogen during the first year after spreading and the long-term effects of mineralisation.
The efficiency with which the crops use the organic fertilisers compared to the mineral fertilisers are 100% for phosphorus, 80% of the mineral nitrogen and 30% of the organically bound nitrogen. The emissions of laughing gas (N2O), nitrate (NO3) and ammonia (NH3) depend on the soil condition, the spreading conditions and climatic region which can be adjusted in the model. The arable land sub-model is further described in Dalemo et al (1998).
4.3.7.9 Up-stream and compensatory systems As in reality, in ORWARE the electricity production is an up-stream system for waste management as is the production of fuel for the vehicles and heat. Those can also be used as compensatory systems when a certain functional unit of the MSWMS needs to be fulfilled. In the model a life-cycle perspective is used for all up-stream and compensatory systems and the environmental impacts are included from raw material extraction to production, i.e. back to their cradle.
The up-stream process of the transport sub-models considers the oil extraction, refinery and production of fuels, while the core system deals with the emissions arising from the direct use of the vehicles. The compensatory production of mineral fertilizer covers the production of nitrogen and phosphorous. The compensatory district heating generation is assumed to use oil as primary energy carrier.
Electricity generation is included both as up-stream and compensatory system. The first uses Bulgarian national power mix while for the other marginal power generation from condense coal fired power plant was selected. The other compensatory and up-stream processes use data from Sweden as it was.
4.3.7.10 Uncollected waste The environmental effects from uncontrolled landfilling are big and to estimate them they had to be included in the analysis. It was assumed, as suggested by Trisyanti (2004), that the uncollected waste is modelled as landfilled with not leachate and gas collection and treatment. The actual effects over the ST and the RT are hard to predict as no soil cover is applied over the waste upon its disposal. Despite, anaerobic conditions are believed to exist in most of the waste volume that is why the landfill sub-model was used.
4.3.8 Simulations The simulations were carried out after the sub-models were connected to form the MSWMS, the scenarios were defined and the necessary input parameters were set in Matlab and Simulink.
The emissions from the core system are being summed up and each substance is weighted according to its impact to the air, water and soil. Five impact categories were used: global warming potential, acidification, eutrophication, photo-oxidant VOC and NOx formation.
36

The same procedure is performed with the up-stream and the compensatory systems that fulfil the functional units. Due to the fact that the functional outputs are the same for all scenarios, the effect from the compensatory system can be calculated as the difference between the maximum output of that functional unit and its production in each scenario. The impacts on air and water are considered for cardboard and plastics production. The rest of the compensatory systems include only air emissions. The total environmental impact of the MWS is then calculated as the sum of the impacts from the core and the external systems.
Energy turnover from the core system includes oil consumption from all collection and transport vehicles, heat and electricity consumption of the different waste treatment processes, and production of heat and electricity from the incineration process. The total energy consumption is thus calculated by summing up the energy consumed by the core and the external systems.
4.4 Inventory of environmental and waste policy related research and topics
This section presents the policy documents and other papers studied to get a better understanding of the factors that shape the current and future development of the environmental and waste management in EU and Bulgaria.
4.4.1 European environmental policy For this study the Thematic Strategy on the prevention and recycling of waste (CEC, 2005c) was the main sources of information about policy issues related to waste management in the EU. In addition, a number of supplemental documents were also reviewed to get a better understanding of the issues, those included:
• Impact Assessment on the Thematic Strategy on the prevention and recycling of waste and the immediate implementing measures (IATS) (CEC, 2004)
• EU Waste Policy – The Story behind the Strategy (CEC, 2005a)
• Proposal for a Directive of the European Parliament and the Council on Waste (CEC, 2005b)
• The revised Waste Framework Directive (Directive 2006/12/EC)
In addition several reports by EC, EEA, Eurostat and other sources were studied, those included:
• Report from the Commission to the Council and the European Parliament on Implementation of the Community Waste Legislation for the Period 2001-2003 (CEC, 2006)
• The European Commission’s White Paper on Governance: A ‘Tool-Kit’ for closing the legitimacy gap of EU policymaking? (Höreth, 2001)
• Information tools for environmental policy under conditions of complexity (Funtowicz et al, 2000)
37

4.4.2 Bulgarian environmental policy The main source of information about Bulgarian waste management policy was the National Waste Management Programme 2003-2007. The National strategy for reducing the quantities of biodegradable waste designated for landfill disposal (MOEW, 2007b) and the interim report used for its development were used as sources of information for the development of the ORWARE model for Bulgaria. The Bulgarian Waste Management Act (WMA) along with its subordinate regulations was also studied as it is the major piece of enforcing legislation and corresponds to the European Waste Framework Directive.
The Ministry of Environment and Waters in Bulgaria is not the only authority which relates to the waste management issues. Several other ministries have guidelines that relate to this topic and those were analysed.
4.4.3 Local/municipal environmental policy in Bulgaria To get a better understanding of the practical implementation of the waste management legislation the municipal waste management plan of Stolichna Obshtina10 (StO) was studied. Its development is required by the Waste Management Act and is done according to a specific methodology which was also examined.
10 Capital municipality
38

5 RESULTS This section of the thesis work is divided into two as previously described in the Methodological outline (Chapter 4.1 of this thesis). The first one presents the results from the ORWARE model simulations and the second one presents the findings from the review and analysis of the policies that relate to waste management in EU and Bulgaria.
5.1 Results from the ORWARE model simulations Simulations were performed after the waste management system of Bulgaria had been designed in Matlab (Figure 4-5). The results from the ORWARE model were transferred in Excel tables where the outputs could be easily analysed. This is done by the use of graphs that make comparison between the different scenarios.
It should be noted that the figures presented in the results are generated from the ORWARE model and have a high number of significant digits. It is acknowledged that such accuracy is not possible in any estimation but for practical reasons the values were not rounded.
5.1.1 Waste treatment in each scenario The major function of the MSWMS is to treat a certain amount of waste that is generated in the country in one year. Even though the total amount of the MSW was considered not to rise significantly from 2004 to 2020 the amount of waste that has to be managed will increase by 10% from 3,093 to 3,407 thousand tons per year (Figure 5-1).
Figure 5-1 Distribution of the total generated MSW to different treatment methods
0
500
1,000
1,500
2,000
2,500
3,000
3,500
4,000
Landfill 2004 Landfill 2020 Lf + Cp 2020 Lf + Inc 2020 Lf + Cp + Inc 2020
Scenarios
Was
te a
mou
nt (1
,000
ton)
Landfill Materials recycling Biological Treatment Incineration Untreated waste
The actual amount of the waste to be treated in each 2020 scenario is higher not only because of the increased coverage of the collection system but also because of secondary waste arising from the materials recycling, composting and incineration processes used in the corresponding scenarios. This is apparent from Figure 5-2 showing an increase of the waste
39

throughput of the WMS from 3,093 thousand tons in 2004 to over 4,013 thousand tons in 2020 for the Lf + Inc 2020 scenario.
Figure 5-2 Distribution of the total managed MSW to different treatment methods, including secondary wastes
0
500
1,000
1,500
2,000
2,500
3,000
3,500
4,000
4,500
Landfill 2004 Landfill 2020 Lf + Cp 2020 Lf + Inc 2020 Lf + Cp + Inc 2020
Scenarios
Was
te a
mou
nt (1
,000
ton)
Landfill Materials recycling Biological Treatment Incineration Untreated waste
Another way to present this is to show what percent of the total generated waste is treated with the different methods in each scenario (Figure 5-3). The actual percent of the waste that is treated through the different methods does not correspond to the values presented in Table 4-11. For example in the Lf + Cp + Inc 2020 scenario the amounts of the MSW that are initially allocated to composting and incineration are 40% each. That is after the untreated waste, organic waste and the recyclable materials have been subtracted from the initial amount generated. It is obvious that compared to the total generated amount, the percent will be less for both methods. Still, there is a significant difference in the calculated actual treatment rates for both methods because the organic waste is composted and part of the waste designated for incineration is rejected and disposed off at landfill.
In all of the simulations, the impacts of the illegal dumping of MSW was modelled using the landfill ORWARE sub-model modified not to include leachate treatment and landfill gas extraction and utilization. As Figure 5-1 and Figure 5-3 show, the amount of untreated waste is considerable and in the 2020 scenarios it is higher than the average material recycling rate that includes plastics, metals, paper and cardboard.
40

Figure 5-3 Percent distribution of the total generated MSW to different treatment methods
0%
10%
20%
30%
40%
50%
60%
70%
80%
90%
100%
Landfill 2004 Landfill 2020 Lf + Cp 2020 Lf + Inc 2020 Lf + Cp + Inc 2020
Scenarios
Landfill Materials recycling Biological Treatment Incineration Untreated waste
5.1.2 Functional unit output The functional unit outputs vary in the different scenarios because of the different amount of treated waste in 2004 and 2020. They also differ depending on the respective treatment methods included (Table 5-1). The processes of metals and glass recycling are not included in the ORWARE model. That is why those are not functional outputs in the classical sense but the figures for the amounts available for recycling are given for completeness.
Table 5-1 Functional unit outputs for the different scenarios
Functional Units Unit Landfill 2004
Landfill 2020
Lf + Cp 2020
Lf + Inc 2020
Lf + Cp + Inc 2020
Managed waste 1,000 t 3,093 3,407 3,407 3,407 3,407 District Heating TJ 0 0 0 7,112,046 7,112,046 Electricity TJ 0 0 0 2,343,419 2,343,419 Phosphorous t 0 0 778 0 778 Nitrogen t 0 0 1,481 0 1,481 Cardboard t 0 35,732 35,732 35,732 35,732 Plastic t 0 118,040 118,040 118,040 118,040 Metals t 0 35,739 35,739 35,739 35,739 Glass t 0 13,506 13,506 13,506 13,506
In the analysis of the environmental impacts from the core system, the functional unit outputs that were not fulfilled in each scenario were compensated within ORWARE so that the final results are comparable. No compensatory systems are included for metals and glass recycling.
41

5.1.3 Environmental impacts
5.1.3.1 Global Warming Potential Global warming potentials (GWPs) are used to compare the abilities of different greenhouse gases to trap heat in the atmosphere to that of carbon dioxide (CO2) and are based on their heat-absorbing ability (USEIA, 2007). Main contributors to this impact category are CO2 of fossil origin, methane, nitrous oxide, HFCs and CFCs. The GWP provides a construct for converting emissions of various gases into a uniform measure denominated in carbon dioxide equivalents.
The impact of the different scenarios in the GWP impact category is presented in Figure 5-4. The highest impact is for the Landfill 2004 scenario which represents the contemporary WMS in Bulgaria. It is obvious that any other option is preferable as compared to it. Even incorporating material recycling in 2020 will only slightly diminish the impact of the MWS in this category. The highest impact when comparing the different treatment options is caused by the landfilling of waste (around 3 400 kiloton of CO2-equivalents).
Figure 5-4 Global Warming Potential from core system
0
500
1,000
1,500
2,000
2,500
3,000
3,500
4,000
Landfill 2004 Landfill 2020 Lf + Cp 2020 Lf + Inc 2020 Lf + Cp + Inc 2020
Scenarios
Kto
n of
CO
2-eq
uiva
lent
Transport Collection Cardboard Recycling Plastic Recycling CompostingIncineration Biogas Utilization Residual Spreading Landfill ST Untreated ST
The most favourable scenario is the Lf + Cp + Inc 2020 where the overall impact is almost one third of that in the Landfill 2020. It is also very useful to illustrate the difference in the impact between the three different treatment options included. Landfilling of 20% of the amount MSW managed in 2020 give rise to more emissions than composting 41% and incineration of 31% of the managed waste.
When comparing the total impact of the system by including the compensatory and upstream systems (Table 5-2) the results show that overall the Lf + Cp + Inc 2020 scenario still has the least impact in the GWP category. The compensatory heat and electricity production in the Lf + Cp 2020 scenario however makes it less favourable as compared to Lf + Inc 2020 as compared to the core system impact.
42

Table 5-2 Global Warming Potential of total system, kiloton CO2-equivalents
Landfill 2004
Landfill 2020
Lf + Cp 2020
Lf + Inc 2020
Lf + Cp + Inc 2020
Core system 5,149 4,856 3,314 2,985 1,899 Upstream system 277 360 360 125 141 Compensatory system 944 643 632 14 58 Total system 6,370 5,859 4,306 3,124 2,098
5.1.3.2 Acidification Acidification is the process whereby air pollution – mainly ammonia, sulphur dioxide and nitrogen oxides – is converted into acid substances (EEA, 2007) which are deposited on the ground with rain fall. This ‘acid rain’ is best known for the damage it causes to forests and lakes. The potential of the different pollutants to cause acidification is expressed as SO2-equivalents in analogy with the GWP.
The impacts of the different scenarios in this impact category are presented in Figure 5-5. It is apparent that the composting treatment process is the highest contributor with incineration following. Overall, the core system impact is highest for the Lf + Cp + Inc 2020 scenario followed by Lf + Cp 2020. The lowest impact is for the Lf 2004 scenario with highest contribution of the waste collection system (56%). The impact of the waste collection system is quite significant in all other scenarios as well.
Figure 5-5 Acidification from core system
0
500
1,000
1,500
2,000
2,500
3,000
3,500
Landfill 2004 Landfill 2020 Lf + Cp 2020 Lf + Inc 2020 Lf + Cp + Inc 2020
Scenarios
Ton
of S
O2-
equi
vale
nt
Transport Collection Cardboard Recycling Plastic Recycling Composting
Incineration Biogas Utilization Residual Spreading Landfill ST Untreated ST
When the total system is considered, the results in this impact category are quite different (Figure 5-6). The impact of the first scenario is increased by a factor of 5.8 with 31% contribution of the compensatory plastic production and 26% for the upstream electricity production. This shows that introducing materials recycling especially of plastics will have a positive effect in this impact category as it will offset the negative impacts from the production from virgin materials. Introduction of incineration will also have positive effect in this impact category as the marginal fuel used for electricity generation is oil.
43

Figure 5-6 Acidification from total system
0
1,000
2,000
3,000
4,000
5,000
6,000
Landfill 2004 Landfill 2020 Lf + Cp 2020 Lf + Inc 2020 Lf + Cp + Inc 2020
Scenarios
Ton
of S
O2-
equi
vale
nt
Core System Compensatory Heating Compensatory Petrol Compensatory Fertilizer
Compensatory Plastic Compensatory Cardboard Upstream Electricity
5.1.3.3 Eutrophication Eutrophication is a process whereby water bodies, such as lakes, estuaries, or slow-moving streams receive surplus of nutrients that stimulate excessive plant growth mainly algae (USGS, 2007). The potency of different substances to contribute to this process is presented in NO2-equivalents.
Figure 5-7 Eutrophication from the core system
0
50,000
100,000
150,000
200,000
250,000
300,000
Landfill 2004 Landfill 2020 Lf + Cp 2020 Lf + Inc 2020 Lf + Cp + Inc 2020
Scenarios
Ton
of N
O2-
equi
vale
nt
Transport Collection Cardboard Recycling Plastic Recycling Composting
Incineration Biogas Utilization Residual Spreading Landfill ST Untreated ST
In this impact category, the major contributor is the landfilling treatment method, followed by the untreated waste disposal (Figure 5-7). The MSW collection and the composting process have a noticeable but still quite low impact as compared to Landfilling.
It is apparent that the overall core system impact, considering the string influence of Landfilling, is in the last scenario in which the amount of the landfilled waste is the least.
44

There is a big difference in the impact between the Landfilling 2020 scenario and the other future scenarios in which the organic waste is treated through composting or incineration. That is because when the organic waste is landfilled all the nutrients present in it leach to the water bodies especially when the leachate is not treated specifically to remove them. That is not the case as the main concern of leachate treatment is the removal of hazardous components as mobilized heavy metals.
When considering the impact of the total system there is no change in the results for the different scenarios. It is worth to mention that the total impacts for the Landfilling 2004 and 2020 scenarios are respectively 9% and 5% higher than that of the core system, which considering the initial values of 222.5 and 251.8 kiloton NO2-equivalents is quite significant. The total system impact for the other three scenarios is respectively 5%, 7% and 2% higher as compared to the core system.
5.1.3.4 Photo-oxidant VOC and NOx A number of man-made pollutants mainly nitrogen oxides and volatile organic compounds (VOC) that are emitted into atmosphere can affect the photochemical activity (EMEP, 2003). Nitrogen oxides are emitted mainly from combustion processes. VOC are emitted from combustion and also by evaporation of fuels and solvents. In the low layers of the atmosphere, they may react, producing other toxic pollutants (mainly ozone). The impact of the different pollutants in this impact category is presented as ethane-equivalents.
Figure 5-8 Photo-oxidant VOC from core system
0
200
400
600
800
1,000
1,200
1,400
1,600
1,800
2,000
Landfill 2004 Landfill 2020 Lf + Cp 2020 Lf + Inc 2020 Lf + Cp + Inc 2020
Scenarios
Ton
of e
then
e- e
quiv
alen
t
Transport Collection Cardboard Recycling Plastic Recycling Composting
Incineration Biogas Utilization Residual Spreading Landfill ST Untreated ST
The impacts of the different waste management scenarios in the photo-oxidant VOC impact category are presented in Figure 5-8. The impact of the core system is dominated by the landfilling treatment process. The second most significant impact is caused by the uncollected waste.
The most favourable waste management system in terms of photo-oxidant VOC formation is the Lf + Cp + Inc 2020 scenario. The impact of this scenario is more than four times less than the Landfill 2020 scenario without considering the uncollected waste contribution. Even if it is considered, the decrease will be quite significant – three fold.
45

Table 5-3 Photo-oxidant VOC from total system, ton of ethene-equivalent
Landfill 2004
Landfill 2020
Lf + Cp 2020
Lf + Inc 2020
Lf + Cp + Inc 2020
Core system 1,890 1,846 1,084 1,175 595 Compensatory Heating 152 152 152 0 13 Compensatory Petrol 9 14 14 13 13 Compensatory Fertilizer 1 1 0 1 0 Compensatory Plastic 677 0 0 0 0 Compensatory Cardboard 5 0 0 0 0
Upstream Electricity 7 9 9 3 4 Total system 2,741 2,022 1,259 1,192 625
The results for the total system impact confirm that the most preferable option in this impact category is the Lf + Cp + Inc 2020 scenario with lowest overall impact in the category (Table 5-3). The highest absolute contribution to photo-oxidant VOC formation has the Compensatory plastic process with 677 tons ethene-equivalents which again shows the benefits from the introduction of material recycling in 2020.
The component of the WMS that contributes the most to photo-oxidant NOx formation is the waste collection and transportation (Figure 5-9). The results show 212 tons for 2004 and 314 tons for 2020 which represent 76% and 81% respectively of the total core system impact in this category.
Figure 5-9 Photo-oxidants NOx from core system
0
100
200
300
400
500
600
Landfill 2004 Landfill 2020 Lf + Cp 2020 Lf + Inc 2020 Lf + Cp + Inc 2020
Scenarios
Ton
of e
then
e-eq
uiva
lent
Transport Collection Cardboard Recycling Plastic Recycling Composting
Incineration Biogas Utilization Residual Spreading Landfill ST Untreated ST
The incineration treatment method as component of the WMS manifests the second highest impact in this category (Figure 5-9). Its share in the last two scenarios that include it is 36% and 32% of the core system impact. The analysis of the results shows that the combined impact of the collection and incineration amounts to 90% and 86% for the 4th and 5th scenarios. Finally, the most preferable future scenario is the Landfill 2020 followed closely by the Lf + Cp 2020.
46

The inclusion of the compensatory and the upstream systems completely change the results from the core system (Figure 5-10). Here the most favourable future scenarios are those including incineration as treatment of part of the MSW as the production of heat and electricity from the process offsets the impacts of producing them from conventional sources. Their share in the total system impact is quite significant being 39% in the 1st, 57% in the 2nd and 3rd scenarios.
Figure 5-10 Photo-oxidants NOx from total system
0
200
400
600
800
1,000
1,200
1,400
Landfill 2004 Landfill 2020 Lf + Cp 2020 Lf + Inc 2020 Lf + Cp + Inc 2020
Scenarios
Ton
of e
then
e-eq
uiva
lent
Core System Compensatory Heating Compensatory Petrol Compensatory Fertilizer
Compensatory Plastic Compensatory Cardboard Upstream Electricity
The results also show that introduction of material recycling in 2020 will avoid the photo-oxidant NOx formation from the processes of plastics and cardboard production (Figure 5-10). In the 2004 scenario, those amount to 33% and 4% respectively of the total system impact.
5.1.3.5 Total environmental impacts To be able to compare the results from the analysis of the core system effects on the different impact categories, the values were normalized against the highest one in each and the summary is presented in Figure 5-11.
Even though it is not of particular interest for future planning, the Landfill 2004 scenario was included because it gives valuable information about what will be the impacts in the Landfill 2020 scenario as compared to it. The results show that the expected future impacts from the 2nd scenario will be higher as compared to the 1st for the acidification, eutrophication and photo-oxidant NOx by 24%, 12% and 28%. For the GWP and photo-oxidant VOC the values are 2% less for both.
It is evident that the Lf + Cp + Inc 2020 scenario has the highest impact in two of the impact categories and the lowest in the other three. The LF + Inc 2020 scenario has impacts more or less similar to the Lf + Cp 2020 scenario for the eutrophication and photo-oxidant VOC. The results also show that in three out of five impact categories the effects of the 3rd, 4th, and 5th scenarios will be less than that of the Landfill 2020. Exceptions are acidification and photo-oxidant NOx where the impacts will be higher due to the nature of the included treatment processes.
47

Figure 5-11 Total environmental impact of core system as represented by the five impact categories
Values normalized against highest value within each impact category
0.0
0.1
0.2
0.3
0.4
0.5
0.6
0.7
0.8
0.9
1.0
Global WarmingPotential
Acidification Eutrophication Photo-oxidant VOC Photo-oxidant NOx
Impact Categories
Landfill 2004 Landfill 2020 Lf + Cp 2020 Lf + Inc 2020 Lf + Cp + Inc 2020
The normalized results from the total system effects on the different impact categories are presented in Figure 5-12.
Figure 5-12 Total environmental impact of total system as represented by the five impact categories
Values normalized against highest value within each impact category
0.0
0.1
0.2
0.3
0.4
0.5
0.6
0.7
0.8
0.9
1.0
Global WarmingPotential
Acidification Eutrophication Photo-oxidant VOC Photo-oxidant NOx
Impact Categories
Landfill 2004 Landfill 2020 Lf + Cp 2020 Lf + Inc 2020 Lf + Cp + Inc 2020
The highest impacts for the total system are for the Landfill 2004 scenario with one exception. The introduction of material recycling in 2020 will decrease the total system impacts of landfilling except for eutrophication where there will be an 8% increase. The lowest overall environmental impact is caused by the Lf + Cp + Inc 2020 scenario followed by Lf + Inc 2020.
It is of interest to see how the impacts of the core and total system relate to the amount of the waste that has been treated in each scenario. For that reason the values of the impacts in each impact category were divided by the total amount of treated waste in each scenario which includes not only the generated but also secondary waste that arises from the different
48

treatment methods. The results are then normalized by the highest value for each impact category and the output is presented in Figure 5-13 and Figure 5-14 .
Figure 5-13 Total environmental impact of core system as represented by the five impact categories per ton treated waste
Values normalized against highest value within each impact category
0.0
0.1
0.2
0.3
0.4
0.5
0.6
0.7
0.8
0.9
1.0
Global WarmingPotential
Acidification Eutrophication Photo-oxidant VOC Photo-oxidant NOx
Impact Categories
Landfill 2004 Landfill 2020 Lf + Cp 2020 Lf + Inc 2020 Lf + Cp + Inc 2020
The relation between the effects of the core system on the different impact categories when comparing the results presented in Figure 5-11 and Figure 5-13 are kept and the differences become more profound. The normalized value for the eutrophication per ton treated waste in the Landfill 2004 scenario is the highest in the impact category while the Landfill 2020 value comes to second. It can also be noted that the effects of the Lf + Inc 2020 on eutrophication and photo-oxidant VOC become less than that of the Lf + Cp 2020 scenario when the values are related to the total amount of waste treated in them.
Figure 5-14 Total environmental impact of total system as represented by the five impact categories per ton treated waste
Values normalized against highest value within each impact category
0.0
0.1
0.2
0.3
0.4
0.5
0.6
0.7
0.8
0.9
1.0
Global WarmingPotential
Acidification Eutrophication Photo-oxidant VOC Photo-oxidant NOx
Impact Categories
Landfill 2004 Landfill 2020 Lf + Cp 2020 Lf + Inc 2020 Lf + Cp + Inc 2020
49

The relation between the effects of the total system on the different impact categories when comparing the results presented in Figure 5-12 and Figure 5-14 does not change much. Still, when considering the amount of the waste treated in each scenario it becomes apparent that the Landfill 2004 has the highest effect in all impact categories. The reduction of the impacts from the other scenarios in 2020 is even higher and is more than 50% in most of the impact categories.
5.1.3.6 Qualitative impact assessment No impact assessment method has been used in this thesis in order to aggregate the results or the different impact categories and get a final score. Still, there is a need to somehow evaluate which scenario has the lowest overall environmental impact. That is why the information regarding the normalized total environmental impact from the core and the total systems are summarized in tables (Table 5-4 and Table 5-5) and the cells are coloured as follows:
• Light Grey – the impact of the scenario has the lowest value in the impact category;
• Dark Grey – the impact of the scenario has a value different from the lowest or the highest in the impact category;
• Black – the impact of the scenario has the highest value in the impact category.
Table 5-4 Quality evaluation of total environmental impact of core system as represented by the five impact categories
Impact category Landfill 2004
Landfill 2020
Lf + Cp 2020
Lf + Inc 2020
Lf + Cp + Inc 2020
Global Warming Potential 1.00 0.98 0.59 0.72 0.43
Acidification 0.30 0.39 0.79 0.61 1.00
Eutrophication 0.88 1.00 0.62 0.63 0.36
Photo-oxidant VOC 1.00 0.98 0.57 0.62 0.31
Photo-oxidant NOx 0.47 0.66 0.70 0.99 1.00
The quality evaluation shows that the Lf + Cp + Inc 2020 scenario has the lowest impact in three of the impact categories, and highest impact in the other two. The reference Landfill 2020 has the exactly opposite effect on the environment, and the other two scenarios lay somewhere in the middle.
When considering the impact of the total system it is clear that there is a big difference. Here the 5th scenario does not have highest negative values in any of the categories. There is change in the other scenarios as well as Lf + Inc 2020 has two lowest and three intermediate effects, while Lf + Cp 2020 receives two highest and three intermediate.
50
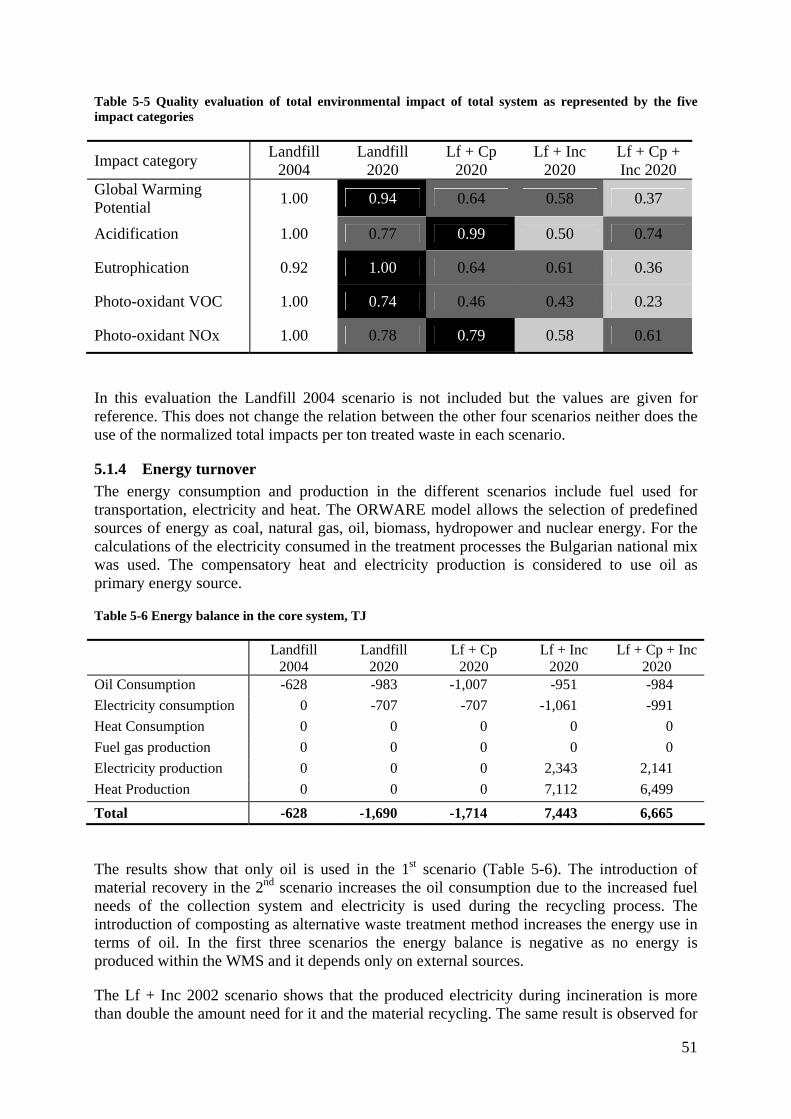
Table 5-5 Quality evaluation of total environmental impact of total system as represented by the five impact categories
Impact category Landfill 2004
Landfill 2020
Lf + Cp 2020
Lf + Inc 2020
Lf + Cp + Inc 2020
Global Warming Potential 1.00 0.94 0.64 0.58 0.37
Acidification 1.00 0.77 0.99 0.50 0.74
Eutrophication 0.92 1.00 0.64 0.61 0.36
Photo-oxidant VOC 1.00 0.74 0.46 0.43 0.23
Photo-oxidant NOx 1.00 0.78 0.79 0.58 0.61
In this evaluation the Landfill 2004 scenario is not included but the values are given for reference. This does not change the relation between the other four scenarios neither does the use of the normalized total impacts per ton treated waste in each scenario.
5.1.4 Energy turnover The energy consumption and production in the different scenarios include fuel used for transportation, electricity and heat. The ORWARE model allows the selection of predefined sources of energy as coal, natural gas, oil, biomass, hydropower and nuclear energy. For the calculations of the electricity consumed in the treatment processes the Bulgarian national mix was used. The compensatory heat and electricity production is considered to use oil as primary energy source.
Table 5-6 Energy balance in the core system, TJ
Landfill 2004
Landfill 2020
Lf + Cp 2020
Lf + Inc 2020
Lf + Cp + Inc 2020
Oil Consumption -628 -983 -1,007 -951 -984 Electricity consumption 0 -707 -707 -1,061 -991 Heat Consumption 0 0 0 0 0 Fuel gas production 0 0 0 0 0 Electricity production 0 0 0 2,343 2,141 Heat Production 0 0 0 7,112 6,499
Total -628 -1,690 -1,714 7,443 6,665
The results show that only oil is used in the 1st scenario (Table 5-6). The introduction of material recovery in the 2nd scenario increases the oil consumption due to the increased fuel needs of the collection system and electricity is used during the recycling process. The introduction of composting as alternative waste treatment method increases the energy use in terms of oil. In the first three scenarios the energy balance is negative as no energy is produced within the WMS and it depends only on external sources.
The Lf + Inc 2002 scenario shows that the produced electricity during incineration is more than double the amount need for it and the material recycling. The same result is observed for
51

the 5th scenario as well; still the produced amount is less as the absolute amount of the treated waste that is incinerated is smaller. The produced heat is obviously the main energy output from the last two scenarios.
The energy balance of the core system is illustrated in Figure 5-15.
Figure 5-15 Energy balance for the core system
-2,000
0
2,000
4,000
6,000
8,000
10,000
Landfill 2004 Landfill 2020 Lf + Cp 2020 Lf + Inc 2020 Lf + Cp + Inc 2020Scenarios
Ener
gy -
TJ
Oil Consumption Electricity consumption Heat ConsumptionFuel gas production Electricity production Heat Production
5.1.5 Material recovery The ORWARE model allows the simulation of the recycling of cardboard in terms of virgin cardboard substituted and plastics in terms of HDPE granules. Material recycling is included in all 2020 scenarios and all of the separately collected recyclable waste (for source separation rates see Table 4-9) is then transported to treatment.
The results from the simulations show that recycled cardboard will be 35,732 tons per year and recycled plastics will 118,040 tons per year. Even though metal and glass recycling is not modelled in ORWARE the results show that 35,739 tons of metals and 13,506 tons of glass will be source separated in 2020 and will be available for further recycling.
The environmental impact from cardboard and plastics recycling is less than 1% of the total impact of the core system (Table 5-7). The energy consumption, however, is quite high (Table 5-8) which proves that the material recycling process is energy intensive.
The electricity consumption of the cardboard recycling process varies between 25% and 40% depending on the other components that comprise the WMS. The oil consumption stays around 10% of the total for the WMS. The total energy consumption for the process amounts between 19% and 23% of the total for the core system.
The recycling of plastics uses between 40% and 60% of the electricity consumed in the different scenarios. The total energy consumption is less when related to that of the core system and amounts between 21% and 25% of the total.
52

Table 5-7 Contribution of cardboard and plastics recycling to different impact categories as % of total core system impact11
Landfill 2020
Lf + Cp 2020
Lf + Inc 2020
Lf + Cp + Inc 2020
Cardboard recycling Global Warming Potential 0.18% 0.29% 0.24% 0.40% Acidification 0.78% 0.39% 0.50% 0.31% Eutrophication 0.11% 0.17% 0.17% 0.29% Photo-oxidant NOx 0.53% 0.50% 0.35% 0.35% Plastics recycling Eutrophication 0.41% 0.66% 0.66% 1.13%
The combined energy use for the material recycling process varies between 40% and 48% for the different scenarios (Table 5-8). The figures are relative to the total energy use in the core system.
Table 5-8 Energy use for cardboard and plastics recycling as % of total core system energy use
Landfill 2020
Lf + Cp 2020
Lf + Inc 2020
Lf + Cp + Inc 2020
Cardboard recycling Electricity consumption 39.88% 39.88% 26.56% 28.44% Oil consumption 10.38% 10.13% 10.73% 10.38% Total energy 22.72% 22.40% 19.08% 19.44% Plastics recycling Electricity consumption 60.12% 60.12% 40.04% 42.87% Total energy 25.15% 24.79% 21.12% 21.52% Total Energy used for material recycling 47.87% 47.20% 40.20% 40.96%
5.2 Findings from the EU and Bulgarian waste policy review
5.2.1 European waste policy
5.2.1.1 Thematic Strategy on Prevention and Recycling of Waste The Thematic Strategy on Prevention and Recycling of Waste (TSPRW) was prepared along with other six Thematic Strategies (TS) under the umbrella of the 6th Community Environment Action Programme (CEAP). They are supposed to represent the next generation of environmental policy. Here the focus is shifted towards a specific theme rather than specific pollutants or economic activities. The TS have a long-term perspective and have set their objectives as far as 2020 and try to identify the most appropriate instruments that will
11 Some of the impact categories are omitted as the recycling process does not have effect on them.
53

deliver the goals by dealing with existing obstacles the easiest way while sustaining highest possible cost efficiency.
The TSPRW introduces Life-Cycle thinking (LCT) into waste management policy. The major goal is to reduce environmental impacts of resource use by identifying key elements of the life-cycle of a product where efforts will have the highest overall positive result. The promotion of waste prevention or recycling should not create negative effects somewhere else in the life-cycle. The LCT will also be used to assess the effectiveness of different policies that will have impact on the environment. In order to assist the implementation of LCT in policy making the TS includes the development of guidelines for use of LCT tools and dissemination of the information among decision makers.
The waste policies, according to TSPRW, should also be focused on the environmental impact of resource use. Waste prevention and recycling measures have to generate net benefits and reduce the accumulated impacts throughout the life cycle of a resource (CEC, 2005a). The use of waste plastics to replace virgin material in plastic products whenever it is possible is sensible but using it to substitute concrete in park benches may not be of real benefit. To recover energy from such plastics could be more meaningful.
Waste policies should also communicate with the Integrated Product Policy (IPP) which aims to reduce environmental impacts from products throughout their life-cycle. IPP promotes the use of market mechanisms where possible and is trying to integrate policies and instruments, like eco-design, LCA, public procurement, and producer responsibility, to facilitate “green” products development and penetration into everyday life.
5.2.1.2 Waste Framework Directive The Waste Framework Directive (WFD) lays down the definitions and ground rules for all the other relevant pieces of EU waste legislation (CEC, 2005c). The original version of the Directive dates back to 1975 when it was one of the first pieces of environmental legislation adopted. It has been revised recently in accordance to the TSPRW and recommendations of the conducted IATS, and the new official name is “Directive 2006/12/EC of the European Parliament and of the Council of 5 April 2006 on waste”. The main reasons for the revision of the WFD include:
• Legal uncertainties concerning the definition of waste and the distinction between recovery and disposal.
• The need for the introduction of a specific objective, namely the reduction of environmental impacts from waste generation and management from a life-cycle perspective, which corresponds to the new policy approach of the TSPRW.
• The need for clear recovery definitions and incorporation of end of waste criteria.
• The need for simplification and optimization of the existing waste management legislation.
The new WFD also incorporates the revised provisions of the Directive 91/689/EEC on hazardous waste and abolishes the Directive 75/439/EEC on the disposal of waste oils. The latter is due to the fact that the priority for waste oils regeneration over other recovery options is no longer justified (see EC 2001) according to the EC (CEC, 2005c). It also removes some of the permit requirements that are covered by the Directive 96/61/EC concerning integrated
54

pollution prevention control (IPPC Directive) which in the past have lead to double permitting. The main amendments to the Waste Framework Directive are summarized below:
• The introduction of an environmental objective;
• The clarification of the notions of recovery and disposal;
• The clarification of the conditions for the mixing of hazardous waste;
• The introduction of a procedure to clarify when a waste ceases to be a waste for selected waste streams;
• The introduction of minimum standards or a procedure to establish minimum standards for a number of waste management operations;
• The introduction of a requirement to develop national waste prevention programmes.
When examining the text of the new WFD none of the above amendments were actually found. Further research showed that there is a procedure12 in the European Parliament for amendment of the WFD as adopted by the EC in 2006. Those amendments however incorporate the main points as listed above.
5.2.2 Bulgarian waste policy
5.2.2.1 National Waste Management Programme The contemporary Bulgarian National Waste Management Programme was adopted in 2003 and is valid for the period 2003-2007. It was developed on the basis of the requirements set by the Environmental Protection and Waste Management Acts.
“Its main purpose is to contribute to the sustainable development of the Republic of Bulgaria by integrated framework which will lead to reduction of the harmful impact upon the environment caused by the waste generation, to improvement of the effectiveness of the natural resources consumption, to increase of the producer responsibilities, and to encouraging of the investments in waste management.” (MOEW, 2003)
Further, in the development of the programme were considered the of Directive 75/442/EEC on waste, Directive 91/689/EEC on hazardous waste, and the Strategy on Waste Management of the European Union (MOEW, 2003). The overall objective of the programme is to set a long term strategy for sustainable waste management and the framework for decision making in compliance with the legislation and the policy of the European Union. It follows the basic principles laid down in the European environmental legislation and adapts them to the local conditions in Bulgaria:
12 http://www.europarl.europa.eu/oeil/file.jsp?id=5303132
55

1. Sustainable development
o A model for social and structural economic transformations that optimizes the present economic and social benefits without compromising the potential for their existence in future.
o Use of the natural resources without destroying or harming them and by a manner that does not restrict the possibilities for their use by the future generations. This requires maximum waste prevention and recovery and recycling of secondary materials.
2. Waste prevention principle
o Limitation of the use of natural resources.
o Applied both in the households and in the industry by introduction of cleaner technologies.
3. Precautionary principle
o Taking of preventive measures for avoidance of a future degradation of the environment and human health even if enough scientific knowledge for taking of preventive measures is not available.
4. Self-sufficiency principle in waste management (proximity principle)
o Waste should be disposed as near as possible to the place of their generation.
o The balance between the proximity principle and the improvement of the economic indicators by increasing the capacity of the waste treatment facilities should be taken into consideration
5. Waste management hierarchy
o Waste prevention by reduction of the quantities and the hazardous substances content in the waste generated.
o Reuse / Recycling / Recovery by means of:
reuse – use of products or objects many times for the same or other purpose;
recycling – processing of waste and their utilization as raw materials for the production of the same or other products;
recovery – by application of the methods of composting, energy recovery or other technologies;
o Disposal by landfilling or incineration of waste without energy recovery, in case no other solution could be found.
6. Best available technology not involving excessive costs
o Waste management hierarchy is not always the best way for achieving sustainable management.
o Consultative process for decision making that takes into account the relative advantages of the different waste management options having regard to the protection of the environment at a reasonable price.
7. Full producers responsibility
o Taking into consideration the life cycle of a given product.
56

o Producer responsibility
prevention and minimization of the waste generated from the production of their products;
design and development of products that are suitable for recycling and do not contain materials that endanger the environment;
development of markets for reuse and recycling of the waste generated after the consumption of the goods placed on the market;
o Polluter pays.
8. Integrated waste management
o Decision making and application of clearly defined quantitative targets within the framework of a system consisting of legal, technical, organizational and economic measures, identified sources of resources and determined responsibilities of all participants that fulfil these targets.
9. Involvement of the public
o Participation, consultation and information.
At present a new NWMP is under development and it will most probably cover the period from 2008 to 2012. Its main challenge will be to ensure proper and timely implementation of the waste management legislation as well as development of the waste management system in Bulgaria. Its objectives will most probably follow the ones set by the 6th CEAP and the TSPRW.
5.2.2.2 National strategy for reducing the quantities of biodegradable waste designated for landfill disposal
The Bulgarian National strategy for reducing the quantities of biodegradable waste designated for landfill disposal (MOEW, 2007b) is currently under development and has almost reached publication. It represents the first attempt to incorporate life-cycle perspective in waste management planning in Bulgaria. As suggested by the name, the scope of the strategy is the biodegradable waste management. As a result of the initial investigation of the possibilities to reach the goals set in the strategy, a mathematical model was developed in Excel that allows that quantitative evaluation of the options available to the decision makers. The conceptual scheme of the model is presented in Figure 5-16.
57

Figure 5-16 Conceptual scheme of the model used for biodegradable waste management in Bulgaria
Source: SGS, 2006
The main goal of the BioWS is to decrease the amount of biodegradable waste that is disposed off in landfills with 25% by 2010, 50% by 2013 and 65% by 2020 as compared to the amounts in 1995. These goals are set by the Council Directive 99/31/EC of 26 April 1999 on the landfill of waste as is the requirement for the development of such strategy.
5.2.2.3 Local/municipal waste management in Bulgaria The development of municipal waste management programs is required by the provision of the Bulgarian Waste Management Act. The programs should include specific actions and time frames to comply with the legal requirements and should incorporate short to middle term perspective (at least 3 years). The major obligations for each municipality are to define sites for the construction and operation of municipal waste treatment facilities and to organize the collection, transportation and treatment of the MSW. The main source of funding for the operation of the MWS is the waste tax collected by the served population.
The official Guidelines for development of municipal waste management plans (MOEW, 2006) published by MOEW acknowledge that there are many municipalities that will not be able to organize WMS and especially to establish MSW treatment facilities that comply with the high environmental standards set by the contemporary legislation on waste. The suggested resolution of this problem is through cooperation of several municipalities in order to achieve the high environmental targets at a reasonable price for the served population.
One of the most challenging requirements set by the EU legislation to be implemented by the municipalities is that every establishment generating waste has to be covered by the WMS. This means that special effort should be made to cover all settlement, however small and distant they are.
The proper implementation and monitoring of the waste management plans should be backed up with sufficient amount of information about the quantity and the composition of the MSW.
58

All plans should include measures to build information systems that can support the data gathering and analysis.
The waste management plan (WMP) for Stolichna obshtina13 was studied to see the practical application of the guidelines described in the preceding paragraphs. StO is the biggest municipality in Bulgaria as it includes the capital Sofia and some neighbouring settlements. The total population of the municipality is 1,231,622 as per 31.12.2006. The MSW generation rate is 284 kg/cap/a, which corresponds to approximately 350 thousand tons per year.
The goals of the WMP of StO are to ensure:
• Collection, transportation and treatment of the MSW and at the same time complying to the high environmental standards;
• Consideration for the human health;
• Waste prevention and minimization;
• Development and support of up-to-date database that includes all relevant data for the waste management system;
• Building of public awareness of the problems and opportunities that are related to the MWS.
The practical measures provided in the WMP include:
• Waste minimization at source by affecting the consumption patterns through school education and information campaigns;
• Implementation of waste separation schemes and designation of collection sites for spent batteries, WEEE, bulky waste, etc.;
• MSW treatment before final disposal including sorting and separation of recyclable fractions;
• Consideration of treatment options other than landfilling, including high temperature incineration and plasma conversion;
• Closure and reclamation of old and illegal landfills.
The implementation of these measures proves to be a challenge. The contemporary WMP of StO has been adopted in 2004 for the period 2005 – 2009; however, until now there are no real results concerning waste separation. Moreover, the formal landfill site, Suhodol, which was designated for the MSW from StO, was closed in September 2005. Since then the MSW is collected, wrapped and stored in open sites. As previously stated, the annual amount of the MSW generated in StO is around 350 thousand tons.
The problem with the Suhodol landfill site escalated in 2004 when the citizens of the nearby village demanded the landfill to be closed as it has exceeded its capacity and its operational 13 Capital municipality
59

permit expired in 2003. Road blockades prevented the companies responsible for the collection and transportation of the MSW to reach the landfill and empty the trucks. This lead to the accumulation of an enormous amount of uncollected waste in the waste bins which posed health hazards and fire danger. The situation was resolved in a week when the StO administration promised to effectively close the landfill in a couple of months.
Almost a year afterwards, the Suhodol landfill was finally closed. During that time the only proposed solution was to collect the MSW, wrap it and store it in an abandoned production facility. Until today there is no proper solution for the MSW of StO. The administration is looking at several methods based on thermal treatment but so far there is no actual project under development or implementation.
5.2.3 Environmental decision making tools At present there is a long-term research program on tools for environmental assessment in strategic decision making (MiSt14) funded by the Swedish Environment Protection Agency (BTH, 2007) and is supported by nine leading Swedish research institutions in the field. The program consists of projects which are combined under several general themes:
• Strategic Environmental Assessment (SEA) – implementation : Implementation of the SEA processes and tools within fields of programme and plans especially at regional and local level, future development within the field of national policy and its implementation at regional and local level.
• Scenario techniques: The application of scenario techniques in strategic decision-making, policy and regional/ local planning.
• Effectiveness of tools: Effectiveness of tools and combinations of tools in complex processes of policy, planning and implementation; especially the use of environmental systems analytical tools within a framework of a hierarchy in organisation and time of policy and public planning.
The results of the research completed so far by the MiSt-program are published in a report including 13 articles with critical reflections on effective environmental assessment tools. The report points out that several tools such as EIA, SEA, TIA etc are not well defined and a number of technical tools and expert methodologies can be used within their framework (Emmelin, 2006). A distinction can be made between three different sets of tools:
• Related to planning and management in the public sector which often has a major component of participatory ideology;
• Related to environmental systems analysis which tend to be “expert tools” – LCA, SFA, MFA;
• Environmental management system tools from the corporate sector which may be used also in the public sector providing links to informal or market regulation mechanisms.
14 MiljöStrategiska verktyg
60
“Environmental systems analysis tools for instance, like LCA or SFA are extensively used in the researcher community and there are plenty of publications praising their applicability for corporate and authority use. However, they are seldom used outside the research community. Experts that develop such tools often have a background in natural sciences and technology or work within scientific or administrative frame-works where assumptions of highly rationalist decision making models are not confronted with research on planning, decision-making or implementation.” (Emmelin, 2006).
The effectiveness and function of tools can be assessed in respect to both the context of their application and the embedded theories and assumptions of their construction. An important aspect of the interaction and embedded conditions for tool use is the degree to which tool use can be regulated with legal instruments or otherwise standardised.
The call for more empirical and systematic evaluation in the entire environmental assessment field is valid for tools as well. Studying successful examples of tool use meets with the problem that “…tools are complex, and their proper application requires skill and experience. As a consequence, significant differences often exist between the qualities of the best and the typical application practices…” (Merkhofer, 1999 as cited by Emmelin, 2006). It is the application practices that need to be understood in order to design tools and to regulate their application.
61

62

6 DISCUSSION
6.1 The ORWARE model and its application for Bulgaria One of the main objectives of this thesis was to analyse the Bulgarian WMS from a systems perspective by using ORWARE. Due to the nature of the model, big amount of information needed for the input parameters has been gathered and summarized. The construction of the national MWS in the model proved to be a complicated task because the amount of information at that high planning level is big and has to be aggregated in a way suitable for the simulations. Further, the available information is not always of the required kind or is not complete and many assumptions have to be made.
This study aims to cover the whole WMS in Bulgaria and to analyse the environmental impacts from the different scenarios that have been constructed. The construction of the contemporary WMS scenario (Landfill 2004) proves to be an easier task than that of the possible future scenarios. In this thesis four different ways of development of the MWS until 2020 are analysed and the treatment methods that are included are justified by the presently available information of the most probable future development of WM in Bulgaria. All those include source separation and material recycling of the separately collected waste fractions, landfilling as business as usual development, incineration and composting as probable alternatives to landfill disposal.
The use of ORWARE allowed the quantitative assessment of the different environmental impacts, energy balances and material recycling opportunities related to the different scenarios. The results show that the contemporary MWS and the business as usual development have environmental impacts that far outweigh those of the other three scenarios, which proves that they are not desirable. Efforts should be made to develop and implement the use of alternative ways of MSW treatment such as composting and incineration. It is apparent from the results that the inclusion of even one alternative to landfilling has a huge positive impact on the environment.
As mentioned before, there is only one known application of ORWARE at national level for planning organic waste management in Denmark. The study was conducted by the Danish EPA and was supported by the Ministry of the Environment. This thesis work is conducted independently and does not have the resources to undergo the extensive data gathering that is required. The main sources of data are described in Chapter 4.3.1 of this thesis. The results are used to illustrate the application of systems analysis perspective on waste management in Bulgaria and provide ground for future investigations in this area. Moreover, conducting of such a pilot study and the information gathered during the research may prove of real benefit for starting a discussion of the direction and future of Bulgarian WMS.
Another issue can be the applicability of ORWARE that was developed in Sweden to the Bulgarian climatic, geographic and socio-economic conditions. The scenario simulations depend on data originally incorporated into the model, e.g., rates of organic waste degradation, truck fuel consumption and emissions to mention a few. However, the main concept of the model is irrelevant to the input information and that is systematic description and analysis of the WMS. All parameters and equations that lay behind it can be adapted to local conditions if information is available. ORWARE is unique with its vast inventory of factors affecting the WMS and outputs from it, being functions or emissions, and prove to be a steady foundation for every analysis of MSWM. The contents of this thesis provides only
63

limited amount of the information behind the model but detailed descriptions of all sub-models can be found in the ORWARE related literature15.
6.1.1 Data availability and reliability A complicated and detailed model like ORWARE needs a lot of input data to perform the simulations and the results are very much affected by it. Therefore, the quality of the data used in the model is of great importance.
As described in the methodology section of this thesis, the main sources of information about the environment and waste management in particular used in this study are BGEEA, BGNSI, EEA and Eurostat. During the initial data mining it turned out that the published information is mostly old and incomplete. Many of the figures are estimated by experts at local, national or international level. This makes it challenging to organize a modern waste management system with the appropriate data to justify the decisions that have to be made.
In contrast, many countries like Sweden have data about the municipal waste composition for years back. Still, Eurostat datasets are incomplete for many years and countries, including Sweden. It was surprising to find out that the waste composition data for Bulgaria was available where that of Sweden was missing. It is not possible to know why Sweden does not report this information to Eurostat or whether it was not input in the database for other reasons. It is clear however that Bulgaria, being an EU accession country, reported everything as it is required by all directives and regulations.
The information regarding MSW composition in Bulgaria is from several studies in different municipalities performed as part of development projects and is almost ten years old. The information reported to Eurostat is by “expert opinion”. Even though there are legal requirements that all municipal authorities or the companies that operate waste treatment facilities (landfills at present) should have information about the composition and amount of waste that is treated, such information is not available even with BGEEA, which is the information support body of MOEW.
The amounts of generated MSW reported by BGNSI and available through Eurostat are estimated based on the “statistical evaluation”. The total amount of generated MSW is obtained by dividing the amount of the collected and landfilled waste by the percent of the population served by organized waste collection schemes. This will only be true if the waste generation rate is the same around the country but the population that is not covered by organized MSW collection lives mainly in rural areas where the generation rate is lower than the country average.
Taking into consideration all of the above, it is clear that more effort should be put at all levels of government, from local to EU, to make data on waste more reliable and available. Local municipal administrations should control MSWM activities more closely and gather good qualitative and quantitative information from first hand. National authorities such as MOEW and BGEEA should have schemes for collection of waste composition data from various municipalities so that it can really be representative for a given type of settlement based on a chosen criterion. For the purpose of this study it is good to have high quality data but it is not crucial. It is important for the planning authorities who have to make decisions that will have not only simulated environmental, social and economic impacts.
15 For an extensive list of ORWARE related publications see Björklund (2000) p21 and Eriksson et al (2002)
64

6.1.2 Environmental impacts Five impact categories were included in the environmental impact analysis of the different scenarios: Global Warming Potential, acidification, eutrophication, photo-oxidant VOC and NOx formation. No impact assessment method has been used meaning that the results from the impacts in the different impact categories were not combined to get a final total score.
Even though, a qualitative assessment of the environmental impacts from the different scenarios (Table 5-4 and Table 5-5) has been made and the results show that the Lf + Cp + Inc 2020 scenario has the overall lowest impact. It is then followed by the Lf + Inc 2020 scenario and Lf + Cp 2020. The highest impacts are caused by the Landfill 2020 scenario which is used as reference. This order of preference is particularly true when examining the impacts of the total system not only the core.
From the analysis of the different scenarios stands out the fact that MSW landfill disposal is not quite an option. It is just a wasteful way to treat the resources and energy that have been used to create the products that end up in the “waste” stream. The introduction of material recycling somewhat offsets the problem but with time the generated amount of MSW tends to increase. Therefore, in five or ten years the effects of using landfilling and material recycling now will be the same as landfilling being the only treatment option today.
It is apparent that the effects of uncollected waste are highly negative and the simulations show that this is particularly true for the GWP and the photo-oxidant VOC impact categories. Low collection rates in rural areas mean not only greater environmental impacts but also uncontrolled loss of resources. At present about 84% of the population in Bulgaria is served by organized MSW collection schemes; however this does not correspond to the same percentage of the generated MSW in the country. Even though 100% coverage is hardly possible more effort should be put in increasing it as much as possible.
The results show that introduction of an alternative MSW treatment option as in scenarios 3 to 5 has a positive effect on the environment and on other systems (see following sections). This is contrary to the fact that the MSWM system becomes more complicated, more transportation is needed and higher total amounts of waste are passing through it. The last scenario has the lowest overall environmental impact when considering the total system because the functional outputs are the most in number and they substitute virgin energy and resources that have to be used in order to provide them. It is possible to speculate that if anaerobic digestion was included in addition to incineration and composting in a possible future scenario, depending on the way the biogas was utilized and many other parameters, the total environmental impact of the total system will be even lower. This question stays open for further discussion and analysis in other studies.
Before concluding this section, it is important to point out that the environmental impacts of the total system depend on the choice of the compensatory systems. Marginal electricity production from coal will have different impact as compared to that from oil or natural gas. The more adverse production processes are used in the compensatory systems, the higher will be the positive effect of the WMS when providing the same functional outputs. That is one more reason to treat the results from the simulations with caution even though much effort has been made to input data that is as close to the Bulgarian conditions as possible.
The positive and the negative environmental, social and economic effects of each available waste treatment option are subject to many publications and studies. In general every human activity has some kind of environmental impact. The WMS should not be looked at as means
65
to get rid of something that is not needed but as a way to recover as much as possible from what people just have no use of. There will be impacts both negative and positive but sooner or later waste management will become a synonym of resource extraction.
6.1.3 Energy balance, nutrient and material recovery This section will focus on the benefits from the analysed scenarios in terms of energy production, recovery of nutrients and of recyclable materials.
Bulgaria is a country that lies in temperate latitude and has four distinctive seasons. The winters are quite cold and district heating is provided in most of the large cities. There is a real possibility to substitute conventional heat generation from gas and coal with one from waste. Including CHP incinerator facilities in the Bulgarian energy system will be also beneficial because recently two of the reactors in the Bulgarian nuclear power plant at Kozlodui were closed down. The country is in real need for more energy which at the moment is produced using brown coal with low calorific value that contains a lot of ash and sulphur.
The scenarios that include incineration as MSW treatment option provide most of the produced energy in terms of heat. This of course depends on the operational parameters of the incineration model. However, the heat generation efficiency is generally higher that that of electricity generation. Although the energy output from the Lf + Cp + Inc 2020 scenario is less than that of Lf + Inc 2020 the difference is not that big. Even if the generated heat is not used for district heating it can be utilized by the industry.
As in many other countries, Bulgaria has a net deficiency of phosphorus and nitrogen in the soil (MOEW, 2007b). It proves to be of great importance to utilize those elements present in the organic waste as suggested by the development of the BioWS in Bulgaria. At present there is limited application of composting in Bulgaria mainly within the households that have gardens which is not controlled in any way. There is one composting plant under commissioning and there are plans for the construction of a few more. The results from the simulation show that the introduction of composting of the separately collected organic waste and 40% of the rest household waste can substitute 778 tons of phosphorus and 1,481 tons of nitrogen as fertilizer. This will prevent the loss of those valuable nutrients to aquatic bodies where they are the main promoter of eutrophication.
The process of anaerobic digestion could prove to be very beneficial from environmental and economic point of view especially when considering treatment of the organic fraction of the MSW together with sludge from wastewater treatment facilities. The NWMP and BioWS do not consider that option for future development of the Bulgarian WMS that is why it was not considered in this study. Still, anaerobic digestion may prove to be very advantageous when managing big quantities of organic waste in large scale facilities where proper control will decrease some of its negative environmental effects.
The simulation results (Table 5-1) show that in the 2020 scenarios a lot of cardboard and plastics will be recycled. Metals and glass recycling was not modelled in ORWARE but the collected amounts will be available for recycling. Material recycling has positive environmental and economical impacts as it offsets the impacts and the costs of material production from raw materials. However, it puts extra burden on the people who have to separate the waste. Currently in Bulgaria there is a material recovery scheme under the producer responsibility obligations under the packaging waste regulation. Still, source separation from household waste is very limited and more efforts should be made for it to become a working part of the WMS.
66

Good social awareness is needed in order to achieve high source separation rates and that is built up in years through education and information campaigns. It is also important that the separately collected waste fractions are not contaminated with other materials as that makes their further processing more problematic. There is an option of mixed MSW collection and separation in specially designed sorting facilities but it was not investigated. In this study relatively modest source separation rates were considered because it will take time before people get educated enough and become cautious enough as they are in Sweden for example. Material recovery and recycling is not just good by itself if it does not serve the purpose to utilize the wasted materials in a meaningful way.
6.2 Environmental and waste policy making
6.2.1 European waste policy The results from this research show that the European environmental policy and the waste policy in particular are changing. The focus has changed from managing specific pollutants or activities to organizing those into themes which have long term perspective. The relevant to this study TSPRW introduces a completely different approach to waste policy and that is the incorporation of life-cycle thinking.
Traditional environmental policy is focused on the environmental effects in the beginning and the end of the life cycle, namely material extraction, processing, manufacturing and waste management. There is no consideration about the use phase which can be a main contributor to the environmental throughout the life-cycle of a product. Furthermore, the way of protection is limited to end of pipe solutions which many times may lead to sub-optimization of a specific link in the life-cycle. It may also lead to spending a lot of resources to fix something that will have minor positive impact as compared to some other phase of the life-cycle.
One of the proposed actions in the TSPRW is the issue of guidelines for use of tools that incorporate life-cycle thinking into policy making. According to the strategy those should be published in 2007 but no information about the progress in that direction was found during the time when this thesis was concluded. Such guidelines will help the competent authorities to open their eyes for the possibilities that are available everywhere, not only at the end of the chimney.
Another outcome of the TSPRW is the revision of the EU waste legislation. At present there is a new WFD which incorporates the provisions of the abolished the Directive on hazardous waste and the Directive on waste oils. This is also very important because the Directive on waste oils was abolished due to the fact that research from a systems perspective proved that the preference of waste oil regeneration before energy recovery is no longer justified. Similar research from a life-cycle perspective led to the recent amendment of the EU recycling and recovery targets for packaging waste (CEC, 2005c).
At present there are no significant changes in the WFD besides that it now accommodates the two other abolished ones. All the changes proposed in the TSPRW are still under discussion in the European Parliament. It is obvious that the political system of the EU is quite slow and changes cannon happen in one day. Still, more effort should be made to incorporate the proposed changes of the WFD which will remove any uncertainties in the definitions of recovery, recycling and disposal. There is no recycling definition in the present version of the WFD but such definition can help the development of specific policies and targets. Also defining incineration with energy recovery as disposal along with landfilling seems quite
67

improper and leaves wrong impression in the general public which perceives incineration as “bad”.
The definition of waste and the introduction of criteria that specify when a waste ceases to be waste will greatly improve the work of the planning authorities. In time waste will become more and more important source of energy and materials and the general concept of waste can be seen as a barrier for sustainable development (Frostell, 2006).
“(a) ‘waste’ shall mean any substance or object in the categories set out in Annex I which the holder discards or intends or is required to discard” (Directive 2006/12/EC)
A more appropriate ending can be “… is required to discard as long as it cannot be used by someone else”. One can argue that this definition is vague and unclear. However, the point remains clear. As long as there are meaningful ways to reuse it, recover its constituents or utilize the energy stored in it, waste is a resource.
6.2.2 Bulgarian waste policy The development of the Bulgarian waste policy in recent years is marked by the joining of the country to the EU. The whole environmental legislation is new and in compliance with the EU requirements. The big challenge that lies ahead is the implementation of those requirements. As the existing NWMP will become obsolete in a couple of months and the new one is still under development the future course of waste management in the country will most probably follow that of the EU. The newly developed BioWS shows that this way will lead to more systematic thinking by using planning tools incorporating life-cycle thinking.
Having good plans is the first step towards good environmental and waste management. However, there are still many practicalities and challenges faced by the municipal authorities. More efforts should be put in capacity building especially in small municipalities. The requirement to develop municipal waste management plans is not enough because many municipalities comply with it without implementation to follow. The example with the MSW of StO is a proof of that.
Even though efforts have been made for collection of qualitative and quantitative information about waste, the MSW is somehow neglected. It is true that the total amount of the generated MSW in Bulgaria is less than 2% of the total amount of wastes generated in the country. The main problem is that MSW is hard to manage as it arises everywhere in small amounts at a relatively constant rate while industrial waste is generated usually in large amounts at one specific location. Good and reliable information will assure the sustainable development of the Bulgarian municipal solid waste management system.
6.2.3 Global life-cycle perspective in national policy The present national environmental policy making does not consider global environmental consequences due to the fact that it is focused on achieving local environmental targets. Even if life-cycle perspective is used during the process it usually considers only data about local material extraction, production, consumption and waste management. This leaves outside the system boundaries all processes that take place in other countries. This may be enough if we consider the country boundary as a physical boundary that separates it from the rest of the world and does not allow material and energy flow through it. Considering that this is not a valid assumption, a global life-cycle perspective should be used when planning for sustainable society in the future.
68

During the last 50 years a new system has developed and has spread itself across national borders. The global market or global economy is result of the globalization and this reality has to be considered in every aspect of our lives. The national borders are no longer a barrier for material and energy flows. This is a result of ever continuing processes led by WTO, EU and other regional organizations.
Nowadays, different phases comprising the total life-cycle of a specific product are separated to a large extent. The raw materials needed for the production of mobile phone components for example are mined all over the world, the components themselves are manufactured in other countries and the final product – the mobile phone is assembled in completely different country. The ready product is then shipped to millions of people around the world to use it. After the mobile phone is thrown away it is up to the country within whose borders this happens to dispose of it in an environmentally friendly way. Hence, countries like Switzerland for example, that do not mine ore, produce parts or assemble mobile phones, have to take care of WEEE which is the final stage in the life-cycle of the mobile phone.
Systems analysis of the mobile phones in such countries will focus on the waste management as the other phases are external for them. This is not true as the current consumption requirements generate the need for this product to be produced in the first place. The question is to what extend shall the upstream systems be included if they are not within a tangible distance from the core system. Furthermore, it is unclear whose responsibility it is to act and to influence the whole life-cycle, not only an isolated single phase. Finally, it is uncertain how national policy on waste management of WEEE can incorporate the concern of natural resource extraction or product manufacture in a different country often hundreds of thousand kilometres away.
The answers to those questions may be found not only in national policy making but also in multinational corporations’ environmental strategies. A multinational company like IKEA from Sweden has the policy to enforce in all of its production facilities the most stringent requirements that exist in any of the countries in which they operate. It also demands such high environmental standards to be met by their suppliers. This is a good example of the corporate responsibility of a company to support sustainable development.
6.3 Link between LCTT and policy making The link between tools that incorporate life-cycle thinking and policy making has been established by the TSPRW. More interesting are the practical aspects of their application. The publication of the guidelines for use of LCTT in policy making using agreed approach and methodology will most probably allow their extensive use. Unfortunately no information about the progress on this matter is yet available.
As noted by Emmelin (2006) the use of tools in policy making can be hindered by the very assumptions that are laid down in their development. Further, the use of complex models like ORWARE requires skills and knowledge that may not be available to the policy makers.
Still a lot of examples can be seen that show successful application of such tools to aid decision making or assessing the outcomes of a specific policy enforcement. ORWARE has been used in used in a number of Swedish municipalities to help the competent authorities decide on a specific way to manage a specific waste stream or the mixed MSW (Eriksson, 2003). Even though it was mainly used at municipal level in the past, ORWARE was used for a recent study of biodegradable waste management in Denmark and for conducting this study of the MSWM in Bulgaria.
69

Good cooperation between competent authorities, the scientific community and other experts from private and public organizations holds the key to successful application of LCTT in policy making. On one hand the decision makers have to know of the existence and the opportunities that revived such tools, on the other scientists and experts have to provide their council on the practical aspects of MSW modelling.
70

7 CONCLUSIONS The municipal solid waste management system is complex, affected by many factors and cannot be considered in isolation from the social and other technical systems. The high level of complexity calls for a systematic view over the whole system from where the resources are extracted to where the wastes are dissipated into the environment. Analysing the WMS from a systems perspective gives the opportunity to see the effects of change in the core system as well as on the total system.
This research was conducted by using the ORWARE model which is a MFA/SFA based tool for environmental system analysis. The results from the performed simulations prove that landfilling alone is not a real option when planning for future MSWM in Bulgaria. Material recycling can somehow offset the impacts from landfilling for a limited period of time. The introduction of other treatment methods besides landfilling into the MSWMS generally proves to be beneficial. It was observed that by increasing the number of treatment options the positive environmental effect on the total system is increasing. Explanation for this was found to be the increased number of functional outputs from the waste management system.
The negative environmental effects of uncollected and untreated MSW are high. The increase of the percent of the population that is served by organized MSW collection will diminish this problem. This will prove very difficult as areas that are not served by organized MSW collection and mainly rural and distant with low population density.
The waste management system is no longer a means to dispose of products that have lost their usable properties. As the material throughput in society increases so does the need for changing the focus from disposal to recovery of energy, nutrients and recycling of valuable materials. Waste management is on the way to become a synonym to resource extraction due to the fact that resources around the world are dwindling. The general concept of waste is outdated in a sustainable society and waste should be considered as a resource.
There is a need for introducing separation of recyclable fractions from the MSW in Bulgaria. This action will have both positive environmental and economical impact. Still, applying source separation in households may prove to be less effective than using special separation facilities where the different fractions will be separated from the mixed MSW. This is due to the fact that the population has a quite low awareness of the issues related to MSWM and it will take a lot of time and efforts through education and information campaigns to build it.
Environmental policy in Bulgaria is changing as is in the EU. The focus has changed from managing specific pollutants or activities to organizing those into themes which have long term perspective. The Thematic Strategy on prevention and recycling of waste introduces a completely different approach to waste policy and that is the incorporation of life-cycle thinking. This means that at policy level the WMS will not be looked in isolation from the social and other technical systems. The revision of the contemporary waste legislation proposed by the TSPRW will bring better understanding of the underlining issues and help its better application.
There are big data gaps as concerning MSW quantities and composition. The information available through international organizations like Eurostat and EEA depends on the one that is supplied by the Member countries. Good and environmentally sound waste management system cannot rely on incomplete and inaccurate data. There is great need for data collection about MSW composition in Bulgaria which can further be used for planning purposes. The
71

roles of the different institutions that will be involved, mainly BGEEA and BGNSI, should be clearly defined in order to prevent the collection of one and the same data and data that is not relevant.
The availability of municipal waste management plans is not enough for proper operation of the waste management system as the example from StO proves. There is lack of effort in their implementation and loose control may lead to situations that are threatening the health of the people. There is a need for capacity building and gathering of relevant information about the MSW that will help the timely and proper decisions.
The present national environmental policy making does not consider global environmental consequences due to the fact that it is focused on achieving local environmental targets. Even if life-cycle perspective is used during the process it usually considers only data about local material extraction, production, consumption and waste management. It does not include the environmental and social effects that arise in other countries. Even at European level the environmental objectives are local meaning that they are not focused on decreasing the environmental impacts in China for example. In this respect, a global life-cycle perspective should be used when planning for a sustainable society and the role of multinational companies may prove to be more important in the future.
Tools, like ORWARE, that incorporate life-cycle thinking are and will be used in environmental policy making. Even though problems may exist in terms of the required skills and knowledge, examples show that good cooperation between policy makers, scientists and other experts will be the key for their successful application.
72
8 RECOMMENDATIONS Of great importance for the future use of ORWARE as a tool for systems analysis of MSW is the development of sub-models that describe metals and glass recycling, missing in the present research. Sub-models for treatment of WEEE, spent batteries, waste oils and installation for waste separation may prove useful especially when planning MSWM at national level.
The files that are used for input of the different parameters were developed along with the different sub-models of ORWARE. Some of them are well documented with relevant comments inside the files while others are difficult to understand. Of great help to future users of the model will be all files to be properly documented. Further, development of graphical interface for input of the required parameters as well as for visualization of the results will be of help especially if it will be used for supporting policy makers.
Insufficient data and lack of time and resources did not allow the detailed description of the MSW generation. The generated amounts were considered to arise from three different settlement types. Those are supposed to include all MSW including those from businesses, offices, markets, streets, etc. A more detailed description that represents better the real situation can help better understanding of the whole system because now all the waste is combined in one big stream.
Due to lack of data and time constrains the economic aspects of MSWM have not been analysed in this study. Those are of great importance for the planning of every waste management system and further future research is needed in this area. Most of the costs that are related with the MSWM are available in ORWARE and if the needed input data is available it is possible to add the economic aspect as well.
There is a great need for more data concerning MSW composition in Bulgaria. The available information is hardly representative for the whole country. Besides that more information should be made available on the local social and economical factors that influence the development of the waste management systems.
73

74

9 ACKNOWLEDGEMENTS I would like to thank Björn Frostell, who gave me the inspiration to pursue this thesis work, agreed to be my supervisor, introduced me to the field of systems analysis and opened my eyes for a whole new world, for his continuous support, competent guidance, invaluable comments and discussions, and the time he spent working on my final report.
I am thankful to the Swedish Institute for awarding me the scholarship that made my education in Sweden and the publication of this thesis possible, especially to Camilla Wristel who was responsible for my case, for her assistance and help throughout the duration of my studies.
My gratitude goes to Monika Olsson, who accepted to read my work and be my opponent during the thesis presentation, for her questions and comments that helped to make the final report better. Also to Getachew Assefa, who gave me assistance with the ORWARE model when I needed it, and to Kosta Wallin, for his continuous help and aid in resolving practical issues of working in the department of Industrial Ecology.
During my research I met and spoke to many people whom I would like to thank for their time and contribution, including Jan-Olov Sundqvist from IVL and the KTH teachers Anna Björklund, Lisa Van Well and Lars-Göran Mattson.
I would like to thank my former colleagues from the Waste Department in the Executive Environmental Agency of Bulgaria, especially Veselina Roshleva, Keti Yankova, Kamelia Georgieva and Damian Babanin, for their help in gathering the information that I needed as well as their comments and suggestions.
Thanks to all my old friends from Bulgaria for the encouragements and my new friends from the EESI program, who made my stay in Sweden an unforgettable experience and for giving me the opportunity to see all the colours of the World.
Last but not least I would like to thank my family, especially my mother for giving me life and believing in me, and my wife whose love and support never ceased and without whom I probably would have never pursued the EESI program in the first place.
Stockholm, May 2007
Aleksandar Kolev
75

76

10 REFERENCES Baky A. and Eriksson O., 2003. Systems Analysis of Organic Household Waste management
in Denmark. Environmental Project No. 822 2003, Danish Environmental Protection Agency
Björklund A., 1998. Environmental systems analysis of waste management with emphasis on substance flows and environmental impact. Licentiate Thesis, Division of Industrial Ecology, Department of Chemical Engineering and Technology, Royal Institute of Technology, Stockholm, Sweden
Björklund A., 2000. Environmental systems analysis of waste management – Experiences from applications of the ORWARE model. Doctoral Thesis, Division of Industrial Ecology, Department of Chemical Engineering and Technology, Royal Institute of Technology, Stockholm, Sweden
Björklund A., Johansson J., Nilsson M., Eldh P., Finnveden G., 2003. Environmental Assessment of a Waste Incineration Tax - Case Study and Evaluation of a Framework for Strategic Environmental Assessment. Division of Defence Analysis, FOI- Swedish Defence Research Agency, Stockholm. ISSN1404-6520, Fms-report 184.
Blekinge Institute of Technology (BTH), 2007. MiSt - Tools for Environmental Assessment in Strategic Decision Making. Last accessed April 2007 at http://www.sea-mist.se/
Boulding K., 1966. The Economics of the Coming Spaceship Earth. Pp. 3-14 in Environmental Quality in a Growing Economy, edited by K. Boulding et. al. Baltimore: John Hopkins University Press.
Bruntland G. (ed.), 1987. Our common future: The World Commission on Environment and Development. Oxford: Oxford University Press
BT-Engineering, 2004. Perform a study, optimization of the existing system for collection and transportation of waste and development of a plan for decommissioning and rehabilitation of the existing landfills in six regions: Montana, Pernik, Rouse, Sevlievo, Sozopol and Silistra. Sofia.
Bulgarian Government Information Service (BGIS), 2005. About Bulgaria: History. Last accessed April 2007 at http://www.government.bg/cgi-bin/e-cms/vis/vis.pl?s=001&p=0159&n=000002&g
Bulgarian Ministry of Environment and Water (MOEW), 2003. National Waste Management Programme. Last accessed April 2007 at http://www2.moew.government.bg/recent_doc/waste/NWMP_2003-2007EN_fin.doc
Bulgarian Ministry of Environment and Water (MOEW), 2006. Guidelines for development of municipal waste management plans. Last accessed April 2007 at http://www.moew.government.bg/recent_doc/waste/WMGuide.pdf
Bulgarian Ministry of Environment and Water (MOEW), 2007a. About Us: History. Last accessed April 2007 at http://www2.moew.government.bg/about_us/history_e.html
77

Bulgarian Ministry of Environment and Water (MOEW), 2007b. National strategy for reducing the quantities of municipal biodegradable constituents for deposition on landfill sites in Bulgaria, Draft. Last accessed April 2007 at http://www2.moew.government.bg/recent_doc/waste/Draft_Strategy_Biodegradable_Waste.doc
Bulgarian Ministry of Foreign Affairs (BMFA), 2005. General Information about Bulgaria. Last accessed April 2007 at http://www.evroportal.bg/article_view.php?id=720744
Bulgarian Ministry of Regional Development and Public Works (MRDPW), 2004. Methodology for categorization of the administrative and territorial units in Republic of Bulgaria. Last accessed April 2007 at http://www.ncrdhp.bg/mrrb/docs/doc_85.doc
Bulgarian National Statistical Institute (BGNSI), 2006. Environment 2004, Yearly bulletin. Sofia.
Bulgarian National Statistical Institute (BGNSI), 2007a. National Register of Populated Places. Last accessed April 2007 at http://nrnm.nsi.bg/index.php?ezik=en
Bulgarian National Statistical Institute (BGNSI), 2007b. Population and Dwellings. Last accessed April 2007 at http://www.nsi.bg/Population_e/Population_e.htm
Chakarov D., 2006. The harmonization of the Bulgarian environmental legislation with the European is complete, expose in front of the Environment, Public Health and Food Safety Commission of the European Parliament. Last accessed April 2007 at http://moew.government.bg/ns/recent_news.php?action=fullnews&showcomments=1&id=724
Commission of the European Communities (CEC), 2004. Impact Assessment on the Thematic Strategy on the prevention and recycling of waste and the immediate implementing measures. Commission Staff Working Document, Non-Official Document. Brussels: European Commission's Environment Directorate-General. Last accessed April 2007 at http://ec.europa.eu/environment/waste/pdf/ia_waste.pdf
Commission of the European Communities (CEC), 2005a. EU Waste Policy – The Story Behind the Strategy. Last accessed April 2007 at http://ec.europa.eu/environment/waste/pdf/story_book.pdf
Commission of the European Communities (CEC), 2005b. Proposal for a Directive of the European Parliament and of the Council on waste, COM(2005) 667 final. Brussels: Commission of the European Communities. Last accessed April 2007 at http://eur-lex.europa.eu/LexUriServ/LexUriServ.do?uri=CELEX:52005PC0667:EN:NOT
Commission of the European Communities (CEC), 2005c. Taking sustainable use of resources forward: A Thematic Strategy on the prevention and recycling of waste, COM(2005) 666 final. Communication from the Commission to the Council, the European Parliament, the European Economic and Social Committee and the Committee of the Regions, Brussels: Commission of the European Communities
78

Commission of the European Communities (CEC), 2006. Report from the Commission to the Council and the European Parliament on Implementation of the Community Waste Legislation for the Period 2001-2003: Directive 75/442/EEC on waste, Directive 91/689/EEC on hazardous waste, Directive 75/439/EEC on waste oils, Directive 86/278/EEC on sewage sludge, Directive 94/62/EC on packaging and packaging waste and Directive 1999/31/EC on the landfill of waste. Brussels: Commission of the European Communities. Last accessed April 2007 at http://eur-lex.europa.eu/LexUriServ/LexUriServ.do?uri=COM:2006:0406:FIN:EN:HTML
Co-operative Programme for Monitoring and Evaluation of the Long-range Transmission of Air pollutants in Europe (EMEP), 2003. Photoxidant pollutants. Last accessed April 2007 at http://www.emep.int/photoox.html
Council Regulation (EC) No 322/97 of 17 February 1997 on Community Statistics, Official Journal. L52 of 22 February 1997, p. 2.
Dalemo M. Björklund A. Oostra H. Sonesson U., 1998. Systems analysis of nutrient recycling from organic waste. JTI report Kretslopp och avfall No. 15, Swedish Institute of Agricultural Engineering, Uppsala, Sweden
Dalemo M., 1999. Environmental systems analysis of organic waste management. The ORWARE model and the sewage plant and anaerobic digestion sub-models. Doctoral Thesis, Department of Agricultural Engineering, Swedish University of Agricultural Sciences, Uppsala, Sweden
Dalemo M., Sonesson U., Björklund A., Mingarini K., Frostell B., Jönsson H., Nybrant T., Sundqvist J.-O. and Thyselius L., 1997. A simulation model for Organic Waste Handling Systems, Part 1: Model Description. Resources, Conservation and Recycling, 21, pp. 17-37
Directive 2006/12/EC of the European Parliament and of the Council of 5 April 2006 on waste. Last accessed April 2007 at http://eur-lex.europa.eu/LexUriServ/LexUriServ.do?uri=CELEX:32006L0012:EN:HTML
Emmelin L. (ed.), 2006. Effective Environmental Assessment Tools - critical reflections on concepts and practice. Report No 1 from the MiSt-programme, Research Report No 2006:03, Blekinge Institute of Technology
Eriksson O. and Frostell B., 2000. An approach to sustainability assessment of energy systems, Chapter 16 in “Building Sustainable Energy Systems–Swedish Experiences”. Stockholm: Swedish National Energy Administration
Eriksson O., 2003. Environmental and economic assessment of Swedish municipal solid waste management in a system perspective. Doctoral Thesis, Division of Industrial Ecology, Department of Chemical Engineering and Technology, Royal Institute of Technology, Stockholm, Sweden
Eriksson O., Frostell B., Björklund A., Assefa G., Sundvist J-O., Granath J., Carlsson M., Baky A. and Thyselius L., 2002. ORWARE – a simulation tool for waste management. Resources, Conservation and Recycling, 36/4, pp. 287-307
79

European Commission (EC), 1999. EU Focus on Waste Management, 18 pp. Luxembourg: Office for Official Publications of the European Communities
European Commission (EC), 2001. Critical Review of Existing Studies and Life Cycle Analysis on the Regeneration and Incineration of Waste Oils. Last accessed April 2007 at http://ec.europa.eu/environment/waste/studies/oil/waste_oil.htm
European Environment Agency (EEA), 2003. EEA strategy 2004–2008. Luxembourg: Office for Official Publications of the European Communities, 28 pp. Last accessed April 2007 at http://www.eea.europa.eu/documents/strategy-docs/strategy_web-en.pdf
European Environment Agency (EEA), 2004. The European Environment Agency: who we are, what we do, how we do it, General Brochure. Last accessed April 2007 at http://reports.eea.europa.eu/brochure_2006_0306_112210/en/general_brochure_web-EN.pdf
European Environment Agency (EEA), 2007. Themes: Acidification. Last accessed April 2007 at http://www.eea.europa.eu/themes/acidification
Frostell B., 2006. Personal communication
Funtowicz S.O., Martinez-Alier J., Munda G., Ravetz J.R., 2000. Information tools for environmental policy under conditions of complexity. Environmental issues series No 9, European Environment Agency. Luxembourg: Office for Official Publications of the European Communities. Last accessed April 2007 at http://reports.eea.europa.eu/ISSUE09/
Höreth M., 2001. The European Commission’s White Paper on Governance: A ‘Tool-Kit’ for closing the legitimacy gap of EU policymaking? Discussion Paper presented at the Workshop “Preparing Europe’s Future. The contribution of the Commission’s White Book on Governance”, Center for European Integration Studies Bonn & Europe 2020, in co-operation with the Representation of the North Rhine Westphalia to the European Union in Brussels, November 2001
Mathworks Inc., 2005. Matlab v. 7.1.0.246(R14) SP32 August 2005 with Simulink 6.3. Info at http://www.mathworks.com/
Meadows D., 1972. The Limits to Growth. New York: Universe Books
Meadows D., Randers J., and Meadows D., 2004. Limits to Growth - the 30-Year Update. City: Chelsea Green Publishing Company
Moberg Å., 2006. Environmental systems analysis tools for decision-making – LCA and Swedish waste management as an example. Licentiate thesis, Environmental Strategies Research Group, Department of Urban Planning and Environment, Royal Institute of Technology, Stockholm, Sweden
Pearson Education, publishing as Infoplease, 2007. Bulgaria: Economy. The Columbia Electronic Encyclopedia. Last accessed April 2007 at http://www.infoplease.com/ce6/world/A0857062.html
80

Petkov V., 2007. Europe => Bulgaria – Map. Last accessed April 2007 at http://www.gta.igs.net/~vpetkov/pictures/bulgaria/bulgaria1.html
RDC-Environment & Pira International, 2003. Evaluation of Costs and Benefits for the Achievement of Reuse and the Recycling Targets for the Different Packaging Materials in the Frame of the Packaging and Packaging Waste Directive 94/62/EC. Last accessed April 2007 at http://ec.europa.eu/environment/waste/studies/packaging/costsbenefits.pdf
Schübeler P., 1996. Conceptual framework for municipal solid waste management in low-income countries. United Nations Development Program, UMP Working Paper Series no. 9. St. Gallen, Switzerland: SKAT
SGS Institut Fresenius GmbH (SGS), 2006. Draft National strategy for reducing the quantities of biodegradable waste constituents for deposition on landfill sites, Final Report. Project FKZ 380 01 109. Sofia
Sonesson U., 1996. The ORWARE Simulation Model-Compost and Transport Sub-Models. Licentiate Thesis, Department of Agricultural Engineering, Swedish University of Agricultural Sciences, Uppsala, Sweden
Sonesson U., 1998. Systems Analysis of Waste Management – the ORWARE Model, Transports and Compost Sub-Models. Doctoral Thesis, Department of Agricultural Engineering, Swedish University of Agricultural Sciences, Uppsala, Sweden
Statistical Office of the European Communities (Eurostat), 2007. Available at http://ec.europa.eu/eurostat/
Sundqvist J.-O., 2006. Personal communication
Sundqvist J.-O., Baky A., Björklund A., Carlsson M., Eriksson O., Frostell B., et al, 2000 Systems Analysis of Energy Recovery from Waste – Evaluation of Energy, Environment and Costs. Case study Uppsala, Swedish Environmental Research Institute, Stockholm, Sweden.
Swedish Association of Waste Management (RVF), 2006. Waste management in Sweden. Annual publication, Malmö. Last accessed April 2007 at http://www.rvf.se/se/netset/files3/web/P01.m4n?download=true&id=1115_49331357
Trisyanti D., 2004. Solid waste management of Jakarta – Indonesia: an environmental systems perspective. Master Thesis, Division of Industrial Ecology, Department of Chemical Engineering and Technology, Royal Institute of Technology, Stockholm, Sweden
United States Energy Information Administration (USEIA), 2007. Comparison of Global Warming Potentials from the IPCC’s Second and Third Assessment Reports. Last accessed April 2007 at http://www.eia.doe.gov/oiaf/1605/gg03rpt/summary/special_topics.html
United States Geological Survey (USGS), 2007. Toxic Substances Hydrology Program: Eutrophication. Last accessed April 2007 at http://toxics.usgs.gov/definitions/eutrophication.html
81

Waste Management Act. Promulgated State Gazette No. 86/30.09.2003
Waste Online, 2004. History of waste and recycling information sheet. Last accessed April 2007 at http://www.wasteonline.org.uk/resources/InformationSheets/HistoryofWaste.htm
Wiegel U. and Ebert K., 2005. Development of National strategy for reducing the quantities of municipal biodegradable constituents for deposition on landfill sites, Interim report. Project FKZ 380 01 109, SGS Institut Fresenius GmbH, Ingenieurconsulting Umwelt und Bau (ICU) and SGS Bulgaria Ltd.
World Bank, 2005. Bulgaria: The Road to Successful EU Integration – The Policy Agenda. Country Economic Memorandum, Poverty Reduction and Economic Management Unit, Europe and Central Asia Region. Report No. 34233-BG. Last accessed April 2007 at http://go.worldbank.org/NVZG6V22Q0
82


TRITA-IM 2007:12 ISSN 1402-7615 Industrial Ecology, Royal Institute of Technology www.ima.kth.se