Munich Personal RePEc Archive - uni- · PDF fileMunich Personal RePEc Archive ... prerequisite...
24
Munich Personal RePEc Archive Marx’s theory of crisis in the context of financialization. analytical insights on the current crisis Nikos Stravelakis National and Kapodestrian University of Athens - Department of Economics 14. June 2012 Online at http://mpra.ub.uni-muenchen.de/39522/ MPRA Paper No. 39522, posted 19. June 2012 00:55 UTC
Transcript of Munich Personal RePEc Archive - uni- · PDF fileMunich Personal RePEc Archive ... prerequisite...
MPRAMunich Personal RePEc Archive
Marx’s theory of crisis in the context offinancialization. analytical insights onthe current crisis
Nikos Stravelakis
National and Kapodestrian University of Athens - Department ofEconomics
14. June 2012
Online at http://mpra.ub.uni-muenchen.de/39522/MPRA Paper No. 39522, posted 19. June 2012 00:55 UTC

PREFACE
In the context of the current crisis a vigorous debate is taking place with regard to its’
cause1. A debate which has important policy implications in the sense that it justifies or
condemns the main reaction policy to the evolution of the crisis i.e. the persistent
securitization of financial capital on a global scale through trillions of government and
central bank money resting in private bank vaults until proven insufficient, triggering a new
round of bank refinance and / or recapitalization.
The main question to be answered, in order to understand the present crisis, is whether the
explosion of interest rates and the lack of credit is the cause or the trigger of a depression
and why. If financial turmoil is the cause of depressions then each crisis is unique, the result
of a «black swan» 2game and securitization will prove efficient since no risk arises from
capitalist production and the reproduction of capital. Of course, history has taught us that
capitalist economies experience periods of prosperity followed by depressions with almost
periodical recurrence3. Marxitst economists have provided important theoretical and
empirical work showing that the tendency of the rate of profit to fall produces «long waves»
in capitalist production as explanation to these economic events4.
However, the present crisis poses additional questions for Marxist and heterodox
economics, since it prevailed following a period of stable (not declining) profit rates5
associated with weak corporate growth side by side with an explosion of financial sector
growth a phenomenon referred to as financialization of capital. Contributing to the response
to these questions is the main scope of this paper.
We argue that it is the level rather than the dynamics of the rate of profit which determines
the turning of a «possible crisis», as elaborated in Part II of the «Theories of Surplus Value»
to an actual crisis. This is because it is the «rate of profit of enterprise» (profit less interest)
which determines active investment. Marx himself, as well as, Marxist economists are quite
categorical in stating that the profit of enterprise turns stagnant in a crisis6. A sharp increase
in interest rates separates a period of prosperity from a period of crisis. The dynamics of the
profit rate can only be implied in this context and can by no means be treated as a
prerequisite for a crisis to prevail although the profit rate prevailing is the dominant factor.
1 An extensive survey is part of Lapavitsas 2009 : Financialization and Capitalist Accumulation:
Structural Accounts of the Crisis of 2007-9 Discussion paper 16. RMF series SOAS. 2 Roubini N and Mihm S «Crisis Economics» Penguin books 2011
3 Flamant and Jeanne Singer-Kerel, Modern Economic Crises, London: Barrie &
Jenkins, 1970 4Grossman H. « Law of Accumulation and Breakdown» ,Pluto publications 1929, Mandel E. «Long
Waves in Capitalist Development» Cambridge University Press 1980, Shaikh A : «The Falling Rate of Profit as the Cause of Long Waves: Theory and Empirical Evidence» in New Findings in Long Wave Research, Alfred Kleinknecht, Ernest Mandel, and Immanuel Wallerstein (eds.), Macmillan Press, London 5 Many economists agree that the profit rates never increased but were stabilized in , interesting
empirical evidence is included in Shaikh A. : «The First Great Depression of the 21st Century» Socialist Register, 2011 6 Shaikh 1992 sited above, Marx K «The Capital VIII p 235 International Publishers, NY, [n.d.]First
Published: 1894; On-Line Version: Marx.org 1996, Marxists.org 1999
However, Marx considers any crisis explanation on the basis of interest and credit as an
obvious tautology7. Since profitability is the driving force of capitalist growth and the
prevailing rate of profit the main determinant of profitability then a connection between the
prevailing rate of profit and the rate of interest should exist. Otherwise, the ideas led out in
this and the previous paragraph contradict each other. Marx argues about a possible
connection when he writes:
«it [ the rate of interest-NS] “depends partly upon the rate of gross profits, partly on the proportion in which these are separated into profits of capital and those of enterprise. This proportion again depends upon the competition between the lenders of capital and the borrowers; which competition is influenced, though by no means entirely regulated, by the rate of gross profit expected to be realized» ( Capital VIII p. 2378). We can associate the above text with Marx’s argument that low profit rates are associated (actually caused by) high organic composition of capital and theorize on the anticipated motion of some basic financial ratios. If the organic composition of capital is high then we can anticipate that the leverage ratio (capital advanced over equity) to be high. Capital advanced will be increasing, «the productive powers of nature must be paid for», as Marx states. At the same time profitability is low, or declining, and since corporate equity comprises mainly of retained earnings we can safely assume a high leverage ratio. We can show further that if capital advanced equals to net debt plus equity times capacity utilization then a high leverage ratio implies a high debt to equity ratio. Therefore, a low rate of profit, associated with a high organic composition of capital, implies, especially in normal capacity utilization, higher absolute and relative debt needs. The lower the rate of profit, the greater the dependence of capital advanced on financial capital. However, if the mass of profit is sufficiently high to restore financial ratios to their previous levels, at least in part, then interest rates may rise at first but the money creation powers, of the banking sector, will be restored, through corporate savings, interest rates will decline and the accumulation will proceed normally. From the above we can also conclude that if the profit of enterprise is expected to turn stagnant in a crisis, there must exist a limit, in the rate profit, beyond which the mass of profit becomes so low that the restoration of financial ratios is unfeasible. The demand for bank debt, to pay for the costs of production, is high9 and at the same time the supply of funds is low : « because confidence in the continuity of the reproduction process has been shaken», due to low profitability, and «because the demand for ... commercial credit [as
opposed to bank credit-NS]10 diminishes.» (VIII p.330-331). Therefore, the banking system
7 We refer to the known citation of Grossman from the «Theories of Surplus Value»:
In investigating why the general possibility of crisis turns into a real crisis,
in investigating the conditions of crisis, it is therefore quite superfluous to
concern oneself with the forms of crisis which arise out of money as
means of payment [credit— HG]). This is precisely why economists like to
suggest that this obvious form is the cause of crises. (pp. 514-5)
8 The quotation mark in the passage refers to Marx’s citation of Ramsey
9 Because the leverage ratio is high.
10 Words added by the author. In the whole passage Marx makes a clear distinction between Bank and

can no longer economize on the circulating medium, via commercial credit, and build loanable reserves. The funds released from commodity circulation, due to declining economic activity are used up immediately as «means of payment», because payments are now settled in cash rather than bills of exchange. This explains why interest rates reach their peak in a crisis11. Furthermore, because the rate of profit poses an upper limit for the rate of interest it can be concluded that in a crisis the rate of interest will tend towards the rate of profit, or even exceed it, which means that the profit of enterprise will tend to zero, or even negative and because it determines corporate investment, growth turns to stagnation or decline. We have incorporated the above insights in a growth model where accumulation depends on the profit of enterprise and fluctuations represent variations in the rate of interest the latter influenced, through financial ratios, by the prevailing rate of profit which is treated as data to keep the dynamics traceable. The model exhibits very interesting properties, under certain rate of profit values it exhibits secular or chaotic growth and for different values profitability and production turns stagnant. Furthermore, the model touches on important work from Marxist economists relating to internally generated growth as presented in the schemes of expanded reproduction (Dumenhil 197712), elaborations on the possibility of crisis theory in relation to Marx’s theory of money (Folley 198313), the association of effective demand to corporate finance and the interaction of productive capacity with capacity utilization (Shaikh 198914). The main difference is that the interest rate is expressly determined and varies in time. Our above mentioned model, however, pictures economic events attributable to the previous depression of the 70’s also referred to as the great stagflation. Back then through deregulation of the labor market and the demolition of the welfare state profit rates, which were falling during the preceding postwar decades, were stabilized, but never reached the growth bracket. In order to stimulate growth, interest rates were suppressed through financial market deregulation. Modifying the initial model, we will show, that bank deregulation, was not the result of some reckless policy or irrational behavior, but an attempt to overcome the problem of low profit rates, through the extension of the balance sheets of households, corporations, banks and sovereigns15. These changes in corporate behavior together with the ability of the financial sector to increase the velocity of circulation, through the fusion of financial risk to the whole society, create a new set of dynamics and causal relations where finance can overcome the barrier of the rate of profit and restore growth. However, this type of policies, as we will show, have limits imposed by
commercial credit.
11 «The rate of interest reaches its peak during crises, when money is borrowed at any cost to meet
payments» (Capital VIII p. 235).
12 Dumenil, G. 1977. Marx el Keynes Face a la crise. Paris: Economica.
13 1984. "Money, Accumulation, and Crises." Mimeo
14 Shaikh A. Accumulation, Finance, and Effective Demand in Marx, Keynes, and Kalecki in Financial
Dynamics and Business Cycles: New Prospects, Willi Semmler, (ed.), M.E. Sharpe, Armonk, New York (1989). 15
We do not consider household and sovereign finance in our context but the alteration of growth dynamics can be elaborated in the simplest context of corporate loans offered and corporate deposits received by the banking sector.

profitability. When financial capital growth exceeds these limits, the system collapses as it did in 2007 – 2009 triggering of the present depression. The paper is organized as follows: Section 1 provides notation and accounting definitions together with their analytical implications. Section 2 analyzes the assumption of the model. Section 3 includes the solution of the original model, stability and fluctuations analysis. Section 4 provides simulation results of the main model variables in growth and stagnation. Section 5 modifies the original model to incorporate the special policies that led to the present depression. The final section summarizes the findings and policy implications.
2. Notation and definitions :
We assume, following Marx, one period lag in profit realization. Production takes time,
capital is advanced at the beginning of the production period whereas profits are realized at
the end of the period.
We define the rate of profit as the ratio of next period profits to total capital advanced
We keep the rate of profit constant. The rate of profit is a «slow» variable in Marxist
economics it changes much slower than interest and prices, thus it is reasonable to appear
as data in a model which investigates profit growth against interest rate dynamics. However,
there are further analytical implications, because under a variable profit margin on costs the
prevailing rate of profit will deviate from its’ gravitation point (constant or declining) the
motion reflecting opposite variations in capacity utilization. We assume a constant profit
margin on costs which implies that the basic rate of profit (the gravitation point or trend of
the rate of profit) will equal the prevailing rate of profit. This assumption is equivalent to
ruling out counteracting tendencies on the profit rate in order to explain the turning of
normal accumulation to depression. We will elaborate on this point below in analyzing
capital advanced and capacity utilization, full formal proof is provided in Appendix1.
We define capacity utilization as the ratio of capital advanced to total assets or liabilities:
This is not a typical definition it is derived from the ratio output to capacity
(which is the
definition) under specific assumptions. For the numerator, since the rate of profit is assumed
constant capital advanced is a linear function of output16.
For the denominator the argument is longer. Capacity is the part of output which varies with
capital stock. Since the organic composition of capital is assumed constant and any
inventory can be decomposed to the wage cost which produced it and the surplus value
embodied in it, total assets can be expressed in terms of constant capital. If the «co-
16
Because a constants profit rate presupposes a constant capital output ratio.
integration» assumption (Shaikh and Moudud 2004) holds, meaning that capital stock is a
linear function of output, and there are no price value deviations then total assets is a linear
function of capacity if capacity is fully utilized. In other words the accounting measure «total
assets» reflects corporate «economic capacity». We can elaborate on this definition as
follows:
Where ROA is return on assets and TC total costs. If the rate of profit is constant any
increase in ROA is preceded by an equal increase in capacity utilization. The relation implies
that capacity utilization reacts on capital stock and the rate of growth of profitability as
shown below. Furthermore, with constant organic composition and total capital advanced a
linear function of constant capital, if depreciation rates are constant, a constant rate of
profit prevails.
For equations 1,2 to hold it must be further assumed that at the end of period (t)
corporations which were operating with market credit for any amounts in excess of last
years’ savings will settle payments and dividend needs with new debt depending on the
profit realized and the rate of savings. In other words the corporate asset side, at the
beginning of period t+1, comprises of fixed assets and undesired inventories and the liability
side of net debt (debt less cash in hand) and equity. This explains the following accounting
definition:
( )
( )
Equation 3 is an excess demand function, when it takes positive values investment exceeds
savings and vice versa.
Taking time differences on equation 2, given equation 3 and assuming further that
corporations will make their production plans on the existing capacity, which means that
they take into account the operating fixed assets at the time, since any additions to constant
capital will need time to become operational, we arrive to the following relation (derivation
is provided in Appendix2).
( )
( )
Equation 4 tells us that the rate of growth of capacity utilization depends negatively on the
utilization of existing capacity and positively on the rate of growth of investment.
Corporations will add capacity when capacity utilization approaches or exceeds unity
leading to a decline in the rate of growth of capacity utilization and at the same time strong

growth leads to increased utilization of productive capacity and vice versa17. For a stable rate
of growth, different from zero, capacity utilization will fluctuate around unity and the rate of
growth of capacity utilization will gravitate around zero. If the rate of profit growth drops to
zero then capacity utilization will take a minimum constant value well below unity.
The last definition is the corporate share of gross profits:
In other words the ratio of net corporate profit to gross profits. This ratio can be expressed
also as the difference of the debt service ratio
from unity.
Summing, the definitions above, we need to stress that using a single (basic) rate of profit
implies a constant profit margin which is the equivalent to abstracting from «counteracting
tendencies» in our analysis. This implies further that any variation in the return on assets
(ROA) reflects increasing utilization of productive capacity. Which is equivalent to assuming
that the rate of growth capacity utilization reacts on negatively on the utilization of existing
capacity and positively on corporate investment. This leads to full utilization of productive
capacity in normal accumulation and underutilization in stagnation. We now turn to laying
out the main assumptions of our model.
1. Assumptions :
( ) ( )
Capital accumulation depends on the rate of profit of enterprise and the rate of retained
earnings (s). The rate of interest is treated, in this context, as «opportunity cost» for
engaging to or abstaining from active investment. The relation provides insight on how a
breakdown in accumulation may incur. When the rate of profit of enterprise shrinks capital
accumulation slows down, since industrial capitalists lack the profit incentive to take the
risks of production. This may lead to a Marxian «possible crisis» of the first type (breakdown
in the reconversion of commodities to money) because capital will remain in monetary form
and commodities will pile up. But if the capital exiting the production process is meant to
retire existing debt or meet previous payments for which it falls short then a crisis of the
second type (« the non- fulfillment of a whole series of payments»)18
may prevail. In the
first case money exit circulation and function as a store of value and in the second money
from «nominal money of account» turns to a hoard, a « universal commodity»19.
Because, the rate of profit is assumed constant (eq 1) the rate of growth of gross profits equals the rate of growth of capital and equation 6 can be expressed as a function of the rate of growth of gross profit as shown below. ( ) ( )
17
A similar equation can be found in Shaikh 1989. 18
«Theories of Surplus Value» part II ch. 11 19
Capital VI ch 3 p.235

( )
The rate of interest is a linear function of the rate of profit and the corporate share of gross
profits. Equation 7 can be easily derived assuming that the share of gross profit is a linear
function of the rate of profit of enterprise as shown below:
( )
Equation 7 is also in line with Marx’s definition of the determinants of the interest («it [ the
rate of interest-NS] “depends partly upon the rate of gross profits, partly on the proportion in
which these are separated into profits of capital and those of enterprise.).
Elaboration of eq.7 and 7’ provides further insight on the interest rate equation. From the
definition of (y) and equation 7 the following result holds
, since for this value the
rate of interest equals zero. It is easy to establish that for positive interest rates
must hold. Given that for y=1 debt is zero then for a financial sector to exist which
means r<a. Substituting the above result in equation 7 we find:
7’’
( ) ( )
( ) ( ) ( ) ( ) ( )
( )
Where
the debt/gross profit ratio. When the rate of interest gravitates around its’
maximum, which means( ) , the following relation holds:
( )
(
) (
) ( )
Therefore, when current debt is needed to pay for last years’ capital, gross profit equals to
interest payments. This means also, because gross profitability is stagnant, since (i=r), that
the contribution of corporate equity in production drops to zero in the sense that part of
corporate fixed capital remains outside the production process, seizes to be capital, it is no
longer set in motion by living labor. This does not mean that the accounting measure
«shareholders’ equity» necessarily drops to zero. Accounting equity may be reduced
because of losses, what remains of it, however, stands against land, buildings and machinery
which remain unused, but are recorded in the books either at «purchase cost» or at
«replacement cost». In other words corporations, as a reaction to declining profits, downsize
their activity to the point that idle fixed assets represent amounts backed by their existing
reserves and debt pays for production. In this context financial capital claims for total gross
profit since it finances total production. The above mean that capacity utilization drops to a
minimum as illustrated bellow:

In normal accumulation capacity utilization may drop due to fluctuations in demand but
debt is reduced instead of equity. Although capacity utilization also drops in a crisis debt
cannot be retired because all profit is paid as interest, thus it is equity which backs the
capacity utilization adjustments. Under the same reasoning if the debt / equity ratio is high
capacity utilization will remain relatively high because there is not enough equity, relative to
debt, to back a sharp downsizing in production. This point can be useful in the discussion of
inflation, as well as the evaluation of the effectiveness of «internal deflation» policies which
are used as theoretical justification for fiscal austerity packages implemented by the EU and
the IMF, which is a possible extension of this work.
The modified form of the rate of interest rate equation 7’’ indicates also that for the later to
be positive, given a>r which is the plausible choice, the following condition must hold:
The relations derived so far indicate that when the debt / capital advanced ratio tends to
, y will tend to as well. Furthermore when the debt / capital advanced ratio equals
to unity the corporate profit share equals zero. The implied assumption is that gross profit is
distributed between banks and corporations basis the debt required to total capital
advanced ratio a measure closely related to the rate of profit. («This proportion [ of the
distribution between profit from interest and profit from enterprise-NS] again depends upon
the competition between the lenders of capital and the borrowers; which competition is
influenced, though by no means entirely regulated, by the rate of gross profit expected to be
realized.» (Capital VIII p. 237)). The difference with the previous text is that, because we
keep the rate of profit constant, expected rate of profit equals the actual.
The illustration, so far, has shown that the outline of the rate of interest sited in Capital VIII
can be fully described by the definition of the corporate share of gross profit, the linear
relation between the later and the rate of profit of enterprise and the limit
. The
question is how this definition reflects financial market relations. In this connection, we now
turn to the interpretation of the second parameter of our model the parameter a.
Following Marx we identify credit as the main determinant of the velocity of circulation. In
this context we attest that the velocity is at a minimum in times of crisis and peaks in times
of prosperity. At the same time the profit of enterprise follows the same path. Remembering
that we have assumed a linear relation of the profit of enterprise with the corporate share
of gross profit, a relation of the following form must hold:
( )
Where v stands for the velocity of circulation and stands for minimum velocity.
Therefore the parameter (a) can be viewed as the constant ratio of the difference of the
velocity from its’ minimum to the share of corporate profits. High values of (a) imply a
banking system which will create a big amount of loanable reserves from the deposits in the
hands of individual capitalists and corporations, the opposite holds for low values of a.

We can summarize the process elaborated so far as follows: the debt capital advanced ratio
determines the distribution of profit between interest and profit of enterprise, this ratio is
inversely proportionate to the rate of profit. As the ratio tends to unity the rate of interest
moves towards the rate of profit and the profit of enterprise drops to zero. The reason
interest rates explode is that the velocity declines due to declines in corporate deposits and
with it the ability of banks to accumulate money to lend.
( )
Our final assumption determines the rate of savings. The usual assumption used in Marxist
models is a constant rate of savings, influenced most probably by the Keynesian marginal
propensity story. We argue that in Marxs’ schemes of expanded reproduction, as well as in
real life the rate of corporate savings is highly flexible. Corporations cut back on their
distribution policies as a first reaction to declining corporate profitability because of
increased interest rates or other reasons. Under this line of reasoning we assume that the
rate of savings (corporate retained earnings) is a linear function of the rate of interest.
Assuming further that for i=r s=1 it follows z=1/r, which reduces the model to two
parameters namely the rate of profit (r) and the ratio of velocity to the corporate share of
profits (a).
We will perform one final elaboration of equation 6 in light of equations 7 and 9, in order to
understand the dynamics implied in our assumption on capital accumulation. Substituting 7’’
and 9 into 6 the following relation appears:
Therefore, the growth equation used in the model is a version of a typical «Marxist
equation» where the rate of profit is the dominant factor of growth and growth is internally
generated in the sense that savings are reinvested. The last term, which distinguishes our
approach from the usual equation, the ratio of the corporate profit share to its’ maximum,
introduces, together with the definition of savings, interest rate fluctuations influencing the
prevailing rate of growth. However, as shown in equation 7’’, the prevailing debt / capital
advanced ratio is the determinant of the distribution of profit between profit of capital and
profit of enterprise, given the prevailing rate of profit. We have shown further that a high
debt / capital advanced ratio is associated, in a Marxist context, with a low rate of profit.
Although, the distribution factor
, influences growth it is production which determines
the distribution of profit between different classes of capital which reacts back on capital
accumulation.
Finally, it should be noted that although we will consider only nominal solutions of the
model, inflation (considered in separate work) can be incorporated in the solutions without
altering the conclusions.
3. Solution of the Original Model
Letting
and since from the definition of y (equation 5) it holds
the
following relation holds:
( )
( ) ( ) ( )
Furthermore, taking time difference on the definition of the following relation holds as
well:
( )
( )
( )
( )
((
) ( ) )
Equalizing the two forms, substituting with
and solving for the time difference of
we find:
( ) ( )
((
) ( ) )
( ) ((
) ( ) )
( )
( )
( )
( ) (( ) ( ) )
( )
Substituting equation 7 for we get:
( ) (( ) )
( ) ( )
Which is the basic equation of the model since it determines the time path of y, through
which all nominal variables are determined against time. The nonlinear difference equation
has the following initial solutions: ,
and
( ) .

The derivative is
(( ) )
( ) ( )
(( ) )
( ) ( )
(( ) )
( ) ( )
Substituting the initial roots in the derivative the following stability conditions prevail:
For y1=0
( )
This solution, which implies , pictures a depression since for y=0 the rate of growth of
profits is also zero. The solution is stable when the profit rate is well below the parameter (a)
as indicated by the stability condition. Savings cannot take the system out of stagnation, by
reducing debt, because all gross profit is used to service the existing debt.
For
a damping oscillation of y around zero occurs.
If
the oscillation has a fixed amplitude with period 1. In all other cases
satisfying stability y monotonically converges to zero.
For y2, dy/y=0 which implies i=0. This solution pictures a state where all corporate profits
are consumed and as a result growth is zero because savings are zero.
For y3 the stability condition is (( )
( ))
( ) which holds for r>a. This
solution pictures a situation of negative leverage with growth which is unrealistic.
Although the only meaningful initial solution, , does not produce growth there exists a
region of parameter combinations which satisfy
( ) . Inside this region
profitability is sufficiently high for the system to grow and growth is either secular or chaotic
depending on parameter values and the initial conditions. This region pictures a state of
normal accumulation where savings adjustments reduce interest rates, by reducing debt and
growth resumes. However unlike the keynsian – kaleckian case growth is not demand
driven. More specifically, the growth trend is determined by profitability and fluctuations
around the trend are attributable to effective demand. We elaborate on this point here
below.
Due to our one period lag assumption between capital expenditure and profit realization,
next period savings are expected to cover current investment. The stability condition implies
convergence of the rate of growth of investment to the rate of growth of savings over time
as shown below:
( )

(
)
Although, current investment may exceed or fall short of current savings, end period profits
and savings out of those profits will cover the initial difference if savings grow, on average,
at the same rate with investment20. The equalization of the current levels is almost never
reached because unlike the case of the Keynsian multiplier we don’t require equalization of
supply and demand by assumption21. Furthermore, following Assimakopoullos
(Assimakopoulos 198322), we acknowledge that bringing savings to the desired level will take
time during which interest rates will rise. Thus, fluctuations in the rate of interest reflect
fluctuations in demand, whereas its’ gravitation point results from the rate of profit given
the money creation capabilities of the banking system. In summary it is not the lack of
demand which separates growth from stagnation, but the lack of profitability.
We will now turn to the analysis of the dynamics in stagnation and inside the normal
accumulation region. We can establish that our fourth degree difference equation (eq. 11)
can be fully approximated by an equation of the form:
And for the ruling parameter it holds:
This in turn implies that the Faingenbaum constant (Feighenbaum 198023, Brigs 200124)
applies for the original equation with control parameter:
Knowing three consecutive regions of the mimic equation above and the Feingenbaum
constant
, the dynamics of y are summarized in the table which
follows
20
This is the major methodological contribution of the Goodwin model : «A Growth Cycle», 1967, in Feinstein, editor, Socialism, Capitalism and Economic Growth 21
This result is reached for a=r which means that the rate of interest is constant. 22
Asimakopulos, A. 1983. "Kalecki and Keynes on Finance, Investment, and Saving."
Cambridge Journal of Economics 37(Sept./Dec.) . 23
Feigenbaum MJ The metric universal properties of period doubling bifurcations and the spectrum for a route to turbulence. Annals of the New York Academy of Sciences. 1980;357:330- 336 24
« Feigenbaum Scaling in Discrete Dynamical Systems» Phd Dissertation Department of Mathematics University of Melbourne JAN 2001.

Π Stability and Dynamics
0 < π < 2 monotonic or oscillatory convergence to zero
2 < π < 2,48573 two point stable cycles
2,48573 < π <2,58349827 four point stable cycles
2,58349827 < π <2,611549144 eight point stable cycles
π > 2,611549144 chaotic motion
We recapitulate the dynamics in the phase diagrams of against which follow:
Inside the a-periodical region there exist specific values of the control parameter where
stable cycles of various periods appear. We present one such case for the sake of
completion.
-0,1
-0,05
0
0,05
0,1
0,15
0,2
-0,1 -0,05 0 0,05 0,1 0,15 0,2
two point stable cycle π=2,48
-0,2
-0,1
0
0,1
0,2
0,3
-0,2 -0,1 0 0,1 0,2 0,3
four point stable cycle π=2,5834
-0,2
-0,1
0
0,1
0,2
0,3
-0,2 -0,1 0 0,1 0,2 0,3
eight point cycle π = 2,61155
-0,2
-0,1
0
0,1
0,2
0,3
-0,2 -0,1 0 0,1 0,2 0,3
chaotic motion π=2,62
-0,2
-0,1
0
0,1
0,2
0,3
0,4
0,5
-0,2 0 0,2 0,4 0,6
eliptic motion π=2,96

The mathematical exploration of our basic equation, revealing its’ complex dynamics, has
specific economic inference. First economic data time series, in the model, are expected to
be secular but not necessarily periodical. This imitates closely the behavior of actual
economic data. Second, because of the above the dynamics are uncertain. The latter is one
of the main reasons that policies based on extrapolations usually fail.
Many scientists inside and outside of the economics profession have appreciated these
points. We refer the interested reader to the complete and intuitive presentation of various
economic and financial time series in Mandelbrot 200425.
To complete the presentation we will simulate the time path of the basic variables in normal
accumulation and stagnation.
4 Simulations
In normal accumulation, i.e growth interrupted by recessions, is pictured in the
simulation bellow. The parameter values used is a=0,3 and r= 0,19
25
B.Mandelbrot and R,Hudson «The ( Mis) Behavior of Markets»
-0,1
-0,05
0
0,05
0,1
0,15
0,2
0 20 40 60
The time path of y
0
0,1
0,2
0,3
0 10 20 30 40
Time path of the interest rate
-0,03
-0,02
-0,01
0
0,01
0,02
0,03
0,04
0 10 20 30 40
the time path of the rate of profit growth
-0,1
-0,05
0
0,05
0,1
0 10 20 30 40
The rough equalization of capital and savings growth rates

The above charts show the various properties of the model. Profits grow persistently,
interrupted by increased interest rates which accelerate following increases in debt and are
relaxed following increases in savings. Fluctuations can be viewed as fluctuations in
aggregate demand, since equation 3 can be read as the familiar relation investment minus
savings. Debt acceleration drives up profits but also interest rates, savings adjust and
investment drops this brings down profitability but also debt and interest rates which fuels
demand once again. But this fluctuation takes place around a growth path determined by
more fundamental rates, namely the rate of profit and the credit market conditions.
Stagnation, as discussed above is presented in the simulation below where a= 0,3 as before
but the rate of profit is now r = 0,15.
1
1,05
1,1
1,15
1,2
1,25
1,3
0 10 20 30 40
Time path of gross profits
-0,05
0
0,05
0,1
0 20 40 60
The time path of y
0
0,1
0,2
0 10 20 30 40
Time path of the interest rate
-0,015
-0,01
-0,005
0
0,005
0,01
0,015
0,02
0,025
0 10 20 30 40
the time path of the rate of profit growth
-0,015
-0,01
-0,005
0
0,005
0,01
0,015
0,02
0 10 20 30 40
The equalization of capital and savings growth rates
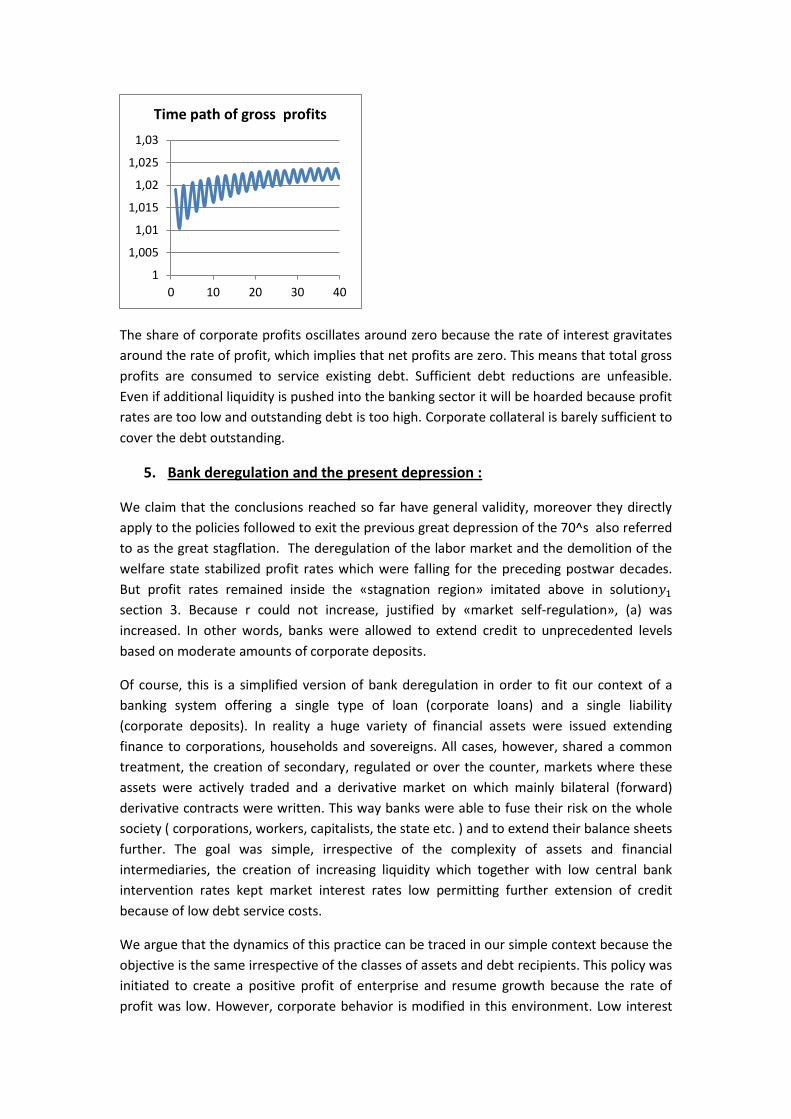
The share of corporate profits oscillates around zero because the rate of interest gravitates
around the rate of profit, which implies that net profits are zero. This means that total gross
profits are consumed to service existing debt. Sufficient debt reductions are unfeasible.
Even if additional liquidity is pushed into the banking sector it will be hoarded because profit
rates are too low and outstanding debt is too high. Corporate collateral is barely sufficient to
cover the debt outstanding.
5. Bank deregulation and the present depression :
We claim that the conclusions reached so far have general validity, moreover they directly
apply to the policies followed to exit the previous great depression of the 70^s also referred
to as the great stagflation. The deregulation of the labor market and the demolition of the
welfare state stabilized profit rates which were falling for the preceding postwar decades.
But profit rates remained inside the «stagnation region» imitated above in solution
section 3. Because r could not increase, justified by «market self-regulation», (a) was
increased. In other words, banks were allowed to extend credit to unprecedented levels
based on moderate amounts of corporate deposits.
Of course, this is a simplified version of bank deregulation in order to fit our context of a
banking system offering a single type of loan (corporate loans) and a single liability
(corporate deposits). In reality a huge variety of financial assets were issued extending
finance to corporations, households and sovereigns. All cases, however, shared a common
treatment, the creation of secondary, regulated or over the counter, markets where these
assets were actively traded and a derivative market on which mainly bilateral (forward)
derivative contracts were written. This way banks were able to fuse their risk on the whole
society ( corporations, workers, capitalists, the state etc. ) and to extend their balance sheets
further. The goal was simple, irrespective of the complexity of assets and financial
intermediaries, the creation of increasing liquidity which together with low central bank
intervention rates kept market interest rates low permitting further extension of credit
because of low debt service costs.
We argue that the dynamics of this practice can be traced in our simple context because the
objective is the same irrespective of the classes of assets and debt recipients. This policy was
initiated to create a positive profit of enterprise and resume growth because the rate of
profit was low. However, corporate behavior is modified in this environment. Low interest
1
1,005
1,01
1,015
1,02
1,025
1,03
0 10 20 30 40
Time path of gross profits

rates, together with a positive profit of enterprise, pushes corporations (and banks) to
extend their balance sheets with credit in order to maximize returns on their own capital.
This way the financial sector achieved increased autonomy, since, by regulating the velocity
of circulation, growth can resume irrespective of the prevailing rate of profit. But this
autonomy has a limit, which, if broken, leads to collapse as it did in 2009.
This aspect of financialization is picked in Lapavitsas 2009 (sited above, footnote 1) in the
sense that financialization is not necessarily the result of weak production it can result at any
profit rate because of the increased autonomy of the financial sector. This result can be
derived from the model which follows, but it should be stressed that the process of
financialization is limited by the rate of profit prevailing.
Turning to the dynamics, we will assume constant interest rates. Of course interest rates
were never constant between 1980 – 2008, however they kept declining with very small
volatility for most of the period and were treated as a nonissue in corporate investment
planning, especially in the decade following the millennium.
The share of corporate profits and return on equity are linearly related if (y) is the main
determinant of capital accumulation and interest, as well as, profit rates are constant. This
result can be derived as follows:
We repeat our growth equation:
Since the rate of interest is constant savings also become constant and the equation can be
modified as follows:
( )
Where is the constant rate of interest assumed. Reformulating the above relation in
continuous time, for the moment, in order to integrate the relation, we can rewrite the
above relation as follows:
This form tells us that when interest rates are constant capital advanced is a linear function
of equity. We can elaborate further on this result:
Which means that the return on equity (ROE) is a linear function of the corporate share of
gross profit. Which means that in a stable interest rate environment the return on equity is
the main driver of growth.
The linear relation between ROE and y is limited in a constant interest environment:

When the debt profit ratio equals to the reciprocal of the rate of interest all gross profit will
be paid out as interest. This finding is the equivalent of our finding in section 2 where the
rate of interest rises and becomes equal to the rate of profit when total capital advanced
equals debt. Here it is debt which increases to the point where ROE drops to zero.
We will derive the time difference equation of y with constant interest rate as follows:
( )
((
) )
Equalizing the two forms we get:
( )
( ( ) ( ) )
Solving for t+1 our basic equation become
( (( ) ) ( ) )
This form can be manipulated further as follows :
(
(( ) ) )
(( ) )
Let
(( ) ) then the equation can be written
( ) (( ) )
This nonlinear difference equation is known as the “logistic map” initially introduced by the
19th century Belgian biologist Ven Hulist in differential form and is used to describe
population dynamics. In 1973 the biologist Robert May (May 197526) presented the equation
in difference form and showed its’ complex chaotic dynamics.
Letting (( ) )
the initial solutions of the difference equation are z1=0 and
. The first derivative is as follows:
26
“Biological Populations Obeying Difference Equations : Stable Points, Stable Cycles, and
Chaos» Journal of theor. Biology (1975) 51, 511-524

For z1=o which implies y=0 the solution is stable for:
(( ) )
. The right hand side of the inequality holds for r<a. The left
hand side depend on the interest rate and the systemic variable.
For
the solution is stable for :
which is stable only for negative interest rates, given r>a.
Again the initial roots do not provide a solution that produces growth, but there exist a
region of values which satisfy:
In this parameter region the model will exhibit oscillatory growth when parameter values
are up to 1,5 and chaotic for values 1,5 – 2. When the parameter takes values over 2 the
system first overshoots and then collapses. To use the biological analogy the reproduction
means cannot support the rate of reproduction and population dies.
It is not difficult to see, from the effective region of the system, that for the strategy to
remain effective any decline in the rate of interest results from an increase in the parameter
(a). This was the case for a long period of time on a world scale, credit terms were relaxed
and interest rates fell bringing the system closer and closer to collapse until it prevailed in
2008. This process was not the result of some irrational behavior but of the mere fact that
banks and corporations could extend their profits only through extending their balance
sheet. Whenever the debt limits were reached (equation 12) further relaxation of
regulations prevailed until the system collapsed.
We will present the various states of the system simulating the time path y at different
parameter values :
-0,01
-0,005
0
0,005
0,01
0,015
0,02
0 10 20 30
a=0,,3 r=0,15 i=0,08
stagnation
-1
-0,5
0
0,5
1
1,5
0 10 20 30
a=1,3 r=0,15 i=0,03
secular growth

In stagnation credit terms are so tight that interest rates have to turn negative for growth to
prevail. In the second case interest rates drop, credit terms are relaxed and secular growth
prevails. When credit terms are relaxed further chaotic growth prevails. Finally when credit
terms are relaxed even further the system collapses as it did in 2008.
It should be noted, further, that , in normal accumulation, bank finance flows because banks
accumulate funds from deposits through increases in the velocity of circulation (equation 8).
When crisis prevails banks are called to lend from their own capital, amassed either through
share capital increase or borrowed from the central bank, a loss of this capital is a cause of
failure, therefore banks require now first class collateral in order to lend. At the same time
as we have shown (section 2) corporate assets are barely sufficient to back existing debt,
therefore even following complete recapitalization Banks will «sit on the money» until
corporate deposits are sufficiently restored, in the sense that capacity utilization is restored
to normal levels. This is why bank recapitalization and quantitative easing has proven
ineffective in reestablishing growth in the context of the present crisis.
Conclusion:
The models laid out above are meant to support two basic theoretical points:
1) In Marx, crisis prevails when the rate of profit is so low that corporate savings are
not sufficient to restore the liquidity of the banking system. Debt outstanding
becomes too high relative to the surplus value to be appropriated by the corporate
sector, interest rates explode and growth turns to stagnation. This result is derived
from Marx’s theory of corporate investment, interest and money which are
integrated in the concept of profit of enterprise. In explaining the present crisis, this
result is of importance because it takes the explanatory focus from the celebrated
dynamics of the rate of profit, which do not apply to the events preceding the
current depression, to the economic factors which determine the passage from
normal accumulation to depression, where the rate of profit prevailing is the
dominant element. This last issue keeps the core of Marx’s argument intact because
although profitability remains the driving force of accumulation the anticipated
dynamics of the rate of profit are not a prerequisite for growth to turn to stagnation.
-1
-0,5
0
0,5
1
1,5
0 10 20 30
a=1,9 r=0,15 i=0,03
chaotic growth
-2E+199
0
2E+199
4E+199
6E+199
8E+199
0 10 20 30
a=2 r=0,15 i=0,03
collapse

2) The second point has to do with an attempt to provide some analytical insight on
aspects of the phenomenon of financialization of capital. We have shown, in the
context of our original model, that financialization in the sense of increasing
dependence of capital accumulation on the money creation powers of the banking
sector is inversely proportionate to the rate of profit. The lower the rate of profit the
higher the leverage needed. Furthermore, the share of surplus value appropriated
by the financial sector is higher the lower the rate of profit. But, this is half the truth,
the financialization of all aspects of economic life, by establishing secondary and
derivative markets, has no historical precedent, it is a new aspect of contemporary
capitalism. We argue that, financialization was the result of a strategy which
emerged as a response to persistent low profit rates, the objective was to create a
positive profit of enterprise by suppressing interest rates. This policy, however, gave
increasing autonomy to the financial sector and modified the behavior of both
corporations and banks. Extending balance sheets though leverage became the
primary strategy, this on one hand promoted growth, but on the other kept
increasing the fragility of the system until its’ collapse in 2009. Although a clear one
sided causal relation between production and finance does not exist, in this context,
the prevailing rate of profit poses a limit to financial expansion.
The theoretical results summarized above have also important policy implications,
arising from the mere fact that under our reasoning and irrespective of the special
actualities which led to the current crisis, it classifies under the category of great
depressions caused by the overextension of finance relative to profitability. When
the system collapsed, high interest rates and tight credit prevailed triggering sharp
reductions in output and employment. Securitization of financial capital in these
circumstances will only lead to extensive hoarding (this is the case in the U.S.) even if
the amounts advanced are in excess of the funds needed to support the existing
exposure of the banking sector. As we have shown the available collateral in the
hands of corporations is barely sufficient to cover their outstanding debt because
production is downsized in depressions. Banks are not prepared to risk their capital
to bring capacity utilization to its’ normal levels through unsecured credit. Therfore,
alternative policies have to be implemented to avoid a long period of high
unemployment with devastating consequences.
Extensions of our formulation are possible incorporating an alternative approach of
inflation, sovereign deficit and debt, as well as alternative fiscal policy and policy
evaluations of fiscal austerity programs imposed by the EU and the IMF on Southern
Europe. This will be the focus of future work.
APPENDIX 1
We will prove below that if the profit margin is constant then, given labor market conditions
the prevailing rate of profit will equal the basic rate:

( )
27
( )
( )
( ) (
)
( )
( )
Where W = wages, M= materials, Depr = depreciation, INV= inventory, m= profit margin on
costs, CC= constant capital.
APPENDIX 2
We derive the tine difference equation of capacity utilization (equation 4 in the text).
27
We use the business accounting definition, the term in brackets is the accounting term “cost of goods sold”. Sales are the sum of cost of goods sold and gross profit

( ) ( ) ( )
( )
( )
( )
( )
( )
( )
( )
( )