
Munich Personal RePEc Archive - uni-muenchen.de · Munich Personal RePEc Archive ... 5 Operating...
43
Munich Personal RePEc Archive Poverty : A Corporate Creation and Ratio Controls for Eradication Viswanatha Subramaniam Intellectual Consultants 19 April 2013 Online at https://mpra.ub.uni-muenchen.de/75234/ MPRA Paper No. 75234, posted 1 December 2016 15:12 UTC
-
Upload
trinhtuong -
Category
Documents
-
view
215 -
download
3
Transcript of Munich Personal RePEc Archive - uni-muenchen.de · Munich Personal RePEc Archive ... 5 Operating...

MPRAMunich Personal RePEc Archive
Poverty : A Corporate Creation andRatio Controls for Eradication
Viswanatha Subramaniam
Intellectual Consultants
19 April 2013
Online at https://mpra.ub.uni-muenchen.de/75234/MPRA Paper No. 75234, posted 1 December 2016 15:12 UTC

POVERTY – A CORPORATE CREATION &
RATIO CONTROLS FOR ERADICATION
BY : Dr. VISWANATHA SUBRAMANIAM.
B.Sc.,MBA., Ph.D (Mgmt).,
P.Doc (Comp.Science)
drvsrs
POVERTY – A CORPORATE CREATION &
RATIO CONTROLS FOR ERADICATION
BY : Dr. VISWANATHA SUBRAMANIAM.
B.Sc.,MBA., Ph.D (Mgmt).,P.Doc (Comp.Science)
- I -
SEQ SUB MAIN MATTER PAGE
I Preface 1
II Acknowledgment 2
III Abstract 4
IV Key words 5
V JEL Codes 5
A Introduction 6
B Research Objective 7
C Methodology 7
D Analysis 8
E
Discussions 9
E1 Basic Need estimate in a representative Country ( India) 9
E11. Escape from Survival Stage 9
E2
Survival of Supply Sectors 10
E21. Per year performance at base level 11
E22. Supplier Innovation at base level 12
E3
Economic Uncertainties 13
E31. Per year performance at uncertainties 13
E32. Recovery route 1 with Price increase 13
E33. Recovery route 2 with Cost and Expense reduction 14
F Summary of Discussions 15
G
Practical Supports 15
G1
Operating ratio of milk diaries in India (Basic need
suppliers) 16
G11. AAVIN Milk Diary (Government Unit) 16
G12. AROGYA Milk Diary (Private) 16
G13. AMUL Milk Diary (Cooperative milk union) 16
G14. Inference on Indian Diaries 17

drvsrs
POVERTY – A CORPORATE CREATION &
RATIO CONTROLS FOR ERADICATION
BY : Dr. VISWANATHA SUBRAMANIAM.
B.Sc.,MBA., Ph.D (Mgmt).,P.Doc (Comp.Science)
SEQ SUB MAIN MATTER (Continued) PAGE
G
G2
Operating ratio of milk diaries Abroad 17
G21. US Diaries 17
G22. Almarai (Saudi Arabia) 17
G23. Inferences 17
G3
Opearating ratio of Non Essential goods in India 17
G31. Auto and Cosmetic Industries 17
G32. Inferences 18
G4
Other Essential Sectors 18
G41. Agriculture 18
G42. Other Vital Industries 19
H Problem of Shortage 20
I The Impact 20
J The Financial Proportion Model 22
K The Key Methodology 22
L Bibliography 35
SEQ AUTHOR DATA PAGE
M About the Author 36
N Accredited Associations 37
- II -

drvsrs
POVERTY – A CORPORATE CREATION &
RATIO CONTROLS FOR ERADICATION
BY : Dr. VISWANATHA SUBRAMANIAM.
B.Sc.,MBA., Ph.D (Mgmt).,P.Doc (Comp.Science)
- III -
No EXHIBITS PAGE
1 World Poverty Map - 2009 23
2 Basic Need Estimate in a Representative Country 24
3 Operating Ratios of Aavin Milk (Government) 25
4 Operating Ratios of Arogya Milk (Private) 26
5 Operating Ratios of Amul Milk (Cooperative Union) 26
6 Operating Ratios of US Diary Industries 27
7 Operating Ratios of Almarai (Saudhi Arabia)) 27
8 Operating Ratios of Non Essential items in India 28
9 Agricultural Return on Investment (India) 29
10 Operating Ratios of Indian Railways 30
11 Operating Ratios of Indian Textile Mill 30
12 Operating Ratios of Indian Cement Industry 31
13 Operating Ratios of Indian Construction Company 31
14 Views of Planners on Essential Items (India) 32
15 Indian Consumer price Index 33
16 US Consumer Price Index 33
17 Poverty & Prosperity Genetic Schematic 34

drvsrs
POVERTY – A CORPORATE CREATION &
RATIO CONTROLS FOR ERADICATION
BY : Dr.VISWANATHA SUBAMANIAM.
B.Sc.,MBA., Ph.D (Mgmt).,P.Doc (Comp.Science).
I. PREFACE
This is a preface to uplift those faces in “below the poverty line” in the World.
The faces are beautiful, but sad !! It is not their fault to be poor. But the
Corporate units manufacturing & distributing Essential commodities have made
them poor. Poverty is their inability to buy the minimum basic needs (Food,
Shelter and Clothing) within their earning capacity. The ruling heads of their
nation have shown a blind face to them. The contents of this research is to
eradicate their poverty and reface their look filled with Smile and Happiness.
A positive pair of Financial ratios (proportions) are identified and a
methodology is formulated to transform their poverty stricken sad faces into a
prosperity filled smiling faces.
Page 1 of 37

drvsrs
POVERTY – A CORPORATE CREATION &
RATIO CONTROLS FOR ERADICATION
BY : Dr. VISWANATHA SUBRAMANIAM.
B.Sc.,MBA., Ph.D (Mgmt).,P.Doc (Comp.Science)
II. ACKNOWLEDGMENT
During the period from 1982 to 1989, I was an associate with Professor
Dr. Arthur Lewis (Nobel Laureate in Economic Science – 1979) in Caribbean
Development Bank and University of West Indies, Cave hill campus, Barbados,
West Indies.
He won the Nobel prize in Economic Science (1979), for his paper “The Slowing
down of the Engine of growth”. This highlighted the fact that developing nations
are racing to keep pace in techno-commercial developments, equal to the
developed nations (UK, USA). Instead, the priority should be to Improve the
national infrastructure and affordability of the basic needs, by all the domestic
population. He imparted the following progress sermons to me.
a) Developing countries with common culture and geographically closer, should
form a common market, trade and tariff rules like GATT (General
Agreement on Trade and Tariff). They should attain self sufficiency, and pool
commodities for export to developed nations, with international quality
standards and at competitive prices.
b) A nation with citizens who cannot “eat well”, cannot think or aim high.
01. I acknowledge all the under developed and developing nations which do
not follow the above golden guidelines and continue to race with the
economic behaviour of the developed nations (including my home country).
This motivated me to write this research booklet.
02. It is essential to acknowledge the “Blind man’s Treasure hunt” method
followed by the developing nations, by sacrificing and surrendering their
valuable domestic wealth and talents for the economic benefit of the
developed nations. (Through immigration, FDI, Foreign industrial base in
their home country with advantage, freedom and concessions in favour of
them)
Page 2 of 37

drvsrs
POVERTY – A CORPORATE CREATION &
RATIO CONTROLS FOR ERADICATION
BY : Dr. VISWANATHA SUBRAMANIAM.
B.Sc.,MBA., Ph.D (Mgmt).,P.Doc (Comp.Science)
II. ACKNOWLEDGMENT (Continued)
03. I acknowledge and thank all the ruling heads and ministers of the nations
who keep the majority of their elected people “below poverty line” for
decades (closer to a century). I am also greatly enlightened by their thought
provoking explanations and innovative justifications to keep their nation in
this sub standard level.
04. I am thankful to all the essential sectors (Government and Private) in the
representative sample “below poverty” nation for continued mis-
management. They provided a volume of support data, to the contents of my
dual proportions’ model.
05. I am surprised and enlightened by the cross (or crooked !) thoughts of the
planning and responsibility heads of these poor nations. It is in the form of
foolish redefinition of poverty, by lowering the quantum of basic needs of
life and nutrition, with scientific support and modern management jargons.
This needs an applauding and priority acknowledgement.
06. The real and valuable acknowledgment goes to my wife
Kanthimathi, who estimated the bare minimum survival needs
for a simple house hold, and their cost at current prices, This is a
back-bone data to match against the World Bank’s survey and
poverty line estimates.
Page 3 of 37
drvsrs
POVERTY – A CORPORATE CREATION &
RATIO CONTROLS FOR ERADICATION
BY : Dr. VISWANATHA SUBRAMANIAM.
B.Sc.,MBA., Ph.D (Mgmt).,P.Doc (Comp.Science)
III. ABSTRACT
The essential item producers and distributors in every nation, inflate the prices
of their commodities, to cover up their mis-management every year, so that
more and more people are not afford to buy them. Thus they create, increase
and maintain an expanding below poverty line persons in the nation. This Book
substantiates this statement, through verified inference. Also it suggests a dual
ratio control on Essential item producers and distributors, for poverty
eradication.
All the species, in this world survived over the generations, by fitting themselves
within the available resources, for many millennium (Darwins’s theory). But
human, because of their intelligence, survived in a 3 dimensional shell namely (a)
The geography and environment (b) The social influences and (c) The economic
infrastructure. The objective of this booklet is to measure the existence of the
“Survival of the fittest” in this millennium, their distribution in the world, the
reasons for the hand to mouth living for basic needs, how people escape from
this survival stage, and possible solutions to eradicate this stage. Accordingly the
methodology is chosen to pin point each segment of the world population in and
under poverty line using the World Bank survey map, and the Operating ratio
as the measure of the performance of the essential suppliers. Lower ratio
represents prosperity, and the reverse poverty.
India is taken as a representative country for the analysis. Agriculture is found
to be of little value compared to the return on land investment, due to the
absence of mass farming. Milk and other essential items like travel, textiles and
construction are taken as essential items. An analysis of their Operating ratio in
government and private sectors indicate that the ratio is high. It is because of
their mismanagement, and monopoly status. They keep the citizen as their
captive customers and use price increase as a leverage for their continued
survival. Hence corporate organisations producing and supplying the essential
commodities create, maintain and increase the people below poverty line in any
nation.
Page 4 of 37

drvsrs
Comparatively, this ratio in developed nations are low and under control.
Conversely, the operating ratio of non-essential goods in the developing nations
are low and favourable, because of competition and global business operators.
The golden rule is that the Essential need supplies should keep their Operating
ratio at 75 % or below. In the discussion, the possible and the suggested method
for keeping this ratio under control (in a normal and disturbed economic
condition) is found to be through innovation in cost and expense control. The
growth rate of GNP should be equal to the population growth rate OR the
population growth rate should be kept equal or less than the feasible GNP
growth rate. This will eradicate the poverty in the world. This is applicable to
all in government, public or private sectors and all the nations in developed,
developing and under developed bracket of economic status.
Page 5 of 37
IV. KEY WORDS
aavin, agriculture, alleviation, almarai, amul, arogya, arthur lewis, auto, basic
need, cement, clothing, construction, cosmetics, cost, darwin, diary, economic,
environment, escape, essential, expense, fittest, food, gip, gnp, India,
infrastructure, milk, nobel laureate, non essential, per capita, poverty, price,
railways, social, supply, sector, shelter, survival, textiles, uncertainty, usa
V. JEL CODES
A12, A13, A14, B41, D61, D83, E31, F01, G13, H83, I31, I32, M14, O1, P51,Q14, R48
drvsrs
GOLDEN PROPORTIONS’ COMBINATION for
GLOBAL POVERTY ERADICATION
BY : Dr. VISWANATHA SUBRAMANIAM.
B.Sc.,MBA., Ph.D (Mgmt).,P.Doc (Comp.Science)
A) INTRODUCTION
Charles Darwin (1809-1882), British naturalist, revolutionised the science
of biology by the demonstration of his theory "evolution by natural
selection". In 19th Century, he pondered over the survival and extinction
of biological species. He said "Survival of the Fittest" alone inducts any
species to grow and continue to survive in any given geographical and
environmental infrastructure in the world. (Note : He did not say
“Survival of the Biggest, Fastest, Healthiest, Mightiest, Smartest or
Toughest” etc.. !!). He inferred that the organism that best adjusts and “fits”
into the changing environment, puts up with sufferings and adjust with what is
available alone continues to live and progresses. Human species are very well a
part of this survival concept on the earth. However, human beings are provided
with an additional attribute of intelligence. Hence, they have acquired an
“economic” and “social” survival dimension. This is in addition to the natural,
environmental and physical magnitudes, shared in common with all other
species. All human beings, hence try to fit into a 3 dimensional survival concept
namely (a) The geography and environment (b) The social influences and (c) The
Economic infrastructure.
Within these frames of reference, all the human on the earth build and protect
their pedigree (family tree), grew and flourished over the millennium. From
stone age, the human generations have advanced to an unimaginable dimension,
by crossing the basic needs and entering into a series of luxury and intellectual
needs.
a) The human innovations in Science invented many theories, concepts and
gadgets.
b) The faculty of Engineering designed and prepared blue prints for these
scientific contributions into utilities of value to the society.
Page 6 of 37

drvsrs
c) The Technology found the methods to manufacture these utilities in mass
scale, and brought them for use in the domestic living.
d) Developments in Computers and Internet brought the human beings
together, even though they are physically far apart on the globe.
Is Darwin’s concept of survival applicable to the world human conglomerates in
this 21st century year 2012 ? Yes ! and it is amazing.
B) RESEARCH OBJECTIVE
Identify the squeezed survival or below poverty line human in the world.
Measure the existence of the “Survival of the fittest” in this millennium.
Find the reasons for the hand to mouth survival for basic needs. Identify
how people escape from this squeezed survival.
Possible solutions to eradicate this “Survival of the fittest” stage.
Find a solution to eradicate poverty.
C) METHODOLOGY
01. The survival population density is measured by the Per capita Gross
National Income {GNI, is similar to the Gross National Product (GNP).
GNP does not deduct and GNI deducts the indirect business taxes}.
02. The distribution of the survival population is identified from the 2009 World
Poverty Map of the World Bank. India is taken as a representatve
Developing country with populaton below-poverty line. The local expense
for basic needs are estimated for rural and urban area. They are compared
with Worl Bank income estimates.
03. Operating expense (Cost of sales + Expenses) ÷ Net sales (Total sales
revenue – Return Value of sold goods) is taken as a measure of
performance of any production and supply sector.
04. The ratios of essential sectors in India are compared with other nations.
05. The ratios of non-essential sectors are compared with essential sectores
06. The ratios of the other essential sectors are reviewed to measure their level
of acceptabilty.
Page 7 of 37

drvsrs
07. The economy of agricultural is evaluated.
08. A positive conclusion is derived.
D) ANALYSIS
Countries with people living in Per capita GNI less than US$ 1,839 per year
is taken as “living below” poverty line. Referring to Exhibit – 1, the World
bank poverty map, a strip in Southern Russian Federation, Whole of India, a
few Far East nations, Central African nations, a few nations in Caribbean
strip and South America are below poverty line (Colour codes yellow and
orange ).
India is taken as a test country.
People in all other parts of the world have crossed the poverty line. The
missing component keeping the people below the poverty, leads to the
conclusion that an average house hold is always in deficit to meet their basic
needs (food, shelter and clothing).
In India, Operating ratio of essential item producers and suppliers, are in an
unacceptably high level.
But, the Operating ratio of non-essential items are in a controlled level in
India.
Comparatively Operating ratio of essential item suppliers abroad, are in a
controlled level.
The ratios for other essential needs in India are in high levels.
During my assignment with Caribbean Development Bank (CDB) at Barbados
(West Indies), as a “Consultant Adviser”, I had a close professional association
with Nobel Laureate in Economic Science (1979) Professor Dr. Arthur Lewis
(First President of CDB and Professor Emeritus in Woodrow Wilson School of
Public & International Affairs, Princeton University, New Jersey, USA). He said
that “Nations with people who cannot eat well, cannot think high, and
contribute any thing of use to the world”.
Page 8 of 37

drvsrs
E) DISCUSSONS.
A poor nation is one having majority population who cannot satisfy their basic
needs (food, shelter and clothing) within their earning. They are in the
“survival” bracket defined by Darwin. They sacrifice their comforts, live with
the minimum and mal-nutritious food, put up with unhygienic conditions (in
clothing. Taking India as a representative of the poor nations, an estimate is
made to find the dimension of poverty.
E1) BASIC NEED ESTIMATE IN A REPRESENTATIVE COUNTRY
(INDIA)
As in Exhibit – 2, the Basic need estimate versus the World income estimate in
rural area, leads to a shortage of Rs 1,525 per month. If the rural person shifts
to an urban area for industrial job, the monthly expenses are Double. Urban
residence rentals are very high. The urban area, shortage is Rs 1,120 per
month. Government subsidises their survival deficit in rural and urban
through selected freebies and ration, up to a possible % of the shortage (These
assistances are poor and unreliable). As a result, People are Deprived of Savings
for the future, Fruits & Health food, Emergency medical care, Festival
Expenses, Good clothing, Entertainment etc… Hence the population is below
poverty line. The discussion is centered around the reason for the shortage of
minimum survival expense, which is in the foreground.
E11) ESCAPE FROM SURVIVAL STAGE
Those who cannot fit into the hand to mouth stage, attempt to escape from their
native location towards a place where they feel can get the basic needs
comfortably and have a surplus to save. They immigrate to a place within the
nation (EX : Agriculture labour immigrating to industrial centres) . Those who
are educated, talented and can take some calculated risk, immigrate out to the
developed nations. The developed nations welcome such immigration and host
them under controlled visa clauses. They pay far less a salary compared to the
local citizen of the same education, talents and job content. (This also includes
jobs which their locals do not wish to do).
Page 9 of 37

drvsrs
a) The cost of basic needs are less than or equal to 50% of their (low paid)
salary. They save the other half.
b) They enjoy a high quality and nutritious food, comfortable housing, good
clothing (imported from the immigrant’s native location and sold at
locally affordable prices) as per the quality control and social security
laws of the migrated government.
c) From the savings, they enjoy certain luxuries like car (second hand cars in
good condition are sold at rock bottom low prices).
d) Prosperity : The monetary prosperity comes out of the enhanced
“Exchange Rate” of the foreign currency with reference to their native
currency. It has no relation to the talents, education etc… of the
individual !!
e) But this artificial foreign survival is narrowing because of
The developed nations are constrained to provide jobs to their
unemployed natives, and restrict the immigration.
Their money exchange value is going down because of their
mis-planning and frequent inflation.
The cost of basic needs are escalating.
The impact of globalization of corporate sectors is reducing the need for
expatriates.
Foreign governments are now strict on paying local taxes, which reduce
the savings of expatriates.
They control the quantum of remittances of the local earnings out side
nations (Immigrant’s nations).
◙ The immigrant’s government is becoming strict on their citizens holding
money abroad. Because of this, the expatriates cannot hold their money
and wait for a favourable exchange rate and remit later as per their
choice.
E2) SURVIVAL OF SUPPLY SECTORS
The living expense is directly related to the purchase price of food, clothing and
shelter items. These are supplied by the Diary units, Agriculture producers,
Textile manufacturers, Building material producers, Construction industries
and Public transport system.
Page 10 of 37

drvsrs
They fix the selling prices of items or services, which is in the background to
keep the people in poverty line or prosperity line in a nation. The survival of
any supply sector is decided by their Profitability, a vital ingredient for the
Return on their investment (ROI). Profit is an arithmetic difference between the
Net Sales (Total sales revenue – Return Value of sold goods) – Operating
expense (Cost of sales + Expenses) = Profit.
Hence, all supply sectors primarily target to increase their profit. Otherwise,
they attempt to be in a survival level, with Zero profit (Net sales - Operating
expense) = 0. (Most of the government sectors keep this survival level as a
target, because of their social goals). There are many leverages to increase the
profit.
Performance measurement :
Operating Ratio = (Operating expense ÷ Net sales) X 100
Lesser the Operating ratio, better the company’s performance.
Assumptions : A supply sector sells 10,000 units of their product per year at
LC 30 per unit. The cost per unit is LC 12. Yearly Operating Expenses = 80,000 .
There are no returns from the customers. (LC = Local Currency)
E21) PER YEAR PERFORMANCE AT BASE LEVEL :
Net sales = 10,000 X LC 30 = 300,000 LC
Cost = 10,000 X LC 12 = 120,000 Expenses = 80,000 LC
Profit = 300,000 – (120,000 + 80,000) = LC 100,000.
Operating ratio = [Operating expenses ÷ Net sales] =
[(120,000 + 80,000) ÷ 300,000)] X 100 = (200,000 ÷ 300,000) X 100 =
66.67 % (Good)
Page 11 of 37

drvsrs
E22) SUPPLIER INNOVATION AT BASE LEVEL (LC = Local Currency)
The suppliers of essential commodities should use (1) Value Analysis (Price Vs
the performance of raw materials) of the input items and reduce material costs,
wherever possible. (2) Should analyse the process from input to output,
eliminate and combine the work methods, to reduce the process cost (3) Use
Supply chain management and Logistic management to reduce the inventory
cost, faster and cheaper receipt of input materials and deliveries of the finished
products (4) Analyse the common Expenses and reduce them wherever possible
(Ex : Saving power, Water, Improving work productivity, Elimnate duplicated
works etc…). By these the cost and expense could go down, for the same sales
volume and price.
Net sales = 10,000 X LC 28 = 280,000 LC (Lower price 28 instead of 30)
Cost = 10,000 X LC 10 (Instead of 15) = LC 100,000.
Expenses = 75,000 LC (Instead of 80,000)
Profit = 280,000 – (100,000 + 75,000) = LC (280,000 – 175,000) =LC 105,000.
Operating ratio = [Operating expenses ÷ Net sales] = [(100,000 + 75,000) ÷
280,000)] X 100 = (175,000 ÷ 280,000) X 100 = 62.50 % (Very Good)
Advantages
Because of price reduction, the sales volume may go up to 12,000
Net sales = 12,000 X LC 28 = LC 336,000 (Lower price)
Cost = 10,000 X LC 10 (Instead of 15) = LC 100,000
Expenses = LC 75,000 (Instead of 80,000)
Profit = 336,000 – (100,000 + 75,000) = LC (336,000 – 175,000) = LC 161,000.
Operating ratio = [Operating expenses ÷ Net sales] = [(100,000 + 75,000) ÷
336,000)] X 100 = (175,000 ÷ 336,000) X 100 = 52.08 % (Too Good)
Page 12 of 37

drvsrs
E3) ECONOMIC UNCERTAINTIES
Economic uncertainties are Inflation and Recession. They are common
occurrences in developing nations and particularly in thickly populated nations
with many below poverty line. During inflation, Prices of all commodities and
cost of living go up uncontrollably. During recession there is a decline in the
GDP, employment and trade, lasting from six months to a year.
E31) PER YEAR PERFORMANCE AT UNCERTAINTIES
(LC = Local Currency)
Due to economic abnormalities, if the cost per unit goes up to LC 20 (from 15)
and the yearly expense goes up to 100,000 (from 80,000). But the sales volume
remains at 10,000 pieces per year at Rs 30 per unit.
Net sales = 10,000 X LC 30 = 300,000 Cost = 10,000 X LC 20 = 200,000
Expenses = 100,000 Profit = 300,000 – (200,000 + 100,000) = LC 0
When the profit is zero, the company has nil return on their investment.
Operating ratio = [Operating expenses ÷ Net sales] = {(200,000 + 100,000) ÷ 300,000)} X 100 = (300,000 ÷ 3,00,000) X 100 = 100 % (Null - Danger)
In order to get into a profit region and earn a fair rate of return under this
condition, here are 2 recovery routes.
E32) RECOVERY ROUTE 1 WITH PRICE INCREASE
The price can be increased to say LC 35 from 30, keeping all other factors same.
Net sales = 10,000 X LC 35 = 350,000 Cost = 10,000 X LC 20 = 200,000
Expenses = 100,000 Profit = 350,000 – (200,000 + 100,000) = LC 50,000
Operating ratio = (300,000 ÷ 350,000) X 100 = 85.71 % (Good)
Page 13 of 37
drvsrs
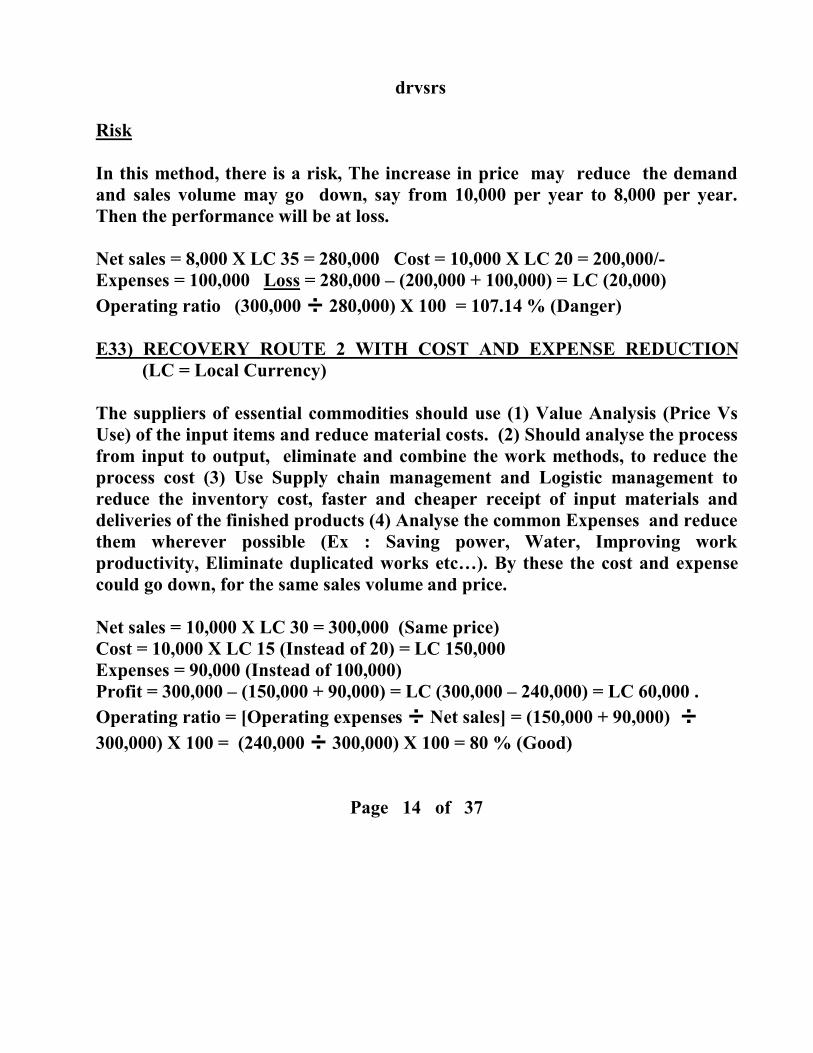
Risk
In this method, there is a risk, The increase in price may reduce the demand
and sales volume may go down, say from 10,000 per year to 8,000 per year.
Then the performance will be at loss.
Net sales = 8,000 X LC 35 = 280,000 Cost = 10,000 X LC 20 = 200,000/-
Expenses = 100,000 Loss = 280,000 – (200,000 + 100,000) = LC (20,000)
Operating ratio (300,000 ÷ 280,000) X 100 = 107.14 % (Danger)
E33) RECOVERY ROUTE 2 WITH COST AND EXPENSE REDUCTION
(LC = Local Currency)
The suppliers of essential commodities should use (1) Value Analysis (Price Vs
Use) of the input items and reduce material costs. (2) Should analyse the process
from input to output, eliminate and combine the work methods, to reduce the
process cost (3) Use Supply chain management and Logistic management to
reduce the inventory cost, faster and cheaper receipt of input materials and
deliveries of the finished products (4) Analyse the common Expenses and reduce
them wherever possible (Ex : Saving power, Water, Improving work
productivity, Eliminate duplicated works etc…). By these the cost and expense
could go down, for the same sales volume and price.
Net sales = 10,000 X LC 30 = 300,000 (Same price)
Cost = 10,000 X LC 15 (Instead of 20) = LC 150,000
Expenses = 90,000 (Instead of 100,000)
Profit = 300,000 – (150,000 + 90,000) = LC (300,000 – 240,000) = LC 60,000 .
Operating ratio = [Operating expenses ÷ Net sales] = (150,000 + 90,000) ÷ 300,000) X 100 = (240,000 ÷ 300,000) X 100 = 80 % (Good)
Page 14 of 37

drvsrs
F) SUMMARY OF DISCUSSIONS
The behaviour of Operating Ratio under different economic situation are
1) Per year performance at base level = 66.67 % (Good)
2) Supplier Innovation at base level = 62.50 %
(Very Good)
Cost and Expense reduction
3) Further advantage (More Sales) = 52.08 % (Too good)
4) Per year performance at economic uncertainties = 100 %
(Null – Danger)
5) Recovery route 1 with Price increase = 85.71 % (Good)
Risk due to loss of sales = 107.14 % (Danger)
6) Recovery route 2 with Cost and Expense reduction = 80 % (Good)
The summary of discussions leads to the conclusions as, even during normal
economic environment, with a good Operating ratio, can be further reduced
through cost and expense reduction. In addition, more advantage can come
through increased sales (1 to 3 above). This can reduce the population below
poverty level in the nation.
During economic uncertainties, the operating ratio goes high, at the base level
operating environments. Price increase method leads to a lower ratio. But the
loss in demand could push the ratio up to a danger level. This will increase the
people below poverty line. But cost and expense reduction, even at economic
uncertainties could reduce the operating ratio and reduce the population below
poverty line in the nation (4 to 6 above).
G) PRACTICAL SUPPORTS
Milk is an essentials item for the people and children to be healthy (Basic needs).
They should be well managed with a low Operating ratio. But the live situation
of Milk units in India seems to be different.
Page 15 of 37

drvsrs
G1) OPERATING RATIO OF MILK DIARIES IN INDIA
(BASIC NEED SUPPLIERS)
The basic need producers and suppliers are in monopoly situation. The citizens
of the nation are their captive customers.
G11) AAVIN MILK DIARY (TAMIL NADU GOVERNMENT UNIT)
Exhibit – 3
The average Operating ratio from 2005 and 2010 is 98.43. Till 2011 the
price of 1 liter of whole milk was Rs 28. From 1st January 2012 this was
raised to Rs 38 per liter. (home delivery prices)
1. This is to improve their operating ratio through price increase option.
The leverage of price increase by {(38 – 28) ÷ 28} X 100 = (10/28) X
100 = 35.71 %.
2. But due to loss of sales, the Operating ratio may even go to a very high
level. People will reduce or eliminate milk from their diet and fit
(Darwin’s) into the situation with mal-nutrition,
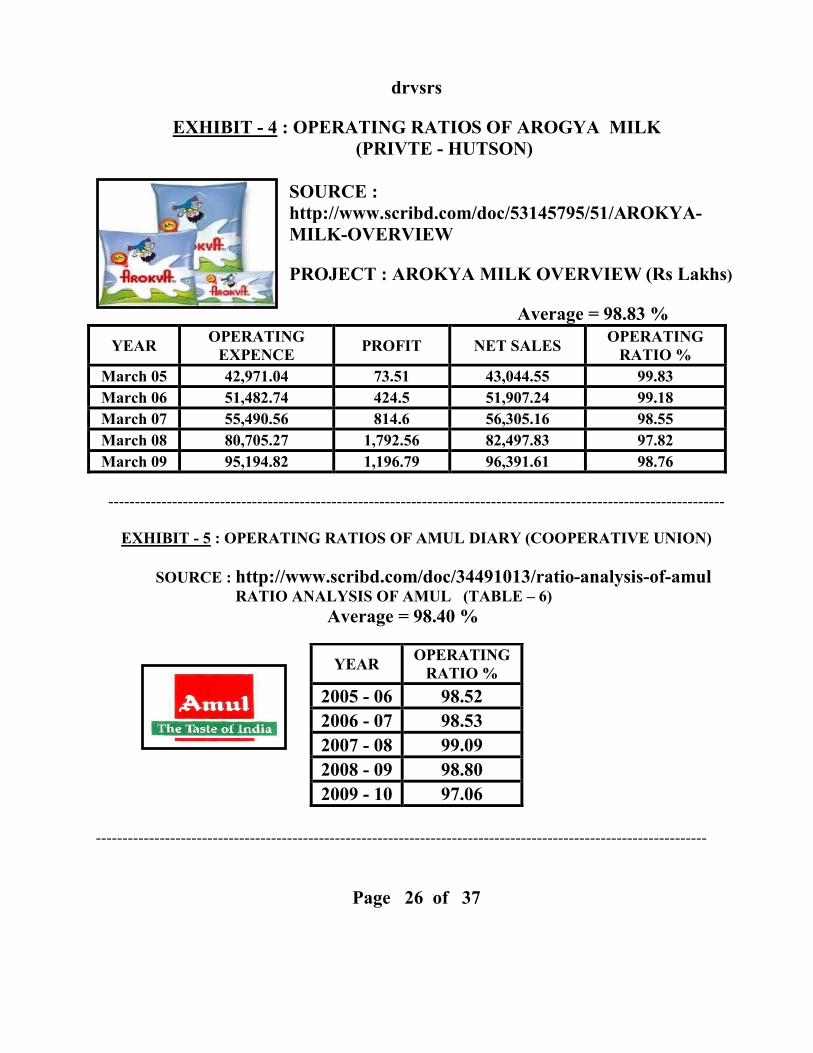
G12) AROGYA MILK DIARY (PRIVATE DIARY MANAGED BY
HUTSON), TAMIL NADU, INDIA. Exhibit – 4
The average Operating ratio from 2005 and 2010 is 98.83. They are also
in a drastic price increase path.
G13) AMUL MILK DIARY (COOPERATIVE MILK UNION) IN
ANAND, GUJARATH STATE Exhibit -5
The average Operating ratio from 2005 and 2010 is 98.40. They are also
in a drastic price increase path.
Page 16 of 37

drvsrs
G14) INFERENCE FROM INDIAN DIARIES
The producers and suppliers of Milk, a basic food, are in an average
Operating ratio of 98 % or above. The surplus is only 2 % or below. Their
Net income just meets their cost and expenses. Both Government and
Private supplier are not cost and expense conscious, and in a Price hiking
path, to absorb their increasing over heads and mis-management.
G2) OPERATING RATIO OF MILK DIARIES ABROAD
(Basic need suppliers)
Foreign diaries control their operating ratio, by optimum plant sizes,
product mix with other diary products and fruit juices. In addition,
they export and meet international competition, which a higher
quality products at competitive prices.
G21) US Diaries. Exhibit - 6 Average Operating Ratio = 71 %
G22) ALMARAI, Exhibit – 7
Largest integrated diary in Saudi Arabia. Average Operating Ratio =
82.62 (2007 to 2010)
G23) INFERENCES : The producers and suppliers of essential and basic
food are in an average Operating ratio of 83 % or below. They have at
least 17 % above with a surplus leverage.
G3) OPERATING RATIOS OF NON-ESSENTIAL INDUSTRIES IN INDIA
G31) AUTO AND COSMETIC INDUSTRIES
Exhibit – 8. The average Operating ratios from 2007 to 2011 (5 Years) for
the following, are as below :
Page 17 of 37

drvsrs
Mahindra & Mahindra (Automobiles and Jeep) - 78.72 %
Tata Motors (Cars and Heavy duty vehicles) - 84.49 %
Hindustan Unilever (Cosmetics & Soaps) - 70.68 %
G32) INFERENCES : The non essential items are competitive, with many
suppliers. They are also export oriented. Hence they keep their operating
ratio as low as possible by the application of the modern management
concepts. They use (1) Value Analysis (Price Vs Use) of the input items
and reduce input material costs and reduce wastage. (2) They analyse the
process from input to output and eliminate or combine the work methods
to reduce the process cost. (3) Use Supply chain management and Logistic
management to reduce the inventory cost and faster/cheaper receipt of
input materials and deliveries of the finished products (4) Analyse the
common Expenses and reduce them (Ex : Saving power, Water,
Improving work productivity, Eliminate duplicated works etc…).
G4) OTHER ESSENTIAL SECTORS.
The other essential industries identified are the Agriculture (Food),
Railways (Prime travel), Textile mills (Clothing), Cement and
Infrastructure Construction..
G41) AGRICULTURE
Agriculture in countries bracketed as poor or below poverty line has
dwindled, because of fragmented farming and monsoon dependent. Lands
are cultivated in small pieces and their outputs are of low in quality,
uneconomical and the return on the land investment is unworthy.
Page 18 of 37

drvsrs
I am from a village called Alwarkurichi in Ambasamudram Taluk,
Tirunelveli district in Tamil Nadu, India. There is a Valatha Kulam
(irrigation tank in the name of Valatha) providing water for 141 acres
(0.57 Square KM) of paddy fields. The total acreage is owned by 8,642
house-holds (joint family groups) or an average of 1.6 cents (1/100 of an
acre) per house-hold. Each house-hold individually cultivate their small
piece of land in the most uneconomic and in traditional methods. I talked
to the Tirunelveli district collector (2009) on creating a “Valatha Kulam
co-operative forming”, by pooling the 141 acres as one piece, with each
holding the share certificate, proportional to their land area contributed.
He said that nobody will sacrifice their land and break their boundary
mark, to pool and organise a modern, professional and scientific farming.
Because, it is their hereditary wealth with an irrevocable ownership right
(Patta) descending form centuries of their pedigree !!! They do not wish
to step on the ladder of modernisation, cooperation and progress. (Note :
Social Change is a pre-requisite for Economic Development)
Also, the irrigation method is monsoon (rain) dependent. The water stored
in earthen tanks and reservoirs are not maintained properly. With climate
changes, global warming, shift of seasons, hurricane pattern and failure of
monsoon rains, the agriculture crop failures are common and frequent.
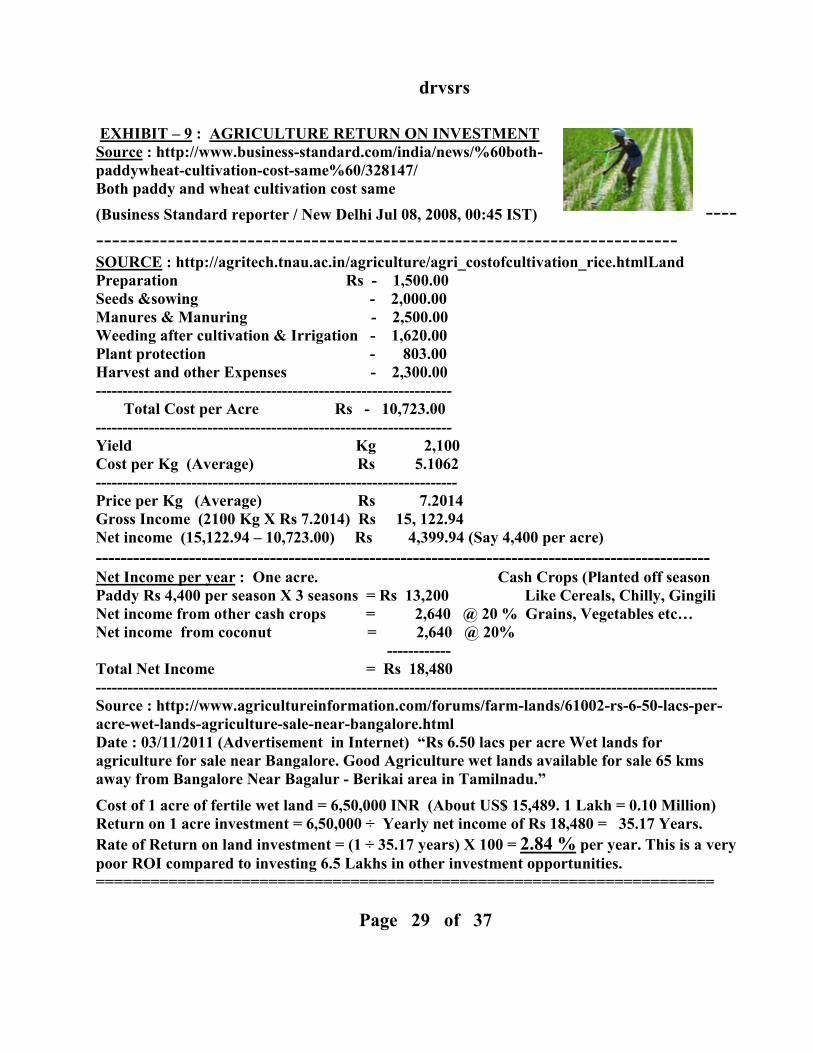
As seen from Exhibit - 9, the Return on agricultural investment is 2.84 %
per year.
G42) OTHER VITAL INDUSTRIES
Agriculture land owners and tillers have abandoned the lands and
immigrated to urban areas within the country or gone abroad, searching
for permanent monthly income from industries (workers) and offices
(white collard jobs). The Operating Ratio of other vital sectors in India
are :-
Exhibit – 10 : Railways – Average = 92.88 %
Exhibit - 11 : Textile Mills – Average = 86.66 %
Page 19 of 37
drvsrs
Exhibit – 12 : Cement Industry – Average = 74.51 %
Exhibit – 13 : Infrastructure Construction - Average = 102.06 %
The average operating ratio in cement industry is under control with an
average of 74.51 %. But the infrastructure construction industry absorbs
this low ratio and ultimately leads it to an average of 102.06. It is very
high and unfavourable.
H) PROBLEM OF SHORTAGE
Exhibit -14 : Planning heads in developing and under developed nations with
large volume of people under poverty line, are in philosophical, theoretical and
dragging global thoughts (Farmer income, global procurement, higher rate of
growth per capita etc…)/ This is a “Blind man’s Treasure hunt” approach.
The Missing Link is “% growth of domestic production and distribution of all
essential items in each year should be = (or more than) % increase in the
population growth per year. OR Population growth rate should be brought
down to the feasible % growth (GDP). Operating ratio of essential sector should
be brought down through critical analysis of cost and expenses, to maintain it at
75% or less.
If this proportion is not followed, the basic need items are continually beyond
the reach of the domestic population and there is always a shortage of basic need
items. The shortage in supply with large volume people (demand) leads to
increase in prices. This in turn increases the number of people not afford to get
the basic needs and increases the volume of people below poverty line. This is a
Non Escapable “Poverty Loop Situation”
I) THE IMPACT.
The national impact of the Operating ratio leverage of essential items could be
seen from the increase or decrease in consumer price index.
Exhibit – 15 shows the average increase of consumer price index in India from
2007 to 2011.
Page 20 of 37

drvsrs
The average increase over these 5 years is 14.89. {A country where the
Operating ratio of essential and basic items are high (Even though the same in
non essential goods are at low and favourable)}. This pushes up the umber of
people below the poverty line, because of their inability to buy and enjoy the
essential and basic needs.
Exhibit – 16 shows the average increase in consumer price index as 6.8 in USA,
from 2007 to 2011 {A country where the Operating ratio of essential and basic
items are around 71 %} . This pushes up the number of people in luxury line or
above.
Moral : The essential item producers and distributors in every nation, inflate
the prices of their commodities, to cover up their mis-management every year, so
that more and more people are not afford to buy them. Thus they create,
increase and maintain an expanding below poverty line persons in the nation.
This Book substantiates this statement, through verified inference. Also it
suggests a dual ratio control on Essential item producers and distributors, for
poverty eradication.
During the period from 1982 to 1989, I was an associate with Professor Dr.
Arthur Lewis (Nobel Laureate in Economic Science – 1979) in Barbados, West
Indies. He won the Nobel prize for his paper “The Slowing down of the Engine
of growth”. This highlighted the fact that developing nations are racing to keep
pace with techno-commercial developments in developed nations (UK, USA).
Instead, the priority should be to improve the national infrastructure and
affordability of the basic needs by the domestic population. He imparted the
following progress sermons to me.
01. Developing countries with common culture and geographically closer,
should form a common market, trade and tariff rules like GATT (General
Agreement on Trade and Tariff). They should attain self sufficiency, and
pool commodities for export to developed nations, with international quality
standards and at competitive prices.
02. A nation with citizens who cannot “eat well”, cannot think or aim high.
The poor nations are investing in hi-fi structures and large flyovers for
urbanisation, by sacrificing the infrastructure roads and better sanitary
conditions in rural area. Invest large sums in atomic power plants and in space
research, without harnessing the freely available domestic solar, wind and
flooding water power.
Page 21 of 37
drvsrs
Instead of encouraging and promoting mass farming and cooperative diaries,
they import these basic needs. This results in increasing the starving people
within a prosperous and resource abundant nation
J) THE FINANCIAL PROPORTION MODEL
1) The basic need suppliers should keep their Operating ratio at 75% or below.
This eliminates the need for price increase and even lead to price reduction.
This will reduce the people below the survival or poverty level.
2) % growth of domestic production and distribution of all essential items in
each year should be equal to or more than the % increase in the population
growth. At the distribution level, the quantum supplied should be equal to or
more than the quantum needed (demand).
3) It is applicable to all in government, public or private sectors. It is also
applicable to all the nations in developed, developing and under developed
bracket of economic status.
K) THE KEY METHODOLY
The suppliers of essential commodities should use (1) Value Analysis (Price Vs
Use) of the input items and reduce material costs. (2) Should analyse the process
from input to output, eliminate the duplicated works, to reduce the process cost
(3) Use Supply chain management and Logistic management to reduce the
inventory cost, faster and cheaper receipt of input materials and deliveries of the
finished products (4) Analyse the common Expenses and reduce them wherever
possible (Ex : Saving power, Water, Improving work productivity etc…). By
these, the cost and expense should go down, for the same sales volume and price.
This eliminates the need for price increase, increase the volume of people afford
the basic needs and ultimately eradicate the poverty.
Both J anf K above are shown in Exhibit – 17 as “Poverty & Prosperity Genetic
Schematic”
Page 22 of 37
drvsrs
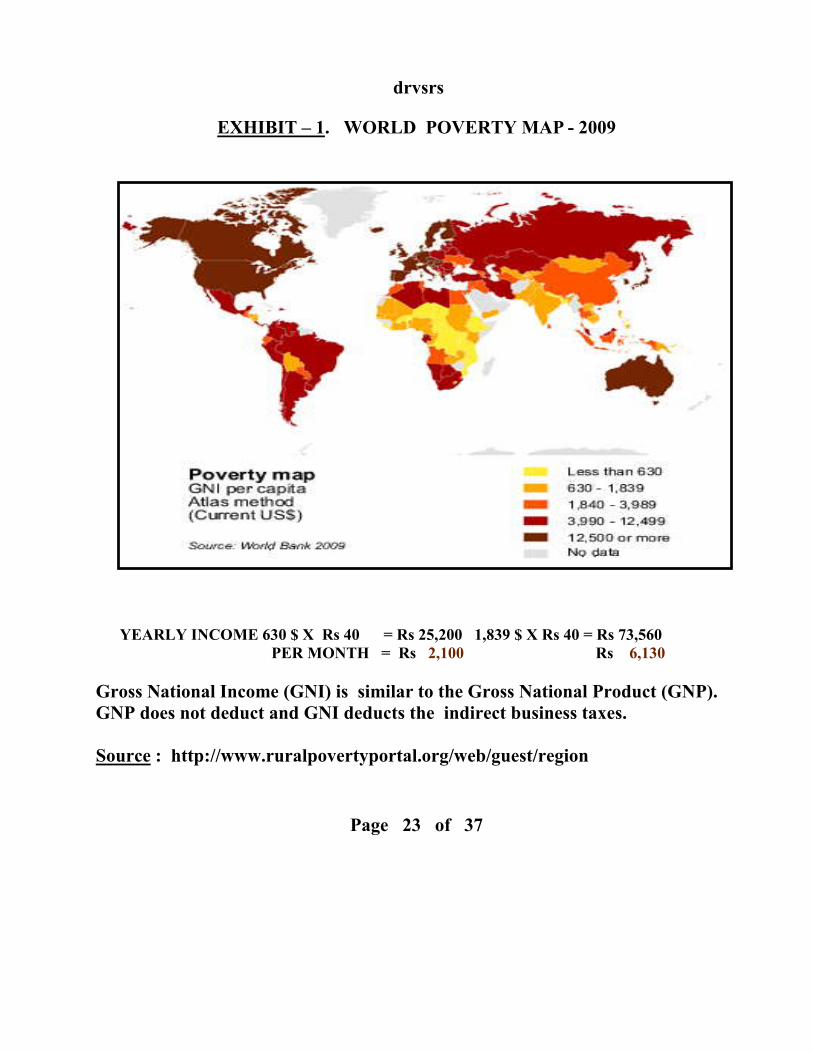
EXHIBIT – 1. WORLD POVERTY MAP - 2009
YEARLY INCOME 630 $ X Rs 40 = Rs 25,200 1,839 $ X Rs 40 = Rs 73,560
PER MONTH = Rs 2,100 Rs 6,130
Gross National Income (GNI) is similar to the Gross National Product (GNP).
GNP does not deduct and GNI deducts the indirect business taxes.
Source : http://www.ruralpovertyportal.org/web/guest/region
Page 23 of 37

drvsrs
EXHIBIT – 2. BASIC NEED ESTIMATE IN A REPRESENTATIVE
COUNTRY (INDIA)
Assumptions : Family of Husband, Wife and Child (3 persons) in a rural
location. Owns a hereditary house (Not repaired or maintained properly)
Education is assumed as free (Mediocre level)
Profession : Agriculture Labour
Exchange rate - 1 US$ = Rs 40 (Average 2009 Rate)
Yearly income as per World Bank
$ 630 X Rs 40 = Rs 25,200 Per year = Rs 2,100 Per month (Minimum)
$ 1,839 X 40 = Rs 73,560 Per year = Rs 6,130 Per month (Maximum)
Minimum basic needs per month
01) 1 litre of milk per day X Rs 20 X 30 days = Rs 600 ( Cow’s milk)
02) 1 Kg of rise per day X Rs 20 X 30 days = 600 (Lowest quality)
03) Vegetables per day Rs 20 X 30 days = 600 (Low value items) 04) Oil, Cereals etc..per month = 1,000 (Low value items)
05) Electricity, Kerosine, fire wood etc.. per month = 300 (Fugal use)
06) Water (Local Panchayat charges per month) = 50 (Fixed)
07) Clothing (Rs 1,500 per year/12) Per month = 125
08) Soap, paste, washing materials etc…per month = 200
09) Local travel per month = 150
--------------
Minimum Expense = Rs 3,625 per month
World bank estimated income per month = Rs 2.100
(minimum level (Rural) -------------
Shortage of income = Rs 1,525 per month
----------------------------------------------------------------------------------------------------
Shifts to an urban area for industrial job, The monthly expense is Rs 7,250/-
(Double). Urbal residence rentals are very high. World bank income estimate is
Rs 6,130. Shortage = Rs 1,120/- per month.
Page 24 of 37

drvsrs
Government subsidises the survival through selected freebies and ration in rural
and urban area up to a possible % of the deficit (Poor and unreliable
distribution).
----------------------------------------------------------------------------------------------------
EXHIBIT - 3 : OPERATING RATIOS OF AAVIN MILK (Government)
Source : http://www.scribd.com/doc/58962209/Inventory-
management-Aavin-Milk
Tamilnadu Co-operative Milk Producers' Federation Ltd
PROJECT : INVENTORY MANAGEMENT AT AAVIN MILK
Average = 98.43 %
YEAR OPERATING EXPENCE NET SALES OPERATING
RATIO %
2005 - 06 4000953 3952423 101.22
2006 - 07 3775629 3809250 99.12
2007 - 08 4475309 4559573 98.15
2008 - 09 5443039 5554969 98.98
2009 - 10 7336429 7746678 94.70
OPERATING EXPENCE = COST OF SALES + EXPENCE
OPERATING RATIO = (OPERATING EXPENCE ÷ NET SALES) X 100
HIGHER OPERATIONF RATIO IS NOT GOOD, BECAUSE IT CAN NOT MEET THE
NEED TO PAY INTERESTS, DIVIDENDS TO SHARE HOLDERS ETC….
---------------------------------------------------------------------------------------------------------------------
Page 25 of 37
drvsrs
EXHIBIT - 4 : OPERATING RATIOS OF AROGYA MILK
(PRIVTE - HUTSON)
SOURCE :
http://www.scribd.com/doc/53145795/51/AROKYA-
MILK-OVERVIEW
PROJECT : AROKYA MILK OVERVIEW (Rs Lakhs)
Average = 98.83 %
YEAR OPERATING
EXPENCE PROFIT NET SALES
OPERATING
RATIO %
March 05 42,971.04 73.51 43,044.55 99.83
March 06 51,482.74 424.5 51,907.24 99.18
March 07 55,490.56 814.6 56,305.16 98.55
March 08 80,705.27 1,792.56 82,497.83 97.82
March 09 95,194.82 1,196.79 96,391.61 98.76
--------------------------------------------------------------------------------------------------------------------
EXHIBIT - 5 : OPERATING RATIOS OF AMUL DIARY (COOPERATIVE UNION)
SOURCE : http://www.scribd.com/doc/34491013/ratio-analysis-of-amul RATIO ANALYSIS OF AMUL (TABLE – 6)
Average = 98.40 %
-------------------------------------------------------------------------------------------------------------------
Page 26 of 37
YEAR OPERATING
RATIO %
2005 - 06 98.52
2006 - 07 98.53
2007 - 08 99.09
2008 - 09 98.80
2009 - 10 97.06

drvsrs
EXHIBIT - 6 : OPERATING RATIO OF US DIARY INDUSTRIES
SOURCE : http://ohioline.osu.edu/b864/pdf/864.pdf
15 MEASURES OF DIARY FARM
COMPETITIVENESS
DIARY EXCEL – OHIO STATE UNIVERSITY
COST CONTROL : OPERATING RATIO
(Total Operating expenses - Farm interest expense) ÷ (gross farm income) X 100
Example from a Diary : Average = 71 %
$ 1,088,000 expenses - $ 52,000 interest = $ 1,036,000 total operating expenses ÷ $
1,450,000 gross farm income = 0.71 x 100 = 71 % operating ratio
-------------------------------------------------------------------------------------------------------------------
EXHIBIT - 7: OPERATING RATIOS OF ALMARAI
SOURCE :
http://investing.businessweek.com/research/stocks/financials/financi
als.asp?ticker=ALMARAI:AB
THE LARGEST INTEGRATED DIARY COMPANY IN SAUDI ARABIA
IN MILLION SAUDI RIALS
Average = 82.62
YEAR OPERATING EXPENCE NET SALES OPERATING
RATIO %
2007 3154.9 3769.8 83.69
2008 4240.5 5029.9 84.31
2009 4903.0 5868.8 83.54
2010 5471.4 6930.9 78.94
Page 27 of 37

drvsrs
EXHIBIT - 8 : OPERATING RATIO OF INDIAN
NON ESSENTIAL ITEMS
MAHINDRA & MAHINDRA SOURCE
http://www.moneycontrol.com/financials/mahindramahindra/ratios/MM
TATA MOTORS SOURCE :
http://www.moneycontrol.com/financials/tatamotors/ratios/TM03
HINDUSTAN UNILEVER
SOURCE : http://money.rediff.com/companies/hindustan-unilever-
ltd/12520002/ratio
Page 28 of 37
March 11 March 10 March 09 March 08 March 07 AVERAGE
80.01 75.74 80.06 75.33 82.50 78.37
March 11 March 10 March 09 March 08 March 07 AVERAGE
84.84 84.78 87.52 86.59 88.73 86.49
March 11 March 10 March 09 March 08 March 07 AVERAGE
72.64 69.02 71.48 69.90 70.36 70.68
drvsrs
EXHIBIT – 9 : AGRICULTURE RETURN ON INVESTMENT
Source : http://www.business-standard.com/india/news/%60both-
paddywheat-cultivation-cost-same%60/328147/
Both paddy and wheat cultivation cost same
----(Business Standard reporter / New Delhi Jul 08, 2008, 00:45 IST)
------------------------------------------------------------------------- SOURCE : http://agritech.tnau.ac.in/agriculture/agri_costofcultivation_rice.htmlLand
Preparation Rs - 1,500.00
Seeds &sowing - 2,000.00
Manures & Manuring - 2,500.00
Weeding after cultivation & Irrigation - 1,620.00
Plant protection - 803.00
Harvest and other Expenses - 2,300.00
-------------------------------------------------------------------
Total Cost per Acre Rs - 10,723.00
-------------------------------------------------------------------
Yield Kg 2,100
Cost per Kg (Average) Rs 5.1062
--------------------------------------------------------------------
Price per Kg (Average) Rs 7.2014
Gross Income (2100 Kg X Rs 7.2014) Rs 15, 122.94
Net income (15,122.94 – 10,723.00) Rs 4,399.94 (Say 4,400 per acre)
--------------------------------------------------------------------------------------------------- Net Income per year : One acre. Cash Crops (Planted off season
Paddy Rs 4,400 per season X 3 seasons = Rs 13,200 Like Cereals, Chilly, Gingili
Net income from other cash crops = 2,640 @ 20 % Grains, Vegetables etc…
Net income from coconut = 2,640 @ 20%
------------
Total Net Income = Rs 18,480
--------------------------------------------------------------------------------------------------------------------- Source : http://www.agricultureinformation.com/forums/farm-lands/61002-rs-6-50-lacs-per-
acre-wet-lands-agriculture-sale-near-bangalore.html
Date : 03/11/2011 (Advertisement in Internet) “Rs 6.50 lacs per acre Wet lands for
agriculture for sale near Bangalore. Good Agriculture wet lands available for sale 65 kms
away from Bangalore Near Bagalur - Berikai area in Tamilnadu.”
Cost of 1 acre of fertile wet land = 6,50,000 INR (About US$ 15,489. 1 Lakh = 0.10 Million)
Return on 1 acre investment = 6,50,000 ÷ Yearly net income of Rs 18,480 = 35.17 Years.
Rate of Return on land investment = (1 ÷ 35.17 years) X 100 = 2.84 % per year. This is a very
poor ROI compared to investing 6.5 Lakhs in other investment opportunities.
====================================================================
Page 29 of 37

drvsrs
EXHIBIT – 10 : OPERATING RATIOS OF INDIAN RAILWAYS SOURCE : http://www.investinindia.com/news/indian-railways-running-over-
90-operating-ratio-23m4 &
http://en.wikipedia.org/wiki/Indian_Railways#Passenger
Indian Railways has 114,500 kilometers
(71,147 mi) of total track over a route of
65,000 kilometers (40,389 mi) and 7,500
stations. It has the world's fourth largest
railway network after those of the United States, Russia and China. The
railways carry over 30 million passengers and 2.8 million tons of freight daily. It
is the world's fourth largest commercial or utility employer, with over
1.4 million employees.http://en.wikipedia.org/wiki/Indian_Railways - cite_note-Stats_2010-3
As for rolling stock, IR owns over 240,000 (freight) wagons, 60,000 coaches and
9,000 locomotives. Indian Railways is running over 90% Operating ratio (11
Aug 2011)
The main reason for Operating
Ratio being more than 90 per
cent, is steep increase in staff
cost and pensionary charges
consequent upon implementation of the recommendations of VI Central Pay
Commission. With the stabilizing of the impact of the VI Central Pay
Commission, the Operating Ratio is expected to improve in due course. Railways
are also taking several measures to augment traffic earnings and controlling
expenditure.
EXHIBIT – 11 : OPERATING RATIOS OF INDIAN TEXTILE MILL
SOURCE :
http://www.moneycontrol.com/financials/winsometextileindustries/ratios/WTI
& http://www.winsomegroup.com/company.htm
Operating from 1952 in Calcutta, India. Spinning unit with
50,000 Spindles, Yarns 1,10,000 spindles, 9,500 kgs per day of fibre/yarn dyeing,
All the spinning units are equipped with latest machinery. Quality management
certificate is ISO 9002. Environment management certificate is ISO 1401.
Page 30 of 37
Average = 92.88
2008-09 2009-10 2010-11 2011-12
90.5 95.3 94.6 91.1
Average = 86.66
Mar 11 Mar 10 Mar 09 Mar 08 Mar 07
83.68 85.90 94.65 86.26 82.83

drvsrs
EXHIBIT – 12 : OPERATING RATIOS OF INDIAN CEMENT
INDUATRY
SOURCE : http://www.moneycontrol.com/financials/indiacements/ratios/IC &
http://www.indiacements.co.in/
In
di
a
ce
ments : Started in 1945. In 2012, Operating at 7
locations in India. Production in 2010 is 14.5 Million
Tons per annum. A Largest private cement producer in India. The operating
Ratios are in the left. The cement industry operating ratios are controlled
within 75 % and favourable.
EXHIBIT – 13 OPERATING RATIOS OF CONSTRUCTION COMPANY
SOURCE :
http://www.moneycontrol.com/financials/hindustanconstructioncompany/cash-
flow/HCC#HCC & http://www.indiamart.com/company/1517493/#profile
Hindustan Infrastructure
Construction Corporation is a
company formed out of Hindustan
Construction Corporation, a
firm formed in the year 1996.
The firm converted into a
Ltd. Company to take the
bigger construction projects in Government and private sector both. The
company came into existence as a registered contractor with Government of
India (Delhi) for various B.O.T. projects.
INFERENCE : The average operating ratio in cement industry is under control
with an average of 74.51 %. But the infrastructure construction industry
absorbs this favourable ratio and ultimately leads it to an average of 102.06. It
is very high and unfavourable.
========================================================
Page 31 of 37
Average = 74.51
Mar 11 Mar 10 Mar 09 Mar 08 Mar 07
89.74 79.66 37.06 64.12 66.96
Average = 102.06
Mar 11 Mar 10 Mar 09 Mar 08 Mar 07
97.55 98.38 96.84 94.13 123.40

drvsrs
EXHIBIT - 14 : VIEWS OF PLANNERS ON ESSENTIAL ITEMS
Source : http://www.business-standard.com/india/news/qa-prof-abhijit-sen-
member-planning-commission/427929/
From : Business Standard. Thursday, Mar 29, 2012 ---------------------------------------------------------------------------------------------------------------------
Prof Abhijit Sen, member of the Planning Commission, discusses Budget
provisions related to the agriculture sector in an interview with Rajesh Bhayani
and Sanjeeb Mukherjee.
----------------------------------------------------------------------------------------------------
Sen feels, futures trading in essentials commodities like wheat and rice should
not be allowed. According to him, India should follow China in having an agency
for procuring commodities from the global market.
----------------------------------------------------------------------------------------------------
Q : There seems to a renewed focus in this Budget on ancillary items of
agriculture like millet, cereals, fodder, and protein-rich food items, like milk,
eggs and chicken. However, isn’t it too late for that?
A : One thing needs to be kept in mind, as far as agriculture is concerned, there
has been a shift towards income of farmers, rather than that on tonnage of
production.
---------------------------------------------------------------------------------------------------
Q : Finance minister soon after the Budget said we need to have another Green
Revolution. How far is it achievable?
A : It is very easy to raise slogans like that, but we need to understand what was
Green Revolution. Green Revolution was something which happened elsewhere,
in two research institutions in Philippines and Mexico, and we got some dwarf
varieties of wheat first and then rice, which were ably supported by inputs in the
form of fertilisers and also marketing support. Today, there is no crop in which
you have got this sort of technological help. Second, farmers’ income is going to
come from growing other crops also. Hence, the one single factor is missing.
Moreover, the world has changed a lot. With intellectual property rights coming
in, you can’t get anything from the world without paying for it. Hence, it won’t
be possible to have a repeat of the first Green Revolution. Rather, we in India
should try to achieve higher rate of agriculture growth in per capita terms.
---------------------------------------------------------------------------------------------------
Page 32 of 37

drvsrs
EXHIBIT - 15 : India's Consumer Prices Index.
INCREASE Base 11.46 16.14 21.70 10.27 14.89
2007 2008 2009 2010 2011 Average
Source : http://www.tradingeconomics.com/india/consumer-prices-index-
average-imf-data.html
EXHIBIT - 16 : US Consumer price index.
Source : http://www.usinflationcalculator.com/inflation/consumer-price-index-
and-annual-percent-changes-from-2007 to-2011
2007 2008 2009 2010 2011 Index
Base Index Increase Index Increase Index Increase Index Increase
207.3 215.3 8.0 214.5 (0.8) 218.1 3.6 224.9 6.8
Average : 4.4
Source : http://www.usinflationcalculator.com/inflation/consumer-price-index-
and-annual-percent-changes-from-1913-to-2011
Page 33 of 37

Page 34 of 37
drvsrs
drvsrs
EXHIBIT - 17

drvsrs
L) BIBLIOGRAPHY
A) Author’s Books
1) Accelerate Your Socio-Economic Development : A Geometric Model
A new research concept book to accelerate the world development by synchronosing the
Domestic investment with Domestic Savings & Domestic technology with Domestic
Manpower. An unique application of Geometry to the faculty of Economics and
Management. Lambert Academic Publishers, Germany. ISBN : 978-3-8383-5761-4
(April 15, 2010)
2) Productivity Redefinition for Socio-Economic Development oriented Management
Decisions : An Algebraic Model.
A new research model relating the Productivity measurement with reference to Socio-
Economic Development units, keeping the quantum Output to Input as secondary.
Management decisions are evaluated with the new Productivity model. An unique
application of Algebra to the faculty of Economics and Management. Lambert Academic
Publishers, Germany. ISBN : 978-3-8383-6450-6 (May 8, 2010)
3) Productivity Implications of Employee Performance Appraisal System
Relates the performance appraisal grade of an employee with his productivity on the job.
Infers that Appraisal is related to Productivity through the Management information
System (MIS). The Doctor of Philosophy (Ph.D) thesis in “Management”, University of
Bombay (1975), India. Lambert Academic Publishers, Germany.
ISBN : 978-3-8383-7436-9 (June 7, 2010)
B) Author’s Web Articles
Social Science Research Net Work (SSRN) <http://www.ssrn.com/author=360079>
Research Papers in Economics (RePEc) <http://ideas.repec.org/e/psu50.html>
1) Mrs. Gandhi Gave New Economic Approaches – Center page article in “Barbados
Advocate” Page 4 - Tuesday - January 8, 1985.
2) Gandhi – View of a Managerial Economist
C) Professor. W. Arthur Lewis (1915-1991). Nobel Laureate of 1979 in Economic Science.
Selected Economic Writings of Sir.W.Arthur Lewis. Editor : Mark. Gersovitz. 1983
1. The Slowing Down of the Engine of Growth (Nobel prize paper) Pages 283-292.
2. Development and Distribution. Pages 443-456.
3. Thoughts on Land Settlement. Pages 563-571.
4. A Review of Economic Development. Pages 653-668. (Richard.T.Ely Lecture)
Page 35 of 37
EXHIBIT
17

drvsrs
M) ABOUT THE AUTHOR
DR. VSR. SUBRAMANIAM
The author is academically a B.Sc., MBA., Ph.D., and a Post
Doctoral degree holder in Computer Science, from the World
University, USA. From 2010, an international Professor in
Management Science and Technology, A MIS Consultant and
Socio-Economic development acceleration specialist. A “Past
“Data Processing Expert” in Commonwealth Fund for
Technical Cooperation (CFTC), London and “Consultant
Adviser - Computer Services” in the Caribbean Development
Bank (CDB - A World Bank & UNDP setup), Barbados, West Indies. Author
of over 60 publications in Management technique applications. 37 years
experienced in national and multinational organisations as a Head of Techno-
commercial departments and 12 years of Full-time & Visiting Professorship to
many accredited institutions in the world. Between 1982 and 1992, associated
with 5 Nobel Laureates in Economic Science. Created & published many new
models concepts to accelerate the Socio-Economic Development, Country
management for Global Leadership etc.., by the unique application of Algebra
and Geometry to the area of Economics and Management Sciences.
Book Store - http://drvsrs.com/store/page1.html
Web site – http://www.drvsrs.com Email – [email protected]
In the internets of :
a) All Experts :
http://www.allexperts.com/expert.cgi?m=1&catID=2301&expID=74700
b) Ideas & Research Papers in Economics Net Work (RePEc) :
http://ideas.repec.org/e/psu50.html
c) Social Science Research Net Work (SSRN) :
http://www.ssrn.com/author=360079
***********
Page 36 of 37
drvsrs
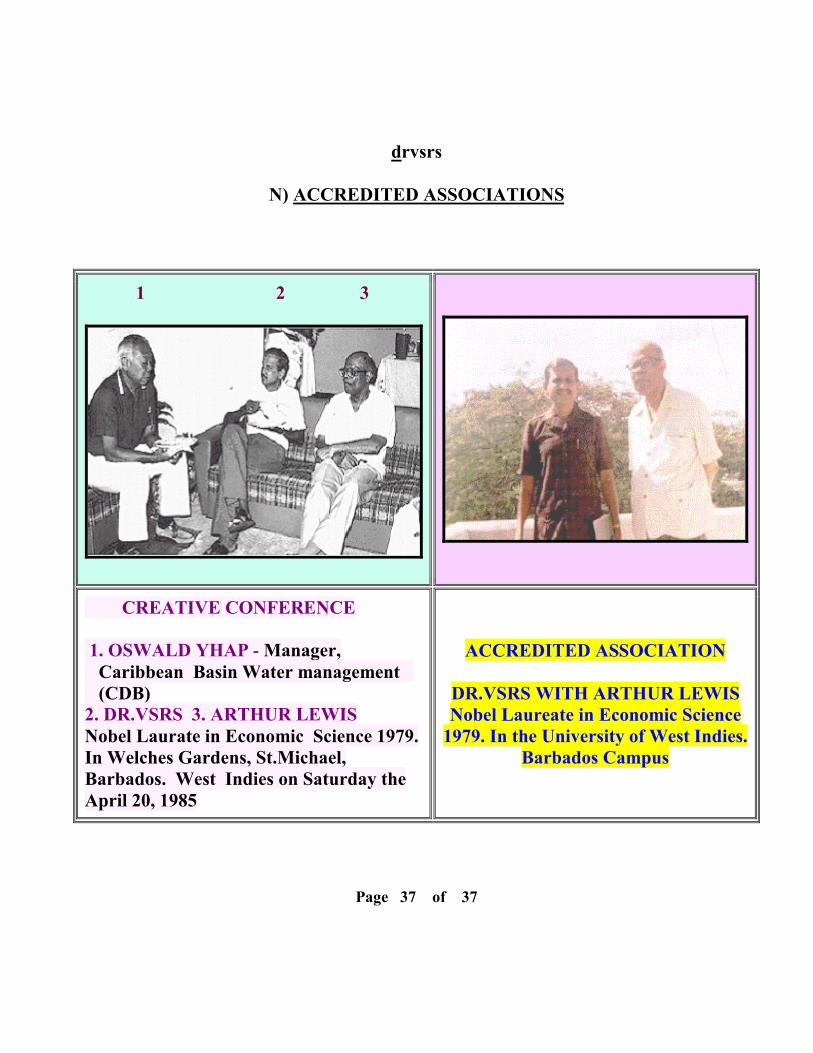
N) ACCREDITED ASSOCIATIONS
1 2 3
CREATIVE CONFERENCE
1. OSWALD YHAP - Manager,
Caribbean Basin Water management
(CDB)
2. DR.VSRS 3. ARTHUR LEWIS
Nobel Laurate in Economic Science 1979.
In Welches Gardens, St.Michael,
Barbados. West Indies on Saturday the
April 20, 1985
ACCREDITED ASSOCIATION
DR.VSRS WITH ARTHUR LEWIS
Nobel Laureate in Economic Science
1979. In the University of West Indies.
Barbados Campus
Page 37 of 37

The essential item producers and distributors in every nation, inflate the prices
of their commodities, to cover up their mis-management every year, so that
more and more people are not afford to buy them. Thus they create, increase
and maintain an expanding below poverty line persons in the nation. This Book
substantiates this statement, through verified inference. Also it suggests a dual
ratio control on Essential item producers and distributors, for poverty
eradication. Human, because of their intelligence, survived in a 3 dimensional
shell namely (a) The geography and environment (b) The social influences and
(c) The economic infrastructure. This book pin points each segment of the world
population in and under poverty line, using the World Bank survey map, and
the Operating ratio as the measure of the performance of the essential suppliers.
Lower ratio represents prosperity. India is taken as a representative country for
the analysis. Agriculture is found to be of little value compared to the return on
land investment, due to the absence of mass farming. Milk and other essential
items like travel, textiles and construction are taken as essential items. An
analysis of their Operating ratio in government and private sectors indicate that
the ratio is high. It is because of their mismanagement, and monopoly status.
They keep the citizen as their captive customers and use price increase as a
leverage for their continued survival. But this ratio in developed nations are low
and under control. Also, the operating ratio of non-essential goods in the
developing nations are low and favourable, because of competition and global
business operators. The golden rule is that the Essential need supplies should
keep their Operating ratio at 75 % or below. through cost and expense control.
The growth rate of GNP should be equal to the population growth rate OR the
population growth rate should be kept equal or less than the feasible GNP
growth rate. This will eradicate the poverty in the world. This is applicable to
all in government, public or private sectors and all the nations in developed,
developing and under developed bracket of economic status.
The author is an international expert in corporate
management, MIS and a Socio-Economic Development
Acceleration Expert. He is the past Consultant Adviser to the
Caribbean Development Bank (CDB), Barbados, West Indies
& Data processing Expert of the Commonwealth Fund for
Technical Cooperation (CFTC), London, UK. He is a past
associate of 5 Nobel Laureates in Economic Science. He has
published many innovative books from Germany. Currently,
he is a Professor in Management and a Consultant.
ID : 4240849 ISBN : 978-1484087442


