Munich Personal RePEc Archive - uni-muenchen.de · Munich Personal RePEc Archive ... (In Rs...
21
Munich Personal RePEc Archive Social Sector Expenditure and Human Development of Indian States Pranjal Mittal Individual 13 July 2016 Online at https://mpra.ub.uni-muenchen.de/75804/ MPRA Paper No. 75804, posted 25 December 2016 01:31 UTC
Transcript of Munich Personal RePEc Archive - uni-muenchen.de · Munich Personal RePEc Archive ... (In Rs...

MPRAMunich Personal RePEc Archive
Social Sector Expenditure and HumanDevelopment of Indian States
Pranjal Mittal
Individual
13 July 2016
Online at https://mpra.ub.uni-muenchen.de/75804/MPRA Paper No. 75804, posted 25 December 2016 01:31 UTC
Social Sector Expenditure and
Human Development of Indian States
Pranjal Mittal
Abstract
The Study tries to explore the effect of Social Sector
Expenditure (SSE) on Human Development Index (HDI) of
Indian States. It is found that SSE has a positive impact on HDI.
JEL: H76, JEL: O23

Social Sector Expenditure and Human Development Index of Indian States
Introduction
Social sector expenditure is a key instrument for the development of the country.
Researchers have made several attempts both at national and international level to address the issue
that whether social sector expenditure can be instrumental for sustainable economic and social
development to achieve various developmental goals (such as MDG-Millennium Development
Goals) by influencing the wellbeing of people.
Public spending on social sector is given importance for at least two reasons. First, the
extent of deprivation in the developing countries is too large to be left to market forces alone to
take care of sufficient spending required for human development. Second, the poor utilizes
government services as compared to richer households. This study makes an attempt to analyse
the state of human development index and public spending on social sector across the States of
India. The Human Development Index (HDI) is a composite index of health, education and per
capita income. The Human Development Index (HDI) introduced by UNDP in 1990 is a simple
average of three dimension indices that measure average achievements in a country with regard to
‘A long and healthy life’, as measured by life expectancy at birth; ‘Knowledge’, as measured by
the adult literacy rate and the combined primary, secondary and tertiary gross enrolment ratio; and
‘A decent standard of living’, as measured by estimated earned income in Purchasing Power Parity
(PPP) US$. It can be taken as a simple proxy for the extent of achievement in few important
dimensions of economic development.
The concept of Human Development throws light on total development of human beings
by considering the improvement of following sectors: economic, social, cultural, educational,
health and civic conditions of human beings residing in a definite territory. Mere consideration of
economic development is considered to be dangerous for human development of any country.
Review of Literature
Social Expenditure plays a major role to achieve the goal of development to build societies
that are socially inclusive, economically healthy, and democratically anchored. There have been
many attempts to measure the quality of life of society across the countries in world (Human
Development Index of UNDP, various years), or across the states in India (HDR of different States,
various years). Unequal human development among states is marked by several studies in India.
Several studies with their different quantitative methodologies concluded that expenditure in the
social sector is an important determinant of economic growth. Such social expenditures enhance
productivity by providing infrastructure, education, health and harmonizing private and social
interests (Arora,2001; Mundle, 1998; Dev and Ravi (2007); Majumder,2005; Kannan and Pillai,
2007; Sen and Karmakar,2007; Guha and Chakraborty, 2003; etc.). Planned allocation of resources
in independent India was expected to rectify inter-regional disparities and imbalances in
development but it could not fulfil its challenges (Roy and Bhattacharjee, 2009; Rao, Govinda et
al, 1999; Chakravarty, 2009; etc.).
Objective of the Study
An important feature of social sector expenditures in India is that they are incurred
majorly by State Governments. In the constitutional division of responsibilities between Centre
and States, sectors that ensure the provision of basic needs are the primary responsibility of State
governments, though the Centre may provide leadership, direction, and support. Among the social
sectors, education is in the concurrent list though the bulk of expenditure is incurred by the State
Governments. On the other hand, although medical and public health is in the domain of the States,
the Centre plays an important role and finances several Centrally-sponsored programmes and
almost the entire family welfare programmes which includes maternal and child health services.
This study is inspired by existing literature on relationship between social sector expenditure and
human development for India. The objectives of this study are: i) To analyse the trends in social
sector expenditure for Indian States; ii) To do an inter-state comparison with respect to social
sector expenditure and human development and iii) To capture the correlation between human
development index and social sector expenditure by doing a state level analysis. The study is

confined to two time periods 2004-05 and 2011-12 for analysis of correlation and for rest of the
trend analysis the data is from 2000-01 to 2014-15.
Data Source and Methodology
The study uses data from Reserve Bank of India, Ministry of Statistics and Programme
Implementation, Government of India, Census of India, RGI. The analysis of the study is based on
simple correlation and regression.
Data Analysis and Results
The social sector expenditure in India can be classified under two heads capital
expenditure and revenue expenditure. Capital expenditure constitutes a very small portion of total
social sector expenditure and revenue component is over 90 per cent which can be observed from
the following graph 1. Revenue expenditure consists mainly of salaries, while capital expenditure
is the expenditure for accumulation of asset. It is important to notice that the share of capital
expenditure is showing an increasing trend. It accounts for 11.2 per cent in 2014-15(RE) as
compared to 6.9 per cent in 2000-01. Table 1 shows the revenue-capital composition of State
governments' expenditure on education, health and overall social sector from 2000-01 to 2014-15.
Graph 1: Share of revenue and capital expenditure in total social sector expenditure
(In per cent)
Data Sources: State Finances: A Study of Budgets, Reserve Bank of India, 2016
From the above graph, we can observe that the share of capital expenditure first increased from
2000-01 to 2001-02 and then decreased in the next year. Afterwards, it continuously increased
82%
84%
86%
88%
90%
92%
94%
96%
98%
100%
RE CE

from 2002-03 to 2008-09. Then the capital expenditure decreased till 2010-11 and remained
almost constant till 2013-14. Finally, it increased from 2013-14 to 2015-16.
Graph 2: Social Sector expenditure as percentage of GDP
The above diagram shows Social sector expenditure as a percentage of GDP, which was
declining till 2008. Then it increased till 2011 and afterwards became constant. Finally, it
increased till 2016.
0.00
2.00
4.00
6.00
8.00
10.00
SSE as percentage of GDP

Table 1: Composition of Expenditure on Social Service: All States
(In Rs Billion)
Item 2000-
01 2001-02
2002-03
2003-04
2004-05
2005-06
2006-07
2007-08
2008-09
2009-10
2010-11
2011-12
2012-13
2013-14
2014-15(RE)
1. Revenue Expenditure (i + ii)
1134 1163 1219 1322 1460 1678 1956 2281 2851 3489 4029 4679 5367 6103 8662
(i) Social Services (a to l)
1024 1054 1091 1175 1290 1486 1746 2038 2553 3086 3657 4256 4854 5501 7292
(a) Education, Sports, Art and Culture
588 591 613 643 694 782 896 1008 1213 1517 1876 2161 2454 2735 3490
(b) Medical and Public Health
126 129 134 141 152 175 192 219 262 326 381 440 506 564 815
(c) Family Welfare
23 25 24 25 25 28 30 36 45 57 68 76 95 101 162
(d) Water Supply and Sanitation
54 55 55 65 69 85 88 98 103 105 115 127 124 147 235
(e) Housing 13 12 14 17 19 20 29 40 59 57 64 67 86 87 183
(f) Urban Development
27 32 35 39 48 47 95 142 218 227 217 228 283 315 474
(g) Welfare of SCs, STs and OBCs
61 68 71 77 92 105 118 146 181 209 253 309 380 427 556
(h) Labour and Labour Welfare
12 11 12 14 15 17 25 24 28 34 40 44 59 70 94
(i) Social Security and Welfare
49 50 61 71 80 92 129 176 252 329 387 485 556 655 800
(j) Nutrition 25 23 23 28 32 40 48 62 85 112 135 157 170 196 239
(k) Expenditure
39 50 42 47 56 86 79 67 83 84 88 137 110 169 202
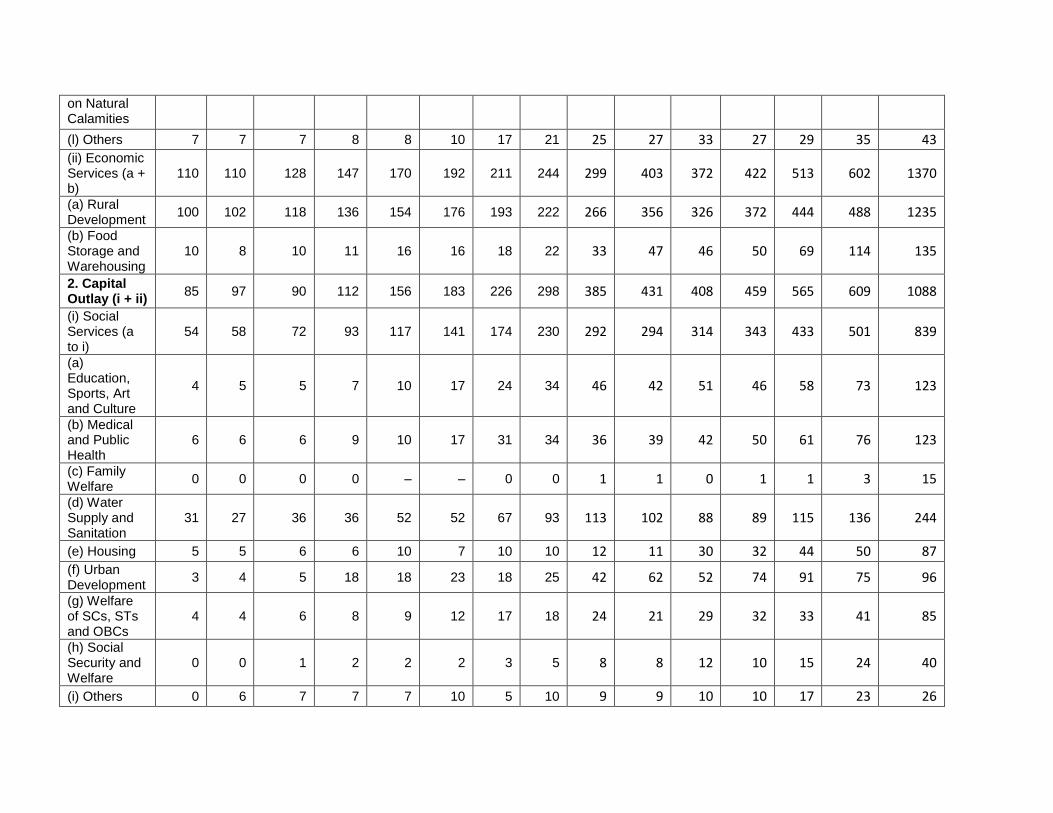
on Natural Calamities
(l) Others 7 7 7 8 8 10 17 21 25 27 33 27 29 35 43
(ii) Economic Services (a + b)
110 110 128 147 170 192 211 244 299 403 372 422 513 602 1370
(a) Rural Development
100 102 118 136 154 176 193 222 266 356 326 372 444 488 1235
(b) Food Storage and Warehousing
10 8 10 11 16 16 18 22 33 47 46 50 69 114 135
2. Capital Outlay (i + ii)
85 97 90 112 156 183 226 298 385 431 408 459 565 609 1088
(i) Social Services (a to i)
54 58 72 93 117 141 174 230 292 294 314 343 433 501 839
(a) Education, Sports, Art and Culture
4 5 5 7 10 17 24 34 46 42 51 46 58 73 123
(b) Medical and Public Health
6 6 6 9 10 17 31 34 36 39 42 50 61 76 123
(c) Family Welfare
0 0 0 0 – – 0 0 1 1 0 1 1 3 15
(d) Water Supply and Sanitation
31 27 36 36 52 52 67 93 113 102 88 89 115 136 244
(e) Housing 5 5 6 6 10 7 10 10 12 11 30 32 44 50 87
(f) Urban Development
3 4 5 18 18 23 18 25 42 62 52 74 91 75 96
(g) Welfare of SCs, STs and OBCs
4 4 6 8 9 12 17 18 24 21 29 32 33 41 85
(h) Social Security and Welfare
0 0 1 2 2 2 3 5 8 8 12 10 15 24 40
(i) Others 0 6 7 7 7 10 5 10 9 9 10 10 17 23 26
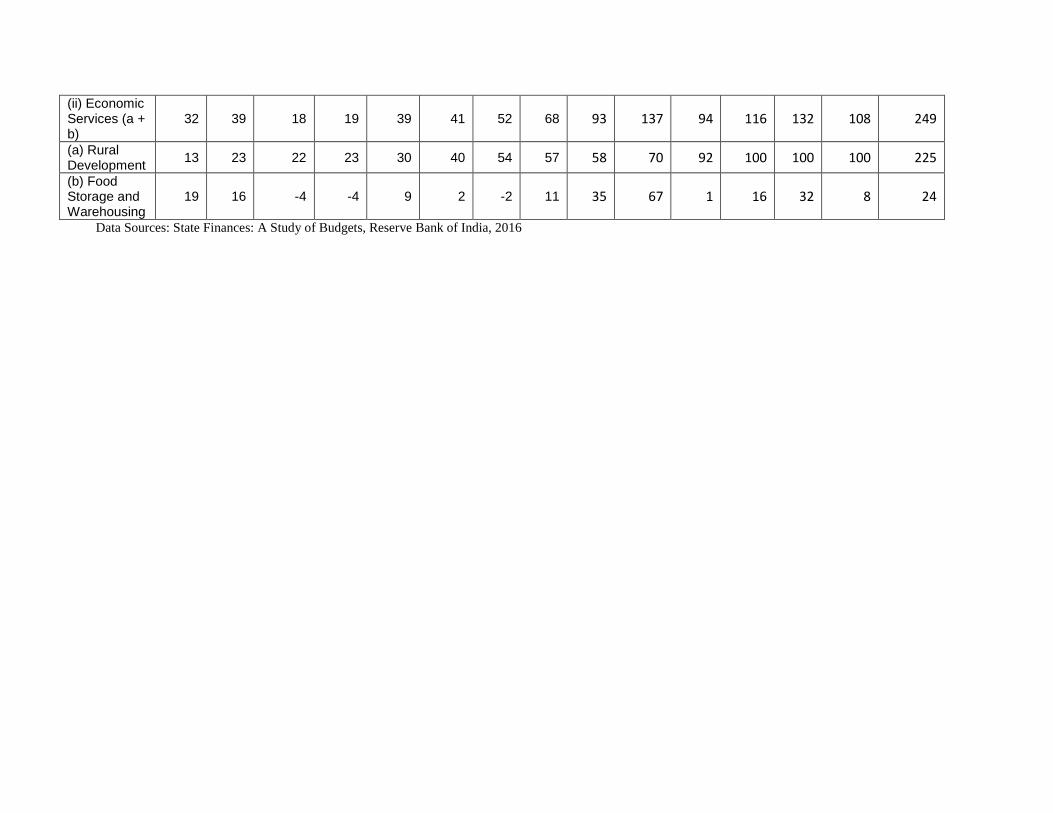
(ii) Economic Services (a + b)
32 39 18 19 39 41 52 68 93 137 94 116 132 108 249
(a) Rural Development
13 23 22 23 30 40 54 57 58 70 92 100 100 100 225
(b) Food Storage and Warehousing
19 16 -4 -4 9 2 -2 11 35 67 1 16 32 8 24
Data Sources: State Finances: A Study of Budgets, Reserve Bank of India, 2016
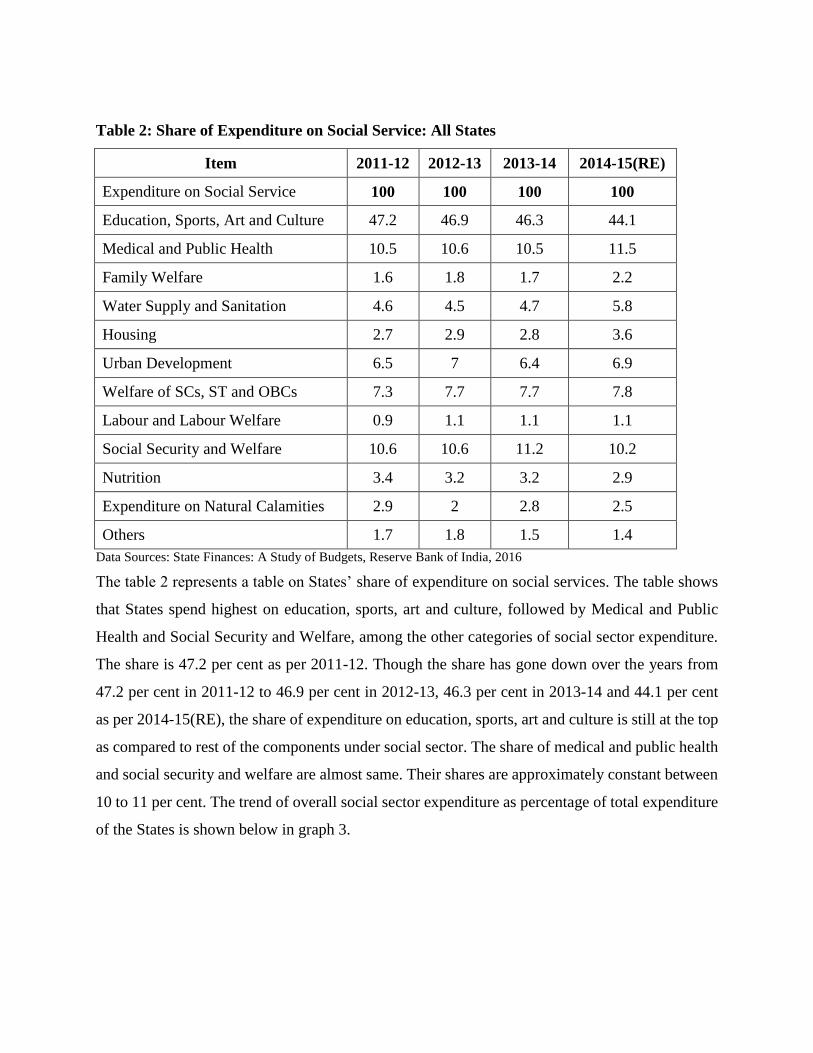
Table 2: Share of Expenditure on Social Service: All States
Item 2011-12 2012-13 2013-14 2014-15(RE)
Expenditure on Social Service 100 100 100 100
Education, Sports, Art and Culture 47.2 46.9 46.3 44.1
Medical and Public Health 10.5 10.6 10.5 11.5
Family Welfare 1.6 1.8 1.7 2.2
Water Supply and Sanitation 4.6 4.5 4.7 5.8
Housing 2.7 2.9 2.8 3.6
Urban Development 6.5 7 6.4 6.9
Welfare of SCs, ST and OBCs 7.3 7.7 7.7 7.8
Labour and Labour Welfare 0.9 1.1 1.1 1.1
Social Security and Welfare 10.6 10.6 11.2 10.2
Nutrition 3.4 3.2 3.2 2.9
Expenditure on Natural Calamities 2.9 2 2.8 2.5
Others 1.7 1.8 1.5 1.4
Data Sources: State Finances: A Study of Budgets, Reserve Bank of India, 2016
The table 2 represents a table on States’ share of expenditure on social services. The table shows
that States spend highest on education, sports, art and culture, followed by Medical and Public
Health and Social Security and Welfare, among the other categories of social sector expenditure.
The share is 47.2 per cent as per 2011-12. Though the share has gone down over the years from
47.2 per cent in 2011-12 to 46.9 per cent in 2012-13, 46.3 per cent in 2013-14 and 44.1 per cent
as per 2014-15(RE), the share of expenditure on education, sports, art and culture is still at the top
as compared to rest of the components under social sector. The share of medical and public health
and social security and welfare are almost same. Their shares are approximately constant between
10 to 11 per cent. The trend of overall social sector expenditure as percentage of total expenditure
of the States is shown below in graph 3.

Graph 3: Social Sector Expenditure as percent of Total expenditure of States
Data Sources: Authors calculation and State Finances: A Study of Budgets, Reserve Bank of India, 2016
The above graph shows that the social sector expenditure as percentage of total expenditure of
states is highest for the year 2014-15 at 43.3 per cent, followed by the year 2015-16 at 42.9 per
cent. The percentage of social sector expenditure decreases from 35 per cent in 2000-01 to 28.4
per cent in 2003-04. Then it shows an increasing trend from 2003-04 to 2009-10. After 2009-10,
it remains stagnant till 2013-14. Then it again increases from 39.8 per cent in 2013-14 to 43.3 per
cent in 2014-15. 2015-16 figure gives an estimate of downturn of 42.9 per cent from 2014-15.
Expenditure on social sector is an area of concern for human development, therefore, it is necessary
to make efficient amount of expenditure by the government to achieve human development goals.
The following section analyses the state wise pattern of per capita social expenditure and human
development index. The study does a comparison of states for two years 2004-05 and 2011-12 and
try to capture the correlation between human development index and social sector expenditure of
States.
Table 3: Per Capita Social Sector Expenditure and their ranks during 2004-05 and 2011-12
States
PCSSE (Rs.) Rankings
Rank
change
(old rank
–new
rank)
PCSSE
2004-05
PCSSE
2011-12
PCSSE
2004-05
PCSSE
2011-12

Sikkim 8875 23861 1 1 0
Goa 5936 15778 3 2 1
Arunachal Pradesh 5920 15623 4 3 1
Mizoram 7315 15032 2 4 -2
Himachal Pradesh 3834 8751 6 5 1
Nagaland 3166 8129 9 6 3
Meghalaya 3191 7895 8 7 1
Manipur 4015 7422 5 8 -3
Tripura 3501 7328 7 9 -2
Uttarakhand 2745 7295 11 10 1
Jammu & Kashmir 3056 6965 10 11 -1
Haryana 1655 6417 22 12 10
Tamil Nadu 2182 5808 13 13 0
Chhattisgarh 1742 5799 20 14 6
Kerala 2305 5613 12 15 -3
Maharashtra 2109 5440 14 16 -2
Andhra Pradesh 1813 5362 18 17 1
Karnataka 1847 5295 17 18 -1
Gujarat 1999 5026 15 19 -4
Odisha 1250 4303 24 20 4
Rajasthan 1741 4059 21 21 0
West Bengal 1214 3898 25 22 3
Madhya Pradesh 1205 3737 26 23 3
Punjab 1539 3599 23 24 -1

Assam 1793 3590 19 25 -6
Jharkhand 1904 3252 16 26 -10
Uttar Pradesh 1019 2992 27 27 0
Bihar 737 2317 28 28 0
Data Sources: Authors calculation, State Finances: A Study of Budgets, Reserve Bank of India, 2016 and Census of
India, RGI.
Table 3 shows state wise PCSSE during 2004-05 and 2011-12 and also shows how ranks of states
changes over time.
Graph 4: Change in ranks (PCSSE) of states from 2004-05 to 2011-12
From the above graph, we can assess the performance of Indian States in terms of Per Capita Social
Sector Expenditure. States like Haryana, Chhattisgarh, Odisha witnessed a substantial increase in
PCSSE. Further, states like Goa, Meghalaya, Jammu and Kashmir observed small amounts of
positive trend. On the other hand, states like Mizoram, Manipur, Gujarat had a decrease in their
PCSSE over the time and states like Assam and Jharkhand experienced major decline in their
PCSSE.
-15
-10
-5
0
5
10
15
Sikk
im
Go
a
Aru
nac
hal
Pra
des
h
Miz
ora
m
Him
ach
al P
rad
esh
Nag
alan
d
Meg
hal
aya
Man
ipu
r
Trip
ura
Utt
arak
han
d
Jam
mu
& K
ash
mir
Har
yan
a
Tam
il N
adu
Ch
hat
tisg
arh
Ker
ala
Mah
aras
htr
a
An
dh
ra P
rad
esh
Kar
nat
aka
Gu
jara
t
Od
ish
a
Raj
asth
an
Wes
t B
en
gal
Mad
hya
Pra
des
h
Pu
nja
b
Ass
am
Jhar
khan
d
Utt
ar P
rad
esh
Bih
ar
Change in Rank

Table 4: State wise HDI and their ranks during 2004-05 and 2011-12
States
HDI Rankings
HDI
2004-05
HDI
2011-12
HDI
2004-05
HDI
2011-12
Rank
change
(old
rank-
new
rank)
Kerala 1.000 0.911 1 1 0
Goa 0.781 0.803 2 2 0
Himachal Pradesh 0.605 0.647 4 3 1
Tamil Nadu 0.587 0.633 5 4 1
Maharashtra 0.583 0.629 6 5 1
Punjab 0.64 0.538 3 6 -3
Haryana 0.544 0.493 7 7 0
West Bengal 0.462 0.483 10 8 2
Jammu & Kashmir 0.493 0.479 9 9 0
Gujarat 0.429 0.477 12 10 2
Uttarakhand 0.247 0.426 20 11 9
Karnataka 0.436 0.42 11 12 -1
Mizoram 0.529 0.408 8 13 -5
Tripura 0.288 0.354 17 14 3
Sikkim 0.299 0.324 15 15 0
Rajasthan 0.278 0.324 18 16 2
Andhra Pradesh 0.298 0.309 16 17 -1
Odisha 0.174 0.261 24 18 6
Nagaland 0.403 0.257 13 19 -6
Meghalaya 0.34 0.246 14 20 -6
Jharkhand 0.145 0.222 26 21 5
Manipur 0.256 0.199 19 22 -3
Madhya Pradesh 0.182 0.186 23 23 0
Chhattisgarh 0.142 0.18 27 24 3
Bihar 0.05 0.158 28 25 3
Assam 0.234 0.138 22 26 -4
Arunachal Pradesh 0.234 0.124 21 27 -6
Uttar Pradesh 0.167 0.122 25 28 -3 Data Source: Data taken from Mukherjee et al, Working Paper No. 2014-139, June 2014, National Institute of Public
Finance and Policy
The above table 4 shows state-wise HDI during 2004-05 and 2011-12 and also shows how ranks
of states change over time.

Graph 5: Change in ranks (HDI) of states from 2004-05 to 2011-12
The above graph helps us to understand the performance of Indian States based on HDI from 2004-
05 to 2011-12. As we can see, states such as Uttarakhand and Odisha undergone a huge increase
in their HDI over the time. While states like Bihar and Chhattisgarh had a moderate increase in
their HDI, other states like Mizoram, Nagaland, Meghalaya and Arunachal Pradesh experienced a
major dip in their HDI.
The following graph 6 and graph 7 shows the state-wise per capita expenditure and state-wise
human development index (HDI) during 2004-05 respectively.
-8
-6
-4
-2
0
2
4
6
8
10
Ker
ala
Go
a
Him
ach
al P
rad
esh
Tam
il N
adu
Mah
aras
htr
a
Pu
nja
b
Har
yan
a
Wes
t B
en
gal
Jam
mu
& K
ash
mir
Gu
jara
t
Utt
arak
han
d
Kar
nat
aka
Miz
ora
m
Trip
ura
Sikk
im
Raj
asth
an
An
dh
ra P
rad
esh
Od
ish
a
Nag
alan
d
Meg
hal
aya
Jhar
khan
d
Man
ipu
r
Mad
hya
Pra
des
h
Ch
hat
tisg
arh
Bih
ar
Ass
am
Aru
nac
hal
Pra
des
h
Utt
ar P
rad
esh
Change in Rank
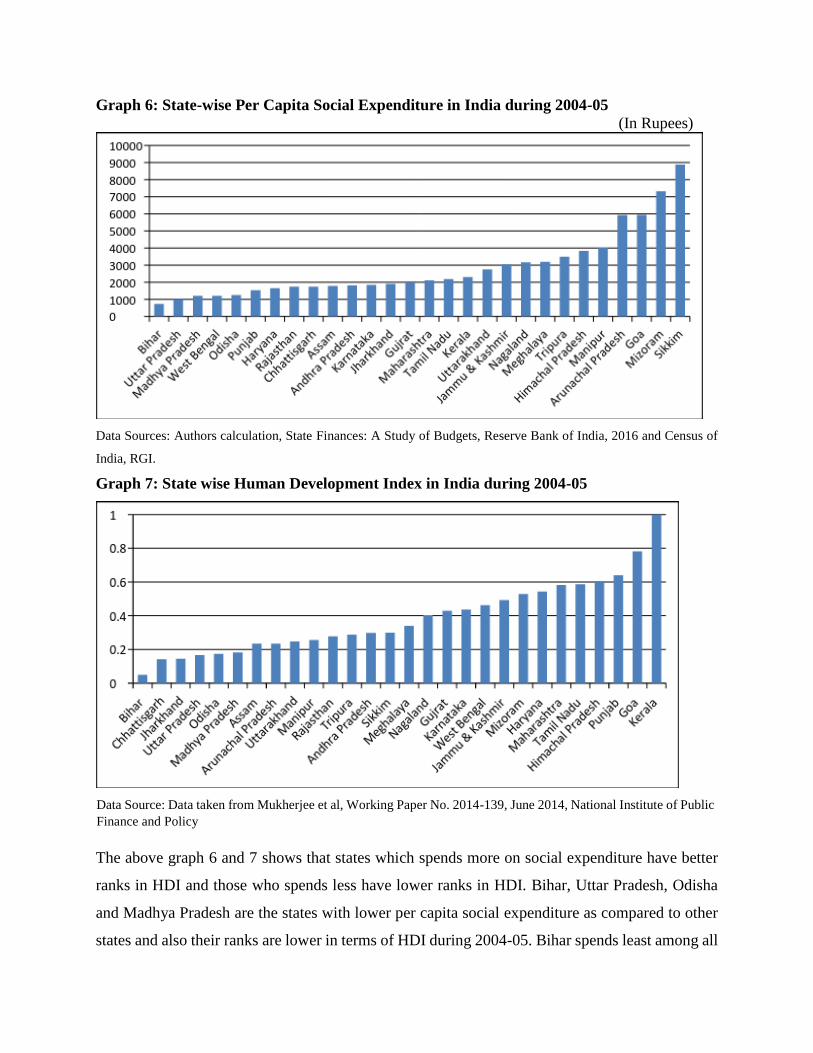
Graph 6: State-wise Per Capita Social Expenditure in India during 2004-05
(In Rupees)
Data Sources: Authors calculation, State Finances: A Study of Budgets, Reserve Bank of India, 2016 and Census of
India, RGI.
Graph 7: State wise Human Development Index in India during 2004-05
Data Source: Data taken from Mukherjee et al, Working Paper No. 2014-139, June 2014, National Institute of Public
Finance and Policy
The above graph 6 and 7 shows that states which spends more on social expenditure have better
ranks in HDI and those who spends less have lower ranks in HDI. Bihar, Uttar Pradesh, Odisha
and Madhya Pradesh are the states with lower per capita social expenditure as compared to other
states and also their ranks are lower in terms of HDI during 2004-05. Bihar spends least among all

the states and also has the least rank in HDI during 2004-05. Tamil Nadu, Kerala, Jammu &
Kashmir, Himachal Pradesh and Goa are the states with social spending on higher side with higher
ranks in HDI during 2004-05. The next section looks at the same indicators during 2011-12. Graph
8 and graph 9 shows state-wise per capita expenditure and state wise HDI during 2011-12
respectively. The following graphs 8 and 9 shows that Madhya Pradesh, Chhattisgarh, Bihar and
Uttar Pradesh are the states with comparatively lower per capita social expenditure and their ranks
in HDI are also comparatively low during 2011-12. When HDI of two periods 2004-05 and 2011-
12 are compared it indicates that Madhya Pradesh, Chhattisgarh, Bihar and Uttar Pradesh are the
states which are constantly at lower ranks in terms of HDI. Odisha and Jharkhand are the states
whose performance have improved over the years. They were at the bottom six states during 2004-
05 but their ranks have improved in 2011-12. Assam and Arunachal Pradesh are the states whose
ranks have deteriorated over the years. Assam’s rank has come down from 22nd in 2004-05 to
26th in 2011-12. Arunachal Pradesh’s rank has gone down to 27th in 2011-12 from 21st in 2004-
05. The better performing states with respect to HDI in both the periods 2004-05 and 2011-12 are
Kerala, Goa, Himachal Pradesh, Tamil Nadu, Maharashtra and Punjab.
Graph 8: State wise Per Capita Social Expenditure in India during 2011-12
Data Sources: Authors calculation, State Finances: A Study of Budgets, Reserve Bank of India, 2016 and Census of
India, RGI.

Graph 9: State-wise Human Development Index in India during 2011-12
Data Source: Data taken from Mukherjee et al, Working Paper No. 2014-139, June 2014, National Institute of Public
Finance and Policy
Table 5: Correlation Matrix
Correlatio
n PCSSE HDI
PCSSE 1 0.19
HDI 0.19 1 Data source: Author’s calculation
The above correlation matrix between HDI and per capita social expenditure (PCSSE) for states
shows that an increase in PCSSE will have a positive impact on HDI. Therefore, states are required
to increase their social sector expenditure to improve their performances in HDI.
The regression equation of HDI on PCSSE is
HDI = C1+ C2*PCSSE
The regression results show that the coefficient C2 is positive for both the periods 2004-05 (0.6)
and (0.9) 2011-12 indicating a positive relation between PCSSE and HDI.A higher PCSSE will
have better HDI and vice-a-versa.
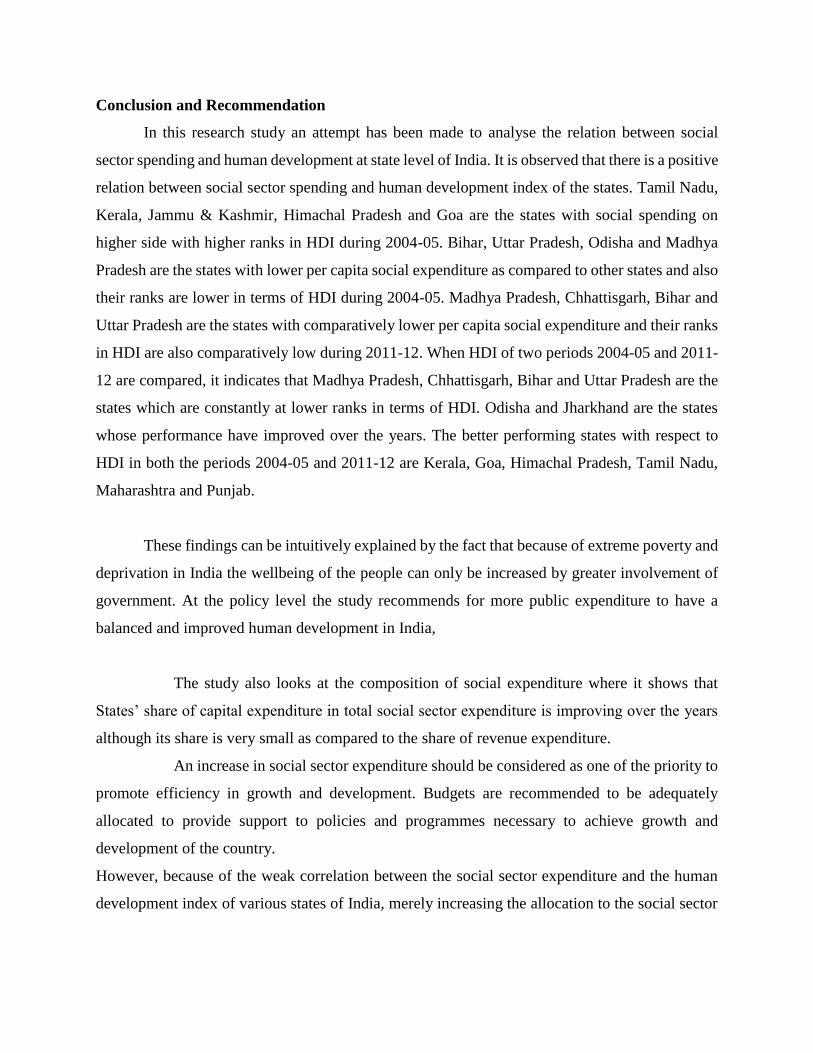
Conclusion and Recommendation
In this research study an attempt has been made to analyse the relation between social
sector spending and human development at state level of India. It is observed that there is a positive
relation between social sector spending and human development index of the states. Tamil Nadu,
Kerala, Jammu & Kashmir, Himachal Pradesh and Goa are the states with social spending on
higher side with higher ranks in HDI during 2004-05. Bihar, Uttar Pradesh, Odisha and Madhya
Pradesh are the states with lower per capita social expenditure as compared to other states and also
their ranks are lower in terms of HDI during 2004-05. Madhya Pradesh, Chhattisgarh, Bihar and
Uttar Pradesh are the states with comparatively lower per capita social expenditure and their ranks
in HDI are also comparatively low during 2011-12. When HDI of two periods 2004-05 and 2011-
12 are compared, it indicates that Madhya Pradesh, Chhattisgarh, Bihar and Uttar Pradesh are the
states which are constantly at lower ranks in terms of HDI. Odisha and Jharkhand are the states
whose performance have improved over the years. The better performing states with respect to
HDI in both the periods 2004-05 and 2011-12 are Kerala, Goa, Himachal Pradesh, Tamil Nadu,
Maharashtra and Punjab.
These findings can be intuitively explained by the fact that because of extreme poverty and
deprivation in India the wellbeing of the people can only be increased by greater involvement of
government. At the policy level the study recommends for more public expenditure to have a
balanced and improved human development in India,
The study also looks at the composition of social expenditure where it shows that
States’ share of capital expenditure in total social sector expenditure is improving over the years
although its share is very small as compared to the share of revenue expenditure.
An increase in social sector expenditure should be considered as one of the priority to
promote efficiency in growth and development. Budgets are recommended to be adequately
allocated to provide support to policies and programmes necessary to achieve growth and
development of the country.
However, because of the weak correlation between the social sector expenditure and the human
development index of various states of India, merely increasing the allocation to the social sector

will not prove to be very useful for progress of the society. How the money allocated is being spent
is also a very crucial aspect which needs to be considered.
A weak correlation also signifies that there are other important factors apart from expenditure
which are needed to be addressed, like the effectiveness of the schemes in education, health and
income, proper implementation of such schemes, if the target group is reaping the benefits, etc.
In addition, there is a scope of future study to see the impact of existing government schemes in
the sectors of education and health on Human Development Index.
References:
Chakroborty Pinaki (2009), “Intra- Regional Inequality and the Role of Public Policy: Lessons
Learnt from Kerala,” Economic and Political Weekly, Vol. 44, No. 26.
Guha, A. and D. Chakraborty (2003), “Relative Positions of Human Development Index Across
Indian States: Some Exploratory Results”, Artha Vision, Vol. 11, No. 4
Mundle, Sudipto (1998), “Financing Human Development: Some Lessons from Advanced Asian
Countries”, World Development, Vol. 26, No.4
Majumder, Rajarshi(2005) “Human Development in India: Regional Pattern and Policy Issues”
Indian Journal of Applied Economics, Vol. 2, No. 1
GoI (2001), “Census of India”, Ministry of Home Affairs, Office of the Registrar General and
Census Commissioner, India.
GoI (2011), “Census of India”, Ministry of Home Affairs, Office of the Registrar General and
Census Commissioner, India.
GoI(2015-16), “Central Statistics Office”, India, Ministry of Statistics and Programme
Implementation .
Mukherjee,S., D.Chakraborty and S.Sikdar (2014), “Three Decades of Human Development
across Indian States: Inclusive Growth or Perpetual Disparity?”, Working Paper No. 2014-139 ,
National Institute of Public Finance and Policy, New Delhi, June 2014
Reserve Bank of India (2016), “State Finances a Study of Budgets of 2015-16”.
Roy Hiranmoy and Kaushik Bhattacharjee (2009) “Convergence of Human Development across
Indian States: Quantitative Approaches to Public Policy” Fourth Annual International
Conference on “Public Policy and Management”, IIM,Banglore,9-12 August
Rao, Govinda M, Shand R T and Kalirajan, K P (1999) “A Convergence of Income Across
Indian States A Divergent Issue”, Economic and Political Weekly, Vol. 34, No. 13
S. Arora, (2001). “Health Human Productivity and Long-Term Economic Growth” Journal of
Economic History, Vol. 61, No. 3