Munich Personal RePEc Archive · PDF file3.8.1 Pakistan National Accreditation Council ......
136
Munich Personal RePEc Archive Situation Analysis to Support the Programme Design Process for National Skills Strategy of the Islamic Republic of Pakistan Yasin Janjua and Irfan Mohammad SEBCON (Pvt) Limited , Socio-economic and Business Consultants, Islamabad 2008 Online at http://mpra.ub.uni-muenchen.de/38153/ MPRA Paper No. 38153, posted 17. April 2012 18:45 UTC
-
Upload
truongnhan -
Category
Documents
-
view
243 -
download
12
Transcript of Munich Personal RePEc Archive · PDF file3.8.1 Pakistan National Accreditation Council ......
MPRAMunich Personal RePEc Archive
Situation Analysis to Support theProgramme Design Process for NationalSkills Strategy of the Islamic Republic ofPakistan
Yasin Janjua and Irfan Mohammad
SEBCON (Pvt) Limited , Socio-economic and Business Consultants,Islamabad
2008
Online at http://mpra.ub.uni-muenchen.de/38153/MPRA Paper No. 38153, posted 17. April 2012 18:45 UTC

Background Paper
Situation Analysis to Support the Programme Design Process for National Skills Strategy of the Islamic Republic of Pakistan
Yasin Janjua and Mohammad Irfan December 2008
Submitted to:
gtz Deutsche Gesellschaft für Technische Zusammenarbeit GmbH
Submitted by: SEBCON (Pvt) Limited Socio-economic and Business Consultants, Islamabad

Background Situation Analysis of Pakistan‘s TVET System
Janjua and Irfan (SEBCON PVT LTD) ii
TABLE OF CONTENTS
ACKNOWLEDGMENTS ................................................................................................................. xv
EXECUTIVE SUMMARY .............................................................................................................. xvi
I ............................................................................................................................................................ 1
PAKISTAN SOCIO ECONOMIC PROFILE ..................................................................................... 1
1. Introduction ...................................................................................................................................... 1
1.1 The purpose and organisation of the background paper ............................................................ 3
1.2. Overview of Pakistan‘s economy ............................................................................................. 4
1.2.1 Development Visions and Frameworks ............................................................................. 4
1.2.2 Macroeconomic Performance in recent years .................................................................... 5
1.2.3 Sector wise Growth Performance ....................................................................................... 7
1.2.4 Fiscal Discipline and Public Debt ...................................................................................... 7
1.2.5 Monetary Policy ................................................................................................................. 8
1.2.6 Investment and Savings Gap .............................................................................................. 9
1.2.7 Balance of Payments ........................................................................................................ 10
1.2.8 Challenges and Risks ....................................................................................................... 10
1.2.9 Performance in Provinces................................................................................................. 10
1.3. Population Challenge, Poverty and Social Sector Performance ............................................. 11
1.3.1 Population Challenge ....................................................................................................... 11
1.3.2 Poverty ............................................................................................................................. 11
1.3.2 Pro-Poverty Expenditure .................................................................................................. 12
1.3.3 Education Sector Performance ......................................................................................... 13
1.3.4 Expenditure on Health ...................................................................................................... 14
1.4. Labour Force and Employment Situation ............................................................................... 14
1.4.1 Key Trends in Pakistan‘s Labour Market ........................................................................ 15
1.4.2 Youth Labour Force ......................................................................................................... 20
1.4.3 Informality of the Labour Market .................................................................................... 20
1.4.4 Vulnerable Employment in Pakistan ................................................................................ 21
1.4.5 Labour Market Information System ................................................................................. 22
1.5 Profile of TVET Trained Work Force in Pakistan .................................................................. 22
1.5.1 Demand for TVET Labour in Pakistan ............................................................................ 23
1.5.2 Employment Status of TVET population ......................................................................... 24
1.5.3 Supply of Pakistani TVET Labour to Overseas Markets ................................................. 25
II ......................................................................................................................................................... 26
GENERAL EDUCATION AND TVET SYSTEM IN PAKISTAN ................................................. 26
2.1 General Education and TVET Policy in Pakistan ................................................................... 26
2.1.1 The 1958 Commission on National Education ................................................................ 28
2.1.2 Education Polices since 1970‘s ........................................................................................ 29
2.1.3. Phases in Pakistan‘s TVET Development ....................................................................... 29
2.2 General Education System and TVET..................................................................................... 31
2.3 Mapping of General and TVET System in Pakistan ............................................................... 33
2.4 TVET Institutions .................................................................................................................... 37
2.5 Enrolment in Pakistan‘s TVET System ................................................................................... 37
2.6 Current Situation in TVET: Equality, Access, Coverage ........................................................ 38
2.7 Capacity Utilization in Pakistan‘s TVET Institutions ............................................................. 39
2.8 Problems and Issues in Pakistan‘s TVET Institutions ............................................................. 39
2.8.1 Policy environment and Governance of TVET system .................................................... 39

Background Situation Analysis of Pakistan‘s TVET System
Janjua and Irfan (SEBCON PVT LTD) iii
2.8.2 Quality and Access in Pakistan‘s TVET institutions ....................................................... 40
2.8.3 Curricula and Syllabus Development ............................................................................... 40
2.8.4 Quality of Teaching Staff ................................................................................................. 41
2.8.5 Occupational Guidance, Job Search ................................................................................. 42
2.8.6 Management of TVET intuitions ..................................................................................... 42
2.8.7 Trade Testing and the System of Learning Assessment .................................................. 43
2.8.8 Outdated Technologies ..................................................................................................... 43
2.8.9 The Skill and Technology Gaps ....................................................................................... 44
2.8.10 Linkages with the Industry ............................................................................................. 44
2.8.11 Labour legislation ........................................................................................................... 44
2.8.12 Sustainability and Other Factors .................................................................................... 45
2.9 Findings from a perception survey .......................................................................................... 45
2.10 The Need for Reforming TVET System in Pakistan ............................................................. 47
2.11 Pakistan‘s Competitiveness in world economy and Role of TVET ...................................... 47
III........................................................................................................................................................ 48
THE STRUCTURE AND GOVERNANCE OF TVET SYSTEM ................................................... 48
3.1 Federal TVET Scene ............................................................................................................... 49
3.1.1 Ministry of Education....................................................................................................... 49
3.1.2 The NAVTEC .................................................................................................................. 49
3.1.3 The Capital Territory TVET Profile................................................................................. 52
3.2 Punjab TVET Profile ............................................................................................................... 52
3.2.1 The Punjab TEVTA Budget ............................................................................................. 56
3.3 NWFP TVET Profile ............................................................................................................... 57
3.3.1 NWFP TVET Budget ....................................................................................................... 60
3.4 Sindh TVET Profile ................................................................................................................. 61
3.4.1 Sindh TVET Budget ......................................................................................................... 65
3.5 Baluchistan TVET Profile ....................................................................................................... 66
3.6 Azad Jammu and Kashmir TVET Profile ................................................................................ 68
3.7 FATA TVET Profile ................................................................................................................ 71
3.7.1 Project Approval process for FATA ................................................................................ 71
3.7.2 Financing Mechanism for FATA Projects ....................................................................... 72
3.7.3 Skills Development in FATA ........................................................................................... 73
3.8 Key Supply Side Stakeholders in Pakistan‘s TVET System ................................................... 74
3.8.1 Pakistan National Accreditation Council ......................................................................... 74
3.8.2 National Institute of Science and Technical Education (NISTE) .................................... 74
3.8.3 Directorate of Workers Education.................................................................................... 75
3.8.4 Labour and Manpower Division of the Ministry of Labour, Manpower and Overseas
Pakistanis ................................................................................................................................... 75
3.8.5 Ministry of Youth Affairs ................................................................................................ 76
3.8.6 National Institute of Labour Administration and Training (NILAT) ............................... 76
3.8.7 National Training Bureau aka National Training Board .................................................. 77
3.8.8 Boards of Technical Education ........................................................................................ 77
3.8.9 Overseas Pakistanis Foundation (OPF) ............................................................................ 77
3.8.10 The Punjab Vocational Training Council (PVTC) ......................................................... 78
3.8.11 Technology Up-gradation and Skills Development Company (TUSDEC) ................... 78
IV ....................................................................................................................................................... 79
SKILLS FORMATION IN AND OUTSIDE THE FORMAL SYSTEM ......................................... 79
4.1 Pathways to Skills Acquisition and the Labour Market .......................................................... 79

Background Situation Analysis of Pakistan‘s TVET System
Janjua and Irfan (SEBCON PVT LTD) iv
4.1.1 Formal Skill Formation .................................................................................................... 79
4.1.2 Non-Formal TVET ........................................................................................................... 83
4.1.3 Informal learning .............................................................................................................. 83
4.2 Training Schemes .................................................................................................................... 85
4.2.1 Trainings in Public Sector Organizations......................................................................... 85
4.2.2 Training Programmes in the Private Corporate Sector .................................................... 86
4.2.3 The Apprenticeship Programme....................................................................................... 86
V ......................................................................................................................................................... 88
FINANCING OF THE TVET SYSTEM ........................................................................................... 88
5.1 Unit Costs in the Public Sector ................................................................................................ 88
5.2 Unit Costs in the Private Sector ............................................................................................... 91
5.3 The Education and TVET Sector Budgets at a Glance ........................................................... 92
VI ....................................................................................................................................................... 93
TVET PROGRAMS AND INITIATIVES ........................................................................................ 93
6.1 Major TVET Programmes ....................................................................................................... 93
6.2 Past and Present Donor Cooperation on TVET in Pakistan .................................................... 93
6.3 Prime Minister‘s Skill Development Initiative (PMSI) ........................................................... 96
VII ...................................................................................................................................................... 97
CONCLUSION .................................................................................................................................. 97
ANNEXURE...................................................................................................................................... 98
BIBLIOGRAPHY ............................................................................................................................ 108
Background Situation Analysis of Pakistan‘s TVET System
Janjua and Irfan (SEBCON PVT LTD) v
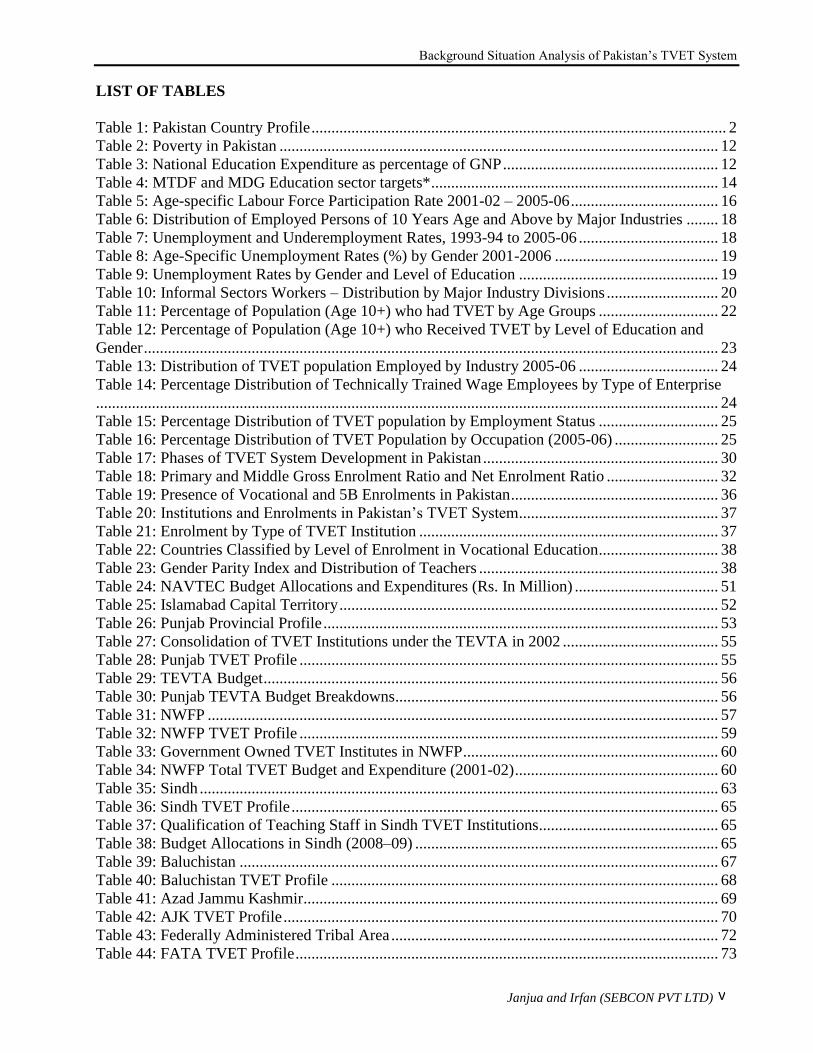
LIST OF TABLES
Table 1: Pakistan Country Profile ........................................................................................................ 2
Table 2: Poverty in Pakistan .............................................................................................................. 12
Table 3: National Education Expenditure as percentage of GNP ...................................................... 12
Table 4: MTDF and MDG Education sector targets* ........................................................................ 14
Table 5: Age-specific Labour Force Participation Rate 2001-02 – 2005-06 ..................................... 16
Table 6: Distribution of Employed Persons of 10 Years Age and Above by Major Industries ........ 18
Table 7: Unemployment and Underemployment Rates, 1993-94 to 2005-06 ................................... 18
Table 8: Age-Specific Unemployment Rates (%) by Gender 2001-2006 ......................................... 19
Table 9: Unemployment Rates by Gender and Level of Education .................................................. 19
Table 10: Informal Sectors Workers – Distribution by Major Industry Divisions ............................ 20
Table 11: Percentage of Population (Age 10+) who had TVET by Age Groups .............................. 22
Table 12: Percentage of Population (Age 10+) who Received TVET by Level of Education and
Gender ................................................................................................................................................ 23
Table 13: Distribution of TVET population Employed by Industry 2005-06 ................................... 24
Table 14: Percentage Distribution of Technically Trained Wage Employees by Type of Enterprise
............................................................................................................................................................ 24
Table 15: Percentage Distribution of TVET population by Employment Status .............................. 25
Table 16: Percentage Distribution of TVET Population by Occupation (2005-06) .......................... 25
Table 17: Phases of TVET System Development in Pakistan ........................................................... 30
Table 18: Primary and Middle Gross Enrolment Ratio and Net Enrolment Ratio ............................ 32
Table 19: Presence of Vocational and 5B Enrolments in Pakistan .................................................... 36
Table 20: Institutions and Enrolments in Pakistan‘s TVET System.................................................. 37
Table 21: Enrolment by Type of TVET Institution ........................................................................... 37
Table 22: Countries Classified by Level of Enrolment in Vocational Education .............................. 38
Table 23: Gender Parity Index and Distribution of Teachers ............................................................ 38
Table 24: NAVTEC Budget Allocations and Expenditures (Rs. In Million) .................................... 51
Table 25: Islamabad Capital Territory ............................................................................................... 52
Table 26: Punjab Provincial Profile ................................................................................................... 53
Table 27: Consolidation of TVET Institutions under the TEVTA in 2002 ....................................... 55
Table 28: Punjab TVET Profile ......................................................................................................... 55
Table 29: TEVTA Budget .................................................................................................................. 56
Table 30: Punjab TEVTA Budget Breakdowns................................................................................. 56
Table 31: NWFP ................................................................................................................................ 57
Table 32: NWFP TVET Profile ......................................................................................................... 59
Table 33: Government Owned TVET Institutes in NWFP ................................................................ 60
Table 34: NWFP Total TVET Budget and Expenditure (2001-02) ................................................... 60
Table 35: Sindh .................................................................................................................................. 63
Table 36: Sindh TVET Profile ........................................................................................................... 65
Table 37: Qualification of Teaching Staff in Sindh TVET Institutions............................................. 65
Table 38: Budget Allocations in Sindh (2008–09) ............................................................................ 65
Table 39: Baluchistan ........................................................................................................................ 67
Table 40: Baluchistan TVET Profile ................................................................................................. 68
Table 41: Azad Jammu Kashmir ........................................................................................................ 69
Table 42: AJK TVET Profile ............................................................................................................. 70
Table 43: Federally Administered Tribal Area .................................................................................. 72
Table 44: FATA TVET Profile .......................................................................................................... 73

Background Situation Analysis of Pakistan‘s TVET System
Janjua and Irfan (SEBCON PVT LTD) vi
Table 45: Training Institutes under NTB in Public Sector ................................................................ 77
Table 46: An overview of different conceptions as applied to education and learning ..................... 80
Table 47: Unit costs in Colleges of Technology and Government Polytechnic Institutes Year 1987-
88........................................................................................................................................................ 88
Table 48: Distribution of Budgets in Four Polytechnics ................................................................... 89
Table 49: Unit Cost of Courses Reported by TEVTA ...................................................................... 90
Table 50: Allocations for training Materials of Technical Education and Vocational Training
Institutions in NWFP in 2001-02 ....................................................................................................... 91
Table 51: Recurrent Budget Allocations for Sindh 2002 (in Rupees) ............................................... 91
Table 52: Total Education and TVET Allocation Vs Spending in Five Year Plans.......................... 92
LIST OF FIGURES
Figure 1: Population Pyramid in Pakistan by 2030 ............................................................................. 5
Figure 2: GDP Growth Rate and Inflation ........................................................................................... 6
Figure 3: Sector Performance (Growth Rates)..................................................................................... 7
Figure 4: Fiscal Policy in Pakistan....................................................................................................... 8
Figure 5: Stock of Net Budgetary Borrowings from SBP ................................................................... 9
Figure 6: Current Account Balance (Jul 2007-Apr 2008) ................................................................. 10
Figure 7: Pro Poor Expenditures ........................................................................................................ 13
Figure 8: Vulnerable Employment in Pakistan .................................................................................. 21
Figure 9: Mapping of General and Technical Education System in Pakistan ................................... 34
Figure 10: Structure of Formal Educational (General and TVET) System in Pakistan ..................... 35
Figure 11: Workforce Structure Models ............................................................................................ 47
Figure 12: The Governance Structure of Federal and Provincial TVET system ............................... 48
Figure 13: Change in Project Approval Process after the Establishment of NAVTEC ..................... 50
Figure 14: NAVTEC Development Vs Non Development Allocations ............................................ 51
Figure 15: Punjab TEVTA and its Affiliates ..................................................................................... 54
Figure 16: Percentage Allocation of Budget (2007-08) ..................................................................... 56
Figure 17: OLD SETUP IN NWFP ................................................................................................... 58
Figure 18: New TEVTA Setup in Making ......................................................................................... 59
Figure 19: Percentage Allocation of Budget in NWFP (2001-02) .................................................... 60
Figure 20: Sindh TVETA in Making ................................................................................................. 64
Figure 21: Percentage Allocation of Funds in Sindh (2008-09) ........................................................ 66
Figure 22: AJK TEVTA Organizational Structure ............................................................................ 70
Figure 23: Formal and Informal Pathways to Skill Acquisition and Job Market .............................. 81
Figure 24: Informal Pathways for Skills Acquisition ........................................................................ 84
Figure 25: Distribution of Budgets in Polytechnics ........................................................................... 90
LIST OF ANNEXES
Annex 1: Labour Market Indicators ................................................................................................... 98
Annex 2: Percentage distribution by Gender of those who ever received TVET by Gender 2005/06
............................................................................................................................................................ 99
Annex 3: Percentage Distribution of Pakistani Labour Force Supplied to Overseas Markets .......... 99
Annex 4: Supply of Pakistani Labour to Oversees Markets ............................................................ 101
Annex 5: Definitions of programme orientations according to ISCED and the UIS ....................... 102
Annex 6: The System of Education and Training in Pakistan ......................................................... 103

Background Situation Analysis of Pakistan‘s TVET System
Janjua and Irfan (SEBCON PVT LTD) vii
Annex 7: Difference between Technical and General Education .................................................... 103
Annex 8: District Wise Enrolments in Punjab TEVTA institutes ................................................... 105
Annex 9: Formal and Informal Learning ......................................................................................... 106
Annex 10: Snap Shot of Federal Budget Allocations for Education ............................................... 107
Annex 11: The Education Budget from 2001-02 to 2005-06 .......................................................... 107
LIST OF MAPS
Map 1: Pakistan................................................................................................................................. xiii
Map 2: Pakistan................................................................................................................................. xiv

Background Situation Analysis of Pakistan‘s TVET System
Janjua and Irfan (SEBCON PVT LTD) viii
CURRENCY EXCHANGE RATES
Source: State Bank of Pakistan
ACRONYMS AND LIST OF ABBREVIATIONS
ABAD Agency for Barani Area Development
ADB Asian Development Bank
ADP Annual Development Plan
ADSC Agency Development Subcommittee
AEPM Academy of Educational Planning and Management
AJK Azad Jammu and Kashmir
APLAC Asia Pacific Laboratory Accreditation Cooperation
ARTEP Asian Regional Team for Employment Promotion
ATC Apprenticeship Training College
AusAID Australian Aid for International Development
BA Bachelors of Arts
BBSYDP Benazir Bhutto Shaheed Youth Development Program
BC British Council
B-Com Bachelor of Commerce
BISE Board of Intermediate and Secondary Education
BoM Boards of Management
BSc Bachelors of Science
BTE Board of Technical Education
B-Tech Bachelor of Technology
B-TEVTA Baluchistan Technical Education and Vocational Training Authority
CAD Current Account Deficit
CBR Crude Birth Rate
CBT Competency Based Training
C-Com Certificate of Commerce
CDR Crude Death Rate
CDWP Central Development Working Party
CIDA Canadian International Development Agency
CLF Civilian Labour Force
CMI Census of Manufacturing Industries
CMTI Construction Machinery Training Institute
CMTI Construction Machinery Training Institute
(As of 13 December 2008)
Currency Unit – Pakistan rupees (Rs)
Re1.00 = US$0.013
Re 1.00 = GBP0.0085
Re 1.00 = Eur0.0095
$1.00 = Rs78.72
£1.00 = Rs117.99
1.00 = Rs105.34
In this report ―$‖ refers to US dollars
Background Situation Analysis of Pakistan‘s TVET System
Janjua and Irfan (SEBCON PVT LTD) ix
CPI Consumer Price Index
CSF Competitiveness Support Fund
CTC Commercial Training Centre
CTI Commercial Training Institute
CTTI Construction Technology Training Institute
DAE Diploma of Associate Engineering
DCO District Coordination Officer
D-Com Diploma of Commerce
DFID (UK) Department for International Development
DITE Department of Industries and Technical Education
DMPT Department of Manpower and Training
DTE Department of Technical Education
DTEMT Directorate of Technical Education and Manpower Training
DTT Directorate General of Technical Training
DWE Directorate of Workers Education
EC European Commission
EFA Education for All
EFP Employers‘ Federation of Pakistan
ESRA Education Sector Reform Assistance
EU European Union
FANA Federally Administered Northern Areas
FATA Federally Administered Tribal Areas
FBS Federal Bureau of Statistics
FCR Frontier Crimes Regulation
FDA FATA Development Authority
FES Fredrich Eburt Stiftung
FFD FATA Finance Department
FRDLA Fiscal Responsibility and Debt Limitation Act
FSc Faculty of Science
GCT Government College of Technology
GDI Gender Development Index
GDP Gross Domestic Product
GER Gross Enrolment Ratio
GGI Gender Gap Index
GNP Gross National Product
GoP Government of Pakistan
GPI Gender Parity Index
GPI Government Polytechnic Institute
GPIW Government Polytechnic Institute for Women
GTZ German Agency for Technical Cooperation
GVI Government Vocational Institutes
HDI Human Development Index
HIES Household Integrated Economic Survey
HRD Human Resource Development
IAF International Accreditation Forum
I-Com Intermediate of Commerce
ICT Information and Communication Technologies
ILAC International Laboratory Accreditation Cooperation
Background Situation Analysis of Pakistan‘s TVET System
Janjua and Irfan (SEBCON PVT LTD) x
ILO International Labour Organization
IMCs Institutional Management Committees
IMF International Monetary Fund
IMS Information Management System
IPSET Institute for the Promotion of Science Education and Training
IS Investment-Saving
ISCED International Standard Classification of Education
IT Information Technology
ITC Industrial Training Centre
JICA Japan International Cooperation Agency
KILM Key Indicators of Labour Market
KLM I Key Labour Market Indicators
KSE Karachi Stock Exchange
LFP Labour Force Participation Rate
LFS Labour Force Survey
LHV Lady Health Visitors
LMIA Labour Market Information and Analysis
LPR Labour Force Participation Rate
M. Phil Master of Philosophy
M-Com Masters of Commerce
MDG Millennium Development Goals
MIIM
MLMOP Ministry of Labour, Manpower and Overseas Pakistani
MoE Ministry of Education
MoL Ministry of Labour, Manpower and Overseas Pakistanis
MTDF Medium Term Development Framework
M-Tech Master of Technology
NATO Northern Atlantic Treaty Organization
NAVTEC National Vocational and Technical Education Commission
NCE National Census of Education
NEC National Education Commission
NEP National Education Policy
NER Net Enrolment Rate
NGO Non‐Governmental Organisation
NHA National Highway Authority
NILAT National Institute of Labour Administration and Training
NISTE National Institute of Science and Technical Education
NPER Net Primary Enrolment Ratio
NPO National Productivity Organisation
NQF National Qualifications Framework
NQP & IP National Quality Policy and Implementation Plan
NSS National Skills Strategy
NSTI National Staff Training Institute
NTB National Training Bureau
NTTC National Teachers Training College
NVTP National Vocational Training Programme
NWFP North Western Frontier Province
OECD Organization of Economic Cooperation and Development

Background Situation Analysis of Pakistan‘s TVET System
Janjua and Irfan (SEBCON PVT LTD) xi
OJT On-the-Job Training
OPF Overseas Pakistanis Foundation
PAC Pacific Accreditation Cooperation
PC Planning Commission
PCSIR Pakistan Council of Scientific and Industrial Research
PES Pakistan Education Statistics
PhD Doctor of Philosophy
PIA Pakistan International Airlines
PMSI Prime Minister Skills Development Initiative
PNAC Pakistan National Accreditation Council
PPAF Pakistan poverty Alleviation Fund
PPP Public Private Partnership
PPP Pakistan Peoples Party
PSDP Public Sector Development Program
PSIC Punjab Small Industries Corporation
PSLM Pakistan Social and Living Measurement
PTA Parent Teachers Associations
PTB Provincial Training Boards
PVTC Punjab Vocational Training Council
PVTC Punjab Vocational Training Council
RPL Recognition of Prior Learning
Rs Rupees
SBP State Bank of Pakistan
SDC Skill Development Council
SDP Sustainable Development Plan
SME Small and Medium Enterprises
SMEDA Small and Medium Enterprise Development Agency
STR Student Teacher Ratio
SUF Student Union Fund
TE Technical Education
TEC Technical Education Council
TEVTA Technical Education and Vocational Training Authority
TFR Total Fertility Rate
TGR Tax-to-GDP Ratio
TLR Teaching Learning Resource
TNA Training Needs Assessment
ToT Training of Trainers
TREE Rural Economic Empowerment
TSC Technical School Certificate
TTB Trade Testing Board
TTC Technical Training Centre
TUSDEC Technology Upgrading and Skills Development Company
TVE Technical Vocational Education
TVET Technical & Vocational Education & Training
TVT Technical and Vocational Training
TVTC Technical and Vocational Training Commission
UK United Kingdom of Great Britain and Northern Ireland
UN United Nations

Background Situation Analysis of Pakistan‘s TVET System
Janjua and Irfan (SEBCON PVT LTD) xii
UNDP United Nations Development Programme
UNESCO United Nations Educational, Scientific and Cultural Organisation
UNEVOC International Centre for Technical and Vocational Education and Training
UNHCR United Nations High Commissioner for Refugees
USAID United States Agency for International Development
USD United States Dollar
VET Vocational Education and Training
VTC Vocational Training Centre
VTE Vocational and Technical Education
VTI Vocational Training Institute
VTP Vocational Training Programmes
WAPDA Water and Power Development Authority
WB World Bank
WTC Women Training Centre
YES Youth Engagement Services
YVC Youth Vocational Training

Background Situation Analysis of Pakistan‘s TVET System
Janjua and Irfan (SEBCON PVT LTD) xiii
Map 1: Pakistan
Source: http://www.lib.utexas.edu/maps/middle_east_and_asia/pakistan_pol_2002.jpg

Background Situation Analysis of Pakistan‘s TVET System
Janjua and Irfan (SEBCON PVT LTD) xiv
Map 2: Pakistan
Source: http://www.lib.utexas.edu/maps/middle_east_and_asia/pakistan_ind_1973.jpg
The Map gives a quick idea about the geographic location and type of Pakistan‘s industry.
However, it is outdated and does not show big industrial districts of Sialkot, Gujrat, and Peshawar.

Background Situation Analysis of Pakistan‘s TVET System
Janjua and Irfan (SEBCON PVT LTD) xv
ACKNOWLEDGMENTS
The research team was led by Yasin Janjua1 and included Kamran Sadiq, Dr. Mohammad Irfan,
Shehryar Janjua, Shahzad Anwar, Arif Naveed, Shmyalla Jawad, Wajeeha Bajwa, Nazam Maqbool,
Arif Naveed, Mohammad Younas, Naeem Gul, and Shafi Gul.
We gratefully acknowledge the guidance received from Elisabeth Baehr, Robert Palmer, Jutta
Franz, Ute Hoffman, and Michael Gericke for comments which helped to improve upon the earlier
version of the paper and to GTZ for financial support. Robert Palmer also helped in editing the final
version of the paper.
The report draws on a variety of data sources and earlier studies. It also draws heavily on four
working papers written by Janjua and his team. ―A Study of the Informal Economy and Informal
Skills Acquisition in Pakistan‖ by Yasin Janjua and Shehryar Janjua; ―International Support to
TVET in Pakistan: Past and Present‖ by Yasin Janjua, Shmyalla Jawad, Wajeeha Bajwa, and
Nazam Maqbool; ―NAVTEC‘s Current and Projected Activities and Capacity to Institutionalize and
Implement Reforms‖ by Yasin Janjua and Arif Naveed; and ―Costing and Financing of TVET in
Pakistan‖ by Kamran Sadiq and his team at SEBCON (Pvt) Ltd.
Up to date information on TVET System is not readily available and data sources have gaps and
inconsistencies in Pakistan therefore, some shortcomings are expected.
1 The author is a development consultant and can be contacted at [email protected]. The section on labour force
challenge is contributed by Dr. Irfan.

Background Situation Analysis of Pakistan‘s TVET System Executive Summary
Janjua and Irfan (SEBCON PVT LTD) xvi
EXECUTIVE SUMMARY
1. Pakistan is strategically located in the South Asia and is a frontline state in war on terror.
The country made remarkable progress since 2004 in terms of GDP growth (averaged above 6%)
and poverty reduction. The fiscal year 2007-08 has proved to be a difficult one as most of the
economic activity regressed in the aftermath of judicial crisis, the assassination of the former Prime
Minister Benazir Bhutto, and the international financial crisis. Stabilizing the economy is an uphill
task in the backdrop of political instability, a stagnant economy, slowing down production,
inflation, and a global financial crisis which is not only affecting the export oriented firms the most
but the export of manpower as well. On the other hand increasing militancy in the NWFP and
terrorism is a major threat to peace, stability, and economic performance in the region.
2. Pakistan‘s population is growing fast and is experiencing a demographic transition marked
by a rapid transformation in the age structure of its population. The proportion of people in the
younger age group (15-24) is likely to increase tremendously. At present (in 2007-08), almost 46
million people are estimated to be concentrated in the age range 15-24 years out of total
population160.9 million. The Labour Force Participation (LFP) rate (44.2%) is relatively low
compared to other developing countries. The cost of doing business is relatively high in Pakistan;
therefore, the government is making efforts to rationalize labour laws and other hindrances in this
regard. Another reason for low LFP rate is lack of Technical and Vocational Education and
Training (TVET) opportunities for majority of the population. Sweeping reforms in Pakistan‘s
TVET system are necessary to align it with growing demand for workforce in a knowledge based
economy as well as in response to competitiveness in global markets. It is imperative for Pakistan to
train its manpower in order to increase productivity, adopt and sustain technological change and
innovation, and to promote complementarity between skills and capital. Keeping in mind the
challenges ahead the government has vowed to train one million people through TVET system by
year 2010. A national body, National Vocational Technical Education Commission (NAVTEC) for
reforming TVET has been formed in late 2005. Similar setups are in making at provincial level.
Among provinces and other federal territories the Punjab has taken a lead by forming Technical
Education and Vocational Training Authority (TEVTA) in 1999 (even before NAVTEC was
formed). There is not much progress on TVET in Federally Administered Tribal Area (FATA) and
the Federally Administered National Area (FANA). The Azad Jammu and Kashmir TVET
infrastructure had been destroyed in the earthquake of 2005 and is being rebuilt with donor help.
3. This study aims at providing situation analysis of Pakistan‘s economy; labour and
demography, education; and present situation in the TVET system and employment sectors. This
paper also provides information about knowledge gaps and makes recommendations for further
analysis and studies. It also acts as a Stimulus for discussion with development partners on how best
to support the implementation of the National Skills Strategy for Pakistan. The paper covers issues
related to governance and provision of TVET, labour market context, state of education and
information on access, equality and quality. In the context of Pakistan, consolidated, accurate, and
up-to-date information on TVET is not easily available. The information for this paper has been
collected from a numerous sources; however, significant gaps may remain which highlight the need
for further data collection and research on Pakistan‘s TVET system.
4. Over the last five years Pakistan‘s GDP growth performance, above 6% on average, has
been considered extraordinary but now the economy is preparing for a soft belly landing. The latest

Background Situation Analysis of Pakistan‘s TVET System Executive Summary
Janjua and Irfan (SEBCON PVT LTD) xvii
SBP annual report on the state of the economy, released in December 2008, forecasts GDP growth
at 3.5%, which is signalling that the economy is heading towards a recession. The over all inflation
stayed around 8.0-9.0% until December 2007. However, since January 2008 the consumer prices
continued to rise and for the last 6 months registered, on average, a higher than 20% increase. If
growth in inflation remains unchecked, it will have a drastic impact on the incomes of the poor. In
recent years, poverty did decline in Pakistan; however, it is feared that earlier gains in poverty
reduction may be lost due to higher than 25% inflation which has prevailed since April 2008.
5. Pakistan‘s economy is more or less semi-agrarian in nature. Produce of agro-based
industries, cotton textiles and related products dominate its exports. Industrial performance depends
on good harvest of cotton and other cash crops. For almost the last four years, since 2005, both
agricultural and industrial growth rates have been declining. While the services sector has continued
to grow and contributes almost 50% to GDP, the declining overall economic growth rate suggests
that the services sector does not provide a strong base to sustain the overall economic growth rate.
The agriculture sector contributes less than 23% towards GDP; however, it absorbs more than 40%
the labour force.
6. The latest annual report 2008 on the state of the economy by SBP reports that the fiscal
deficit has risen out of proportion to 7.5% of GDP against a target of 4.2% of GDP for FY2007-08.
The government monetized 85% of deficit and borrowed record sums of money from the central
bank which is the most inflationary source of financing. A low TGR is seemingly responsible for
increases in the size of the fiscal and the current account deficit and has undermined the GoP‘s
efforts to keep the revenue deficit close to zero. Currently, the tax-to-GDP ratio (TGR) is
approximately close to 10%. The government continued to borrow excessively from the State Bank
of Pakistan and touched a record of Rs. 688 billion in FY 2007-08. This has revealed the
vulnerability of the fiscal framework in Pakistan which has rendered the implementation of
monetary policy increasingly challenging for the State Bank of Pakistan (SBP). A smaller TGR may
also limit the government‘s ability to generate the pro-poor fiscal space that is necessary to continue
its poverty reduction programme. One of the key challenges for policy makers is domestic resource
mobilization. The domestic savings have continued to register a declining trend as a percentage of
GDP. According to provisional estimates, it is as low as 11.7% in 2007-08. The long-term economic
growth is unsustainable without bridging domestic investment-savings gap. The external balance of
payment is continually deteriorating and poses a major challenge for country‘s policy makers.
7. Pakistan‘s population has been growing fast. The annual population growth rate has been
around 3% during 1970-90, which is now claimed to have declined to 1.9% (LFS 2005-06). At this
rate the population is expected to double its size in 2045, hence further straining the resources,
infrastructure and compounding the problems like poverty, and unemployment. The social sector
expenditures are the lowest in South Asia. In recent years, the government has increased spending
on education and health, yet this remains low as a percentage of GDP. As noted earlier, the
expenditure on education is hardly 2% of GDP. The Government has pledged to gradually increase
public expenditure on education up to 3% of GDP. Most of the public expenditure is devoted to
basic education as well as higher education in Pakistan. Very little amount is allocated for the
promotion of TVET. The existing Net Primary Enrolment Ratio (NPER) and primary school
completion rate shows that almost 48% children do not participate in primary school education. Out
of 52% who are enrolled in primary school, only 72% are able to complete 5 grades which
subsequently means more than 50% children of school going age are either denied education
(especially females) or unable to complete primary grades due to unfavourable circumstances. It

Background Situation Analysis of Pakistan‘s TVET System Executive Summary
Janjua and Irfan (SEBCON PVT LTD) xviii
may be noted that the health sector is not receiving its due share either. Pakistan is already lagging
behind other South Asian notions when it comes to four key health indices included in MDGs.
8. The informal sector is the largest sector of the economy not only in terms of absorbing the
majority of labour force but also in terms of providing skills training to majority of the illiterate
especially in the absence of any formal skills training opportunities. According to the Labour Force
Survey 2006-07, the informal sector employs 72% of all workers outside agriculture while entire
agriculture activity is also characterised as informal due to absence of organized corporate farming;
therefore, agriculture sector is excluded from LFS. The labour force participation rate has also
increased from 30.4% in 2003-04 to 31.8% in 2006-07. The youth forms a major proportion of the
population. The Youth unemployment rate almost doubles the adult unemployment rate. If the
economy fails to provide jobs for its youth it will give rise to serious social and moral problems.
Given the changing nature of world economy Pakistan must invest in human resource development
and enable its younger population to find reasonable employment in the new knowledge based
economies for which acquisition of relevant skills is imperative.
9. The sectoral (industrial) employment composition underwent a change with the
transformation of the economy. The industrial employment structure for males differs substantially
from that for females. Almost two-thirds of the latter are engaged in agriculture compared with 38%
of males in rural areas. In general, however, there is concentration of females in agriculture in rural
areas and services in urban areas. The unemployment rate has been on the rise. It was 5.9% in 1997-
98 rising to 8.3% in 2001-02, experiencing a modest decline to 7.8% in 2003/04 with further decline
to 6.3 in 2005-06. The ILO Key Indicators in Labour Market (KILM) information system considers
the sum of contributing family workers and own-account workers as vulnerable because they are
less likely to have formal work arrangements. A large proportion of workers in vulnerable
employment is indicative of a large subsistence-oriented agricultural sector, a lack of growth and
subsequent job opportunities in formal economy, wide spread poverty, and increasing
informalisation of the economy. Lack of market relevant skills acquisition could be one of the
important factors behind the large size of vulnerable employment.
10. According to LFS, only 0.87% of the population (age group 10 years and above) have ever
completed any technical and vocational training. A relatively higher proportion of males in contrast
to females have reported technical and vocational training; 1.32% males in contrast to female
0.41%. Out of those technically and vocationally trained almost 80% joined labour force (male
participation being 89% while female corresponding percentage is 48.8%). The service sector is the
largest employer of technically trained population. Services combined with wholesale & retail trade
and transport and storage employs 63.67% of the TVET Population in Pakistan. Moreover, the
services sector is the largest employer of TVET female population; it employs 60.22% of the female
TVET population. The non-relevance of informally obtained skills in new knowledge economy is
another concern regarding mismatch of skills with the market demand.
11. TVET has been on policy and development planning agenda of the government of Pakistan
ever since country‘s birth in 1947. Significant and visible expansion has occurred in Pakistan‘s
TVET landscape during 1970s and 1990s with the help of major donors like the World Bank, the
Asian Development Bank, JICA, UNESCO, and ILO. In 2005, the Medium Term Development
Framework (MTDF) 2005-10 set up an annual training target of 950,000 students in TVET
institutions of which 700,000 are expected to attend courses in the public sector while 250,000 are
expected to be in the private sector training institutions. In this respect the NAVTEC has developed
Background Situation Analysis of Pakistan‘s TVET System Executive Summary
Janjua and Irfan (SEBCON PVT LTD) xix
a vision for the National Skills Strategy (NSS) also known as ―Skilling Pakistan‖ The NSS vision
document proposes to reform Pakistan‘s TVET system in order to provide the demand driven
(market relevant) skills.
12. Pakistan‘s education system did not change much since independence. The education system
can be divided into two streams; the general and technical and vocational education stream (This is
defined by the Ministry of Education in education policy documents). The general education stream
covers professional education as well. The TVET system in Pakistan is divided into technical
education and vocational training aimed at preparing trainees for middle level technicians and lower
level work force, respectively. General education is provided in schools, colleges, universities and
professional colleges while technical and vocational education and training is provided in
institutions which are specifically setup for this purpose. The majority of the technical labour is
trained and supplied by technical institutes in the public sector; however, the private sector also
plays an important role. The vocational training programmes are administered by federal and
provincial agencies, NGOs and the private sector. However, now all training programs are being
consolidated under the provincial TEVTAs. Many large scale public sector organisations like
Pakistan Steel, Heavy Mechanical Complex and Private Multinationals meet their needs by
designing their own formal training programmes. Similar programmes are also administered by
various autonomous bodies and agencies.
13. National Census of Education (NCE) 2005-06 reports 3,059, registered and non-registered,
TVET institutions in Pakistan of which 916 are in public sector while 2143 are in the private sector.
The presence of a large number of private TVET providers emphasizes the role of private sector in
TVET provision in Pakistan. Total enrolment in all institutions is reported as being 238,687, of
which the majority is enrolled in vocational institutions. Almost 74% students in Pakistan‘s TVET
system are enrolled in vocational institutions while 23% are enrolled in polytechnic and only 2.4%
in monotechnics (The monotechnic institutes teach course in one discipline only, e.g. civil,
mechanical, or electrical). The student teacher ratio (STR) ranges from 14-18.4 which is close to
international norms for similar programmes. The proportion of female enrolment in TVET
increased from 23% to 38% from 2001 to 2005, respectively. There are proportionately more girls
enrolled in rural areas (43%) as compared to urban areas (36%).
14. The marginalized areas have particularly low proportions of girls enrolled not only in
primary and secondary education but TVET as well. Pakistan‘s TVET system is underutilized, has
high drop out rates, and the output is much less than the intake capacity and enrolment. Recently,
the National Productivity Organization (NPO) has also completed a capacity utilization study of the
Pakistan‘s TVET facilities in the public sector according to which the capacity utilization in TVET
institutions is far below expectations. For instance capacity utilization of polytechnic institutes is
around 65% in Punjab, 52% in Sindh, and approximately 68% in NWFP. Over the years Pakistan‘s
TVET system has been plagued with problems that range from outdated technologies, outmoded
curricula, and governance, etc. Less than 1% of the total students of relevant age group (0.6% in
fact) are enrolled in TVET institutions. The enrolment in TVET system is the lowest compared to
emerging economies of the region. This led King (2007) to assert that Pakistan has fallen behind the
regional and international competitors in the production of highly skilled and mobile labour.
15. It has been noted earlier that despite growth in the number of TVET institutions the TVET
system is highly fragmented and there are governance issues as well. The teaching staff lacks
quality and do not have practical experience. There are no industry apprenticeship training

Background Situation Analysis of Pakistan‘s TVET System Executive Summary
Janjua and Irfan (SEBCON PVT LTD) xx
opportunities for teaching staff to bridge the gap between academic teaching and skill utilization.
Majority of the staff of the TVET institutions are also graduates of problem infested TVET
institutes which reinforces the vicious circle of poor training and subsequent teaching. The students
do not have access to internship opportunities in a credit based system. The training certification
and accreditation standards are not aligned with international standards. This may create setbacks in
manpower exports as Pakistan is a big supplier of manpower to other countries especially in Middle
East which is adopting technology at a faster pace. India, a competitor in skilled manpower export,
on the other hand, has an edge over Pakistan with better trained workforce and is filling the gap in
Middle East job market. India is also attracting outsourced jobs which are helping it boost the
economic activity and employment opportunities. There has been less focus on making TVET more
responsive to industry demand and labour market needs. The technologies and curricula in vogue in
Pakistan is outdated and hence creates a mismatch in skills supplied to the labour market against the
demand. Realizing the need for skills up-gradation, some multinational corporations have come up
with their own in house training programs to overcome the shortage in skilled manpower. There has
been a greater focus on delivery as compared to quality of TVET education.
16. An IFAD (2001) study has pointed out that the notion of demand driven courses is different
among men and women in Pakistan. In case of women, the demand by prospective trainees to learn
a particular skill was considered for introducing a TVET course in a local setting. It was discovered
that the desire to learn a skill among women was influenced by their traditional roles and activities
rather than income generating potential or market demand. Therefore, it is concluded that the
demand-led approach to TVET also requires awareness among prospective trainees to understand
the economic implication of their skill acquisition choices.
17. There are several TVET providers in public sector under different federal ministries and
provincial departments. Besides, there are several other stakeholders as well. The following
stakeholders are considered important in Pakistan‘s TVET landscape on the supply side: The
Pakistan National Accreditation Council (PNAC), National Institute of Science and Technical
Education, Directorate of Workers Education, Ministry of Labour, Manpower and Overseas
Pakistanis and its Labour and Manpower Division, National Staff Training institute, Skill
Development Councils, Ministry of Youth Affairs, National Institute of Labour Administration and
Research, National Training Bureau and National Training Board, Overseas Pakistanis Foundation,
The Punjab Vocational Training Councils, Technology Up-gradation and Skills Development
Company. The providers and stakeholders lack coordination. However, after the creation of
NAVTEC in 2006 and the provincial and regional TEVTAs, it is hoped that the consolidation of
fragmented TVET may occur. The NAVTEC is created with an objective to regulate, facilitate and
provide the coordinated & integrated policy direction for TVET. It is also supposed to enhance the
role of private sector in the TVET implementation and management; and to make the TVET system
responsive to the new technologies, trades and training methods. How successfully it has achieved
its objectives almost after two years of its inception is a tricky question that needs to be assessed
based on NAVTEC‘s ongoing activities against its mandate. It may be useful for the reader to know
that NAVTEC‘s mandate lies in its Ordinance through which it came into existence.
18. So far the Punjab province has a taken a lead in establishing TEVTA and involving the
private sector in designing TVET projects. Similar bodies are in the process of establishment in
other provinces; however, there is sufficient evidence to suggest that private sector is not being
given its due role in Sindh and NWFP. The TVET institutes in provinces have access, quality and
equality issues. The Gender Parity Index (GPI) in TVET is approximately 0.40 which indicates

Background Situation Analysis of Pakistan‘s TVET System Executive Summary
Janjua and Irfan (SEBCON PVT LTD) xxi
limited access for female population. However, in terms of vocational education and training the
GPI is relatively better. The Student Teacher Ratio (STR) is comparable to international norms in
Punjab, Sindh and NWFP while Baluchistan, AJK and FATA lag behind on this indicator.
19. In Pakistan, transition for a student from TVET to general education is not easy as TVET
has often been associated with stigmas that obstruct personnel and skill acquisition and
development. One has to do lot of effort to overcome these hurdles in order to move upward along
the skill path to reach the pinnacle of skill pyramid. For example, the pathways leading to technical
training from vocational are not clear and obstructed by several factors such as quotas in higher
technical education colleges, unrecognized certification, etc. There are non-formal training
opportunities as well in the form of On-the-Job (OJT) training opportunities.
20. Besides, formal and non-formal pathways to skills acquisition informal pathways to skills
learning and training are also active. The most notable are ustad-shagird (Master-Apprentice)
system. Another informal and sometimes non-formal pathway to learning is through Islamic
Schools (Madrassahas) which are mostly unregulated. These schools cater for the marginalized and
disadvantaged who cannot afford to pay for schooling. However, sometimes children from well off
families also adopt this path due to family aspirations and socio-religious philosophies.
21. Under informal training arrangements there are no covenants in vogue in the informal sector
of Pakistan. There are no pre-conditions for entering the skill acquisition arrangement in an ustad-
shagird system such as minimum education or a binding contract, or minimum level of prior skills
in the same or related discipline. Skills acquisition in family enterprises is the second most
prevalent source of skill transmission. Children are expected to learn the skills of their parents, and
their peers in the family. On-the-Job training (OJT) is also known to be an important mode of skill
acquisition. This mode of skill transmission is also very common in both the formal and informal
sector.
22. An important feature of Pakistan‘s TVET programme is training and apprenticeship
programmes run by the public sector companies such as Pakistan International Airlines (PIA),
WAPDA, Pakistan Telecommunication Corporation, Pakistan Railways, Taxila Heavy Industries,
Pakistan Steel, Pakistan Television Corporation, Wah Ordinance Factories, etc. Some large firms
and multinational corporations do provide substantial training to their new recruits. They also
cooperate with the government on the Apprenticeship programmes setup under Pakistan Apprentice
Ship ordinance 1962. Most training is conducted on-the-job within industries and through private
institutions. The Government of Pakistan instituted an apprenticeship programme through
Apprenticeship Ordinance, 1962. It was further supplemented with Apprenticeship Rules, in 1966.
Under the ordinance all manufacturing firms / enterprises employing fifty or more workers are
required to recruit one apprentice for every five skilled workers. Though it sounds like a good
initiative; however, some analysts suggest that it has increased the cost of doing business.
23. There is no doubt that the financing of Pakistan‘s TVET scene is fraught with difficulties in
terms of improper resource allocation and utilization of funds. There is not much consolidated
information regarding the financing of the TVET system in Pakistan. The budget records are
available with TEVTAs and NAVTEC. A detailed analysis of per unit costs in public sector
technical and vocational training institute is not available. Therefore, there is a dire need for budget
analysis for benchmark and costing purposes. A working paper was commissioned to provide some
latest information on costing and financing of TVET in Pakistan and the Section V of this report

Background Situation Analysis of Pakistan‘s TVET System Executive Summary
Janjua and Irfan (SEBCON PVT LTD) xxii
heavily draws on it. The unit costs in vocational training institutes are relatively higher than
technical training institutes.
24. While the provision of technical education is mentioned in the constitution of Pakistan,
however, in the past the government has not allocated enough funds for its promotion. Several
TVET initiatives were started with the help of donors but the reform agenda is unfinished.
Sweeping reforms in Pakistan‘s TVET system at all levels are necessary due to the dire need to
align the TVET system with growing demand for workforce in a knowledge based economy as well
as in response to competitiveness in global markets. The reform in TVET system is also imperative
because of ongoing changes in demographic patterns and subsequent shift in labour markets.

Background Situation Analysis of Pakistan‘s TVET System Section I
Janjua and Irfan (SEBCON PVT LTD) 1
I
PAKISTAN SOCIO ECONOMIC PROFILE
1. Introduction
There is an immediate and urgent need for training our people in scientific and technical education in
order to build up our future economic life…
Father of the Nation Quaid-i-Azam Mohammad Ali Jinnah (1947)2
The country is strategically located at the cross roads of the famous silk and spice route of the South
and Central Asia. It is bordered by India to the East, the Arabian Sea in the South, China in the
North, Iran in the West, while Afghanistan borders Pakistan to the West and a small strip of land in
the Northwest, called the Wakhan corridor, in Afghanistan‘s Badakhshan province (less than 10
miles wide in places) separates it from Tajikistan.
The country is strategically located and is a frontline state in the war on terror. The Federally
Administered Tribal Area (FATA), serving as a buffer zone between Pakistan, has become a
controversial safe haven for militants from across the world. They are not only skirmishing with
Pakistan‘s armed and security forces, Northern Atlantic Treaty Organization (NATO) troops in
Afghanistan but at times fighting wars with each other as well. This militancy has destabilised the
whole region and is spreading to the adjacent areas in the North Western Frontier Province
(NWFP)3. In order to quell militancy and enforce the writ of the state, Pakistan‘s military has
stepped up its operations in the FATA and some sensitive areas of the NWFP against foreign and
local militants and rebels, respectively4. This has proved to be a disabling environment in an
economy which is already suffering from political and economic instability, inefficiency in
production, and declining productivity. The terrorism continues to be a major threat not only to
foreign investment but to domestic commerce as well.
The country has made remarkable progress in terms of economic growth over the past five years
from 2003-04 to 2007-08; the GDP growth rate averaged above 6% annually over this period.
However, the fiscal year 2007-08 has proved to be a difficult one as most of the economic activity
regressed in the aftermath of judicial crisis and the assassination of the former Prime Minister
Benazir Bhutto which subsequently resulted in emergency rule during which press freedom, basic
2 http://www.pakistan.gov.pk/Quaid/speech13.htm
3If it is not almost impossible, it is certainly very difficult to continue employment generation and livelihood activities
in a hostile environment. However, by leaving everyone at the mercy of such a disabling environment, it makes matters
worse for those who are seeking livelihood in a war torn economy in which there is less to offer in terms of
rehabilitation programmes. Though the entire country has borne the brunt of war on terror, the NWFP and the FATA
have suffered the most. There are militants and there are warrior tribes in FATA who switch sides (See Ahmad Rashid
2008). Even when there was no militancy the tribes fought with each other under collective responsibility doctrine of
punishing the entire tribe or clan for the crime of a single individual. The government has given them a protection
through Frontier Crime Regulation law of 1910 under which they resolve the collective responsibility through Jirga. If
the resolution is not accepted by the parties they are allowed to go to Pakistan‘s court system; however, they don‘t!
Instead fighting is sometimes considered best to settle issues. 4This has resulted in a fresh wave of suicide attacks not only in all the four provinces but federal capital as well.
Recently, a five star hotel, the Marriot Islamabad, has been completely gutted by fire in a suicide blast which resulted in
at least 60 deaths and 257 injured (See http://www.thenews.com.pk/updates.asp?id=55845 )

Background Situation Analysis of Pakistan‘s TVET System Section I
Janjua and Irfan (SEBCON PVT LTD) 2
human rights, and civil liberties were severely impacted. Elections were held in early 2008;
however, the political instability continued. Lawyer‘s movement and strike calls by political parties
almost paralysed business activities in major cities. Pakistan is certainly facing an uphill task in
stabilizing the economy in the backdrop of stagnant economy, slowing down production, rising
inflation, and a global financial crisis which is affecting the export oriented firms the most. A
continued progress in poverty reduction and improving the lot of poor may become a daunting task.
Table 1: Pakistan Country Profile
Data year Official name The Islamic Republic of Pakistan
Capital Islamabad
Provinces and Regions 4/4
Distircts/Tehsils/Blocks/Villages 127/366/26696/50589
Languages Punjabi, Sindhi, Siraiki, Hindko, Pashtu, Urdu, Balochi, Others
Population 160.9 Million Calculations
based on
Economic
Survey (2007-
08)
Gender Ratio 104.5 males per 100 females
Area 796,096 sq km
Population Density 166.3 persons per sq km
Geographical Location 330 40‘ N, 73
0 08‘ E
Religion Sunni Muslims (77%), Shia (20%) Others (3%)
Life Expectancy M 64 years, F 66 yrs (2005-06)
TFR/CBR/CDR/* 3.62/8.0/26.9
School Age Population 24Mn (Male 12.8 Mn; Female 11.95Mn)
Literacy Rate 55% (Male 65%, Female 42%) (2005-06)
Literacy (Population 10 years and
above)
55% (67%M, 42%F) (2007-08)
Primary Retention/Dropout Rate 61% (62.9%; Female 75%) / (2005)
Poverty 22.3% (Urban 13.1%, Rural 27.0%) (2005-06)
Expenditure on Education 2.3% of GNP (2007-8)
Labour Force 50.33 Million (2006-07)
Labour Force Participation Rate 31.8% (2006-07)
Unemployment Rate 5.2% (2006-07)
Industry Structure Textile (garments, bed linen, cotton cloth, yarn),
Sports goods, Surgical goods, Leather and Leather
Products, Rice, Chemicals, Carpets and Rugs, and
agro based industries are leading exporters. Auto
industry is establishing a strong base, so is the SME
and cottage industry. SMEs contribute 30% to GDP
and 25% to national exports. 20% SMEs are in
Manufacturing business.
Economic
Survey (2007-
08)
HDI 0.527 (Rank 135) 2005
GDI/GGI** 135 out of 174 / 127 2008
Per Capita Income $1085 (2007-08)
GDP Growth Rate 5.8% against the target of 6.8% (2007-08)
*TFR/CBR/CDR refers to Total Fertility Rate/Crude Birth Rate/Crude Death Rate
**GDI = Gender Development Index / GGI = Gender Gap Index / HDI = Human Development Index
Source: Economic Survey of Pakistan and
http://www.statpak.gov;
http://en.wikipedia.org/wiki/Geography_of_Pakistan
http://www.worldatlas.com/webimage/countrys/asia/pk.htm

Background Situation Analysis of Pakistan‘s TVET System Section I
Janjua and Irfan (SEBCON PVT LTD) 3
Pakistan‘s population has been growing fast and youth forms major portion of the population –
according to some estimates almost 46 million people (out of 160.9 million total) are concentrated
in the age range of 15-24 years out of which 45.2 million are part of the labour force with a Labour
Force Participation Rate (LPR) of 44.2 percent5. In order to increase the pool of skilled manpower
in the country, the government has adopted a two prong strategy for skill acquisition and
development by reforming the TVET system and overhauling the labour laws6. A new labour policy
in 2002 is aimed at rationalizing the labour market laws in order to decrease the cost of doing
business7. Pakistan ranks 77 in the World for ease of doing business; however, it ranks 134 when it
comes to employing workers among other comparable economies. It costs 12.1% of Gross National
Income (GNI) per capita to start a business in Pakistan as compared to 0.0% in New Zealand which
has ranked 1 in ease of doing business (WB 2008).
In the above context, it is imperative to come up with a programme that focuses on providing an
enabling environment for learning, skill acquisition, and livelihood. It is widely accepted among
labour market experts that a well designed Technical Vocational Education and Training (TVET)
programme to train manpower combined with complementary policies to support the utilisation of
skills is the key not only to overall economic growth but to supply well trained and equipped
manpower to the modern sectors of the economy. To this end, the government of Pakistan has
formed a national body tasked with reforming the TVET system - The National Vocational &
Technical Education Commission (NAVTEC) established in late 2005, has assumed a central role
in skilling Pakistan. Similarly, Technical Education and Vocational Training Authorities (TEVTAs)
are proposed at provincial levels. In this respect, the Punjab province has taken the lead in 1999,
long before NAVTEC‘s establishment, and similar bodies are in the making in other provinces.
1.1 The purpose and organisation of the background paper
This paper has the following objectives:
To provide information on Pakistan‘s economy, labour and demography, education, and
present situation in the TVET system and employment sectors;
To provide information about knowledge gaps and to make recommendations for further
analysis and studies; and
To act as a Stimulus for discussion with development partners on how best to support the
implementation of the National Skills Strategy for Pakistan.
The Paper briefly covers areas and issues in Pakistan‘s TVET system – its governance and
provision, labour market context, state of education and information on students. It also highlights a
number of issues for further discussion. The paper is written under the assumption that readers are
familiar with the Government of Pakistan‘s commitment to improve the TVET system in Pakistan,
the NAVTEC and its Vision for skilling Pakistan. Consolidated, accurate, and up-to-date
information on TVET is not easily available. The information for this Background Paper has been
collected from various sources and the authors acknowledge that significant gaps remain.
5 According to the Pakistan economic Survey 2007-08, the current size of population is 160.9 million. The youth aged
15-24 years formed 28.69 percent of the population and 28.09 percent of the labour force in 2006-07. At the time of
labour force survey the size of population was estimated at 158.17 million. The size of youth is calculated with an
assumption that proportion of youth in total population has not changed over one year period. 6 The Economic Survey of Pakistan 2007-08
7 ILO (2007 )

Background Situation Analysis of Pakistan‘s TVET System Section I
Janjua and Irfan (SEBCON PVT LTD) 4
The paper is organized in seven sections. Section one provides introduction and overview of
Pakistan‘s economy; section two discuss the general education and TVET system; section three
covers governance of TVET system in Pakistan while sections four, five, and six discuss skill
formation in and outside the formal system, financing of TVET, and major TVET initiatives. The
section seven presents conclusion.
1.2. Overview of Pakistan’s economy
1.2.1 Development Visions and Frameworks
In Pakistan development planning has a long history. It took off in 1950 when Pakistan became
signatory to ‗Colombo Plan‘ and a six year development plan was launched at that time. In the years
that followed, Pakistan continued to make five year perspective plans. In the 1950s and 1960s, the
World Bank (WB) had financed major infrastructure development projects, e.g., Indus basin
development project. The 1970s is considered era of nationalization during which Pakistan also
ramped up trade protections. A pivotal shift towards public private partnerships occurred in the
policy later during 1980s with the beginning of deregulation and privatisation which continued
through 1990s. However, in the backdrop of political instability, successive governments hardly
remained in business for two or more years, due to which development planning lacked continuity.
A development policy review by the World Bank in 2002 revealed that the reform process did not
achieve its objectives to the fullest due to a number of factors which included corruption and
populism among political class, civil service, police, and judiciary8.
The new millennium brought a renewed approach to development planning. In 2001, the
government of Pakistan launched vision 2010 under Mr. Nawaz Sharif‘s regime in the year 20009.
However, realizing much bigger challenges ahead in terms of demographic dividend (see Figure 1
below), as well as in the context of Millennium Development Goals (MDGs), the need for a real
long term vision was felt which gave birth to the ―Vision 2030.‖ Why ―Vision 2030‖? It is argued
that roughly 44% of Pakistan‘s population is below the age of 15 and, by the year 2030, an
overwhelming majority (60 million people) will enter economically productive age group10
. Almost
45% of the population with no education has already entered into new millennium without any
opportunities for formal skill acquisition. Therefore, in order to harness the potential of
demographic dividend it is imperative to come up with a long-term perspective plan which focuses
on socio-economic development and all inclusive economic growth that provides equal
opportunities for everyone in a knowledge economy.
In order to achieve the targets set in the Vision 2030, a number of Medium Term Development
Frameworks (MTDF) will be developed. The MTDF 2005-10 is focusing on the first phase of the
Vision and has set up an annual training target of 950,000 students in TVET institutions of which
700,000 are expected to attend courses in the public sector while 250,000 will be in the private
sector training institutions. It is interesting to note that the National Education Census 2005-06
reports 916 TVET institutions in the public sector compared to 2,143 institutions in the private
sector. This implies that the government‘s vision to train only 250,000 students in the private sector
8 See Pakistan Development Policy Review by the World Bank page 2.
9 A study titled Pakistan 2010 was commissioned by the government in 1995 financed by the Asian Development Bank.
10 See Vision 2030 Page 16.

Background Situation Analysis of Pakistan‘s TVET System Section I
Janjua and Irfan (SEBCON PVT LTD) 5
TVET institutions against 700,000 students in the public sector institutions is unrealistic. The
government is not prepared to fully exploit the potential of the private sector11
.
Figure 1: Population Pyramid in Pakistan by 2030
Source: GoP, Vision 2030.
The Vision for National Skills Strategy (NSS) also known as ―Skilling Pakistan‖ prepared by
NAVTEC carries forward the MTDF agenda. It envisaged Pakistan being a knowledge-based
economy and is aware of the fact that TVET has not received adequate attention in the past. The
NSS vision is based upon the following three main components:
Provision of relevant skills for industrial and economic development
Improving access, equity, employability
Assuring quality for skills development
The NSS vision document proposes to reform Pakistan‘s TVET system in order to provide the
demand driven (market relevant) skills so as to promote and sustain industrial development and
economic growth which ensures access, equity and equal opportunities for employment for
everyone. The NAVTEC is preparing an implementation plan for its vision in consultation with
international donors and other stakeholders. The vision and the implementation plan together will
form the complete National Skills Strategy (NSS). The NSS will provide the guidelines for reform
in TVET (an educational sub-sector) and also hopes to provide a platform for donors and the private
sector to agree on and coordinate their contributions.
1.2.2 Macroeconomic Performance in recent years
Over the last five years Pakistan‘s GDP growth performance, above 6% on average, has been
considered extraordinary but now the economy is preparing for a soft belly landing (see figure 2
below). The real GDP growth rate that touched an impressive figure of 9.0% in 2005 has
plummeted to 5.8% in 2008 vis-à-vis a target of 7.2% due to a slowdown in agricultural and
industrial productivity; lack of competitiveness coupled with a global recession that has resulted in
a decrease in demands for Pakistani exports; high energy prices which pushed up the cost of
production; and high inflation. The latest SBP annual report on the state of the economy, released in
11
See MTDF

Background Situation Analysis of Pakistan‘s TVET System Section I
Janjua and Irfan (SEBCON PVT LTD) 6
December, forecasts GDP growth at 3.5%, which is signalling that the economy is heading towards
a recession and may erode consumer confidence and investor optimism.
Figure 2: GDP Growth Rate and Inflation
Consumer Price Index
0
5
10
15
20
25
30
35
40
Sep
-07
Oct
-07
Nov
-07
Dec
-07
Jan-0
8
Feb
-08
Mar
-08
Apr
-08
May
-08
Jun-
08
Jul-0
8
Aug
-08
Sep
-08
Months
Per
cen
tag
e
CPI Food Inflation
Source: Based on data reported in the economic survey of Pakistan 2007-08
The over all inflation stayed around 8.0-9.0% until December 2007. However, since January 2008
Consumer Prices continued to rise and for last 6 months registered, on average, a higher than 20%
increase. Meanwhile foodstuffs have seen a much higher increase; on average above 30% over the
last six months. A tight monetary policy which was pursued until mid October 2008 did not help
much in bringing inflation down. If inflation continues to grow, it will have a drastic impact on the
incomes of the poor. Especially for people living below the poverty line and those who were
marginally above the line12
. In recent years, poverty did decline. However, it is feared that earlier
gains in poverty reduction may be lost due to higher than 25 percent inflation which has prevailed
since April 2008 (see figure 2 above). This is expected to have implications for household budgets
as they will be faced with a trade off to meet essential food expenditures or to spend on education,
health, shelter, clothing, and other basic necessities. The international oil prices and increase in
prices of agricultural commodities were the main causative factors behind the outburst of inflation.
12
The latest estimate of national poverty line is measured as Rs. 944.47 per adult equivalent per month

Background Situation Analysis of Pakistan‘s TVET System Section I
Janjua and Irfan (SEBCON PVT LTD) 7
1.2.3 Sector wise Growth Performance
The share of agriculture in Pakistan‘s economy has decreased to almost 22% (from almost 40-50%
during its formative years 1947-1965). The services sector comprises more than 50% of the
economy‘s output while the industrial sectors share is stagnant at 25-26% (see figure 3 below).
Though a strong industrial base is emerging, Pakistan‘s economy is more or less semi-agrarian in
nature. Produce of agro-based industries, cotton textiles and related products dominate its exports.
Industrial performance depends on good harvest of cotton and other cash crops. For almost the last
four years, since 2005, both agricultural and industrial growth rates have been declining. While the
services sector has continued to grow, the declining overall economic growth rate suggests that the
services sector does not provide a strong base to sustain the overall economic growth rate.
Figure 3: Sector Performance (Growth Rates)
Real Output (GDP) Growth and Sectoral Shares
7.5
9.0
5.86.8
5.8
0%
20%
40%
60%
80%
100%
2004 2005 2006 2007 2008P
Sectoral Share
-1.0
1.0
3.0
5.0
7.0
9.0
11.0
13.0
15.0
17.0
% Grow th
Agriculture Industry ServicesGDP Growth Service Growth Industrial GrowthAgricultural Growth
0.0
5.0
10.0
15.0
20.0
25.0
30.0
2005 2006 2007 2008P
Industry Share in GDP LargeIndustry Growth Small Ind & HH Growth
Source: Based on data reported in the economic survey of Pakistan 2007-08
1.2.4 Fiscal Discipline and Public Debt
The fiscal responsibility act of 2005 made it binding upon the government to adopt prudent fiscal
policy measures; for example: a reduction in the revenue deficit to zero in absolute terms; a
reduction in budget deficit to 3% of GDP; an increase in total pro poverty expenditure to 4.5% of

Background Situation Analysis of Pakistan‘s TVET System Section I
Janjua and Irfan (SEBCON PVT LTD) 8
GDP13
; a limit to total borrowing requirements to 2% of GDP; and a reduction of total debt to GDP
ratio to less than 60%14
. After the earthquake of 2005, the expenditure needs have gone up —
increasing the budget deficit to 7.5% of GDP in 2007-08 (see figure 4 below). A low tax-to-GDP
ratio has undermined the GoP‘s efforts to keep the revenue deficit close to zero. Currently, the tax-
to-GDP ratio (TGR) is close to 10%. A smaller TGR may limit the government‘s ability to generate
the pro-poor fiscal space that is necessary to continue its poverty reduction programme.
Figure 4: Fiscal Policy in Pakistan
Fiscal Performance
-1000
-500
0
500
1000
1500
2000
2004/05 2005/06 2006/07 2007/2008
Billion Rs
-2
-1
0
1
2
3
4
5
6
7
8
% of GDP
Total Rev Current Exp Development Exp
Budget Deficit Non EQ Deficit % ofGDP Deficit % of GDP
Data Source: SBP Third Quarterly Report 2006
Source: based on data reported in the economic survey of Pakistan 2007-08
1.2.5 Monetary Policy
Against the backdrop of global financial crisis, implementing monetary policy has become
increasingly challenging for the State Bank of Pakistan (SBP)15
. In order to subvert the impact of
inflationary pressures, which continued to build up due to supply shocks and rising demand, the
Central Bank used contractionary monetary policy as far as the private sector was concerned.
However, it failed to restrain the government from monetizing its fiscal deficit. The latest annual
report 2008 on the state of the economy by SBP reports that the fiscal deficit has risen out of
proportion to 7.5% of GDP against a target of 4.2% of GDP for FY2007-08. The government
monetized 85% of deficit. The government borrowed record sums of money from the central bank
which is the most inflationary source of financing16
. This has resulted in rising inflation which has
subsequently resulted in unbounded inflationary expectations, eroding the purchasing power of the
masses and the profit margins of businesses17
. The government continued to borrow excessively
from the State Bank of Pakistan and touched a record of Rs. 688 billion in FY 2007-200818
(see
figure 5 below). This has revealed the vulnerability of the fiscal framework in Pakistan. If the
13
The revenue deficit is defined as revenue minus current expenditure (excluding development expenditure). 14
The development budget mostly pertains to public investment in infrastructure. 15
In the backdrop of financial crisis the SBP mulled rescue packages for commercial banks which would have resulted
in soft monetary policy measures; however, the Bank tightened monetary policy again because of a new agreement with
IMF and its conditionality. 16
SBP 2008. 17
At the time of finalizing this paper it is learnt that the government was again gearing up to reverse its decision of
easing monetary policy and will gradually tighten it so as to meet IMF conditionality. The government is signing an
agreement with the IMF to get support in order to prevent a default on its international debt. 18
State Bank Quarterly Report: Third Quarter FY08

Background Situation Analysis of Pakistan‘s TVET System Section I
Janjua and Irfan (SEBCON PVT LTD) 9
government is going to rely on financing its expenditures through public borrowing interest rates
will increase and may crowd out private investment.
Figure 5: Stock of Net Budgetary Borrowings from SBP
and Resource Mobilization in Pakistan
Investment and Savings as % of GDP
16.6
21.622.922.1
19.1
16.9
11.7
1616.315.4
15.7
17.6
0
5
10
15
20
25
2002-03 2003-04 2004-05 2005-06 2006-07 2007-08
% of GDP
0
5
10
15
20
25
Public Investment Private Investment Total Investment Domestic Saving
Source: Budgetary Borrowings from SBP 2008 and
IS gap based on data Reported in economic survey of Pakistan.
1.2.6 Investment and Savings Gap
One of the key challenges for policy makers is domestic resource mobilization. However, domestic
savings have continued to register a declining trend as a percentage of GDP and, according to
provisional estimates, is as low as 11.7% in 2007-08 . Widening domestic investment-savings gap is
not sustainable for long-term economic growth. In terms of GDP, total investment stood at 21.6 %
in FY07-08 (see figure 5 above). The investment-savings (IS) gap has continued to increase (The
widening IS gap is indicated in the graph below with double head spears in red colour). The
government must introduce innovative measures for domestic resource mobilization to overturn the
financial repression which has been exacerbated due to global financial crisis. Recent declines (in
2008) on the Karachi Stock Exchange (KSE) index indicate that investors are wary of the current
economic and political conditions.
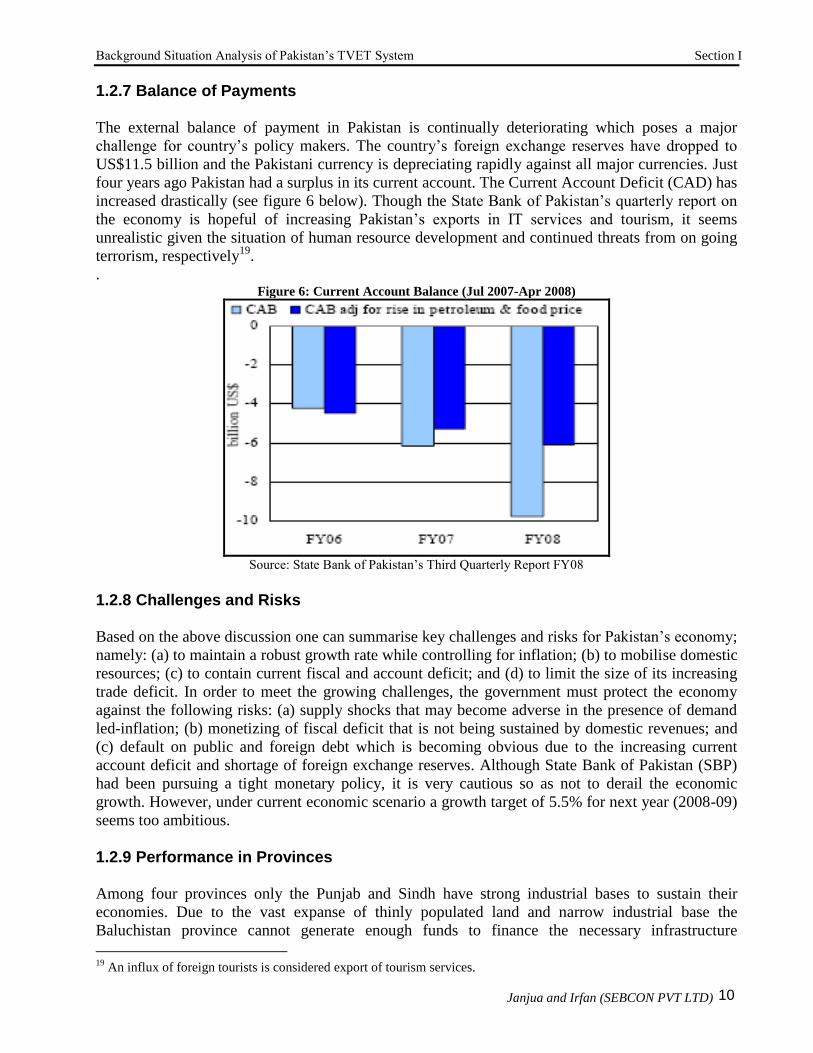
Background Situation Analysis of Pakistan‘s TVET System Section I
Janjua and Irfan (SEBCON PVT LTD) 10
1.2.7 Balance of Payments
The external balance of payment in Pakistan is continually deteriorating which poses a major
challenge for country‘s policy makers. The country‘s foreign exchange reserves have dropped to
US$11.5 billion and the Pakistani currency is depreciating rapidly against all major currencies. Just
four years ago Pakistan had a surplus in its current account. The Current Account Deficit (CAD) has
increased drastically (see figure 6 below). Though the State Bank of Pakistan‘s quarterly report on
the economy is hopeful of increasing Pakistan‘s exports in IT services and tourism, it seems
unrealistic given the situation of human resource development and continued threats from on going
terrorism, respectively19
.
. Figure 6: Current Account Balance (Jul 2007-Apr 2008)
Source: State Bank of Pakistan‘s Third Quarterly Report FY08
1.2.8 Challenges and Risks
Based on the above discussion one can summarise key challenges and risks for Pakistan‘s economy;
namely: (a) to maintain a robust growth rate while controlling for inflation; (b) to mobilise domestic
resources; (c) to contain current fiscal and account deficit; and (d) to limit the size of its increasing
trade deficit. In order to meet the growing challenges, the government must protect the economy
against the following risks: (a) supply shocks that may become adverse in the presence of demand
led-inflation; (b) monetizing of fiscal deficit that is not being sustained by domestic revenues; and
(c) default on public and foreign debt which is becoming obvious due to the increasing current
account deficit and shortage of foreign exchange reserves. Although State Bank of Pakistan (SBP)
had been pursuing a tight monetary policy, it is very cautious so as not to derail the economic
growth. However, under current economic scenario a growth target of 5.5% for next year (2008-09)
seems too ambitious.
1.2.9 Performance in Provinces
Among four provinces only the Punjab and Sindh have strong industrial bases to sustain their
economies. Due to the vast expanse of thinly populated land and narrow industrial base the
Baluchistan province cannot generate enough funds to finance the necessary infrastructure
19
An influx of foreign tourists is considered export of tourism services.

Background Situation Analysis of Pakistan‘s TVET System Section I
Janjua and Irfan (SEBCON PVT LTD) 11
development. The NWFP is fraught with rising militancy and extremism which has literally halted
business activities in several areas. The ongoing militancy in the NWFP and Baluchistan has added
to the vulnerability of the economies in these provinces. Baluchistan has continued to borrow
excessively from the SBP to finance its expenditures. Public financing of deficits by the federal and
provincial governments has put tremendous pressure on available resources.
1.3. Population Challenge, Poverty and Social Sector Performance
1.3.1 Population Challenge
Pakistan‘s population has been growing fast. The annual population growth rate has been around
3% during 1970-90, which is now claimed to have declined to 1.9%20
. At this rate the population is
expected to double its size in 2045, hence further straining the resources and infrastructure.
Currently the population of Pakistan is estimated around 160.9 to 164.7 million (estimates vary)21
,
which is almost ten fold increase since 1901. While Pakistan‘s population contributes only 2.5% to
the world population, it is the sixth most populous country in the world with a population density of
166.3 people per square kilometre. The age structure of the population is changing which poses a
challenge for policy makers. If the demographic potential is not harnessed properly it may create
frustration among youth and result in social unrest. A population explosion is expected to
compound the problems like poverty, and unemployment. Improvement in socio-economic
indicators which have been witnessed over the past few years due to strong economic growth has
become vulnerable in the light of approaching recession and high inflation. As compared to other
South Asian countries Pakistan still lags behind in the provision of housing, education, health,
sanitation, livelihood and social protection to the weak and marginalized.
1.3.2 Poverty
Poverty measurement in Pakistan is mired in controversies due to different methodologies in use
and the limitations of the available datasets22
. The table reported in this section gives government‘s
official poverty statistics. According to ADB‘s Country Assistance Programme Evaluation (2007),
poverty in Pakistan rose during the 1990s, and into the early part of the new millennium, the gap
between rural and urban poor kept on widening over1993 to 2002, from 7 percentage points to more
than 16 percentage points, respectively. The prevalence of poverty peaked in the drought year
(2001) while it dropped significantly in 2004 due to a good agricultural harvest. Good agricultural
harvests, higher agricultural produce prices, and workers remittances subsequently raised per capita
incomes to alleviate poverty in Pakistan during 2001-2005 (see table 2 on next page).
20
LFS (2005-06) 21
The last census took place in 1998 and a new census is due in 2008. The population projections use parameters
available through the labour and demographic surveys of the Federal Bureau o f Statistics (FBS), the National Institute
of Population Studies (NIPS) and the National Institute of Health (NIH). 22
The head count poverty measure is highly sensitive to the reference poverty line of Rs. 944.47. Therefore, it is
imperative to understand the methodology behind these estimates. The poverty line in year 2001 was estimated at Rs.
723 which has been estimated as Rs 878.6 in 2005 after adjustment for inflation variation (7-8% per annum at that time)
and is reported as Rs. 944.47 in 2006. Nevertheless, inflationary pressures coupled with declining economic growth are
expected to undercut the hope of causing a significant dent in poverty in coming years. It is expected that the ongoing
inflation rate (CPI based) of above 20% has pushed at least 40% of the population below the poverty line in recent
months, according to some independent estimates.

Background Situation Analysis of Pakistan‘s TVET System Section I
Janjua and Irfan (SEBCON PVT LTD) 12
Pakistan‘s recent growth was deemed to be pro-poor as Pakistan made significant progress in
decreasing head-count poverty rate during years of economic progress. The population living below
the $1 a day poverty line decreased from 31 percent in 2002 to 17 percent in 200623
. According to
the government of Pakistan‘s calculations, based on their methodology applied to Household
Income Expenditure Survey (HIES) conducted by the Federal Bureau of Statistics (FBS), the
percentage of population living below the so called income poverty line, calculated on a need based
approach, declined from 34.46% in 2001 to 23.94% in 2005. Rural poverty levels remain much
higher than urban levels.
Table 2: Poverty in Pakistan
Head Count Poverty Gap Severity of Poverty
2001 2005 2006 2001 2005 2006 2001 2005 2006
Urban 22.69 14.94 13.1 4.55 2.87 2.1 1.35 0.84 0.5
Rural 39.26 28.13 27.0 8.04 5.64 5.0 2.44 1.77 1.4
Overall 34.46 23.94 22.3 7.03 4.76 4.0 2.13 1.48 1.1
Severity of poverty explains the inequality among poor while the ‗Poverty GAP‘ Index measures the depth of poverty.
Source: The Economic Survey of Pakistan 2007-08
1.3.2 Pro-Poverty Expenditure
In recent years, the government has increased pro-poverty expenditure; however, spending on
education and health, yet this remains low as a percentage of GDP24
. The education budget is hardly
2% of GDP, which may not be enough to pursue the elusive goals of Education for All (EFA). The
total education budget allocation, at Rs 220 million, has grown by almost 38% in 2007-08 over
2006-07; however, it is only 2.3% of GDP (see table 3). The ministry of finance, only recently,
started giving a breakdown of allocation for primary, secondary, tertiary, and higher education but
allocation for technical and vocational education are not given explicitly in the budget document.
Table 3: National Education Expenditure as percentage of GNP
1999-00 2000-01 2001-02 2002-03 2003-04 2004-05 2005-06 2006-07 2007-08
% of GDP 1.6 1.7 1.9 1.7 2.1 1 1.9 2.4 2.3
Source: Source Economic Survey 2007-08, Ministry of Finance, GoP.
The Government has pledged to gradually increase public expenditure up to 3% of GDP. Most of
the public expenditure is devoted to basic education as well as higher education in Pakistan.
Presumably very little amount is allocated for the promotion of TVET25
. While allocations are
specifically made for pre and primary education, secondary and tertiary education, TVET does not
receive due recognition in federal budget allocations (see snapshots of federal budget in Annex)26
.
23
UNDP Human Development Reports various issues 24
The pro-poverty expenditure as defined in the Fiscal Responsibility and Debt Limitation Act, 2005 (FRDLA) includes
expenditure on: education, health, highways, roads and bridges, water and sanitation, population planning, social
security and other welfare, natural calamities, irrigation, land reclamation, rural development, food subsidies, sub-
ordinate judiciary, law and order (only the development aspect), village electrification & food support programmes. 25
Also see King (2007) on politics of Skill and the Challenge of Supporting TVET 26
It is interesting to note that only two public corporations, the Water and Power Development Authority (WAPDA)
and the National Highway Authority (NHA), have their allocations mentioned in the FY2008-09 budget while the
budget for NAVTEC, incorporated as a corporation, is not mentioned in the Table 27 of the federal budget 2008-09
document which gives the size of the Public Sector Development Program (PSDP)

Background Situation Analysis of Pakistan‘s TVET System Section I
Janjua and Irfan (SEBCON PVT LTD) 13
Figure 7: Pro Poor Expenditures
Pro Poverty Expenditure on Education and Health
0
50
100
150
200
250
2001-02 2002-03 2003-04 2004-05 2005-06 2006-07 2007-08
Years
Exp
endi
ture
on
Edu
and
Hea
lth
% o
f G
DP
0
100
200
300
400
500
600
700
Tot
al P
ro P
over
ty E
xpen
ditu
re (
Rs.
In
Mill
ion)
Education Health Total
Pro Poverty Expenditure
0
1
2
3
4
5
6
7
2001-02 2002-03 2003-04 2004-05 2005-06 2006-07 2007-08
Years
Percen
tag
e o
f G
DP
Education Health Total
Source: Based on data from Economic Survey 2007-08
1.3.3 Education Sector Performance
The government has stepped up its efforts to ensure Education for All (EFA), yet Pakistan‘s net
primary enrolment ratio, survival rate to grade 5 and literacy rate is lagging behind both the MTDF
2009-10 and MDG 2015 targets. In 2004-05, Net Primary Enrolment Ratio (NPER) stood at 52%.
The MTDF requires NPER to increase by another 50% - so as to attain a target of 72% while under
MDG a 100% NPER must be achieved by 2015. It is becoming obvious that Pakistan may not be
able to achieve the targets; same is true about expected completion rate to grade 5 and literacy rate
in Pakistan (see Table 4 below). The existing NPER and primary school completion rate shows that
almost 48% children do not participate in primary school education. Out of 52% who are enrolled in
primary school, only 72% are able to complete 5 grades which subsequently means more than 50%
children of school going age are either denied education (especially females) or unable to complete
primary grades due to unfavourable circumstances. There are not many technical and vocational
education and training opportunities to help them with skills acquisition. Therefore, majority of
dropouts may become part of vulnerable labour force which is discussed later is section 1.4.4.

Background Situation Analysis of Pakistan‘s TVET System Section I
Janjua and Irfan (SEBCON PVT LTD) 14
Table 4: MTDF and MDG Education sector targets*
Indicator 2004/05 MTDF target
2009/10
MDG target
2015
Status
Net primary enrolment ratio 52% 72% 100% Lagging
Completion rate to grade 5 72% 80% 100% Lagging
Literacy rate 53%
M:65, F:40
77%
M:85, F:66
88%
M:89, F:87
Lagging
*MTDF= Medium Term Development Framework; MDG= Millennium Development Goals
Source: State of Education in Pakistan 2003-04, Ministry of Education
1.3.4 Expenditure on Health
For the past one decade, public spending on health remains less than 1 % of GDP. This is likely to
affect country‘s performance in achieving MDG goals regarding health. A healthy and prosperous
population is more able to actively pursue educational and livelihood goals. The maternal mortality
rate and infant mortality rate have declined considerably in Pakistan since 2000; however, Pakistan
is already lagging behind other South Asian nations when it comes to four key health indices
included in MDGs27
.
1.4. Labour Force and Employment Situation
Labour Force and Employment data are collected by a number of surveys and censuses, such as
decennial Population Census, Labour Force surveys (generally conducted every year) and
Household Income and Expenditure Survey (HIES)28
. The Large scale manufacturing employment
has been estimated previously through Census of Manufacturing Industries (CMI), the latest
available being for the year 2000. Variations in the concepts and definitions of the measures used,
sample sizes and enumeration methodology mar consistency and make it difficult to have
comparison inter-temporal or across the surveys. Reliance generally has been made on Labour
Force Survey (LFS) for discussing the labour force participation rates, employment levels and
structures as well as wages because LFS is regarded as better source than others for the study of
these particular aspects. According to LFS, the labour market in Pakistan grew by more than 4%
during the 1990s. The unemployment rate has decreased by 1.1 basis points over a six year period
from 1999-2000 to 2005-06 (ILO-KILM 2007). However, the Labour Force Participation (LFP) rate
is relatively low and rates vary across provinces (see Annex 1).
The informal sector is the largest sector of the economy not only in terms of absorbing the majority
of labour force but also in providing skills training to majority of the illiterate especially in the
absence of any formal skills training opportunities for marginalised target groups (see Janjua and
Janjua 2008). If there are more formal training opportunities it is possible that the formal sector may
expand and become leading job provider. According to the Labour Force Survey 2006-07, the
informal sector employs 72% of all workers outside agriculture while entire agriculture activity is
also characterised as informal due to absence of organized corporate farming; therefore, agriculture
sector is excluded from LFS29
. With regard to the non-agricultural segment of the economy, the
informal sector covered in LFS encompasses a diverse range of activities ranging from
manufacturing to services, and retail and wholesale trade. All the self employed, and employment in
27
SBP 2008. 28
HIES is now part of Pakistan Social and Living Measurement-PSLM 29
The Labour Force Survey (LFS) of Pakistan is the only source which provides statistical information on the informal
sector.

Background Situation Analysis of Pakistan‘s TVET System Section I
Janjua and Irfan (SEBCON PVT LTD) 15
the enterprises having less than 10 employees are counted as informal while the remaining non-
agricultural employment is defined to be part of the formal sector. The share of the informal sector
in absorbing non-agricultural labour force has increased from 64.6% in 2002 to 72.9% in 2006.
However, declining economic activity, stagnant industrial activity, declining small scale and
household based industry growth (see graph above), and increasing international competition in the
export markets may reduce the capacity of the economy to create more jobs. The non-relevance of
informally obtained skills in new knowledge economy is another concern regarding mismatch of
skills with the market demand.
1.4.1 Key Trends in Pakistan’s Labour Market
The measurement of labour force participation rates in the LFS though suffers from imprecision,
rendering labour market analysis a fairly daunting task. The inappropriateness of the concepts used
to measure labour supply and data inadequacies that can encapsulate labour market realities have
been widely discussed in the literature both internationally and in Pakistan. In the context of a
pervasive household enterprise system, it is difficult to demarcate economic and non-economic
activities; besides household enterprise activity is characterized by the absence of any formal or
explicit employment contract. Survey respondents can either get recorded as unpaid family helpers
or self employed, imparting a great deal of arbitrariness to the classifications of ‗employed‘,
‗unemployed‘ and ‗out of labour force‘. The categorization of labour as working or not working in
such a fluid situation tends to generate results which at times appear to be related to definition and
data cleaning issue. For instance, shares of agriculture in total employment, size of the unpaid
family helpers and female labour force participation rates move somewhat in tandem. The data can
be misinterpreted, out of the 4.5 million increase in the employment during 2003-04 and 2005-06
yielded by LFS nearly more than half of this was due to increase in the unpaid family helpers in the
total employment. Keeping in view these limitations the activity rates, employment structure and
unemployment is discussed below.
a) Labour Force Participation Rates
The labour force participation rate has also increased from 30.4% in 2003-04 to 32.2% in 2005-06.
The increase has also been recorded in both male and female participation rates and is
comparatively higher in age group 40-44 (reported around 60.1%)30
. Agriculture remains the largest
job providing sector; however, its share in GDP is declining. Service, finance, transport, trade,
manufacturing and electricity have larger proportions of regular employees. The proportion of
casual and piece rate workers is higher in agriculture, mining, and construction. According to some
estimates the share of working age population (15-59 years) has increased from 51 percent in 1998
to over 57 percent in 200631
.
The labour force participation rate in Pakistan is lower than other countries. Recent Labour Force
Survey 2006-07 has rather shown a decrease in labour force participation rate to 31.8% over last
year LFS 2005-06. This could be attributed to a number of factors. In NWFP, the reduction in
labour force participation is disquieting as militancy and terrorism is rising which has no doubt
affected businesses and employment opportunities. Off course, this could be one of the factors;
however, it must be noted that the decline in LFP in all the four provinces indicates that decline in
30
LFS 2005-06 31
The State Bank of Pakistan Annual Report 2006-07.

Background Situation Analysis of Pakistan‘s TVET System Section I
Janjua and Irfan (SEBCON PVT LTD) 16
one province is not offset by an increase in the other one. Therefore, one can conclude an overall
decline in economic activity.
b) Crude Activity Rates
The labour force, defined to be the sum of employed plus unemployed was estimated to be 50.78
million for the year 2006-07 in a population of close to 160 million, giving a worker to population
ratio of 0.32 referred to as the crude activity/participation rate (Pakistan Economic Survey 2007-
08). A fluctuating trend over the years in the crude activity rate, partly because of the changing age
structure, rising educational enrolment and varying definitions is yielded by the data. The overall
low level of crude activity rate is mostly because of low representation of women in the workforce;
since they have principal responsibility for the housework – including feeding and tending of cattle,
tailoring, weaving, i.e., provision of many goods and services that are either purchased from the
market or supplied by paid employees in developed countries. It is only through deeper probing that
these activities get recognized as work which is also reported by LFS generally termed as
augmented labour force participation rate but not utilized for further analysis of labour market data.
c) Age-specific Labour Force Participation Rates
The age specific activity/labour force participation rates which iron out the age structure effect,
summarized in Table 5, indicate that the overall refined activity rate for those aged 10 years and
above experienced a rise from 43.3 in 2001-02 to 46.9 in 2005-06. An inter-temporal comparison is
reflective of a rise in the activity rates of females and teenagers as well as youth during 2001-02 to
2005-06. It is not possible to comment on the extent to which it is a response error, but, as discussed
already, the share of the unpaid family helper in total employment has also risen in 2005-06 in
comparison with the situation in 2001-02. Thus rising activity rate during the past few years could
be possibly due to rise in the share of unpaid family helper.
Table 5: Age-specific Labour Force Participation Rate 2001-02 – 2005-06
2001-02 2003-04 2005/06
10 years and over Both 43.3 43.7 46.9
Male 70.3 70.6 72.0
Female 14.4 15.9 18.9
10-14 years Male 17.2 18.5 20.68
Female 6.3 6.7 9.21
15-19 years Male 57.6 59.0 60.87
Female 13.8 14.5 16.91
20-24 years Male 87.0 85.7 87.63
Female 15.9 18.1 20.67
25-34 years Male 96.6 96.2 97.03
Female 16.1 18.3 21.62
35-44 years Male 97.5 97.4 97.57
Female 19.9 21.0 25.07
45-54 years Male 95.6 95.6 96.37
Female 19.4 20.9 24.76
55-59 years Male 88.2 89.7 90.62
Female 14.5 18.6 22.84
60 years & above Male 56.6 58.4 59.38
Female 11.4 12.9 14.09
Source: Labour Force Survey

Background Situation Analysis of Pakistan‘s TVET System Section I
Janjua and Irfan (SEBCON PVT LTD) 17
Disaggregated by gender we notice substantial variations. An overwhelming proportion of adult
males in the age group 25-59 years are found to be active with an activity rate higher than 90%
while those in the age group 10-19 and elderly (60 years and above) display lower activity rates (see
table 5 below). This curvilinear relationship between age and the labour market participation is
depicted mostly by males. In case of the females there are differentials but not very sharp, both
teenagers and the elderly (over 60 years of age) exhibited participation rates lower than those of
prime aged females. However, the female activity rates generally varied in a narrow range from 9%
(for 10-14 age group) to 25% for the age cohort 35-44 years in 2005-06. The refined activity rate for
females aged 10 years and over has risen from 14% in 2001-02 to 19% in 2005-06; an escalation
shared by all age cohorts, which in case of teenager is somewhat puzzling given the claims of rising
female school enrolment. It may be noted that one fifth of the male children (10-14 years) and 9%
of the female children are in the labour force indicating a disturbing level of child labour.
d) Employment Structure
Employment, according to LFS has risen from 39.6 million in 2001-02 to 48 million in 2007. It may
be added that both the activity rate and data on population size which are used to arrive at the
absolute size of employment are not problem free. Given the widespread household enterprise
system and the dominance of informal nature of activities, some employment categories such as
unpaid family helpers and self- employed may simply mask the non-utilization of labour wherein
they are not in fact productively engaged but are reported as working in the survey. Distribution by
employment status indicates a relative stability in case of employers being 0.88% of total
employment in 2005/06. In contrast there was a decline in the share of wage employees from
39.85% in 2001-02 to 37% in 2005-06. The share of unpaid family helpers rose from 20% to 26%
during 2001-2006. A rise of the relative share of unpaid family helper males could be on account of
difficulties in classifying responses or simply reflects their non-engagement in ex-house activities
due to non-availability of job opportunities though unpaid family helpers can be utilized in the
activities like dairy and livestock activities in rural areas, the rise in the size of urban family
enterprise has to be investigated further. One finds a decline in the share of self employment from
38.50% in 2001-02 to 35% in 2005-06.
e) Industrial Composition
The sectoral (industrial) employment composition underwent a change with the transformation of
the economy. Pakistan's experience has not been any different. During the period 1950-70
employment grew with a persistent decline in the share of agriculture in total employment from
65% to 55%, 50% in 1993-94, 47.25% in 1997-98 and 43% in 2006-07. Compared with its share of
21% of GDP in 2007, a less than average productivity work opportunity is being offered by
agriculture. The share of mining and manufacturing in total employment displayed a rising trend
during 1950-70 from 9% to 15.6%. Since then as a fraction of total it has declined, during 1990‘s
from 12% to 10% subsequently, rising to 13.8% of the total employment in 2006-07 in contrast to
its 19 percent contribution to the GDP. Sectors of the economy, other than agriculture and
manufacturing, registered a continuous rise in their shares, accounting for 43% of total employment
in 2006-07 (in contrast to 27% in 1969-70); though for the recent sub-period (see table 6 below)
there is relatively stability of the industrial structure of employment.
The industrial employment structure for males differs substantially from that for females. Almost
two-thirds of the latter are engaged in agriculture compared with 38% of males in rural areas. In

Background Situation Analysis of Pakistan‘s TVET System Section I
Janjua and Irfan (SEBCON PVT LTD) 18
general, however, there is concentration of females in agriculture in rural areas and services in
urban areas.
Table 6: Distribution of Employed Persons of 10 Years Age and Above by Major Industries
Years Agri-
culture
Mining &
Manufacturing
Construction
Cons-
truction
Electricity &
Gas
Distribution
Trans-
Port
Trade Others
2000-01 48.42 11.55 5.78 0.70 5.03 13.50 15.02
2001-02 48.42 11.55 5.78 0.70 5.03 13.50 15.02
2002-03 42.09 13.91 6.05 0.81 5.90 14.85 16.39
2003-04 42.09 13.91 6.05 0.81 5.90 14.85 16.39
200405 43.05 13.80 5.83 0.67 5.73 14.80 16.12
2005-06 43.05 13.80 5.83 0.67 5.73 14.80 16.12
2006-07 43.37 13.93 6.13 0.66 5.74 14.57 15.49
2007-08 43.37 13.93 6.13 0.66 5.74 14.57 15.49
Source: Pakistan Economic Survey 2007-08
f) Unemployment and underemployment
The ‗unemployed‘ since 1990-91 redefined in LFS covers those without work or currently available
for or seeking work. The unemployment rate has been on the rise (see table 7 below). It was 5.9%
in 1997-98 rising to 8.3% in 2001-02, experiencing a modest decline to 7.8% in 2003-04 with
further decline to 6.3 in 2005-06. This fall could be rendered as a statistical puzzle because of the
increase in the share of unpaid family helpers. Still the level of unemployment was higher in 2005-
06 than early 1990s.
Table 7: Unemployment and Underemployment Rates, 1993-94 to 2005-06
Period
Unemployment Rate Underemployment Rate
All Areas
Rural
Urban
Working Less than 35
hours/week – all areas
1993-94 4.8 4.2 6.5 13.2
1994-95 5.4 4.8 6.9 12.2
1996-97 6.1 5.7 7.2 11.5
1997-98 5.9 5.0 8.0 12.9
2001-02 8.3 7.6 9.8 13.4
2003-04 7.7 6.7 9.7 14.9
2005-06 6.2 5.4 8.0 15.1
Source: Labour Force Surveys.
Unemployment rates in general have been higher in urban areas than in rural, though the numbers of
unemployed are much larger in the latter than the former. Similarly one finds a higher level of
unemployment among the females than the males. There was substantial variation in the
unemployment rates by gender which suggests that 5.4% of males and 9.3% of females were
recorded as unemployed in 2005-06 (see table 8 below). Age specific unemployment rates yielded a
high level of unemployment among teenagers and the elderly (60+) for males. In the case of
females the unemployment rates rose up to the age of 24 and then declined and again rose to an
alarming 36% for those 60 years and above. Overall, the unemployment rates are high among
teenagers (entering the labour market) and the elderly (beyond retirement age). This U-shaped
relationship, wherein almost one thirds of the unemployed are teenagers, suggests stability during
adult working life as well as lack of mobility as a manifestation of the nature of job scarcity. Table
below provides age specific unemployment rate for 2001-2006.

Background Situation Analysis of Pakistan‘s TVET System Section I
Janjua and Irfan (SEBCON PVT LTD) 19
Table 8: Age-Specific Unemployment Rates (%) by Gender 2001-2006
Age group 2001/02 2003/04 2005/06
Male Female Both Male Female Both Male Female Both
10-14 13.6 10.4 12.8 16.3 17.5 16.5 8.8 5.7 7.9
15-19 12.8 14.9 13.2 15.4 23.9 16.2 10.0 9.8 10.0
20-24 9.3 15 10.3 9.1 20.6 10.9 6.9 9.4 7.4
25-29 6.1 12.5 7.1 5.1 13.2 6.3 4.3 7.3 4.9
30-59 2.9 8.7 4.0 2.7 11.4 4.2 3.8 11.7 5.3
60 + 10.3 44.2 14.5 8.9 45.6 13.7 10.2 36.0 14.2
Total 6.6 12.8 7.7 6.7 16.6 8.3 5.4 9.3 6.2
Source: Tabulations based on Labour Force Survey data.
Unemployment rates for adult male were lower in 2005-06 compared with the situation in 2001-02.
In the case of females, the unemployment rates ran contrary. The composition of the unemployed
suggested that around half of them belonged to the age cohort 15-24 (the youth) whereas the share
of the elderly was 12%. In fact, the youth, particularly the educated among them, suffer from a
disproportionately higher burden of unemployment.
g) Educational Profile of the Employed
According to Labour Force Statistics (LFS), 2005-06, 53.1% of the labour force is considered
literate while literacy stands at 43.95% in rural and 69.8 % in urban areas. Therefore, the majority
of illiterate labour force is concentrated in the rural areas. Approximately, 65% of male and 40.6%
of female respondents were reported as literate. The educational profile of the employed is
suggestive of a decline in the share of illiterates from 60% in 1993/94 to 47% in 2005-06. All the
remaining educational categories experienced a rise in their relative shares during the recent sub
period. Those with matriculation (10 years of schooling and higher educational attainments)
increased their relative share from 15% in 1993-94 to 21.7% in 2005-06 in the total employment.
Table 9: Unemployment Rates by Gender and Level of Education
Education Level 2001/02 2003/04 2005/06
Both Male Female Both Male Female Both Male Female
Illiterate 6.6 5.2 11.0 7.5 5.6 15.0 5.7 4.6 8.0
Primary 7.4 5.8 20.2 8.0 7.0 20.0 6.0 5.5 NA
Middle 9.8 8.6 16.2 9.3 8.6 22.7 5.8 5.4 NA
Matric 10.4 9.3 21.2 9.7 8.1 25.3 7.6 7.0 14.62
Intermediate 12.5 9.7 21.9 10.0 8.3 20.3 8.1 7.0 NA
BA & above 8.8 6.9 23.0 8.9 7.7 16.5 7.0 6.2 12.5
Source: Tabulations based on Labour Force Survey data.
h) Education Specific Unemployment Rates
In case of females, the data for 2001-06 suggest a positive association between the level of
education and the rate of unemployment, in contrast to 8% unemployment rate of the illiterate
females the matriculates and the graduate females were suffering from 14.62% and 12.5%
respectively for the year 2005-06 (see table 9 above). Similarly male graduates and post-graduates
exhibited higher levels of unemployment compared to illiterates in 2005-06. This association
between levels of education and unemployment rates is yielded by all the labour force surveys as
reflected by the table below. An inter-temporal comparison indicated a curtailment in the
unemployment rate of the educated male, during 2001-06. While 9% of the graduates were reported
to be unemployed in 2001-02 the corresponding proportion for 2005-06 was 7%. For the year 2005-

Background Situation Analysis of Pakistan‘s TVET System Section I
Janjua and Irfan (SEBCON PVT LTD) 20
06 the unemployment situation for the educated eased somewhat, compared to 2003-04 there was a
decline in their unemployment rate as given below in the table.
1.4.2 Youth Labour Force
In the context of Pakistani labour market youth is defined as persons aged between 15 and 24 years.
The share of youth in workforce is increasing as well. The Youth age group constitutes about 20%
of the labour force. However, they make up for almost half of the countries unemployed. Even
though Youth unemployment has been declining ever since 2001-2002, the Youth unemployment
rate almost doubles the adult unemployment rate. The provincial distribution of Youth labour force
in 2007-08 is estimated to be as follows: Punjab 58%; Sindh 24%; NWFP 14%; and Baluchistan
4%. Official estimates of labour force exclude children working under 10 years of age; however,
many enter the labour force by the age of 10 years or less32
. Moreover, majority of children work in
the rural areas in agriculture sector and the urban informal sector (see Jilani). This may also be
supported by the fact that primary and secondary dropout rates especially for males, who are
considered sole bread earners in cultural context, are higher than females33
.
1.4.3 Informality of the Labour Market
In case of non-agricultural segment of the economy, all the self employed, and employment in the
enterprises having less than 10 employees are counted as informal while the remaining non-
agricultural employment is defined to be the formal sector. There appears to be a rise in the relative
share of the informal sector being 64.6% in 2001-02 to 72.9% in 2005-06. This rise has been
experienced by both the genders in rural as well as urban areas, though the share of formal sector is
higher in urban areas than in rural. In terms of industrial classification almost one-fifth of the
informal employment is accounted by manufacturing, in case of female this is the largest single
employer where 57.1% of the female informal employment is provided in 2005-06. One third of the
informal employment is generated in the trade sector where males dominate (see table 9).
Table 10: Informal Sectors Workers – Distribution by Major Industry Divisions
Major Industry Division 2001/02 2005/06
Total Male Female Total Male Female
Total 100.0 100.0 100.0 100.0 100.0 100.0
Manufacturing 20.9 17.3 57.5 21.3 17.0 57.1
Construction 13.9 15.1 1.3 13.8 15.3 1.7
Wholesale and Retail Trade 34.0 36.5 7.6 34.5 37.6 8.9
Transport, Storage and Communication 11.7 12.7 1.0 11.1 12.3 0.9
Community, Social and Personal Services 18.9 17.6 32.4 17.7 16.1 31.2
Others (includes mining, quarrying; electricity, gas &
water, finance, insurance, real estate & business services
0.7 0.8 0.2 1.6 1.7 0.2
Source: Labour Force Surveys
32
Though the government has stepped up its efforts to eradicate child labour, the informal sector remains the biggest
employer of children. The government and donor agency funded programmes to eliminate child labour mostly focus on
formal sector or industries where informal sector has strong linkages with the formal sector (mainly in the exports goods
products because the government and private sector both do not want a restriction on their exports by importing
countries). 33
The Pakistan Child Labor Survey –PCLS (1996) reveals that the majority of child labor is among boys and it
increases with age. Male child labor is higher in contrast to female child labor in both urban and rural areas. The Punjab
province ranks the highest in child labor followed by NWFP.
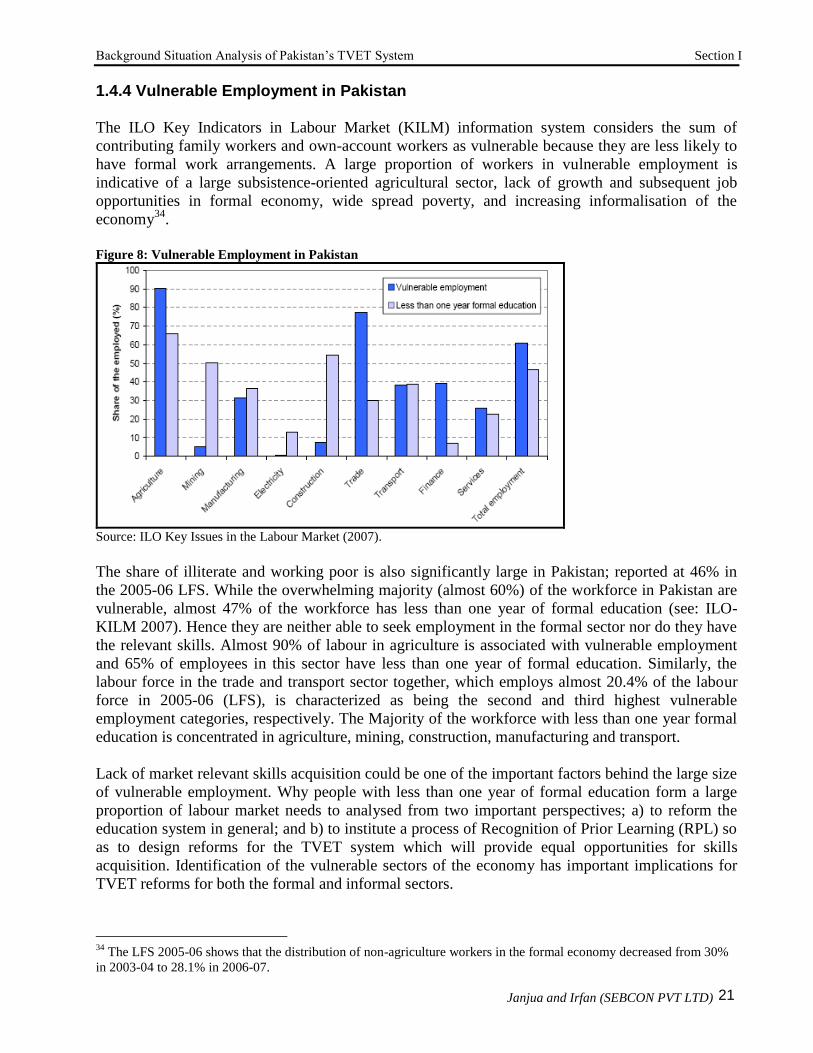
Background Situation Analysis of Pakistan‘s TVET System Section I
Janjua and Irfan (SEBCON PVT LTD) 21
1.4.4 Vulnerable Employment in Pakistan
The ILO Key Indicators in Labour Market (KILM) information system considers the sum of
contributing family workers and own-account workers as vulnerable because they are less likely to
have formal work arrangements. A large proportion of workers in vulnerable employment is
indicative of a large subsistence-oriented agricultural sector, lack of growth and subsequent job
opportunities in formal economy, wide spread poverty, and increasing informalisation of the
economy34
.
Figure 8: Vulnerable Employment in Pakistan
Source: ILO Key Issues in the Labour Market (2007).
The share of illiterate and working poor is also significantly large in Pakistan; reported at 46% in
the 2005-06 LFS. While the overwhelming majority (almost 60%) of the workforce in Pakistan are
vulnerable, almost 47% of the workforce has less than one year of formal education (see: ILO-
KILM 2007). Hence they are neither able to seek employment in the formal sector nor do they have
the relevant skills. Almost 90% of labour in agriculture is associated with vulnerable employment
and 65% of employees in this sector have less than one year of formal education. Similarly, the
labour force in the trade and transport sector together, which employs almost 20.4% of the labour
force in 2005-06 (LFS), is characterized as being the second and third highest vulnerable
employment categories, respectively. The Majority of the workforce with less than one year formal
education is concentrated in agriculture, mining, construction, manufacturing and transport.
Lack of market relevant skills acquisition could be one of the important factors behind the large size
of vulnerable employment. Why people with less than one year of formal education form a large
proportion of labour market needs to analysed from two important perspectives; a) to reform the
education system in general; and b) to institute a process of Recognition of Prior Learning (RPL) so
as to design reforms for the TVET system which will provide equal opportunities for skills
acquisition. Identification of the vulnerable sectors of the economy has important implications for
TVET reforms for both the formal and informal sectors.
34
The LFS 2005-06 shows that the distribution of non-agriculture workers in the formal economy decreased from 30%
in 2003-04 to 28.1% in 2006-07.

Background Situation Analysis of Pakistan‘s TVET System Section I
Janjua and Irfan (SEBCON PVT LTD) 22
1.4.5 Labour Market Information System
It has been mentioned earlier, the Federal Bureau of Statistics (FBS) is responsible for collecting
and processing information on Pakistan‘s labour market. It has been conducting a labour force
survey for the last 40 years. The FBS has been producing a comprehensive report on Pakistan‘s
labour market. However, the labour force survey does not cover the labour force employed in the
agricultural sector. Apparently a lot of information is not processed for policy formulation.
Similarly, information on technically and vocationally educated and trained labour force is not
adequately covered. Although some information on TVET is collected in the survey, it is not
processed to produce reports. An effort has been made in this regard and TVET information
contained in LFS 2005-06 has been processed and reported in section 7 of this paper.
In June 2007, the Labour and Manpower Division within the Ministry of Labour, Manpower and
Overseas Pakistani (MLMOP) launched the Pakistan Employment Trends Series under Labour
Market Information and Analysis (LMIA) system. The information contained in Pakistan LFS is
used to compile ten of the internationally renowned Key Indicators of the Labour Market with the
help of the International Labour Organization (ILO) and UNDP. The LMIA Unit has published
Pakistan Employment Trends reports namely: ―Ten Key Labour Market Indicators (KLMI)‖ and
―Skills Development.‖ A third report on provincial and local labour market information and youth
labour market issues is due for publication in 200835
.
1.5 Profile of TVET Trained Work Force in Pakistan
The FBS also collects information on technically educated and vocationally trained labour in its
LFS module. In the module it is referred as Technical and Vocational Training (TVT) and the
information is collected for all those who are aged ten years and above36
. The tables reported here
are extracted from LFS 2005-06 dataset and are not reported by the FBS in the LFS summary
report.
Table 11: Percentage of Population (Age 10+) who had TVET by Age Groups
S.No. Age Group Male Female Total
1 10-14 0.03 0.05 0.04
2 15-19 0.72 0.47 0.60
3 20-24 2.11 1.05 1.57
4 25-29 2.42 0.58 1.46
5 30-34 2.12 0.54 1.28
6 35-39 2.46 0.27 1.32
7 40-44 1.85 0.36 1.12
8 45-49 2.05 0.20 1.17
9 50-54 1.04 0.07 0.57
10 55-59 1.13 0.18 0.69
11 60+ 0.70 0.06 0.43
12 Total 1.32 0.40 0.87
Source: From LFS 2005-06 database
According to LFS, only 0.87% of the population (age group 10 years and above) have ever
completed any technical and vocational training. A relatively higher proportion of males in contrast
35
The Economic Survey of Pakistan 2007-08, page 201. 36
It is worthwhile to note that FBS uses the term TVT instead of TVET in statistical data collection and reporting. The
term TVT is followed here in this section so as to remain consistent with the FBS definition and methodology.

Background Situation Analysis of Pakistan‘s TVET System Section I
Janjua and Irfan (SEBCON PVT LTD) 23
to females have reported technical and vocational training; 1.32% males in contrast to female
0.41%. Out of those technically and vocationally trained almost 80% joined labour force (male
participation being 89% while female corresponding percentage is 48.8%). The age specific
distribution of population who have ever received technical and vocational education and training is
reported in Table 11 below. In 20 to 49 age range more than 2% of the male labour force is reported
to have technical and vocational skills, while females are reported slightly higher than 1% in
relevant age group (see table 11 below).
The level of education by gender of the population aged 10 years and above who have received
TVET is reported in table 6. The proportion of population with TVET increases with the level of
education. In 2005-06, LFS reports 46.9 percent of the population 10 years and above as illiterate;
of which only 0.142 percent have TVET (see table 12 below). Similarly, only 0.28% of total
illiterate male population and 0.06% of total illiterate female population has any technical and
vocational training37
. Almost 8.79% of total population has less than primary education; of which
only 0.16% have TVET (see table 12 below). Moreover, 10% of the total population in relevant age
group has education up to Matric but less than intermediate - of which 2.89% have acquired
technical and vocational training.
Table 12: Percentage of Population (Age 10+) who Received TVET by Level of Education and Gender
S.No. Level of Education Male Female Total
1 Illiterate 0.28 0.06 0.14
2 Less than primary 0.17 0.15 0.16
3 Primary but less than Middle 0.59 0.19 0.43
4 Middle but less than Matric 0.73 0.73 0.73
5 Matric but less than Intermediate 3.43 1.95 2.89
6 Inter less than BA 5.64 1.83 4.17
7 BA 6.13 2.18 4.61
8 MA+ 5.52 3.53 4.87
9 Professional 6.26 2.27 5.37
Source: From LFS 2005-06 database
1.5.1 Demand for TVET Labour in Pakistan
It is important to find out the demand for technically and vocationally educated and trained
population. The table below gives the distribution of formally trained labour population among
major industries. The service sector is the largest employer of technically trained population.
Services combined with wholesale & retail trade and transport and storage employs 63.67% of the
TVET Population in Pakistan. Moreover, the services sector is the largest employer of TVET
female population; it employs 60.22% of the female TVET population while the manufacturing, the
second largest employer, absorbs 24.89% of the TVET female population. For male population the
services, manufacturing, transport and storage, and wholesale and retail trade sectors are the biggest
employers in order (see table 13 below).
Information on the type of technical and vocational training acquired is distributed among 43 codes
in the LFS. Types of technical and vocation training received by males and females are reported in
table given in Annex 2. A major limitation is that LFS survey does not ask if the training was
obtained through formal, non-formal, or informal means. Only recently, in 2006-07 the LFS has
37
The illiteracy rate is reported as 35% among males and 59.4% among female labor force which means 13 million
male and approximately 6 million female labor force is illiterate.

Background Situation Analysis of Pakistan‘s TVET System Section I
Janjua and Irfan (SEBCON PVT LTD) 24
started asking questions about the length of the training as well; however, our analysis is limited to
2005-06 dataset because the latest dataset was not readily available for analysis. Among all reported
courses, computer courses rank the highest for both male and female while in case of female
embroidery and knitting are the second most prominent training courses. For men, aside from IT,
the top 10 courses include driving, electrician, draftsman and engineering related course. For
women, aside from IT and embroidery, the top most courses include garment making, weaving,
draftswoman, nursing, midwifery, and lady health visitor.
Table 13: Distribution of TVET population Employed by Industry 2005-06
S.No. Industry Male Female Total
1 Agri. Fishery Hunting 7.79 2.63 7.28
2 Manufacturing 20.41 24.89 20.96
3 Electricity Gas and Water 2.46 2.16
4 Construction 1.69 1.49
5 Wholesale & Retail Trade 13.02 6.01 12.17
6 Transport & Storage 15.83 1.61 14.10
7 Financing Insurance & Rent 3.93 3.64 3.89
8 Services and other 34.22 60.22 37.40
9 Total 100 100 100
Source: From LFS 2005-06 database
1.5.2 Employment Status of TVET population
The majority of the technically and vocationally trained wage employees are absorbed in the formal
sector among which the public sector is a major employer which absorbs 40.27% of TVET labour
force (see table 14 below)38
. According to LFS only 26.28% of technically and vocationally trained
population is absorbed in the non-agriculture informal sector. All self employed or family workers
are considered to be employed in informal sector, by default LFS definition.
It must be kept in mind that LFS excludes the agricultural sector while it is the major employer of
labour force. However, if any TVET are employed in agriculture they are considered to be
employed in the informal sector as per FBS classification. Based on available statistical sources, it
is impossible to find out the number and percentage of TVET population absorbed in this sector.
Table 14: Percentage Distribution of Technically Trained Wage Employees by Type of Enterprise
S.No. Type of Enterprise Male Female Total
1. Formal Sector
a. Government 39.56 44.62 40.27
b. Corporate Sector 28.58 17.60 27.04
c. Formal (Unincorporated) 5.58 3.91 5.35
2. Informal 26.28 33.86 27.34
Total 100 100 100
Note: Information by Type of Enterprise is available only for wage employees.
Source: From LFS 2005-06 database
The table 14 reports the distribution of wage employees only. It excludes self employed and unpaid
family helpers. Employment status of all TVET workers is reported in the table 15 below. Only
31.24% of TVET population seems to be self employed (1.62% are employers while 29.62% are
own account workers who do not employ others). A Majority (71%) of TVET females work as
38
The wage employees are those who receive monthly salaries both in the formal or informal sector.

Background Situation Analysis of Pakistan‘s TVET System Section I
Janjua and Irfan (SEBCON PVT LTD) 25
employees which indicate that TVET helps them find employment opportunities. Only 24.54% are
self employed as employer or own account workers. Hardly 6% work as unpaid family helpers.
Table 15: Percentage Distribution of TVET population by Employment Status
S.No. Employment Status Male Female Total
1 Employee 62.04 71.11 63.15
2 Employer 1.69 1.09 1.62
3 Own account workers 30.48 23.46 29.62
4 Unpaid Family Helper 5.79 4.35 5.62
5 Total 100 100 100
Source: From LFS 2005-06 database
The occupational choice of TVET population is reported below in table 16. The majority of the
TVET population is employed as technician, craft workers, and machine operators. For males the
occupational choice is ranked as craft workers, technicians, officials, plant operators, etc. For
females the occupational choice is ranked as technicians (includes nursing, LHV etc.), craft
workers, clerks and professionals.
Table 16: Percentage Distribution of TVET Population by Occupation (2005-06)
S.No. Occupation Male Female Total
1 Senior Official 16.06 1.38 14.26
2 Professional 5.12 8.40 5.52
3 Technician and Related Works 21.47 47.58 24.66
4 Clerks 5.45 8.51 5.83
5 Services or Sale worker 4.51 4.51 4.51
6 Skilled Agriculture Labour 6.10 3.63 5.79
7 Craft and Related Worker 22.94 21.53 22.77
8 Plant or Machine Operator 15.94 0.60 14.07
9 Elementary Occupation 2.41 3.86 2.59
Total 100 100 100
Source: From LFS 2005-06 database
1.5.3 Supply of Pakistani TVET Labour to Overseas Markets
It is difficult to assess the demand for Pakistan‘s informally and formally trained labour in other
countries; however, one can see the patterns of labour supply over past few years to get an idea of
what is being demanded from Pakistan‘s labour pool. According to the available statistics casual
labour, drivers, and skilled construction workers are in the highest demand and hence supplied to
other countries by overseas recruiters. The distribution of Pakistan‘s labour force supplied to
overseas markets is give in annex table 3 which is adapted from the World Bank (2007) report on
infrastructure implementation capacity (The original table is also given in annex4). It is difficult to
comment on the distribution of formally and informally trained labour force supplied to the
international markets. However, 46% of the manpower exported from Pakistan in 2005 comprises
casual labour, which might be either informally trained or has not received any training. The
remaining 54% are assumed to be trained through formal training schemes and also in the informal
sector. The drivers and construction workers seem to be in high demand.
Background Situation Analysis of Pakistan‘s TVET System Section II
Janjua and Irfan (SEBCON PVT LTD) 26
II GENERAL EDUCATION AND TVET SYSTEM IN PAKISTAN
2.1 General Education and TVET Policy in Pakistan39
Education plays an important role in human capital formation. Not only does it opens up various
earning opportunities but has positive externalities for economic growth as well. Though the
founder of Pakistan had placed high emphasis on education Pakistan has not made much progress.
He said the following in his speech in 1947:
There is no doubt that the future of our State will and must greatly depend upon the
type of education and the way in which we bring up our children as the future
servants of Pakistan. Education does not merely mean academic education, and even
that appears to be of a very poor type. What we have to do is to mobilize our people
and build up the character of our future generations. There is immediate and urgent
need for training our people in the scientific and technical education in order to
build up future economic life, and we should see that our people undertake scientific
commerce, trade and particularly, well-planned industries. But do not forget that we
have to compete with the world, which is moving very fast in this direction. Also I
must emphasize that greater attention should be paid to technical and vocational
education40
.
The message did not carry through probably due to political upheavals that followed after his death.
Neither general education nor the TVET have received much attention by successive governments.
The state of neglect is evident from historical allocations for education in the overall budgets. The
education budget has been the lowest in the region. The constitution of Pakistan also recognizes the
need for technical education provision and states in Article 37 (b) & (c) that41
:
"The state shall remove illiteracy and provide free and compulsory secondary
education within minimum possible period; make technical and professional
education generally available and higher education equally accessible to all on the
basis of merit"
This statement is emanating from the fact that the writers of the constitution did envision a
knowledge economy. In knowledge economies countries with better human resources and high
productivity have a comparative advantage over their competitors. Pakistan is far from reaching this
elusive goal because it is still stuck with outdated technologies (King 2007). There are skill and
technology gaps not only in industry but within the TVET system as well. Many training curricula,
technologies, labs and machines are outmoded and training provided in TVET does not match
market demand.
39
In past policy documents used the word Technical and Vocational Education (TVE) only instead of TVET. 40
http://www.pakistan.gov.pk/Quaid/speech13.htm 41
http://www.na.gov.pk/publications/constitution.pdf

Background Situation Analysis of Pakistan‘s TVET System Section II
Janjua and Irfan (SEBCON PVT LTD) 27
Realizing the plight of TVET, the government embarked upon a mission to train Pakistan‘s
manpower to meet the challenges of the new Millennium. Given the historical shortcomings in
TVET policy making the National Skills Strategy (NSS) vision prepared by NAVTEC may be
considered the first ‗thinking out of the box‘ policy on TVET in Pakistan. It may be worthwhile to
mention that founders of Pakistan considered the establishment of Technical Education Council
(TEC) in 1947, during first ever educational conference after independence42
. Yet the vision
materialized after almost 60 years in the form of NAVTEC.
In 1998, the government of Pakistan came up with National Education Policy (NEP) 1998-2010.
Though it announced a ‗no child left behind‘ policy and claimed that every child 6-12 years will be
in school within five years, thus attaining universal literacy in 15 years; however, 10 years have
passed to date (2008) and the results are far from impressive. The NEP did incorporate a component
on TVET. The objectives of TVET policy were exhaustive; however, it lacked a visionary approach
to achieve the targets set in the policy document. Later Vision 2030 document incorporated a rather
ambitious policy for the TVET as a subsector of education. A medium term development
framework was subsequently prepared to make progress on the Vision targets. It is imperative to
mention that while past policy approaches to TVET considered it important for economic
development, they could not come up with a strategy to disassociate the stigma attached to it. The
NEP, in its paragraph 8.1.3, mentions that over 50% of students fail at the higher secondary
education stage. Those who drop out and those who pass out with poor grades are unable to find
jobs and need employable skills; therefore, there is a need for shift toward more powerful TVE43
for
human Resource Development (HRD) in Pakistan. TVET reform must, of course, be complemented
with other reforms especially those concerning employment policy and those related to creating a
favourable socio-economic environment within which skills can be used. TVET reform alone does
not help to create jobs. As long as a mindset remains that considers technical education only for
those who are unable to go forward in general education the development of TVET system will
remain handicapped. There is a need to mainstream TVET in Pakistan to disassociate the stigmas
attached to it. It must be understood that everyone may not be destined for white collar jobs as
people are born with different abilities and talents. It is imperative to mention that an elaborate
TVET system needs to allow good students to come on board learn skills and continue onwards for
higher education and training. At present universities do not recognize certificates and diplomas of
technical and vocational education stream students as they are not only associated with the stigma
described above yet considered incompetent for the reasons aforementioned. It is better to spell out
in policy documents that TVET policy focuses not only on those who are less inclined towards a
structured general education programme but also for those who are keen in taking practical based
learning path. It does not necessarily have to be for less gifted and dropouts only. ADB 1999 report
contends that the training quality was ignored in courses because of undue attention to establishing
training opportunities for disadvantaged segments of the population. This also ascertains the
argument that the stigma attached to TVET is due to narrow focus of TVET polices in past.
It is claimed in policy documents that the TVE44
in Pakistan is designed for dropouts from schools
yet the curriculum is heavily focused on theory instead of practical. Therefore, the training
component was ignored. Only recently the Vision for Skilling Pakistan has acknowledged the due
role for training in TVET reform. Pakistan‘s TVET system focuses more on rote learning rather
42
Shah 2004. 43
The Education policy document refers to TVE instead of TVET which may imply that earlier policy makers were
either aware of emphasis on training part or there were no TVET experts on the policy making panel. 44
Shah (2004)

Background Situation Analysis of Pakistan‘s TVET System Section II
Janjua and Irfan (SEBCON PVT LTD) 28
than hands on practical approach. Though government recognizes it as part of the overall education
system, it is disconnected from the rest of the education system. There are hurdles to progression
not only within the TVET stream but also from TVET to general stream of education. It has failed
to cater for the needs of the growing knowledge economy because of its low-skills and low
technology orientation. Such a system of education and training has far reaching impact on the
economy and the nation. Manufactured products of a low skills and technology oriented system
cannot compete with the rest of the world. Besides, the TVET system is supply oriented rather than
being driven by labour market demand.
Since the 1970s, there has been immense growth in TVET providers in Pakistan‘s public and
private sector; however, its characterization did not change. The expansion under the Agency for
Barani Area Development (ABAD) project was mostly towards strengthening agricultural
practices45
. The ABAD helped to establish numerous agro-technical institutes across Punjab.
However, the expansion in Pakistan‘s TVET system is not considered in line with the expansion
and diversification in the job market46
. The statistical information on Pakistan‘s TVET system is not
credible. For instance, the UNESCO-UNEVOC (1996) reports more than 5000 TVET institutions
while the most recent National Education Census (2005-06) reports only 3,059 TVET service
providers in public and private sector (this differs from the statistics reported in Pakistan Education
Statistics 2005-06). There is a consensus among TVET policy makers that a lot needs to be done in
this regard.
2.1.1 The 1958 Commission on National Education
Munir (2002) provides a review of Pakistan‘s education policy. Historically, the Education policy
addressed the TVET in the country. It is worthwhile to note that different government documents
use the terms TVE, TVT, VTE and TVET interchangeably. Most documents seem to emphasize on
TVE which raises a question about policy makers understanding of the role for training in TVET.
As mentioned above, in the past, a major emphasis has been on rote learning in TVET and less on
practical. For a successful TVET programme theoretical and training/practical component should be
larger; if not 30:70 then at least 50:50. Although Hassan (2007) found a maximum of 50:50
composition; however, practical are not undertaken either due to lack of laboratory facilities, lack of
qualified staff, or simply because of lack of raw materials.
The Commission on National Education (The Commission) was established in 1958 to reorient the
educational system. The commission conducted extensive review of the education and TVET
system in Pakistan and identified following four categories of technical and vocational training: a)
at the lowest level -- the manual labour, b) the trained and skill labour who can operate machinery,
c) technicians at supervisory level, and d) creative engineers and executives. In order to facilitate
these four levels of trainings sweeping reforms were introduced. The pre-vocational, vocational,
technical programmes were introduced at different levels. Subsequent policies reflected the agenda
and the reform programme of the 1958 Commission47
.
45
ABAD focused on rain fed areas of the Punjab province. Its objective is to develop medium scale infrastructure for
development in rural areas and provides support to line agencies at district level on need basis which includes hiring
staff on contract, provision of equipment, transport and training. It focuses on targeted poverty alleviation by funds to
Women Community Organizations (WCO) and by promoting literacy through skills training (see ADB 2002). 46
UNESCO-UNEVOC (1996) 47
Munir (2002)

Background Situation Analysis of Pakistan‘s TVET System Section II
Janjua and Irfan (SEBCON PVT LTD) 29
2.1.2 Education Polices since 1970’s
The new education policy 1972-80 envisaged skills training for primary school dropouts. Special
training courses were designed and introduced in primary schools and post-primary (middle)
schools to meet the vocational training needs of students. Several polytechnics were further
upgraded to colleges of technology to allow Diploma of Associate Engineering (DAE) to progress
further into higher technical education and attain Bachelor of Technology (B.Tech). Many new
courses and diplomas were also introduced in technical and vocational institutions. A massive shift
occurred from general education to agro-technical education especially in rural areas48
.
The 1981-1991 era focused on Islamisation of education. Hence the educational syllabus and
curricula at all levels were revised and Islamic education courses were introduced in general
education and technical and vocational education49
. The 1991 to 2002 period may be characterised
as post Islamisation period due to shift in policies. After the death of General Zia-ul-Haq, the
Pakistan Peoples Party (PPP) came to power in 1990 and revised educational policies implemented
by the previous regime. The new education policy 1992-2002 recognized the sizeable growth in
technical vocational and agro-technical institutions in country; however, it underlined the need for
aligning the TVET system with the labour market. The policy acknowledged the necessity of
reorientation of the TVET system and its linkage with general education. Under the new initiative
technical teacher training colleges were established in all the four provinces. These colleges were
linked with the National Teachers Training College (NTTC) at the federal level. The policy also
realized the need for incorporating computer education in TVET curriculum.
The 1988-2001 was a period of political upheavals in Pakistan. None of the governments were
allowed to complete their term. In 1997, the Nawaz Shairf government came back after the
dismissal of Benazir Bhutto‘s government. The new government came up with a new education
policy in 1998. The 1998-2010 education policy is the last known complete policy document on the
subject with a long-term focus. However, the TVET component of education policy was the
weakest part of the document and lacked an implementation plan. In 2005, the Ministry of
Education (MoE) launched a review of the education policy and prepared a ‗White paper‘ as well as
so-called ‗Green papers‘ on education policy and sector50
. The ‗White paper‘ acknowledged that the
previous policy framework failed to provide guiding principles necessary for meeting the challenges
of new millennium. In order to achieve the MDG and Dakar Education for All (EFA) goals as well
as the challenges of globalization and new knowledge economies, a comprehensive review of the
education policy is necessary so as to provide lessons learned and guidelines for formulating a new
one. It is interesting to note that the Green paper 2006 and National Education Policy Review 2006
hardly mentioned TVET.
2.1.3. Phases in Pakistan’s TVET Development
Hassan (2007) identifies six distinct phases in technical education policy in Pakistan based on
changing patterns in policy objectives and its implementation. These phases are reported as follows:
Phase I (1947-1958) Initial Policy Formulation Stage
Phase II (1959-1970) Expansion and Development Period
48
Shah (2004) 49
Munir (2002) 50
GoP (2007)

Background Situation Analysis of Pakistan‘s TVET System Section II
Janjua and Irfan (SEBCON PVT LTD) 30
Phase III (1971-1977) Experimentation Period
Phase IV (1977-1988) Second Expansion Period
Phase V (1989-1997) Quality Improvement
Phase VI (1997-2010) Good Governance for Self Reliance
The table 17 below reports all the six phases in TVET system development and is adopted from
Hassan (2007).
Table 17: Phases of TVET System Development in Pakistan
Phase Educational Initiatives Development Plans
Phase I
(1947-1958)
Initial Policy Formulation
Stage
Pakistan Educational Conference 1947
Report of Technical Education Committee
Survey of Technical Education, Ford
Foundation 1955
Development of first Polytechnic Curricula
1954-5
Six-Year Development
Plant (1951-57)
First Five-Year Plan (1955-
60)
Phase II
(1959-1970)
Expansion and
Development Period
Reprot of Commission on National Education
1959
Manual Standards for Polytechnics, 1962
Report of Commission on Student Problems
and Welfare 1966
Manpower and Education Commission 1966
Proposals for New Education Policy 1970
Second Five Year Plan
(1960-65)
Third Five Year Plan (1965-
70)
Phase III
(1971-1977)
Experimentation Period
Education Policy 1972-80
Introduction of B-Tech Courses 1972
Introduction of Metric Tech courses 1973
Revision of Polytechnic curricula 1976
Fourth Five Year Plan
(1970-75) never
implemented
Annual Development Plans
Development Perspectives
(1975-85)
Phase IV
(1977-1988)
Second Expansion Period
National Education Conference 1977
National Education Policy 1978
National Education Policy and
Implementation Plan1979
Fifth Five Year Plan (1978-
83)
Sixth Five Year Plan (1983-
88)
Phase V
(1989-1997)
Quality Improvement
National Education Conference 1989
National Education Policy 1992-2002
Polytechnic Curricula Revised, 1996 (Annual
System)
Commencement of Second ADB Technical
education Project (1996)
Seventh Five Year Plan
(1988-98)
Eighth Five Year Plan
(1993-98)
Phase VI
(1997-2010)
Good Governance for Self
Reliance
Development of Vision 2010 (1997)
National Education Policy 1998-2010
Vision 2030
National Education Policy Review 2005
NAVTEC Established in 2006
National Education Policy 2008
Vision of National Skills Strategy
Ninth Five Year Plan (1998-
2003)
NSS and its Implementation
Plan still in making
Source: Adapted from Hassan (2007)
Recently (in 2008), the government has started work on a new educational policy. The draft
education policy 2008 has pinpointed major deficiencies and recognised the existing gaps in
resource commitment and plan implementation. The new policy document recognizes the need for
strengthening skill development and innovation through technical and vocational education. The

Background Situation Analysis of Pakistan‘s TVET System Section II
Janjua and Irfan (SEBCON PVT LTD) 31
document also recognizes the role of TVET in supplying skilled manpower to the country‘s labour
market as well as the need for reforming of TVET to make it demand oriented rather than supply
driven. The 2008 draft education policy document pinpoints the following problems in the existing
TVET structure:
General neglect of the TVET system in past
No system of progression to higher level skills and education
Low quality student intake into polytechnics
Fragmented structure of governance in TVET system
Lack of coordination between stakeholders
Low standard of skills training
Outdated and outmoded technologies and machinery in training centres
Weak linkages with other education sectors and the labour market
Supply oriented rather than demand led
The education policy document in fact provides a gist of the vision for NSS prepared by NAVTEC.
The 2008 draft policy emphasizes the need for developing demand led TVET system. It suggests
the following policy actions:
Establishment of a competency based National Qualifications Framework (NQF) along with
a changed TVET programme structure that encompasses all qualifications in the country,
both academic and vocational/technical.
The proposed NQF may involve all stake holders and international experts in development
process. The fully developed system should allow for horizontal and vertical mobility
between academic and applied streams, with clearly mapped out recognition of credit points
for each competency level.
Advisory role for business sector in advising on the course and programme content,
internship and job opportunities for students in TVET stream.
Strengthening of linkages between TVET institutions and the business sector for orientation
on business needs and new technical requirements.
Development of a coordination mechanism between higher education, school education and
technical, vocational education to resolve governance issues51
.
Government shall develop a suitable framework for technical and scientific education and
training with close involvement of Chambers of Commerce and Industry.
The policy requires the government to establish the following:
vocational training centre in every Tehsil where there is none
Polytechnic institute for every District (Agency in FATA)
Colleges of technology in each Province/Area on a needs basis.
2.2 General Education System and TVET
Pakistan‘s education system did not change much since independence. The formal education system
consists of primary education (classes 1-5), middle (6-8), secondary (9-10), and higher secondary
(also known as intermediate or FSc) beyond which two more years of education may be acquired
towards a graduate degree (BA/BSc) while universities offer Masters, M. Phil, and PhD degrees.
51
The policy section on TVE in education policy 2008 is brief and there is more than coordination that needs to be done
to improve governance.

Background Situation Analysis of Pakistan‘s TVET System Section II
Janjua and Irfan (SEBCON PVT LTD) 32
Similarly, professional colleges and engineering universities are offering education to medical
doctors and engineers beyond intermediate level. Recently, the participation of private sector has
opened new avenues and in major cities private institutions have introduced a parallel system of
education consisting O and A levels in affiliation with British universities. The exams are
administered through the British Council of Pakistan. Similarly, four year bachelor degrees in
general education stream have also been introduced. The technical education stream is embedded in
some middle and secondary schools; however, institutions for vocational and technical education
exist with little mobility from TVET to general education.
In Pakistan, the technical education as per UNESCO recommendations is considered, in theory, an
integral part of general education which prepares students to accept a technical occupation or
continue further education. However, in practice it is different. According to Shah (2004) technical
education in Pakistan refers to industrial technology offered in polytechnic and mono-technique
institutes, colleges of technology and technical colleges to train mid level technical professional
(sub-engineers) for industry. The vocational education on the other hand prepares skilled workers.
Table 18: Primary and Middle Gross Enrolment Ratio and Net Enrolment Ratio
Male Female Both Male Female Both
Ever attended school (10 years and above) Primary or Higher (10 years and above)
Total 69 44 57 Total 56 35 46
Urban 80 66 73 Urban 48 23 36
Rural 63 32 48 Rural 70 57 64
Primary GER (ages 5-9)52
Primary NER (ages 5-9)
Total 99 81 91 Total 60 51 56
Urban 108 104 106 Urban 67 65 66
Rural 95 72 84 Rural 57 46 52
Middle GER (ages 10-12) Middle NER (ages 10-12)
Total 57 44 51 Total 20 16 18
Urban 69 68 69 Urban 27 27 27
Rural 52 32 43 Rural 17 11 14
PSLM 2007-08
The latest source of information for education is the Pakistan Social and Living Standard (PSLM)
survey 2006-07 and National Education Census (NEC) statistics 2005-06. According to PSLM, the
Gross Enrolment Rate (GER) at primary level is 91% and for middle level is 51% (see table 18
above). Yet the drop out rates are high and the Net Enrolment Rate in primary education is 56% and
in middle level is 18%. It is interesting to note that among South Asian countries, Pakistan has made
relatively slower progress towards increasing literacy over the last twenty years53
. The overall
literacy rate in Pakistan is reported as 54% (65% for males and 42% for females) in 2005-06.
According to Academy of Education Planning and Management of the Ministry of Education
(MoE) the retention rate in primary school for grade 1 to 5 is only 61% (62.9% for males and 75%
for females in 2004-05. However, the NEC 2005-06 reports an overall dropout rate of 31.3% for
grade 1 to 5; for males a drop out rate of 40.2% is quite high in contrast to females which is 19.2%.
There is no-brainer about the need for increasing enrolment in primary and secondary education;
however, given high dropout rates, the design of a new technical and vocational education and
training system must address more than 50% of the school going children who drop out from the
52
The EFA initiative ensures equal access to primary schooling for children aged 5-9 and considers the primary
education as compulsory. 53
Source: Riboud World Bank

Background Situation Analysis of Pakistan‘s TVET System Section II
Janjua and Irfan (SEBCON PVT LTD) 33
school at various levels and enter informal training arrangements for skills acquisition to enter the
labour force.
2.3 Mapping of General and TVET System in Pakistan
The education system can be divided into two streams; the general and technical and vocational
education stream54
. The general education stream covers professional education as well. The TVET
system in Pakistan is divided into technical education and vocational training aimed at preparing
trainees for middle level technicians and lower level work force, respectively.
General education is provided in schools, colleges, universities and professional colleges while
technical and vocational education and training is provided in institutions which are specifically
setup for this purpose. The majority of the technical labour is trained and supplied by technical
institutes in the public sector; however, the private sector also plays an important role. The
vocational training programmes are administered by federal and provincial agencies, NGOs and the
private sector. A few years ago the Technical Training Centre (TTCs) and Apprenticeship Training
Centres (ATCs) were administered by the provincial labour departments. The In-Plant Training
Programmes are administered by the provincial Directorates of Manpower and Labour Training
under the guidelines of the Apprenticeship Training Ordinance of 196255
. However, now they are
being consolidated under the TEVTAs.
The technical and vocational education was introduced as a sub-system and Pakistan does follow
International Standard Classification of Education (ISCED)56
. However, the typology of TVET by
ISCED 1997 is not properly documented57
. The UNEVOC (2006) reports on ISCED 3 and 5B for
Pakistan58
(for ISCED definitions of general and vocational education please refer to annex 5 and
for comparison between general and technical education refer to annex 7). In order to make it an
integral part of general education, vocational education was initially introduced in some secondary
schools in the early 1970s. Students can continue further and go for a three year Associate
Technical Education diploma in a trade and are allowed beyond to pursue a Bachelor of technology
degree. However, mobility between general education and technical education stream is not easy.
As noted earlier, public‘s attitude towards technical and vocational education is associated with a
stigma as it is considered low level education of ―Mazdoors‖ (the manual labour or blue collar
class) while general education is considered education of ―Babus‖ (the white collared class). The
Figure 9 below provides a simplified mapping of general education and technical and vocational
education in Pakistan59
(For detailed mappings please refer to annex 6).
The NEC 2005-06 reports the presence of 251,134 educational institutions; 178,668 (71%) in public
sector and 72,466 (29%) in the private sector. The private sector, including NGOs, plays an
important role in providing general education in areas where government does not have access.
54
This is defined by the Ministry of Education in education policy documents. 55
Kardar (1997) 56
The UNESCO has designed the ISCED in the early 1970s to simplify the compiling of statistical information. The
system was approved by the International Conference in Geneva I 1975 and was subsequently endorsed by the
UNESCO‘s general conference in 1978. The classification has been revised further and is now known as ISCED 1997.
UNESCO encourages member state to apply these definitions and use for statistical reporting on education. 57
The UESCO Institute of Statistics has redefined ISCED definitions See Annex 4 58
See UNEVOC (2006) page 67 59
It is adopted from UNESCO (1996).
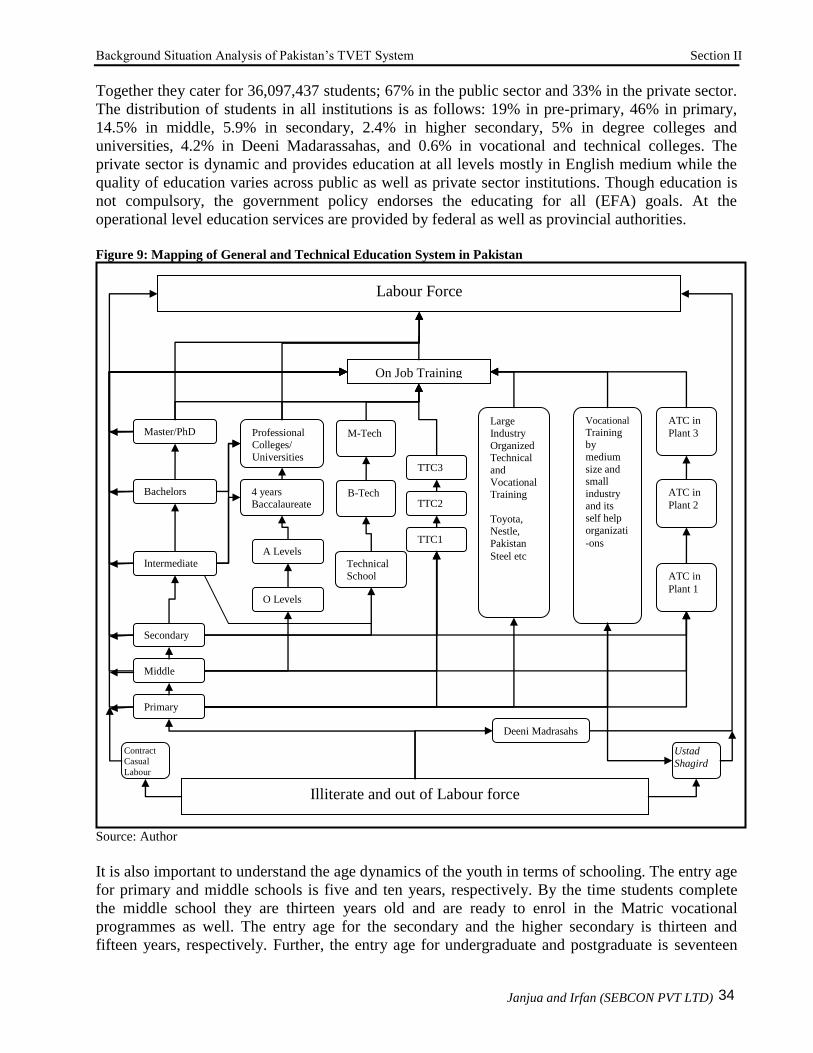
Background Situation Analysis of Pakistan‘s TVET System Section II
Janjua and Irfan (SEBCON PVT LTD) 34
Together they cater for 36,097,437 students; 67% in the public sector and 33% in the private sector.
The distribution of students in all institutions is as follows: 19% in pre-primary, 46% in primary,
14.5% in middle, 5.9% in secondary, 2.4% in higher secondary, 5% in degree colleges and
universities, 4.2% in Deeni Madarassahas, and 0.6% in vocational and technical colleges. The
private sector is dynamic and provides education at all levels mostly in English medium while the
quality of education varies across public as well as private sector institutions. Though education is
not compulsory, the government policy endorses the educating for all (EFA) goals. At the
operational level education services are provided by federal as well as provincial authorities.
Figure 9: Mapping of General and Technical Education System in Pakistan
Source: Author
It is also important to understand the age dynamics of the youth in terms of schooling. The entry age
for primary and middle schools is five and ten years, respectively. By the time students complete
the middle school they are thirteen years old and are ready to enrol in the Matric vocational
programmes as well. The entry age for the secondary and the higher secondary is thirteen and
fifteen years, respectively. Further, the entry age for undergraduate and postgraduate is seventeen
Illiterate and out of Labour force
On Job Training
Primary
Secondary
Bachelors
Intermediate
Professional Colleges/
Universities
Master/PhD
Middle
Vocational Training by
medium
size and small
industry
and its self help
organizati
-ons
Large
Industry
Organized Technical
and
Vocational Training
Toyota, Nestle,
Pakistan
Steel etc
Ustad
Shagird
TTC3
TTC2
TTC1
Technical
School ATC in
Plant 1
A Levels
O Levels
4 years
Baccalaureate ATC in
Plant 2
ATC in
Plant 3 M-Tech
Labour Force
Contract
Casual
Labour
Deeni Madrasahs
B-Tech
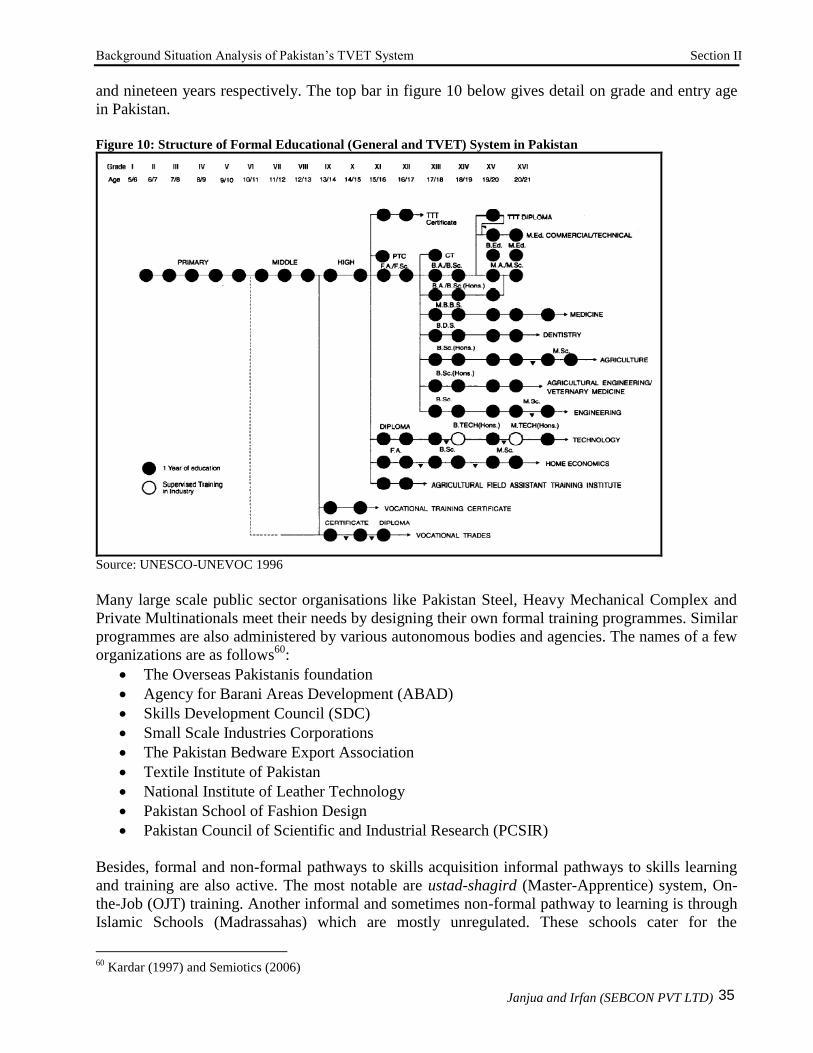
Background Situation Analysis of Pakistan‘s TVET System Section II
Janjua and Irfan (SEBCON PVT LTD) 35
and nineteen years respectively. The top bar in figure 10 below gives detail on grade and entry age
in Pakistan.
Figure 10: Structure of Formal Educational (General and TVET) System in Pakistan
Source: UNESCO-UNEVOC 1996
Many large scale public sector organisations like Pakistan Steel, Heavy Mechanical Complex and
Private Multinationals meet their needs by designing their own formal training programmes. Similar
programmes are also administered by various autonomous bodies and agencies. The names of a few
organizations are as follows60
:
The Overseas Pakistanis foundation
Agency for Barani Areas Development (ABAD)
Skills Development Council (SDC)
Small Scale Industries Corporations
The Pakistan Bedware Export Association
Textile Institute of Pakistan
National Institute of Leather Technology
Pakistan School of Fashion Design
Pakistan Council of Scientific and Industrial Research (PCSIR)
Besides, formal and non-formal pathways to skills acquisition informal pathways to skills learning
and training are also active. The most notable are ustad-shagird (Master-Apprentice) system, On-
the-Job (OJT) training. Another informal and sometimes non-formal pathway to learning is through
Islamic Schools (Madrassahas) which are mostly unregulated. These schools cater for the
60
Kardar (1997) and Semiotics (2006)

Background Situation Analysis of Pakistan‘s TVET System Section II
Janjua and Irfan (SEBCON PVT LTD) 36
marginalized and disadvantaged who cannot afford to pay for schooling. However, sometimes
children from well off families also adopt this path due to family aspirations and socio-religious
philosophies.
Table 19: Presence of Vocational and 5B Enrolments in Pakistan
En
tra
nce
Ag
e
Du
rati
on
En
rolm
en
t in
all
pro
gra
mm
es
All
Pro
gra
mm
es
Vo
cati
on
al
Pro
gra
mm
e
Enrolment in Technical
and vocational
programmes (%)
Vocational Gross
Enrolment t Ratio
Vocational Education MF M F GPI MF M F GPI
Lower Secondary
ISCED2
na na 3,918,146 - - - - na - - - na
Upper Secondary ISCED3 15 1 1,816,147 83,000 5 6 2 .32 2 4 1 .23
Post Secondary non-
tertiary (ISCED 4)
.. .. .. .. .. .. .. .. .. .. .. ..
Technical Education 5B
Progra-
mme
Post Secondary non-
tertiary vocational
Enrolments (ISCED 5),
and tertiary Enrolments
(ISCED 5B)
.. .. 401,056 281 .. .. .. .. 0 0 0 .52
Source: UNEVOC (2006)
The UNEVOC (2006) has recently compiled a statistical resource which contains information on
the TVET system in different countries. However, the information compiled is limited to formal
TVET. The caveat remains that enrolment in private sector formal and non-formal TVET is much
higher than the formal TVET in public sector. Therefore, the exact enrolment, typology of ISCED
TVET, and degree of diversification in Pakistan‘s TVET system is not known as per UNEVOC
diversification index. At the time of writing this report any document related to ISCED
classification of Pakistan‘s TVET system was not known and available. The UNEVOC (2006) has
also underlined the difficulty of establishing theoretical and practical distinctions between (a)
general; (b) pre-vocational and pre-technical; and (c) vocational and technical education in
developing countries. Pakistan may also be considered an example in this regard. The Table 7 above
consolidates information on Pakistan‘s TVET as per UNEVOC statistical framework. There are
information gaps which may need to be addressed for designing a future TVET system in Pakistan.
According to UNEVOC (2006), which is an initial statistical survey of countries regarding TVET,
3,918,164 students were enrolled in Lower Secondary (ISCED2); 1,816,147 in upper secondary and
401,056 in post secondary. Only 281 enrolments are reported in tertiary ISCED 5-B classification.
However, it must be kept in mind that ISCED has its own limitations and classification of TVET
programmes under ISCED is not straightforward. The typology of TVET is identified by the type of
TVET implementing institution. Countries like Pakistan need to learn lessons from Japan and
Sweden‘s TVET system61
(see table 19 above).
61
UNESCO-UNEVOC (2006) reports on ISCED and its relevance to the TVET system. It notes that the ISCED system
of classification cannot provide a complete framework for classifying TVET across different countries due to
operational difficulties. However, it nonetheless provides a basic framework for classifying the formal TVET
programmes.

Background Situation Analysis of Pakistan‘s TVET System Section II
Janjua and Irfan (SEBCON PVT LTD) 37
2.4 TVET Institutions
The size of TVET system in Pakistan is naturally dependant upon the formal and informal setups
involved in the provision of the TVET across the country. Information on registered and to some
extent non-registered public and private TVET institutions is available. National Census of
Education (NCE) 2005-06 reports 3,059, registered and non-registered, TVET institutions of which
916 are in the public sector while 2143 are in the private sector (See Table 20)62
. The presence of a
large number of private TVET providers emphasizes the role of private sector in TVET provision.
Table 20: Institutions and Enrolments in Pakistan’s TVET System
Enrolment by Gender Teachers Student
Teacher
Ratio Institutions Type Institutions Boys Girls Total Male Female Total
Public 692 53,945 28,189 82,134 4,060 1,847 5,907 13.9
Other Public 224 12,564 9,054 21,618 924 494 1,418 15.25
Private 2,143 82,532 52,403 134,935 4,923 2,317 7,240 18.64
Total 3,059 149,041 89,646 238,687 9,907 4,658 14,565 16.39
Source: NCE 2005-06
It must be noted that all public institutions are registered with different government bodies related to
TVET system while all private institutions are not. The Discrepancy in total number of TVET
institutions reported by different statistical sources clearly underlines the presence of a huge TVET
provider base in the private sector which is not registered or covered by formal TVET authorities63
.
2.5 Enrolment in Pakistan’s TVET System
The NEC 2005-06 provides the most up-to-date information on the enrolment in Pakistan‘s TVET
institutions. Total enrolment in all institutions is reported as being 238,687, of which the majority is
enrolled in vocational institutions. Almost 74% students in Pakistan‘s TVET system are enrolled in
vocational institutions while 23% are enrolled in polytechnic and only 2.4% in monotechnics64
. The
student teacher ratio (STR) ranges from 14-18.4 which is close to international norms for similar
programmes (see table 21 below).
Table 21: Enrolment by Type of TVET Institution
Level Institutions Enrolment Teachers STR
Polytechnic 151 55,763 3,422 16.3
Mono-technique 49 5,923 396 15.0
Vocational 2,859 177,001 11,521 15.4
Total 3059 238,687 14,565 16.4
Source: NCE 2005-06
The Enrolment in Pakistan‘s TVET system is much lower than that of emerging economies of Asia
and Middle East (See table 22 below).
62
The figures reported in Table 4 exclude data on commerce colleges which are also registered with provincial
TEVTAs. 63
For example, many computer training colleges have mushroomed up across the country but all of them might not be
registered or recognized by TEVTA. Though many new institutions might be in process of registering with the TEVTAs
at any given time, it is possible that many stay out of the process. It is not known who accredits the certificates and
degrees of such institutions. 64
The monotechnic institutes teach course in one discipline only, e.g. either civil, mechanical, or electrical.

Background Situation Analysis of Pakistan‘s TVET System Section II
Janjua and Irfan (SEBCON PVT LTD) 38
Table 22: Countries Classified by Level of Enrolment in Vocational Education
< 2% 2-5% 5-10% 10-15% > 15%
Myanmar, Bangladesh
Oman, Kuwait, UAE,
India, Pakistan
Cambodia, Saudi Arabia
Qatar
Malaysia
Hong Kong
Vietnam
Lao
Singapore
Iran
Brunei
Mongolia
Cyprus
Iraq
Syria
Papua New Guinea
Indonesia
Japan
China
Thailand
Korea, South
Israel
Jordan
Turkey
Source: JANDHYALA B G TILAK (2002)
2.6 Current Situation in TVET: Equality, Access, Coverage
According to education for all mid decade assessment report almost 6.39 million children of
secondary level age group (10-16) were enrolled in 2001-02 of which only 75,000 (1.2%) were
enrolled in TVET institutions. In 2005-06, the enrolment in TVET increased to 238,000 (3.1% of
total 7.68 million enrolment of relevant age group). TVET enrolment grew by 117% in four years.
Therefore, demand for enrolment in TVET is increasing; however, Pakistan does not have enough
TVET facilities. The Gender Parity Index of enrolment in TVET at the secondary education level
has also improved from 0.31 to 0.64 percent. The total number of girls enrolled is 90,000 as
compared to 150,000 boys. The proportion of female enrolment in TVET increased from 23% to
38% from 2001 to 2005, respectively. There are proportionately more girls enrolled in rural areas
(43%) as compared to urban areas (36%). The marginalized areas have particularly low proportions
of girls enrolled not only in primary and secondary education but TVET as well. The lowest
percentage of girls enrolled in various educational programmes are reported as 28% in primary in
FATA, (13%) in the secondary in Federally Administered National Area (FANA) (13%), and 31%
for TVET in the NWFP65
. Similarly, the total number of women teachers in TVET has increased by
150% from 2001 to 2005.
Table 23: Gender Parity Index and Distribution of Teachers
and Students per Institutions
Institutions Type Students Teachers Per Institution
GPI GPI Students Teachers
Public 0.52 0.45 118.69 8.54
Other Public 0.72 0.53 96.51 6.33
Private 0.63 0.47 62.97 3.38
Total 0.60 0.47 78.03 4.76
Source: Author Calculations from NEC
The overall GPI for students is close to 0.60 with a relatively adverse rank of 0.52 in public
institutions66
(see table 23 above). A similar index is constructed for teachers which shows adverse
overall female to male ration of 0.47 in all TVET institutions. There are more students and teachers
per institute in public sector as compared to private sector. There are fewer teachers per institute in
the private sector as compared to public sector. The private sector institutes have approximately
3.38 teachers per institute. This may affect quality of teaching in the private sector. Moreover, the
STR in private sector is 18.64 which is the highest in Pakistan‘s TVET system and is above the
international norms.
65
See EFA Mid Decade Assessment Report GoP (2008). 66
A gender parity index reveals female student and teachers‘ access to TVET institutions. A GPI of 1 indicates equal
access and opportunities for females while a GPI of less than one indicates access of fewer females in contrast to males.
Background Situation Analysis of Pakistan‘s TVET System Section II
Janjua and Irfan (SEBCON PVT LTD) 39
2.7 Capacity Utilization in Pakistan’s TVET Institutions
The UESCO-UNEVOC (1996) provides information about capacity, enrolment and output of
Pakistan‘s TVET providers. It is evident from the statistical information that Pakistan‘s TVET
system is underutilized, has high drop out rates, and the output is much less than the intake capacity
and enrolment. Recently, the National Productivity Organization (NPO) has also completed a
capacity utilization study of the Pakistan‘s TVET facilities in the public sector. According to the
NPO (2005), the capacity utilization in TVET institutions is far below expectations. For instance
capacity utilization of polytechnic institutes is around 65% in Punjab, 52% in Sindh, and
approximately 68% in NWFP. The courses offered give more weight to theoretical components
compared to practical components. Students do not have access to latest machines and equipment.
2.8 Problems and Issues in Pakistan’s TVET Institutions
Pakistan‘s first educational plan clearly outlined the need for TVET67
and made it part of the
general education system. However, no progress was made in subsequent years as compared to
other countries68
. Over the years it became plagued with problems that range from outdated
technologies, outmoded curricula, and governance, etc. Less than 1% of the students (0.6% in fact)
are enrolled in TVET institutions. Some of the most important and talked about problems of TVET
system are as follows69
:
Policy environment and governance of TVET system
Quality and access in Pakistan‘s TVET system
Curricula and syllabus development
Quality of teaching staff
Low completion rates
Occupational guidance and Job Search
Management of TVET intuitions
Trade testing and system of learning and assessment
Outdated technologies
Skills and technology gaps
Linkages with Industry
Labour legislations
Sustainability and other factors
2.8.1 Policy environment and Governance of TVET system
The shortcomings of a system usually emanate from its policy environment and system of
governance. A detailed discussion on Pakistan‘s education policy in general and TVET in particular
is given above in section 2.1. Kardar (1997) stressed that the government policy environment was
not conducive for private investment in skills development and establishing of Public Private
Partnerships (PPP) in TVET70
. Government policies created distortions discouraging private
investment in this important sector of education and training. He stressed that the government
67
It refers to technical and vocational education instead of TVET. 68
Tilak (2002) 69
For a detailed discussion see Kardar (1997) 70
Earlier in the document PPP referred to Pakistan People Party

Background Situation Analysis of Pakistan‘s TVET System Section II
Janjua and Irfan (SEBCON PVT LTD) 40
policies were implemented to favour certain pressure groups and lack objectivity. The system of
import duties, excise taxes, favoured a few and discouraged others which stifled competition and
discouraged technology up-gradation, investment in human capital, import of technology, and
implementation of professional quality management frameworks. Lack of education has also made
it difficult for society to adopt new technologies in production and management.
2.8.2 Quality and Access in Pakistan’s TVET institutions
The education system is heavily subsidised in Pakistan. However, when the funds are earmarked for
the general education and TVET the former receives preference because the unit cost per course in
general education is much less than the TVET. As students do not have to pay much in terms of out
of their pocket so a moral hazard remains as they take little interest in education while parents
believe that the teachers are fully responsible for student‘s performance. The TVET delivery by
faculty on the supplying end and by the students at the receiving end is far from satisfactory.
Kardar (1997) reports the findings of UNDP-ILO (ARTEP) evaluation of vocational training
institutions in Pakistan71
. A survey of 25 percent of the graduating students during 1983-87 was
conduced which revealed that quality of education was not a major factor which had influenced a
student‘s decision to enrol in a vocational programme. Majority took up this skills acquisition path
because either the education was low cost (20%) or the courses were offered in the evening (61%)
while only a few (14%) took into account the institution‘s and faculty‘s reputation.
In 1999, ADB conducted an evaluation of its TVET programme in Pakistan and conducted a survey
in ADB funded and non ADB funded TVET institutions. It was reported in the survey that
Pakistan‘s TVET institutes have average class size of around 50-100 while the STR of 19:1 is
higher than the world accepted norm (15:1) for STR for technical courses. The attendance rate is
found to be 50-80% in Punjab and NWFP while 30-60% in Sindh and Baluchistan. The non
availability of equipment and materials in labs was a major factor in non-attendance. The pass rate
(completion) is approximately 40% with some variation among provinces. The Punjab province has
the lowest completion rate while the Sindh has the highest. Among female‘s polytechnic attendance
is better; around 80-90 percent. In Pakistan 60% of the students are able to find jobs within six
months while 18% may find jobs after a year. However, the new entrants are reportedly trained on-
job for almost 3 moths as no internship programme exists for in school credit that help them prepare
for the job market relevant skills72
.
2.8.3 Curricula and Syllabus Development
Some attempts have been made to update the curricula of TVET institutions. However, the
curriculum remains heavily focused on theoretical and traditional technologies. There is a need to
re-orient TVET curricula towards a competency based system. In a Competency Based Training
(CBT) system the trainees can take a specified set of modules in a spatial manner and move on to
next set of modules. At each step they obtain some sort of certification. Once all the modules are
successfully completed the trainees can apply for full certification of their skills. Similarly, there are
opportunities of becoming a master craftsman in a particular trade through CBT route.
71
The SEBCON team has tried to get a copy of UNDP study however it was not available at the time of writing this
report. 72
In 1999 ADB conducted impact evaluation of its assistance to Pakistan‘s TVET project. A survey was conducted in
project and non project TVET institutions. The findings reported here are from the ADB Impact Evaluation.
Background Situation Analysis of Pakistan‘s TVET System Section II
Janjua and Irfan (SEBCON PVT LTD) 41
In order to design curricula or course syllabus there is no tradition of consulting industry and
technology providers. Private sector has come up with its own initiative especially in the field of
computer science, but also in manufacturing. For instance, many institutions have adopted curricula
developed by foreign institutions. The teachers acquire certifications either through long distance
learning or from short curses in foreign countries. Later, they provide training to students who
obtain certification by passing exams administered by the technology provider through their
designated agencies (The Cisco and Microsoft certifications and the City and Guilds system applied
by TUSDEC are important examples in this regard).
The teachers in polytechnic institutes are not familiar with new advancements and CBT curricula in
their field which are in vogue in major parts of the world. Mostly, the institutes follow curricula
approved by the ministry of education and its recommended books. In advanced economies,
teachers can use curricula to develop customized courses. Usually, they have the flexibility to
incorporate advanced materials in their syllabus using Information and Communication
Technologies (ICT). The system is inflexible in the sense that it is not designed to respond to
industry demand by instituting new courses and developing relevant syllabi.
Recently, Hassan (2007) has analyzed the curricula for Diploma of Associate Engineering (DAE) in
use in Punjab province against job requirements in three conventional technologies namely: the
Electrical Technology, the Electronic Technology, the Mechanical Technology; and three emerging
technologies namely the Food Technology, the Instrumentation Technology, and the Petroleum
Technology. Only the curricula of Electrical, Electronics, Food, and Petroleum technologies were
found to be in concurrence with the job market. However, he identified the need for aligning some
courses in line with new and emerging changes in technology. The curricula of Mechanical and
Instrumentation Technology were found to be in need for modification. According to Hassan (2007)
the curricula for mechanical technology needs revision in the following key technology courses:
Metallurgy, Applied Electricity and Electronics, Thermodynamics, and Energy Conservation. He
recounts the history of curricula development in Pakistan and reveals that the curricula for
polytechnics were developed in 1954-55 with the help of Ford Foundation and the United States
Agency for International Development (USAID). These curricula underwent minor change in 1964-
70 and remained in use for nearly 20 years.
2.8.4 Quality of Teaching Staff
The academic staff in TVET institutions can be classified into three categories; a) teachers of
theoretical courses, b) teachers of practical classes; and c) teachers of general Maths, English, and
Islamic studies subjects. The qualification of teachers and their skill varies among TVET
institutions. The teaching staff at technical institutes is either DAE holders or B-Tech (Pass) and B-
tech (Hons) holders. Many of them do not have industry experience and they only teach what they
have learned themselves thorough bookish experience which makes their teaching not so relevant to
market demand. Similarly, the teaching staff at various vocational training institutes is usually
skilled in the relevant trade under a similar programme and rarely have an opportunity to learn new
trades or up-grade skills which is highly essential for innovation and imparting cross-cutting
knowledge to students. In order to manage change in line with the needs of new knowledge
economy ICT must be made part of the teaching methodology in technical and vocational
programmes.

Background Situation Analysis of Pakistan‘s TVET System Section II
Janjua and Irfan (SEBCON PVT LTD) 42
The public sector technical teacher training institutes are supposed to cater for the needs of both
private and public TVET providers; however, these institutes lack qualified teaching staff that has
industrial experience as well. As these institutes are set up in public sector; therefore, the public
service salary, promotion, and benefit structure does not provide a motivational framework and
many qualified professional either do not consider teaching in these Training of Trainers (ToT)
institutions or leave and opt for high paid jobs in other sectors. Those who are retained in the system
are tenured and receive promotions based on length of tenure instead of performance73
. Shah (2004)
has reported that almost 30% of the teaching positions were vacant in 1988. A recent analysis is not
available.
2.8.5 Occupational Guidance, Job Search
Occupational guidance at polytechnic institutes, colleges of technology, vocational training centres
is informal in nature. Mostly teachers or peers help other students in referrals as well as guidance
for job search. A formal system of occupational guidance and job search in TVET system in general
and in institutions in particular is almost non-existent. However, provincial departments of labour
and manpower have set up employment exchanges and vocational guidance cells which were found
to be ineffective. Therefore, majority of graduates from TVET institutions remain unemployed for
sometime. Kardar (1997) gives an account of TVET graduates in the job market74
.
“The results of the UNDP study were that 63 per cent of those trained were
unemployed; the NWFP study had also discovered that 55 per cent of the polytechnic
and 59 per cent of commerce diploma holders and 72 per cent of those with
vocational certificates were unemployed. Nearly 40 per cent of the unemployed in
the UNDP sample had been waiting more than two years for a job. Of those
employed two-thirds were employees and one-third was self-employed. Almost 25
per cent of those employed had had to wait more than two years for a job and only
35 per cent found jobs within six months. The NWFP study revealed that 30 per cent
found a job after two to three years, 28 per cent were unemployed for over three
years, while 20 per cent were unemployed for a period of six months to one year. The
dated and inflexible programmes in the training institutions have meant that workers
emanating from this system cannot necessarily expect to have acquired the skills
required for gainful employment.”
It is imperative to develop labour market services, platforms or forums which may provide
vocational and occupational guidance inline with the job market demand.
2.8.6 Management of TVET intuitions
The management structure at TVET institutes is outdated. Most of the work is carried out by
clerical staffs that lack professionalism. Prior to the establishment of provincial TEVTAs most
institutions were running under the umbrella of different line departments of the government,
councils, autonomous bodies, and directorate of ministry of education and labour departments. The
system was characterised by lack of coordination. After the establishment of TEVTAs several
institutions are consolidated under it in Punjab and similar operations are underway in other
provinces. However, little has changed in the management structure at institution level. Kardar
73
Kardar 1997 74
www.lahoreschoolofeconomics.edu.pk/JOURNAL/Vol2-No2/Shahid.doc

Background Situation Analysis of Pakistan‘s TVET System Section II
Janjua and Irfan (SEBCON PVT LTD) 43
(1997) asserts that TVET providers in the public sector have little or no control over hiring and
firing of staff, salaries and career development, fee structure, academic standards, and resource
allocation. It is mostly controlled by provincial boards or bureaus. Many decision making processes
were fragmented under different authorities who made the job of initiating and managing change
even more difficult. However, after the establishment of TEVTAs it is hoped that these difficulties
will be removed. The school management is not dynamic and rather shy away from advanced
management approaches. It is of paramount importance to take note of ADB (1999) study which
points out that TVET institute management is reluctant to involve industry in running schools.
2.8.7 Trade Testing and the System of Learning Assessment
In Pakistan, the learning assessment for most courses taught in polytechnic institutes is done by the
Board of Technical Education through annual exams. The colleges and institutions also conduct
routine assessments throughout the year internally; however, students do not give it much
importance and sometimes skip assignments as it neither contributes to the final grade nor does it
affect their eligibility to enter the final exam.
An ADB (1999) evaluation of its TVET projects observed that there has been little emphasis on
quality of the training and demand by the industry. There were no active trade testing bodies in
Pakistan. The emphasis was rather on providing some sort of skill to marginalized or economically
and intellectually disadvantaged population. Therefore, employability of the graduates and role of
skills acquisition in promoting economic growth remains a distant objective.
In 2002, the government had amended further the National Training Ordinance 1980 - now known
as the National Training (Amendment) Ordinance 200275
. Under the ordinance National Trade
Testing Board was constituted by National Training Board. Similar bodies were formed in
provinces as well76
. Now Skill Development Councils (SDCs) also conduct trade tests.
2.8.8 Outdated Technologies
According to the 1998 Human Development Report for South Asia, the region is stuck with the
technologies of past while many developing countries are seeking technologies of the future.
Pakistan is not different from other countries of the region. The Pakistan TVET system has failed to
evolve over the years from supply-oriented to demand-driven. There are very few skills training
opportunities. The skills taught in existing TVET institutions run by the public sector are either
irrelevant or obsolete for both domestic and global job markets. The institute and industry linkages
are non-existent. The industry is reluctant to build linkages with public institutions due to a general
perception that students trained in government institutes do not possess relevant skills as they are
trained on outmoded machines and the syllabi are not relevant to the market. The industry does not
trust new graduates and let them touch its machinery unless it trains fresh graduates. There are
however a few industry driven TVET programmes which are offered by Modern Institute of
Informatics & Management (MIIM), SDCs, and Punjab Vocational Training Council (PVTC).
75
http://www.pakistan.gov.pk/divisions/law-division/media/II-2002.pdf 76
For Sindh Trade Testing Board (STTB) information is available on web (http://www.sindhttb.gov.pk/ttb/ ).

Background Situation Analysis of Pakistan‘s TVET System Section II
Janjua and Irfan (SEBCON PVT LTD) 44
2.8.9 The Skill and Technology Gaps
Skill and technology gap exists at many levels. Pakistani companies are far behind in the acquisition
of modern technologies and the educational sector lags even further behind than industry. Flexible
labour laws, regulations, and industry standards do not encourage large investment in formal
technical trainings while strict industry standards implemented in other countries are becoming
instrumental in substantial investment in formal training of labour force77
. Besides, new knowledge
based economies make it imperative that our labour force training curricula are up-to-date and the
programmes focus on integrating labour into modern economy both in formal and informal sectors.
In order to achieve competitiveness in all sectors of the economy need for trained manpower supply
cannot be ignored. Studies on Pakistan‘s TVET system have reported that almost 27% of those who
received training from TVET institutes faced problems in performing well on their jobs. Moreover,
32% of those who could not perform well reported to have inadequacy of training while others
attributed the problem to training on outmoded equipment in TVET institutions. Only 51% reported
to use same tools which were used in the training institutions. This clearly pictures the state of
available technological base especially with public TVET service providers78
.
2.8.10 Linkages with the Industry
Most of the learning and training in Pakistan‘s TVET system is institution based which does
increase the opportunity cost of training. The industry and institution linkages are either non-
existent or very rudimentary in nature79
. If part of the training is conducted in the industry for which
students can obtain credit towards certification or graduation the cost can be brought down
significantly. The industry-institution linkage is the weakest feature of most TVET programmes in
Pakistan. The major employers are sometimes reluctant to hire graduates of the TVET institutes
because their qualifications fall short of industry requirements. Therefore, a few major employers
have preferred to design their own programmes in which they induct fresh trainees.
2.8.11 Labour legislation
In comparison to international standards labour laws, regulations, and legislations are excessive
which subsequently increases the cost of doing business80
. Kardar (2004) asserts that labour laws
also discourage skills development. A reduction in hiring and firing cost is necessary. The time limit
on trainees‘ contracts and procedural difficulties in appointments and firing of trainees under
Apprenticeship Ordinance 1962 also imposes limitations. The employer must retain the apprentice
for a specified period of time even if he/she is not performing well. The contract is signed by the
Directorate of Apprenticeship and the industry does not have autonomy to dismiss non-performing
trainees without prior approval of the regional directorate of apprenticeship. The redundancy based
dismissal is also not easy in Pakistan‘s industrial set up due to governing legal frameworks. There is
also a need to cut down compliance cost associated with labour laws and legislations.
77
http://siteresources.worldbank.org/SOCIALPROTECTION/Resources/SP-Discussion-papers/Labor-Market-
DP/0832.pdf 78
Kardar (1997) 79
Initiatives like Skills Development Council (SDC) in which industry and institution linkages are strengthened the
only exceptions and are rare. 80
World Bank (2008)

Background Situation Analysis of Pakistan‘s TVET System Section II
Janjua and Irfan (SEBCON PVT LTD) 45
2.8.12 Sustainability and Other Factors
The sustainability of TVET programmes and reform requires federal and provincial governments to
earmark adequate recurrent budgets. Many donor initiated TVET projects lacked sustainability
component in the form of supporting covenants81
. The ADB 2004 impact evaluation stresses the
need for analysis of different problems of polytechnics, technical training centres (TTCs), and
Vocational Training Centres (VTCs). It also points out that ―Production-cum-service centres‖ also
fail to provide incentives to private industry for its involvement. They rather compete with the
private businesses in local industry.
The supply and demand of skilled workforce is fraught with excess gaps and shortages. There is
lack of bridging courses and programmes that can prepare workers to switch to another occupation
in case there are no demands for certain skills or in an industry. It has been reported in many TVET
institution evaluations that the local industry does not either have the absorptive capacity for new
graduates or the skills in demand are not taught in local TVET intuitions.
It is imperative to mention that the notion of demand driven courses is different among men and
women in Pakistan82
. In case of women, the demand by prospective trainees to learn a particular
skill was considered for introducing a TVET course in a local setting. It was discovered that the
desire to learn a skill among women was influenced by their traditional roles and activities rather
than income generating potential or market demand. Therefore, it is concluded that the demand-led
approach to TVET also requires awareness among prospective trainees to understand the economic
implication of their skill acquisition choices.
2.9 Findings from a perception survey
Shah (2004) conducted an assessment survey of TVET institution for his PhD dissertation. He asked
questions to 35 institutional heads, 175 teachers and 350 students about the clarity of the objectives
of TVET, availability of physical facilities, administrative facilities, curricula, co-curricula, staff
development, assessment and evaluation, etc83
. Findings of his research suggest the acceptance of
the hypothesis that objectives of TVET are clear to students, teachers and administrators. The
teachers play an important role in achieving the objectives, the physical layout of the laboratories
was found satisfactory, and the facilities were properly utilized, and somewhat well equipped in the
institutions in which the survey was conducted. The workshops were found to have proper raw
materials while the hypothesis that facilities are well maintained was rejected. The computer
facilities were also found to be adequate. Nevertheless the survey participants complained about
lack of transport facilities and lack of first aid facilities, lack of disaster management facilities in
case of fire or accident, lack of lodging facilities for teachers and students on campus; therefore, the
research hypothesis failed. Though computers are available; however, online research and education
facilities are non-existent and the hypothesis failed miserably. The findings suggested that the
performance of administrators of TVET institutions was unsatisfactory which was also supported by
the findings of other researchers. Though teachers were found to be performing satisfactorily given
their expertise; however, they were not abreast with modern technologies and needed refresher
course. Teachers were not competent enough to use modern instructional methods, e.g, audio video
81
ADB (2004) Page 86 argues that there is no pledge by the government in the form of contract to carry these initiatives
forward once the donor funding stops. 82
IFAD (2001) 83
He did not ask questions to industry.

Background Situation Analysis of Pakistan‘s TVET System Section II
Janjua and Irfan (SEBCON PVT LTD) 46
technologies, etc. Nevertheless, insufficiency of funds was reported for staff development and
teacher training programmes do not fulfil the objective of improving quality of teaching staff. The
need for in-service teaching staff training and development was underscored by survey participants.
There is lack of support from institutions in job search and placement and there are no facilities for
guidance and counselling. The performance of the institutions is not periodically evaluated. The
teachers, students, and principals support the idea that curricula used in training is outdated -needs
revision-and is not at par with international standards. The curricula and teaching methodology does
not promote critical thinking among students. The curricula fail to achieve the learning objectives.
Participants of the survey agreed that the course materials and mode of instruction should be in
English as well as Urdu.
In answer to a question about teacher quality the survey participants responded that the teachers are
not doing enough to play the role of a mentor and their interest in students‘ character building was
insignificant. On assessment and examinations it was revealed that students‘ practical work is not
given much weight; rather, the emphasis is on written exams. The exam system was found to be
ineffective in achieving course evaluation objectives and the system rather encourages rote learning.
Participants of the survey believed that the annual exam system is not useful while a semester
system was preferred by al participants.
Based on Shah‘s (2004) findings it is imperative to suggest that there is lack of coordination
between institutes and industry and the need for employer advisory councils was widely accepted.
The participants of the survey also felt that the state of existing TVET facilities and the quality of
graduates does not meet industry demand and hence is also an important factor in lack of growth,
expansion, and modernization among different industries. The industry does not expand and import
modern technologies as they do not find qualified staff and the in-house cost of training for industry
is very high. The disinterest of the government and lack of proper incentive structure in policies and
subsequent implantation plans is missing. The development of Pakistani industry depends on a
trained workforce with quality education. The survey participants ascertained that overall
educational policy is inline with the objectives of literacy. However, policy for technical education
is reported as non responsive to the needs of the industry, youth, and labour markets. Nevertheless,
it is accepted that there are trained and committed people in policy formulating agencies but there
are many other numerous factors which are responsible for policy failure. The policy targets are not
thoroughly researched; therefore, the technical education policy and plans remain ineffective. Most
of the policy objectives are unrealistic and are not achievable due to shortage of funds and lack of
implementation capacity. The quality of technical education is not assigned a priority in
development plans. Teachers, industry, students, and administrators of TVET institutions, and civil
society are not consulted as stakeholders in policy formulation process. Those who are responsible
for implementing the policy are not involved in plan preparation. The plan implementation process
is fraught with difficulties and there exists lack of coordination among implementing agencies and
stakeholders. The plans are not elaborated and many stakeholders remain unaware of the policy
objectives before the plans are lunched. While insufficient funds are allocated for technical
education they are not released in time, which is also one of the reason for policy and plan failure. A
leakage of funds occurs during implementation due to corruption. Political interference and political
instability is also an important factor for policy inconsistency and failure.
The survey results also confirm the stigma associated with blue collar jobs. The graduates of the
TVET institutes are not given respect in the society and looked upon as incompetent and of lower

Background Situation Analysis of Pakistan‘s TVET System Section II
Janjua and Irfan (SEBCON PVT LTD) 47
status. There is a consensus among general public that technical and vocational education and
training in Pakistan is not developing properly and in right direction.
2.10 The Need for Reforming TVET System in Pakistan
As indicated earlier, sweeping reforms in Pakistan‘s TVET system at all levels are necessary due to
the fact that there is a need to align the TVET system with growing demand for workforce in a
knowledge based economy as well as in response to competitiveness in global markets. The reform
in TVET system is also imperative because of change in demographic patterns and subsequent shift
in labour markets. The TVET system must be able to not only meet the requirements of growing
manpower but the changing pattern of demand as well. Though production processes are becoming
capital intensive; however, trained manpower has also become a critical input in terms of human
capital requirement of new knowledge economies (see figure 8 below).
Figure 11: Workforce Structure Models
Source: ADB 2004
Pakistan is a developing country and is making a concerted effort to become an industrialized
nation. In order to meet the demands for an industrialized economy it needs to train its manpower.
A trained manpower is necessary for increasing productivity, sustaining technological change and
innovation, and promoting complementarity between skills and capital. A country deficient in skills
will suffer in terms of low productivity, poor quality of products, and the poor performance in
exports which will subsequently suppress per capita incomes. Therefore there is a need to balance
supply and demand of skills in order to remove bottlenecks which impede growth84
.
2.11 Pakistan’s Competitiveness in world economy and Role of TVET
The competitiveness in international market will be determined by the levels of skills an economy
has. Globalization may also increase flow of funds for investment in those countries which may
have technological resource base. Outsourcing of jobs to India by US is an important example in
this regard. The Government of Pakistan has set up a Competitiveness Support Fund (CSF) under
the Ministry of Finance in cooperation with USAID. The CSF has also indicated that it will help
NAVTEC in TVET reforms so that the new initiatives help improve competitiveness of Pakistani
industry and its products.
84
For details see ADB 2004

Background Situation Analysis of Pakistan‘s TVET System Section III
Janjua and Irfan (SEBCON PVT LTD) 48
III THE STRUCTURE AND GOVERNANCE OF TVET SYSTEM
It has been noted earlier that despite growth in the number of TVET institutions since the 1970s the
system remained supply oriented and lacked dynamism to cater for the needs of growing industry at
local as well as international level. After the creation of NAVTEC in 2006 it is hoped that the
consolidation of fragmented TVET may occur. At the moment, the following ministries of the
government of Pakistan are involved in the TVET scene at federal level (see Figure 12 below):
The PM secretariat (NAVTEC)
The ministry of Education
The Ministry of Science and Technology
The Ministry of Social Welfare
The Ministry of Labour, Manpower and overseas Pakistanis
The Ministry of Industries
Ministry of Women‘s Affairs
The Ministry of Agriculture and Livestock
The Ministry of Tourism
Other sector Ministries
Provincial TEVTAs and Departments
Figure 12: The Governance Structure of Federal and Provincial TVET system
Source: Adapted from Sadiq 2008

Background Situation Analysis of Pakistan‘s TVET System Section III
Janjua and Irfan (SEBCON PVT LTD) 49
A discussion about the role of each ministry is beyond the scope of this paper; however, their
relevant sub-departments and institutes are covered under the key stakeholders in section 3.8.
3.1 Federal TVET Scene
3.1.1 Ministry of Education
The ministry of education is responsible for formulating the educational policy of Pakistan. Though
it is not fully rationalized in the overall educational system, the technical education is considered an
important component. The NAVTEC and other provincial TEVTAs are supposed to carry out the
implementation of the technical and vocational education and training part of the educational
policy; however, there is no clear separation of mandates between the MoE and NAVTEC.
3.1.2 The NAVTEC
The NAVTEC is created with an objective to regulate, facilitate and provide the coordinated &
integrated policy direction for TVET. It is also supposed to enhance the role of private sector in the
TVET implementation and management; and to make the TVET system responsive to the new
technologies, trades and training methods. How successfully it has achieved its objectives almost
after two years of its inception is a tricky question that needs to be assessed based on NAVTEC‘s
ongoing activities against its mandate. It may be useful for the reader to know that NAVTEC‘s
mandate lies in its Ordinance through which it came into existence85
.
As discussed earlier, the NAVTEC Vision for National Skills Strategy (NSS) aims to train
Pakistan‘s manpower to meet the challenges of the new millennium. It proposes to reform
Pakistan‘s TVET system in order to provide market relevant skills so as to promote and sustain
industrial development and economic growth which ensures access, equity and equal opportunities
for employment for all.
The NAVTEC is also reviewing existing polices, and developing strategies relating to human
resource development with a focus on TVET. NAVTEC‘s role is also envisaged to include
developing national occupational skills standards, facilitating revision of technical education
curriculum, trade testing processes, and certification systems for all areas of technical education and
vocational training. The NAVTEC will deliver its mandate by implementing the National Skills
Strategy 2008 – 2012. The NSS, whilst strong on statements for desired outcomes, does appear to
lack useful background papers describing the current situation, the size and segmentation of the
overall training ‗market‘, the size of the potential reach and so on. Not only would such data be
useful in the process of setting meaningful policy goals and priorities, it would also allow a baseline
for future review of achievements. This background paper is an attempt to fill some of the gaps in
this regard.
Janjua and Naveed (2008) have critically evaluated NAVTEC‘s capacity to implement TVET
reforms. It is important to note that the NAVTEC appears to lack capacity to implement TVET
reforms. The total sanctioned strength of the NAVTEC staff, including head office and regional
offices is 373. However, only 177 staff members are appointed so far. Thus total staff working at
the NAVTEC is even less than 50% of the desired (and sanctioned) staff. The total deficiency of the
85
See Janjua and Naveed (2008) for details

Background Situation Analysis of Pakistan‘s TVET System Section III
Janjua and Irfan (SEBCON PVT LTD) 50
staff at NAVTEC regional headquarters is more than 50%. Moreover, gender composition of
NAVTEC staff is not known at the time of writing this report. Currently, NAVTEC is involved in
implementing the Prime Minister‘s Special Initiative (PMSI) and most of the regional offices seem
to be set up solely for this purpose. It is worthwhile to mention that the NAVTEC is not required to
stick to the government pay scales as the Ordinance gives the Commission power to make rules for
the recruitment of its employees. Therefore, the Commission may use its powers to hire modern
management professionals who are from outside the bureaucracy and have knowledge of private
sector dynamics so as to bring dynamism to the NAVTEC team.
Figure 13: Change in Project Approval Process after the Establishment of NAVTEC
Source: Conceived by the Author
a) TVET Project Approval Process
Prior to the establishment of NAVTEC, the policy making and project implementation related to
TVET were assigned to the Ministry of Education. After the establishment of NAVTEC, the
projects up to Rs. 40 million will be decided by the Commission. However, project greater than Rs.
40 million have to be approved by the Central Development Working Party (CDWP) of the
Planning Commission (PC) of the Government of Pakistan. Therefore, the power to approve
projects up to an amount of Rs. 40 million ensures a certain level of autonomy for the Commission
which is considered necessary to carry out its mandate. Though the federal government is required
to provide funds to the commission for all its expenses necessary to carry out its functions;
nevertheless, the Commission‘s power to approve the project does not guarantee availability of
funds. The funding comes from the ministry of finance and recently the Commission is looking
towards international donors to finance its vision for skilling Pakistan.
Education Policy
Implementation Plan
Ministry of
Education
NAVTEC
National Skills Strategy
Implementation Plan
TEVTAs Programme A Programm-es
and Policies
Programme A,
B, C
Project greater than
40 million
Projects up to 40
million
Planning
Commission
CDWP
Project Pipeline for
approval
Project greater than
40 million
Projects up to
40 million
Programme B,
C, and so on
DDWP

Background Situation Analysis of Pakistan‘s TVET System Section III
Janjua and Irfan (SEBCON PVT LTD) 51
b) Financing of TVET
The Section 5.4 discusses the TVET budgets for different plan periods. There is no doubt that the
financing of Pakistan‘s TVET scene is fraught with difficulties in terms of improper resource
allocation and utilization of funds. The funds are allocated by the Ministry of Finance based on
requests made by different departments. Each government department makes annual requests for its
re-current and development budgets. The autonomous departments and ministries have powers to
approve projects up to Rs. 40 million to Rs. 100 million depending on the powers of the
organization. Projects greater that size are sent to Central Development Working Party of the
Planning commission in the form of PC-I for approval86
. Once the projects are approved they are
included in budget allocations. The organizations decide about resource mobilization through
government, cost recovery, and donor findings in project‘s design phase.
Table 24: NAVTEC Budget Allocations and Expenditures (Rs. In Million)
Non-Development
Development
Total
Allocation Expenditure Utilization Allocation Expenditure Utilization Allocation Expenditure
2006-07 60 59 98.3 500 125 25.0 560 184
2007-08 106 106 100.0 510 510 100.0 616 616
2008-09 203.5 14.737 7.2 2000 150 7.5 2203.5 164.737*
* First Quarter expenditure so far
Source: NAVTEC
c) The NAVTEC Budget
There is not much consolidated information regarding the financing of the TVET system in
Pakistan. The budget records are available with TEVTAs and NAVTEC. However, there is a dire
need for budget analysis for benchmark and costing purposes.
Figure 14: NAVTEC Development Vs Non Development Allocations
Source: based on data reported in table 24
The distribution of development and non development budget is given in table 24 and Figure 14
above. A huge increase in NAVTEC‘s Development Budget is due to the implementation of the
Prime Minister Skills Initiative (PMSI) programme, also known as Hunarmand Pakistani, and the
86
PC-I is planning commission of Pakistan‘s approved project proposal format
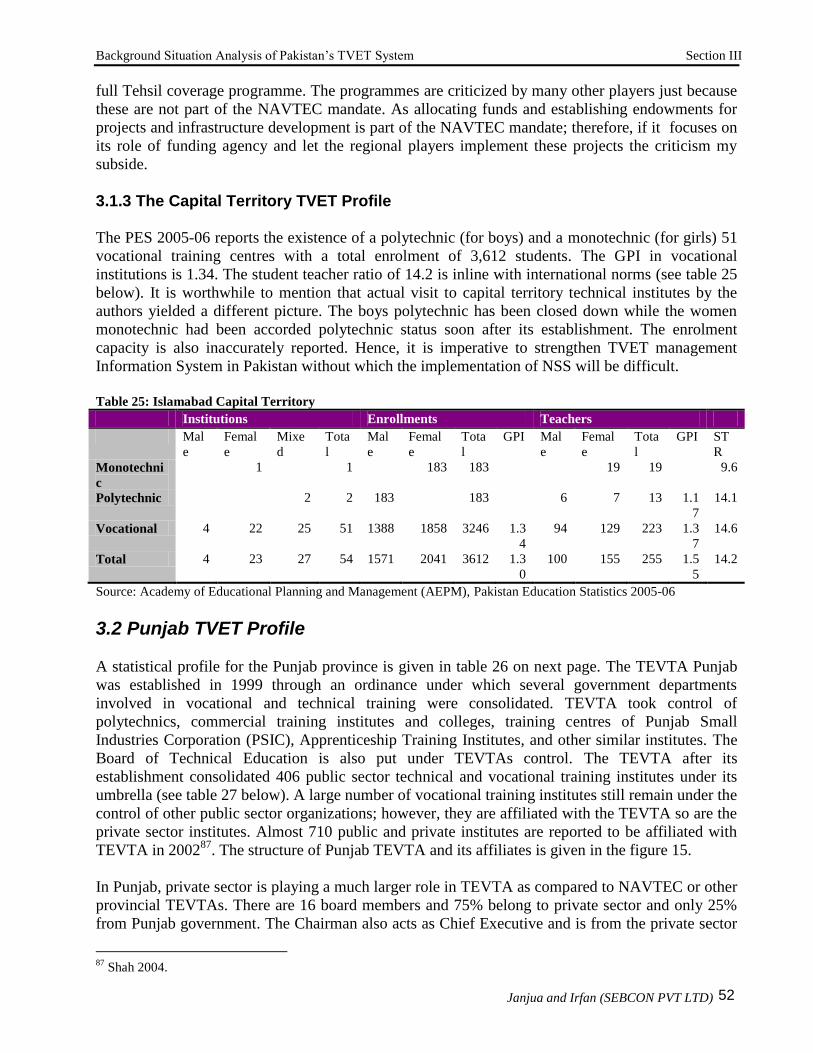
Background Situation Analysis of Pakistan‘s TVET System Section III
Janjua and Irfan (SEBCON PVT LTD) 52
full Tehsil coverage programme. The programmes are criticized by many other players just because
these are not part of the NAVTEC mandate. As allocating funds and establishing endowments for
projects and infrastructure development is part of the NAVTEC mandate; therefore, if it focuses on
its role of funding agency and let the regional players implement these projects the criticism my
subside.
3.1.3 The Capital Territory TVET Profile
The PES 2005-06 reports the existence of a polytechnic (for boys) and a monotechnic (for girls) 51
vocational training centres with a total enrolment of 3,612 students. The GPI in vocational
institutions is 1.34. The student teacher ratio of 14.2 is inline with international norms (see table 25
below). It is worthwhile to mention that actual visit to capital territory technical institutes by the
authors yielded a different picture. The boys polytechnic has been closed down while the women
monotechnic had been accorded polytechnic status soon after its establishment. The enrolment
capacity is also inaccurately reported. Hence, it is imperative to strengthen TVET management
Information System in Pakistan without which the implementation of NSS will be difficult.
Table 25: Islamabad Capital Territory
Institutions Enrollments Teachers
Mal
e
Femal
e
Mixe
d
Tota
l
Mal
e
Femal
e
Tota
l
GPI Mal
e
Femal
e
Tota
l
GPI ST
R
Monotechni
c
1 1 183 183 19 19 9.6
Polytechnic 2 2 183 183 6 7 13 1.1
7
14.1
Vocational 4 22 25 51 1388 1858 3246 1.3
4
94 129 223 1.3
7
14.6
Total 4 23 27 54 1571 2041 3612 1.3
0
100 155 255 1.5
5
14.2
Source: Academy of Educational Planning and Management (AEPM), Pakistan Education Statistics 2005-06
3.2 Punjab TVET Profile
A statistical profile for the Punjab province is given in table 26 on next page. The TEVTA Punjab
was established in 1999 through an ordinance under which several government departments
involved in vocational and technical training were consolidated. TEVTA took control of
polytechnics, commercial training institutes and colleges, training centres of Punjab Small
Industries Corporation (PSIC), Apprenticeship Training Institutes, and other similar institutes. The
Board of Technical Education is also put under TEVTAs control. The TEVTA after its
establishment consolidated 406 public sector technical and vocational training institutes under its
umbrella (see table 27 below). A large number of vocational training institutes still remain under the
control of other public sector organizations; however, they are affiliated with the TEVTA so are the
private sector institutes. Almost 710 public and private institutes are reported to be affiliated with
TEVTA in 200287
. The structure of Punjab TEVTA and its affiliates is given in the figure 15.
In Punjab, private sector is playing a much larger role in TEVTA as compared to NAVTEC or other
provincial TEVTAs. There are 16 board members and 75% belong to private sector and only 25%
from Punjab government. The Chairman also acts as Chief Executive and is from the private sector
87
Shah 2004.
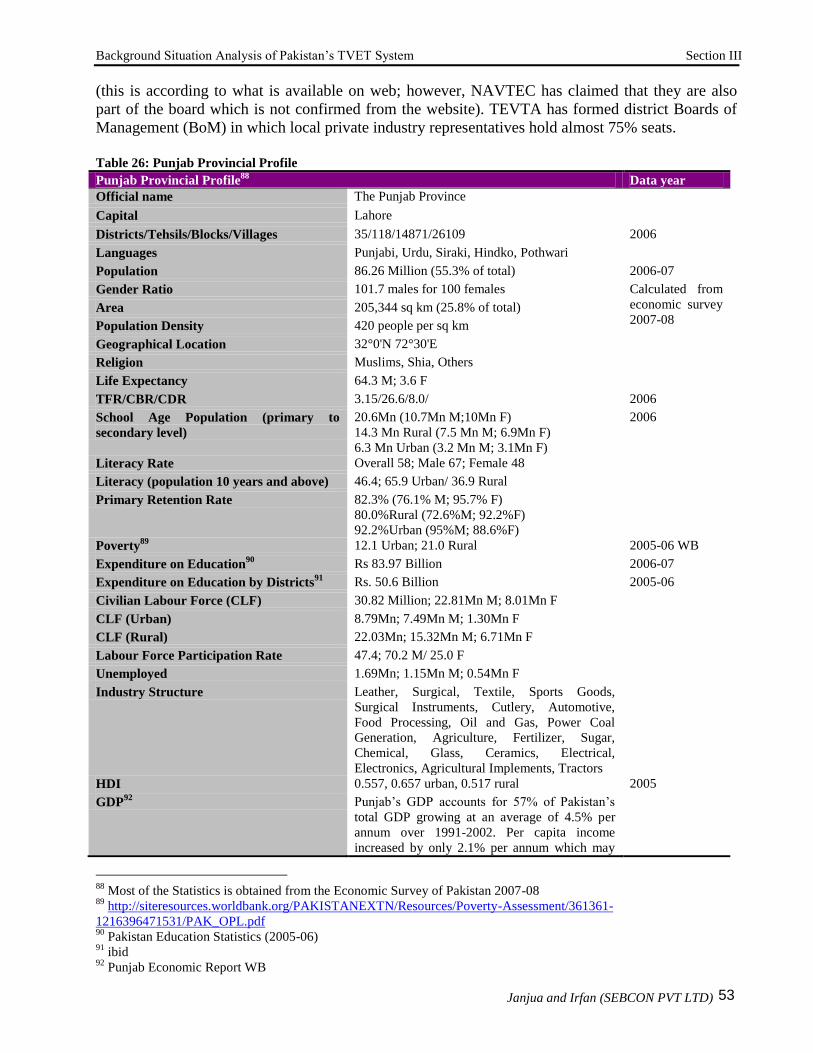
Background Situation Analysis of Pakistan‘s TVET System Section III
Janjua and Irfan (SEBCON PVT LTD) 53
(this is according to what is available on web; however, NAVTEC has claimed that they are also
part of the board which is not confirmed from the website). TEVTA has formed district Boards of
Management (BoM) in which local private industry representatives hold almost 75% seats.
Table 26: Punjab Provincial Profile
Punjab Provincial Profile88
Data year
Official name The Punjab Province
Capital Lahore
Districts/Tehsils/Blocks/Villages 35/118/14871/26109 2006
Languages Punjabi, Urdu, Siraki, Hindko, Pothwari
Population 86.26 Million (55.3% of total) 2006-07
Gender Ratio 101.7 males for 100 females Calculated from
economic survey
2007-08 Area 205,344 sq km (25.8% of total)
Population Density 420 people per sq km
Geographical Location 32°0'N 72°30'E
Religion Muslims, Shia, Others
Life Expectancy 64.3 M; 3.6 F
TFR/CBR/CDR 3.15/26.6/8.0/ 2006
School Age Population (primary to
secondary level)
20.6Mn (10.7Mn M;10Mn F)
14.3 Mn Rural (7.5 Mn M; 6.9Mn F)
6.3 Mn Urban (3.2 Mn M; 3.1Mn F)
2006
Literacy Rate Overall 58; Male 67; Female 48
Literacy (population 10 years and above) 46.4; 65.9 Urban/ 36.9 Rural
Primary Retention Rate 82.3% (76.1% M; 95.7% F)
80.0%Rural (72.6%M; 92.2%F)
92.2%Urban (95%M; 88.6%F)
Poverty89
12.1 Urban; 21.0 Rural 2005-06 WB
Expenditure on Education90
Rs 83.97 Billion 2006-07
Expenditure on Education by Districts91
Rs. 50.6 Billion 2005-06
Civilian Labour Force (CLF) 30.82 Million; 22.81Mn M; 8.01Mn F
CLF (Urban) 8.79Mn; 7.49Mn M; 1.30Mn F
CLF (Rural) 22.03Mn; 15.32Mn M; 6.71Mn F
Labour Force Participation Rate 47.4; 70.2 M/ 25.0 F
Unemployed 1.69Mn; 1.15Mn M; 0.54Mn F
Industry Structure Leather, Surgical, Textile, Sports Goods,
Surgical Instruments, Cutlery, Automotive,
Food Processing, Oil and Gas, Power Coal
Generation, Agriculture, Fertilizer, Sugar,
Chemical, Glass, Ceramics, Electrical,
Electronics, Agricultural Implements, Tractors
HDI 0.557, 0.657 urban, 0.517 rural 2005
GDP92
Punjab‘s GDP accounts for 57% of Pakistan‘s
total GDP growing at an average of 4.5% per
annum over 1991-2002. Per capita income
increased by only 2.1% per annum which may
88
Most of the Statistics is obtained from the Economic Survey of Pakistan 2007-08 89
http://siteresources.worldbank.org/PAKISTANEXTN/Resources/Poverty-Assessment/361361-
1216396471531/PAK_OPL.pdf 90
Pakistan Education Statistics (2005-06) 91
ibid 92
Punjab Economic Report WB

Background Situation Analysis of Pakistan‘s TVET System Section III
Janjua and Irfan (SEBCON PVT LTD) 54
be the root cause of poverty
Source: Academy of Educational Planning and Management, MoE, GoP
The organization has set up a help desk at Lahore Chamber of Commerce and Industries. According
to TEVTA, the main idea behind the help desk is to assist and help the local industry by utilizing its
vast network of training institutions, qualified and experienced faculty, and to achieve the objectives
of providing technically trained manpower to the industry. TEVTA has three training cum service
centres which are also involved in production: Government Polytechnic Institute (Glass and
Ceramic), Shahdara; Institute of Blue Pottery Development, Multan; Wood Working Service
Center, Gujrat. This helps them generate their funds as well.
Figure 15: Punjab TEVTA and its Affiliates
Some private institutions are working with TEVTA curricula and TEVTA is taking examinations in cases the institutions are registered with the Board
of Technical Education. While Some of these institutions are, some are not registered with TEVTA, some are with a ―no objections certificate‖
(NOC) of TEVTA. Source: conceived by the Author
The overall capacity utilization in Punjab TEVTA owned institutions is 90% (see Annex). The
institutes in each district cater for less than 0.2% of the population. However, the statistics provided
by TEVTA need to be carefully interpreted because the percentages seem to be out of total
population and not out of relevant age group population. In commerce education stream, the
enrolment in 2 year commerce diploma is the highest. In service centre based training courses DAE
in agriculture, fishing technology, leather technology, glass and ceramics, textile and weaving are
the most popular, while in short courses the AutoCAD, machinist, welder, and decoration have
higher enrolments. Similarly, among technical education stream courses the highest enrolments are
found in DAE of civil technology, chemical, electrical, electronics, auto & diesel, and mechanical
engineering courses are the prominent as far as enrolment‘s are concerned; however, some new and
emerging technology courses are also good performers with 100% capacity utilizations. Tailoring,
Colleges of Technology
Vocational Training institute
Technical Training Institutes
Polytechnic Institutes
Commerce Colleges
Apprentice Training institutes
VTC not falling under TEVTA
Department of social welfare
Department of
women
Chambers / Industrial
Estates
Public Institutes
NGOs Firms Business
Associations
Students
Private Institutes
Department of Industries
PVTC
TEVTA
Board of
Directors (16 members,
chaired by
industrialist)
Government of
Punjab 25% (Secretaries of
Dept of Ind,
Edu, Finance)
Private Sector
75% (industry representatives)
TEVTA
Affiliation
or
NOC

Background Situation Analysis of Pakistan‘s TVET System Section III
Janjua and Irfan (SEBCON PVT LTD) 55
fashion design and dress making are more popular among girls. It must be kept in mind that judging
success of programmes based on total enrolments may be misleading because some new courses are
being offered only in a very few institutions. In vocational training courses AutoCAD, computer
applications, computer hardware, electrician, fitter, machinist, refrigeration, welder courses have
higher enrolments. In case of females popular choices are beautician, dress making, tailoring, and
one year girl vocational training course have the highest enrolments.
Table 27: Consolidation of TVET Institutions under the TEVTA in 2002
Type Boys Girls Total
Government Colleges of Technology 7 - 7
Government Polytechnic Institutes 13 4 17
DBA and Diploma of Commercial Education 102 12 114
Vocational Institutes / Short courses 8 101 109
Institutes of Labour and Manpower Departments 42 4 46
Institutes of Punjab Small Industries Corporation 51 6 57
Institutes of Agriculture and Barani Area Development 29 19 48
Institutes of Agriculture 7 - 7
Institutes of Cooperative Dept 1 - 1
Total 260 146 406
Percentage 64% 36% 100%
Source: Shah (2004)
In 2002, almost 8,958 students were enrolled in TEVTA polytechnic institutes of which 1,438
(16.1%) dropped out on average. However, at institute level the dropout rates range from 3% to
52%. The authorities have summed up the reason for dropouts as wrong choice of courses or
employment before finishing the course. However, staff competence to address student needs is also
considered an important factor. The most important teacher technical teacher training facility in
Punjab TTC Gulberg was found to be in need of revamping its strength and up-gradation93
. It is
worthwhile to note that the passing rate in Punjab TVET institutions is 72%. Shah (2004) also
points out the need for improvement and rehabilitation of physical infrastructure, training labs in
technical and vocational education training institutes. He conducted a survey of several facilities
and reports that the equipment and facilities are outdated (see Hasan 2007 as well for similar
conclusions). Under the 1995-2003 ADB technical education project new facilities and innovative
demand led technology courses have been introduced; such as, glass and ceramics, bio-medical, and
textile dyeing and finishing.
Table 28: Punjab TVET Profile
Institutions Enrolments Teachers
Mal
e
Femal
e
Mixe
d
Tota
l
Male Femal
e
Total GPI Mal
e
Femal
e
Tota
l
GPI ST
R
Monotechni
c
78 4 12 94 3287
6
730 33606 0.0
2
166
6
114 1780 0.0
7
18.
9
Polytechnic 8 2 7 17 1843 382 2225 0.2
1
181 15 196 0.0
8
11.
4
Vocational 192 740 412 1344 3949
4
41087 80581 1.0
4
324
9
2266 5515 0.7
0
14.
6
Total 278 746 431 1455 7421
3
42199 11641
2
0.5
7
509
6
2395 7491 0.4
7
15.
5
Source: Academy of Educational Planning and Management (AEPM), Pakistan Education Statistics 2005-06
93
ibid
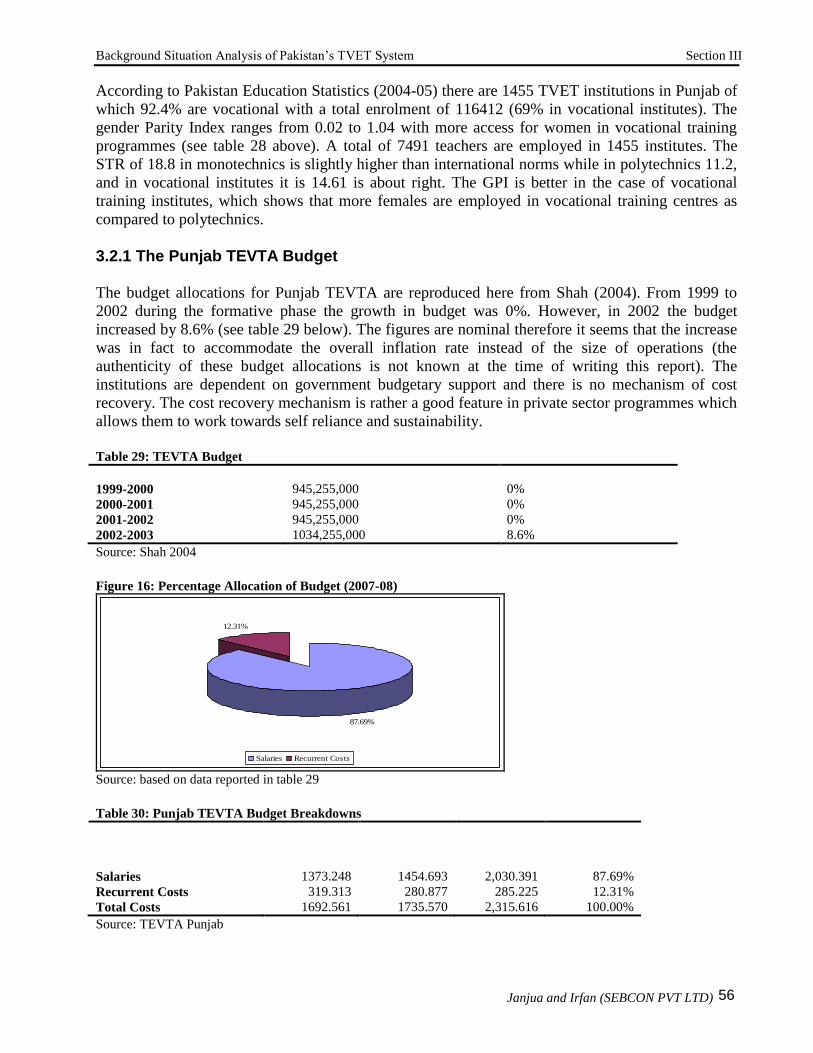
Background Situation Analysis of Pakistan‘s TVET System Section III
Janjua and Irfan (SEBCON PVT LTD) 56
According to Pakistan Education Statistics (2004-05) there are 1455 TVET institutions in Punjab of
which 92.4% are vocational with a total enrolment of 116412 (69% in vocational institutes). The
gender Parity Index ranges from 0.02 to 1.04 with more access for women in vocational training
programmes (see table 28 above). A total of 7491 teachers are employed in 1455 institutes. The
STR of 18.8 in monotechnics is slightly higher than international norms while in polytechnics 11.2,
and in vocational institutes it is 14.61 is about right. The GPI is better in the case of vocational
training institutes, which shows that more females are employed in vocational training centres as
compared to polytechnics.
3.2.1 The Punjab TEVTA Budget
The budget allocations for Punjab TEVTA are reproduced here from Shah (2004). From 1999 to
2002 during the formative phase the growth in budget was 0%. However, in 2002 the budget
increased by 8.6% (see table 29 below). The figures are nominal therefore it seems that the increase
was in fact to accommodate the overall inflation rate instead of the size of operations (the
authenticity of these budget allocations is not known at the time of writing this report). The
institutions are dependent on government budgetary support and there is no mechanism of cost
recovery. The cost recovery mechanism is rather a good feature in private sector programmes which
allows them to work towards self reliance and sustainability.
Table 29: TEVTA Budget
Budget Year Amount (in Rs) Growth Rate
1999-2000 945,255,000 0%
2000-2001 945,255,000 0%
2001-2002 945,255,000 0%
2002-2003 1034,255,000 8.6%
Source: Shah 2004
Figure 16: Percentage Allocation of Budget (2007-08)
87.69%
12.31%
Salaries Recurrent Costs
Source: based on data reported in table 29
Table 30: Punjab TEVTA Budget Breakdowns
Costs Budget 2005-
2006 (Rs. Million)
Budget 2006-
2007 (Rs. Million)
Budget
2007-2008 (Rs. Million)
Percentages
(%)
2007-2008
Salaries 1373.248 1454.693 2,030.391 87.69%
Recurrent Costs 319.313 280.877 285.225 12.31%
Total Costs 1692.561 1735.570 2,315.616 100.00%
Source: TEVTA Punjab

Background Situation Analysis of Pakistan‘s TVET System Section III
Janjua and Irfan (SEBCON PVT LTD) 57
The budget allocations for Punjab TEVTA for last three years are reported in Table 30. The findings
suggest that almost 88% is spent on salaries while 12% is allocated for recurrent costs (see figure 16
above). The cost recovery through different types of fee is only 117 million (5.1%). This reveals
that the training programmes offered by Punjab TEVTA public sector institutes are highly
subsidized unlike private sector institutes. The rate of budget utilization was not available.
3.3 NWFP TVET Profile
The table 31 below gives a brief statistical profile of the province of NWFP for curios readers.
Table 31: NWFP
Provincial Profile94 Data year
Official name The North Western Frontier Province
Capital Peshawar
Districts/Tehsils/Blocks/Villages 24/36/1913/7337 2006
Languages Pashto, Hindko / Hazara
Population Million (13.5% of total) 2006-07
Gender Ratio 101 males for 100 females (LFS) Calculated from
economic survey
2007-08 Area 74521 sq km (9.4% o total)
Population Density 287.1
Geographical Location 34°0'N 72°0'E
Religion Islam (Shia, Sunni, Other)
Life Expectancy 63.1 M ; 63.6 F
TFR/CBR/CDR 4.15/31.1/8.1 2006
School Age Population (primary to
secondary level)
5.2Mn; 3.1Mn Male; 2.15 Mn Female
Rural 4.5Mn; 2.4 Mn Male; 2.1Mn Female
Urban 0.7Mn; 0.7Mn Male; 0.05 Mn Female
2006
Literacy (population 10 years and above) 47%; 67%M; 28%F (GPI 0.42)
Primary Retention Rate 75.1% 73.2%M; 78.5% F
74.9% Rural; 71.6%M; 80.9%F
76.9% Urban; 88.2% M; 63.4% F
Poverty95 23.6 Urban; 28.0 Rural 2005-06 WB
Expenditure on Education96 Rs. 23.68 Bn 2006-07
Expenditure on Education by Districts97 Rs. 14.1 Bn 2005-06
Civilian Labour Force (CLF) 5.61Mn; 4.85 Mn Male; 0.76Mn Female
CLF (Urban) 0.94 Mn; 0.85 Mn Male; 0.09Mn Female
CLF (Rural) 4.67Mn; 4.00Mn Male; 0.67Mn Female
Labour Force Participation Rate 36.3%
Unemployed 0.53Million
Industry Structure Food Processing, Hydro Power Generation,
Agriculture, Heavy Industries in Hatar,
Horticulture, Marble, Mining, Glass, Ceramics
HDI 0.510, 0.627 urban, 0.489 rural 2005
GDP98 Real GDP growth rate on average 4.5%; per capita
income growth rate 1.5% average
2005 NWFP Econ
Report (WB)
94
Most of the Statistics is obtained from the Economic Survey of Pakistan 2007-08 95
http://siteresources.worldbank.org/PAKISTANEXTN/Resources/Poverty-Assessment/361361-
1216396471531/PAK_OPL.pdf 96
Pakistan Education Statistics (2005-06) 97
ibid 98
NWFP Economic Report

Background Situation Analysis of Pakistan‘s TVET System Section III
Janjua and Irfan (SEBCON PVT LTD) 58
TFR/CBR/CDR refers to Total Fertility Rate/Crude Birth Rate/Crude Death Rate
Source: Academy of Educational Planning and Management, MoE, GoP
On January 8, 2002 the government of NWFP consolidated its fragmented TVET programme by
merging the Directorate of Technical Education and the Directorate of Manpower and Training to
form a new Directorate of Technical Education and Manpower Training (DTEMT) which operates
under the Ministry of Industries. All technical colleges, polytechnics and vocational training
institutes, VTC, TTC, and ATC have been put under the control of new directorate. Later, NWFP
government passed an Ordinance on September 16th
2002 to form a corporate body TEVTA similar
to Punjab. However, it has not started working yet. It is interesting to note that the Chief Minister of
the province is also the chairman of the TEVTA which raises concern about private sector‘s
involvement and the sustainability of reform process. The old TVET setup was somewhat
fragmented (See figure 17 below). The TEVTA is in the process of consolidating the TVET scene
in the province (see figure 18 on next page). However, the process is slow and there seems to be
some confusion concerning what needs to be done and how to proceed; this is obviously due to a
lack of vision, a concrete strategy and implementation plan. The NWFP TEVTA may be
strengthened in this regard by donors.
Figure 17: OLD SETUP IN NWFP
Source: Focus Group Discussion with NWFP Stakeholders Outcome
In NWFP, there are a total of 727 TVET institutions in which 48,342 students are enrolled. The
overall GPI is 0.44 which indicates limited access for female population (see table 32 on next page).
GCMS
GCT
GPI
GCT
Department of
Labour Department of
Women
Department of Education
Department of Agriculture
Department of
Social Welfare
VTC
Universities /
Institutes
Public Institutes
NGOs Firms Business
Associations Students
Private Institutes
TTC/TVC
ATC
WTC
Schools / Colleges

Background Situation Analysis of Pakistan‘s TVET System Section III
Janjua and Irfan (SEBCON PVT LTD) 59
The student intake in these institutions is based on a quota system for tribal areas and districts (the
district system has its root in ethnicity, e.g. Pasthun vs Hazara).The student teacher ratio in NWFP
TVET programme is found to be 13:1 which is inline with international norms99
. The government is
the main provider of the funds to TVET institutions in public sector. The partial cost recovery is
limited to nominal tuition fee charged by the institutions. The NWFP Board of Technical Education
conducts the exams.
Figure 18: New TEVTA Setup in Making
Source: conceived by author based on focus group discussion with NWFP stakeholders and information from
government of NWFP websites
Table 32: NWFP TVET Profile
Institutions Enrolments Teachers
Mal
e
Femal
e
Mixe
d
Tota
l
Male Femal
e
Total GPI Mal
e
Femal
e
Tota
l
GPI ST
R
Monotechni
c
22 1 23 7598 215 7813 0.0
3
511 27 538 0.0
5
14.5
Polytechnic 2 1 1 4 140 20 160 0.1
4
8 1 9 0.1
3
17.8
Vocational 251 288 161 700 2576
0
14609 4036
9
0.5
7
163
8
727 2365 0.4
4
17.1
Total 275 290 162 727 3349
8
14844 4834
2
0.4
4
215
7
755 2912 0.3
5
16.6
99
This section of report heavily draws on Shah (2004)
Vocational Training Centres
Colleges of Technology and
Polytechnic Institutes
Apprenticeship Training
Centres in Industrial areas
N
W
F
P
T
E
V
T
B
Department of
Industries
Board of Tech Education
Department of
Agriculture
Department of
Social Welfare
Department of
Women
Vocational Training Centre
Directorate of Tech
Education and
Manpower Training
Employment Exchange
Public Institutes
NGOs Firms Business
Associations Students
Private/NGO Institutes
Skill Development Council
Commerce Colleges /
Commercial training Institutes
Structure and
cooperation within TEVTB and other
departments‘ VTC
s is not clear yet

Background Situation Analysis of Pakistan‘s TVET System Section III
Janjua and Irfan (SEBCON PVT LTD) 60
Source: Academy of Educational Planning and Management (AEPM), Pakistan Education Statistics 2005-06
The most common courses offered in NWFP TVET institutions are civil, electrical, electronics,
chemical, telecommunications, architecture, electronics, refrigeration and air-conditioning ad auto
and diesel technology. For women the most notable courses are dressmaking, and diploma in
commerce, and computer applications. The existing institutional base is insufficient to cater for the
demand for skills development and acquisition in the province. The private sector is not playing its
due role and is unorganized. The players include De Laas Gul Welfare trust, Jobs Creating
Development Society, and several private service providers. The industry plays an insignificant role
in influencing the courses and technology programmes offered in TVET intuitions in the province.
Substantial gender gaps exist in education and job market. There is no apprenticeship training and
job placement programme at institutional level in TVET institutions. There are significant accesses
gaps in NWFP public sector TVET landscape (see table 33 below). Almost 70% of the public
institutes cater for boys while only 30% for females. The distribution of training capacity in these
institutes is also skewed. The training capacity in institutes for boys is higher than for girls (79% for
males and 21% for females). Shah (2004) has made observations on the management structure of
TVET institutions in NWFP. The top management needs training in emerging ICT technologies so
that they can understand the needs of and adjust to the changing environment in which ICT
technologies are playing an important role.
Table 33: Government Owned TVET Institutes in NWFP
Gender Govt Technical & Vocational Centre Training Capacity
Boys 30 (70%) 2795 (79%)
Girls 13 (30%) 753 (21%)
Total 43 (100%) 3548 (100%)
Source: Annual School Census 2005-06 Government of NWFP
3.3.1 NWFP TVET Budget
Most recent budget allocations for TVET programmes in NWFP were not readily available.
However, Shah (2004) has reported the NWFP TVET budget for 2001-02. The spending pattern is
not much different than the Punjab TEVTA. Almost 89% of the budget is allocated for salaries
while only 12% is allocated for non-salary expenditure. The overall budget utilization against
allocation is 87%.
Table 34: NWFP Total TVET Budget and Expenditure (2001-02)
Budget Percentage
Allocation
Expenditure Percentage
Expenditure
Utilization
Against
Budget
Salary 10618650 89.3 9100162 88.0 85.7
Non Salary 1270600 10.7 1241379 12.0 97.7
Total 11889250 100.0 10341541 100.0 87.0
Source: Shah (2004) Figure 19: Percentage Allocation of Budget in NWFP (2001-02)

Background Situation Analysis of Pakistan‘s TVET System Section III
Janjua and Irfan (SEBCON PVT LTD) 61
89.3
10.7
Salary Non Salary
Source: based on data reported in table 34
3.4 Sindh TVET Profile
A brief statistical profile for the province of Sindh is given in table 35 on next page. A plan is
underway to consolidate provincial TVET programmes under one umbrella similar to Punjab
TEVTA. The following provincial departments are providing technical and vocational education:
Provincial Department of Education
Department of Labour and Manpower Training, and
The Directorate of Social Welfare
The Department of Transport
The private sector is not playing its due role and the Chief Minister of the province is also the
chairman of the TEVTA which raises doubt about private sector‘s involvement and all inclusiveness
of the reform process. It is worthwhile to note that very recently the Chief Executive Officer of
Sindh TEVTA resigned apparently due to frustration of too much political and bureaucratic
interferences. The willingness to put industry in the driver‘s seat in TEVTA is not fully visible at
the moment.
Prior to TVETA Sindh the Department of Technical Education (DTE) was responsible for the all
schools in technical education stream. There are 201 TE institutions, of which 22 are under
construction. DTE is also involved in implementation of PMSI and is satisfied with the progress.
All the institutions run by DTE will be passed on to TEVTA Sindh (see structure of Sindh TEVTA
in figure 20 on next page). In focus group discussions it has been revealed that though an expansion
in facilities has occurred over the past few years, the quality of education has not improved. The
institutes receive their funds from provincial government in case the institution is under the
provincial administration or by the districts in case it is administered by the later. The funds are
released by the provincial finance department as per demand of the District Coordination Officer
(DCO) in each district. In 2007, a total of 235m Rs were spent on ongoing projects, and another Rs.
27m for new schemes. Most of the funds came from the provincial government while partial cost
recovery is also in practice through student tuition fees, contributions from the Student Union Fund
(SUF), admission card fee and exams fees which is charged to students. The TVET system in Sindh
offers the following programmes:
one year certificate
two year diploma
three year Diploma (DAE)
BTE-certificates: short programmes (3 months to 1 year)

Background Situation Analysis of Pakistan‘s TVET System Section III
Janjua and Irfan (SEBCON PVT LTD) 62
Technical School Certificate (TSC), 2 years after Grade 8, vocational stream, certificate
equivalent to Matric
The most common courses offered in TVET institutions are: auto mechanic, diesel technology,
electronics, foundry, industrial electronics, mechanical drafting, mechanical engineering,
refrigeration and air-conditioning, machinist and welding, electrician, computer application, etc.
The current enrolment, and drop out rate are not known at the time of writing this report. The
capacity utilization in individual institutes range from under 20% to 100% (See NPO 2005). The
intake of students into TVET programmes is based on a quota system instead of entry tests or labour
market aptitude (the quota system has elements of ethnic composition which is considered
discriminatory).

Background Situation Analysis of Pakistan‘s TVET System Section III
Janjua and Irfan (SEBCON PVT LTD) 63
Table 35: Sindh
Provincial Profile100 Data year
Official name The Sindh Province
Capital Karachi
Districts/Tehsils/Blocks/Villages 22/105/9025/5871 2006
Languages Sindhi, Baluchi, Urdu
Population Million (23.1% of total) 2006-07
Gender Ratio 112males for 100 females Calculated from
economic survey
2007-08 Area 140,914 sq km (17.7% of total)
Population Density 254.5 persons per sq km
Geographical Location 26°0'N 69°0'E
Religion Islam (Sunni, Shia, Hindu, Christian, Other)
Life Expectancy 65.3 M; 65.6 F
TFR/CBR/CDR 3.40/26.1/7.4 2006
School Age Population (primary to secondary
level)
8.2Mn; 4.3 Mn Male; 3.9Mn Female
Rural 3.7 Mn; 1.9Mn Male; 1.8 Mn Female
Urban 4.5 Mn; 2.4 Mn Male; 2.1 Mn Female
2006
Literacy (population 10 years and above) 57.6%; 70.2%M; 43.4F
Rural 41.5%; 59.9% M; 20.2% F
Urban 72.5%; 80.0M; 64.3%F
LFS 2006-07
Primary Retention Rate 47.2%; 42.4% M; 58.1% F
Rural 43.3%; 39.6% M; 53.4% F
Urban 59.2%; 67.6% M; 52.4% F
2006
Poverty101 11.5% Urban; 31.0% Rural 2005-06 WB
Expenditure on Education102 Rs. 39.92Billion 2006-07
Expenditure on Education by Districts103 Rs. 25.4 Bn 2005-06
Civilian Labour Force (CLF) 11.70Mn; 10.36Mn M; 1.34Mn F
CLF (Urban) 5.42Mn; 5.03MnM; 0.39Mn F
CLF (Rural) 6.28Mn; 5.33Mn M; 0.95Mn F
Labour Force Participation Rate 42.7%
Unemployed 0.40Mn; 0.28 Mn Male; 0.12 Mn Female
Rural 0.15 Mn; 0.08 Mn M; 0.07Mn Female
Urban 0.25 Mn; 0.20 Mn M; 0.05Mn Female
Industry Structure Steel, Leather, Food Processing, Fish, Ship
Building, Automotive, Oil and Gas, Power
Coal Generation, Agriculture, Fertilizer, Oil
Refinery, Sugar, Chemical, Tractors
HDI 0.540, 0.659 urban, 0.456 rural 2005
GDP104 Provincial share in GDP 29%; Annual GDP
Growth Rate Avg 4%; Per Capita Income growth
Rate 3.0%
TFR/CBR/CDR refers to Total Fertility Rate/Crude Birth Rate/Crude Death Rate
Source: Academy of Educational Planning and Management, MoE, GoP
The private sector enterprises or employers are least involved in the governance of public sector
institutions in Sindh. In colleges at provincial level Institutional Management Committees (IMCs)
100
Most of the Statistics is obtained from the Economic Survey of Pakistan 2007-08 101
http://siteresources.worldbank.org/PAKISTANEXTN/Resources/Poverty-Assessment/361361-
1216396471531/PAK_OPL.pdf 102
Pakistan Education Statistics (2005-06) 103
ibid 104
Sindh Economic Report

Background Situation Analysis of Pakistan‘s TVET System Section III
Janjua and Irfan (SEBCON PVT LTD) 64
have been formed, which comprise entirely internal staff and interested parents. At district level, the
Parent Teachers Associations (PTA) are the equivalent of IMCs.
Figure 20: Sindh TVETA in Making
Source: Jutta Franz (EC-Donor TVET mission to Pakistan)
Sindh TEVTA is also planning to introduce TVET courses in registered Madrassahs in the province.
The province has also launched Benazir Bhutto Shaheed Youth Development Programme
(BBSYDP) which is fully financed by the provincial government. It is aimed at providing
employment oriented skills training to 100,000 people in Sindh. The total budget of the programme
is roughly 60 to 70 million USD. The programme is being implemented through 10 Department in
the province, while the Department of Manpower and Training (DMPT) is a leading
implementation institution among others. The programme planned to involve private training
providers as well. The training courses offered under the programme are between 3 months and 1
year duration. An effort is being made by DMPT to deliver courses in Urdu and is currently
preparing course material in popular courses in Urdu105
. We have seen some examples. The
programme covers modern occupations as well as handicraft and very local skills.
In 2005-06, a total of 51,855 students were enrolled in 454 TVET institutions (see table 36 on next
page). However, industry-institute linkages currently do not exist. The Sindh Board of Technical
Education (BTE) was established in 1970. Its responsibilities include development, streamlining
and regulation of TVET programmes in the Sindh province. BTE is responsible for affiliation of
institutions, registration of students, conducting examinations, award of diplomas and certificates,
updating curricula in cooperation with NISTE, introduction of new courses, and interaction with
industry (which is not happening in practice). Currently, there are 446 affiliated institutions offering
105
www.bbsydpsindh.gov.pk

Background Situation Analysis of Pakistan‘s TVET System Section III
Janjua and Irfan (SEBCON PVT LTD) 65
one to four year programmes and short term programmes, leading to DAE, Technical school
certificate (this is the vocational stream, which is still running in Sindh), and other certificates and
diplomas. The pass rate of examinations conducted by BTE varied from 66.8% to 67.7% for
morning and evening classes, respectively. Due to administrative reasons Sindh BTE has two
branches, one in Karachi with 136 employees, one in Sukkur with 29 employees. The estimated
expenditure in 2007-08 is 83 million Rs. The BTE generates its funds through cost recovery
mechanism.
Table 36: Sindh TVET Profile
Institutions Enrolments Teachers
Mal
e
Femal
e
Mixe
d
Tota
l
Male Femal
e
Total GP
I
Mal
e
Femal
e
Tota
l
GP
I
ST
R
Monotechni
c
19 5 6 30 1145
9
855 1231
4
0.0
7
556 34 590 0.0
6
20.
9
Polytechnic 16 7 23 2816 265 3081 0.0
9
99 3 102 0.0
3
30.
2
Vocational 40 156 205 401 1902
3
17437 3646
0
0.9
2
1218 722 1940 0.5
9
18.
8
Total 75 161 218 454 3329
8
18557 5185
5
0.5
6
1873 759 2632 0.4
1
19.
7
Source: Academy of Educational Planning and Management (AEPM), Pakistan Education Statistics 2005-06
The majority of the staff in Sindh TVET institutes is either DAE or B. Eng degree holders (see table
37 below). Many of them may not even have industry experience. There are three technical teacher
training institutes in the province; however they are not found to be fully operational and
contributing towards improvement in quality of teaching in Sindh TVET system106
.
Table 37: Qualification of Teaching Staff in Sindh TVET Institutions
Qualification GCTs GPIs Monotechnics Total Percentage
PhD 1 - - 1 0.2%
Master 3 39 9 51 10.5%
B. Eng 73 64 20 157 32.2%
B.A 1 - - 1 0.20%
B. Tech (hons) 69 13 9 91 18.6%
B. Tehc ( P) - 11 2 13 2.70%
DAE 76 81 17 174 35.6%
Total 223 208 57 488 100%
Source: Shah 2004
3.4.1 Sindh TVET Budget
The budget allocations for Sindh TVET are reported in table 38 below. The percentage distribution
of salary and non-salary related expenditure is similar to Punjab and NWFP; 88% for salary and
11.99% for non-salary component (see figure 21 on next page).
Table 38: Budget Allocations in Sindh (2008–09)
Costs (Rs. Million) Percentages (%)
Salaries 50 88.01%
Recurrent Costs 6.808 11.99%
Total Costs 56.808 100.00%
106
Shah (2004).
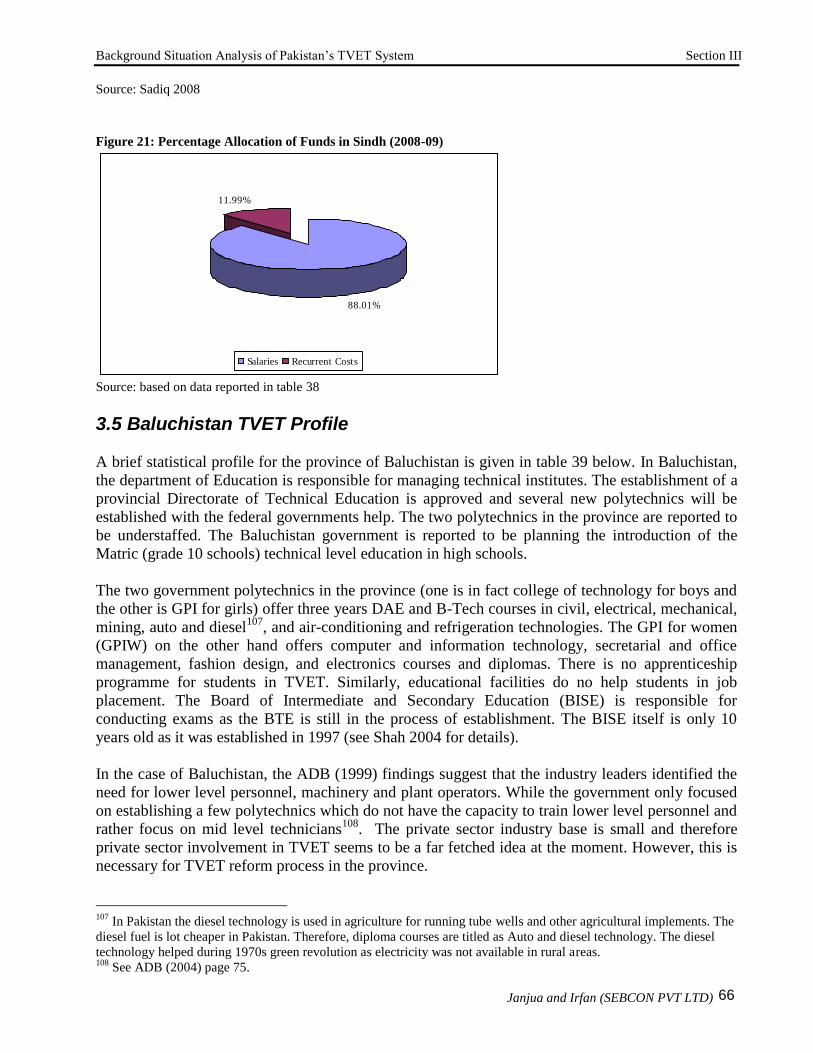
Background Situation Analysis of Pakistan‘s TVET System Section III
Janjua and Irfan (SEBCON PVT LTD) 66
Source: Sadiq 2008
Figure 21: Percentage Allocation of Funds in Sindh (2008-09)
88.01%
11.99%
Salaries Recurrent Costs
Source: based on data reported in table 38
3.5 Baluchistan TVET Profile
A brief statistical profile for the province of Baluchistan is given in table 39 below. In Baluchistan,
the department of Education is responsible for managing technical institutes. The establishment of a
provincial Directorate of Technical Education is approved and several new polytechnics will be
established with the federal governments help. The two polytechnics in the province are reported to
be understaffed. The Baluchistan government is reported to be planning the introduction of the
Matric (grade 10 schools) technical level education in high schools.
The two government polytechnics in the province (one is in fact college of technology for boys and
the other is GPI for girls) offer three years DAE and B-Tech courses in civil, electrical, mechanical,
mining, auto and diesel107
, and air-conditioning and refrigeration technologies. The GPI for women
(GPIW) on the other hand offers computer and information technology, secretarial and office
management, fashion design, and electronics courses and diplomas. There is no apprenticeship
programme for students in TVET. Similarly, educational facilities do no help students in job
placement. The Board of Intermediate and Secondary Education (BISE) is responsible for
conducting exams as the BTE is still in the process of establishment. The BISE itself is only 10
years old as it was established in 1997 (see Shah 2004 for details).
In the case of Baluchistan, the ADB (1999) findings suggest that the industry leaders identified the
need for lower level personnel, machinery and plant operators. While the government only focused
on establishing a few polytechnics which do not have the capacity to train lower level personnel and
rather focus on mid level technicians108
. The private sector industry base is small and therefore
private sector involvement in TVET seems to be a far fetched idea at the moment. However, this is
necessary for TVET reform process in the province.
107
In Pakistan the diesel technology is used in agriculture for running tube wells and other agricultural implements. The
diesel fuel is lot cheaper in Pakistan. Therefore, diploma courses are titled as Auto and diesel technology. The diesel
technology helped during 1970s green revolution as electricity was not available in rural areas. 108
See ADB (2004) page 75.

Background Situation Analysis of Pakistan‘s TVET System Section III
Janjua and Irfan (SEBCON PVT LTD) 67
The TVET infrastructure in Baluchistan is less than not adequate. There are only two technical
training institutes offering DAEs in Baluchistan to a total of 1,767 students every year. On the other
hand a total of 46 vocational training institutes enrol 2,771 students. The GCT for males and GPI
for females have dropout rates of 12.8% and 11.7%, respectively (see table 40 on next page). The
STR of 37.6 in Baluchistan technical institutes is the much higher as compared to the other
provinces of Pakistan. It is also higher than acceptable international practice.
Table 39: Baluchistan
Provincial Profile109 Source/Data year
Official name Baluchistan
Capital Quetta
Districts/Tehsils/Blocks/Villages 26/107/491/5734 AEPM (2006)
Languages Baluchi, Pashto, Barahvi, Sindhi
Population 5.0% of total 2006-07
Gender Ratio 114 males for 100 females Calculated from
economic survey
2007-08 Area 347190 sq km (43.6% of total area)
Population Density 23.1 person per sq km
Geographical Location 27°30'N 65°00'E
Religion Islam (Sunni, Shia)
Life Expectancy 60.4 M, 60.1 F AEPM (2006)
TFR/CBR/CDR 4.17/32.3/9.7 AEPM (2006)
School Age Population (primary to secondary
level)
2Mn; 1 Mn Male; 1 Mn Female
Rural 1.6 Mn; 0.9 Mn male; 0.7 female
Urban 0.4 Mn; 0.1 Mn male; 0.3 Mn female
AEPM (2006)
Literacy (population 10 years and above) 44.0; 61.1% Male; 23.3 Female
Rural 37.3%; 55.1% Male; 15.7% Female
Urban 64.9%; 79.9% Male; 46.8% Female
AEPM (2006)
Primary Retention Rate 42%; 47.7%Male; 39.2% Female
Rural 36.6%; 37.5% Male; 35.9% Female
Urban 53.4%; 59.3% Male; 46.0 Female
AEPM (2006)
Poverty110 32.4% Urban; 56.6% Rural WB 2005-06
Expenditure on Education111 Rs 9.63 Billion AEPM (2006)
Expenditure on Education by Districts112 Rs. 6.1 Billion AEPM (2006)
Civilian Labour Force (CLF) 2.20 Mn; 1.90 Mn Male; 0.30 Mn female LFS (2006-07 )
CLF (Urban) 0.43 Mn; 0.40 Mn Male; 0.03 Mn female
CLF (Rural) 1.77 Mn; 1.5 Mn Male; 0.27 Mn female
Labour Force Participation Rate 43.6%
Unemployed 0.06 Mn; 0.03Mn Male; 0.03Mn Female
Rural 0.04Mn; 0.02 Mn Male; 0.02Mn Female
Urban 0.02Mn; 0.01Mn Male; 0.01Mn Female
Industry Structure Mining, Oil & Gas, Fishing, Horticulture,
Wind power generation, Marble
HDI 0.499, 0.591 urban, 0.486 rural 2005
TFR/CBR/CDR refers to Total Fertility Rate/Crude Birth Rate/Crude Death Rate
Source: Academy of Educational Planning and Management, MoE, GoP
109
Most of the Statistics is obtained from the Economic Survey of Pakistan 2007-08 110
http://siteresources.worldbank.org/PAKISTANEXTN/Resources/Poverty-Assessment/361361-
1216396471531/PAK_OPL.pdf 111
Pakistan Education Statistics (2005-06) 112
ibid

Background Situation Analysis of Pakistan‘s TVET System Section III
Janjua and Irfan (SEBCON PVT LTD) 68
The GCT utilization was found to be more than 100% while that of GPIW facilities was 74.7% in
2002. In 2002, as reported by Shah (2004) the total sanctioned strength of teaching staff at two
polytechnics was 342 posts of which only 243 (71.1%) were filled. The qualifications of the staff
ranged form only Matric to Master‘s degree. There are large number of DAE holders and even less
qualified staff teaching in two institutions. The budget utilization was more than 100% for GCT
while for GPIW it was hardly 20% which clearly shows that the women GPI is not playing its due
role in providing training to female workforce in the province.
Table 40: Baluchistan TVET Profile
Institutions Enrolments Teachers
Mal
e
Femal
e
Mixe
d
Tota
l
Mal
e
Femal
e
Tota
l
GPI Mal
e
Femal
e
Tota
l
GPI ST
R
Monotechni
c
1 1 2 1047 720 1767 0.6
9
36 11 47 0.3
1
37.6
Polytechnic 0 0
Vocational 20 11 15 46 1861 910 2771 0.4
9
296 96 392 0.3
2
7.1
Total 21 12 15 48 2908 1630 4538 0.5
6
332 107 439 0.3
2
10.3
Source: Academy of Educational Planning and Management (AEPM), Pakistan Education Statistics 2005-06
3.6 Azad Jammu and Kashmir TVET Profile
A statistical profile for the Azad Jammu Kashmir (AJK) is given in table 41 on next page. The AJK
is located in the North of Pakistan and comprises almost 45% of what was known as State of
Jammu and Kashmir before partition in 1947. The fate of Jammu and Kashmir remained undecided
at the time of the partition; therefore, it became a disputed territory between India and Pakistan.
Both countries have fought several wars over Kashmir and skirmishes and shelling across the line of
control in Kashmir has become a regular affair. The UN has posted its observers on both sides of
the line of control; however, violations occur regularly. The innocent civilians who come in line of
fire are the victims. In 1948, after the first war was fought between Pakistan and India a ceasefire
was called in by UN and a line of control was established which vanishes up in the North at Siachen
Glacier where the most expensive fight between both countries is still going on at the highest
altitude in the world.
The Pakistan side of the Kashmir is known as Azad (free) Jammu and Kashmir. It has an
autonomous status as far as its political structure is concerned. It has its own parliament headed by a
Prime Minister who is responsible for running the affairs of the state while the President of AJK is
the executive head of the State. In 2005, a massive earthquake revealed the vulnerability of the AJK
economy. Many villages and towns are completely destroyed as they were located on the fault line.
The shelling between India and Pakistan is also an important factor behind lack of investment in
tourism and Industry especially in the Neelum valley of AJK and its adjacent areas. The Neelum
valley is also known as the Switzerland of Pakistan and has a huge tourism potential.
The Azad Jammu & Kashmir Technical Education and Vocational Training Authority is established
through promulgation of Act III of 2007 vide Notification No. Admin/ Accounts/ 315-25 /2007
dated 25th January 2007. There are seven members of the board of which only three are from
private sector. The Additional Chief Secretary of AJK is the chairman of the AJK-TEVTA board.
The organizational structure of AJK-TEVTA is heavily tilted in favour of public sector while
similar organizations in other countries are known to have higher involvement of the private sector.

Background Situation Analysis of Pakistan‘s TVET System Section III
Janjua and Irfan (SEBCON PVT LTD) 69
A detailed organogram is given in figure 22 on next page. It is not clear if there is a monitoring and
evaluation framework in place in AJK TEVTA.
The AJK TEVTA envisions strengthening the skill acquisition and development infrastructure in
the territory which will help to produce trained and skilled manpower. The ultimate objective of the
AJK skill vision is to reduce unemployment, to alleviate poverty and to provide a strong base for
sustainable socio economic development. According to AJK TVET vision 2015, it hoped that 50%
to 60% of youth will opt out for technical training. For the purpose a total of 32 skill development
centres are proposed in several different districts of AJK.
Table 41: Azad Jammu Kashmir
AJK Profile Data year
Official name Azad Jammu Kashmir
Capital Muzaffarabad
Districts/Tehsils/Blocks/Villages 2 Divisions; 8 districts; 19 Sub Divisions; 182
Union Councils; and 1646 villages
2006
Languages Kashmiri, Urdu
Population 3.9 Million 2006-07
Gender Ratio 101.2 Males per 100 Females Calculated from
economic survey
2007-08 Area 13297 Sq Km
Population Density 246 People per Sq Km
Geographical Location 33o – 36oE 73o - 75oN
Religion Muslim (Sunni, Shia)
IMR/MMR 56 per thousand live births; 350 per 100,000 live
births
2006
School Age Population (primary to secondary
level)
0.87 Million 2006
Literacy Rate 56%
Primary Retention Rate Dropout rate primary 65.9%,
Poverty113 A Participatory Poverty Appraisal (PPA) report
titled hope and despair concludes almost 50%
population living in poverty in the survey areas
where PPA was conducted. India and Pakistan
dispute is considered an important factor behind
poverty in AJK
2003 Planning and
Development
Department AJK
Expenditure on Education114 Rs. 367.847 Million 2003-04
Industry Structure Woodwork, furniture, paper, flour, textile, steel
works, tyre and rubber, food processing, shoes,
Vespa Scooter mfg, cosmetics, plastics, tourism.
AJK website
Source: http://www.ajk.gov.pk/site/index.php
Prior to the establishment of TEVTA, there were seventeen technical and vocational institutions
running under the Department of Industries Commerce and Labour. Out of those, eight were
located in the earthquake affected areas. In the aftermath of 2005 earthquake 3 were completely
destroyed while 4 were partially damaged. A total of 73 vocational institutions were running under
the Department of Social Welfare and Women Development. After the earthquake 43 were either
destroyed or damaged115
. The Vocational Training Institute (VTI) in Muzaffarabad was completely
destroyed. Similarly, the Rawalakot VTI which was completely damaged is now operating in tents.
The VT Centres in Dirkot and Bagh District were partially damaged and are now being run in
113
http://siteresources.worldbank.org/PAKISTANEXTN/Resources/Poverty-Assessment/361361-
1216396471531/PAK_OPL.pdf 114
Pakistan Education Statistics (2005-06) 115
This information is gleaned form the AJK TEVT website http://www.ajktevta.org/

Background Situation Analysis of Pakistan‘s TVET System Section III
Janjua and Irfan (SEBCON PVT LTD) 70
rented buildings. These VTCs were also functioning as youth centres. As most of the facilities were
destroyed in earthquake and people migrated; therefore, less than 100 students were attending
TEVT courses in contrast to 500 students before the earthquake. Prior to earthquake the annual
intake in VTIs was 15 to 20 per year which has decreased to 7 students per annum. After the
formation of AJK-TEVTA through an ordinance all existing technical and vocational training
institutions under the Department of Industries Commerce and Labour, the Department of Social
Welfare and Women Development, and the Department of Education are brought under the
jurisdiction of the the Authority. Only the ‗Dar-ul-Falahs‘ (welfare homes) for widows are still
running under the AJK line departments.
Figure 22: AJK TEVTA Organizational Structure
Source: http://www.ajktevta.org/OrgChart.htm
There were some Industrial Training Centres (ITCs) as well (exact number unknown) in AJK prior
to earthquake of 2005. The ITCs, Lumnian, Muzaffarabad were completely destroyed while
Aathmukam and Neelum valley ITCs are operating with very limited capacity due to the damage to
the overall TEVT infrastructure in the State. The Youth Centres in Bagh and Muzaffarabd have
also been destroyed in the earthquake.
Table 42: AJK TVET Profile
Institutions Enrolments Teachers
Mal
e
Femal
e
Mixe
d
Tota
l
Mal
e
Femal
e
Tota
l
GPI Mal
e
Femal
e
Tota
l
GPI ST
R
Monotechni
c
0 0
Polytechnic 1 1 113 15 128 0.1
3
5 5 0.0
0
25.6
Vocational 12 67 20 99 1666 3251 4917 1.9
5
180 245 425 1.3
6
11.6
Total 12 67 21 100 1779 3266 5045 1.8
4
185 245 430 1.3
2
11.7
Source: AEPM Pakistan Education Statistics 2005-06
Background Situation Analysis of Pakistan‘s TVET System Section III
Janjua and Irfan (SEBCON PVT LTD) 71
According to PES 2005-06 there was only one polytechnic institute in AJK and 100 vocational
training institutes and centres with a total enrolment of 5045 students (see table 42 above). The GPI
of 1.95 in vocational training institutes was in favour of women while in polytechnic a GPI of 0.13
shows limited access to females. The STR of 25.6 in AJK technical institutes is the second worst
after Baluchistan as compared to rest of the country and as per international norms. There are no
female teachers in the polytechnic; however, in VTIs and VTCs female teachers have a good
representation and GPI is found to be 1.36.
3.7 FATA TVET Profile
The Federally Administered Tribal Area is located in the North West of Pakistan. It acts as a buffer
zone between Afghanistan and Pakistan. The FATA is mostly inhabited by tribal Pashtuns. It
comprises seven agencies namely Bajaur, Khyber, Kurram, Mohmand, North Waziristan, Orakzai,
and South Waziristan; and six frontier regions Bannu, Dera Ismail Khan, Kohat, Lakki, Peshawar,
and Tank. Each Agency is administered by a political agent. According to Pakistan government
documents116
the FATA enjoys special status:
“Since colonial times protected by the constitution of Pakistan under Articles 246-
247 mandating that “Subject to the Constitution, the executive authority of the
Federation shall extend to the Federally Administered Tribal Areas, and the
executive authority of a Province shall extend to the Provincially Administered
Tribal Areas therein---Article 247(1)” and “Neither the Supreme Court nor a High
Court shall exercise any jurisdiction under the constitution in relation to a Tribal
Areas, unless parliament by law otherwise provides---Article 247(7).” FATA
continues to be governed primarily through the Frontier Crimes Regulation 1901
based on the “principle of collective punishment” for crimes committed by an
individual.”
As the area is not governed by provincial or federal laws; therefore, tribes settle their disputes and
crimes through their own rules. The Frontier Crimes Regulation (FCR) 1901 allows them to hold a
Jirga and reach decisions which are characterized by ―collective responsibility‖ and ―territorial
responsibility‖. An entire sub-tribe or clan can be punished for one man‘s action due to ―collective
responsibility‖ dispute settlement system. However, the residents of FATA are allowed to reach the
NWFP high court or Federal Supreme Court to challenge any decision reached under FCR. The
FATA is represented in the National Assembly and the Senate with 12 seats and 8 seats,
respectively. A brief statistical profile of FATA is given in the table 43 below.
3.7.1 Project Approval process for FATA
The project approval process for FATA development is as follows. Projects up to Rs. 20 million are
approved by Agency Development Subcommittee (ADSC) chaired by the political agents; while
projects worth over Rs 20 million but less than Rs. 200 million are approved by FATA
Development Working Party chaired by the Additional Chief Secretary FATA. The FATA
Development Authority (FDA) Board chaired by the Chief Executive (FDA) can approve project
worth Rs. 200 million. Moreover, projects worth over Rs. 200 million but less than Rs. 500 million
116
http://www.embassyofpakistanusa.org/forms/FATA%20Development%20Program%202008.pdf

Background Situation Analysis of Pakistan‘s TVET System Section III
Janjua and Irfan (SEBCON PVT LTD) 72
are sent to Central Development Working Party (CDWP) headed by the deputy chairman of the
Planning Commission (PC) of the Ministry of Planning and Development of the Government of
Pakistan for approval. Similarly, as in case of rest of the government projects, a project worth more
than Rs. 500 million needs approval from the Executive Committee of the National Economic
Council (ECNEC) headed by the Prime Minister or the Finance Minister of Pakistan.
Table 43: Federally Administered Tribal Area
Territory Profile117
Official name Federally Administered Tribal Area
Administrative Agencies / Regions FATA comprises seven agencies and six frontier regions namely
Bajaur, Khyber, Kurram, Mohmand, North Waziristan, Orakzai, and
South Waziristan; and Bannu, Dera Ismail Khan, Kohat, Lakki,
Peshawar, and Tank, respectively.
Languages Pashto, Dari
Population 3,621,000 (2.30% of total Pak Pop)
Gender Ratio 108 Males per 100 Females
Area 27,220 Sq.Km
Population Density 133.03 person per sq km
Geographical Location 33°0'N 70°0'E
Religion Muslim (Sunni, Shia)
Literacy Rate 17.42%; 29.51% Male; 3.0% Female
Primary School Enrolment (of school age
children)
50% total; 70% Male; 30% Female
Infant Mortality Rate (deaths per 1000 live
births)
87
Maternal Mortality Rate (deaths per 100,000
live births)
600
Access to improved source of drinking water 54%
Access to improved sanitation 10%
Labour Force Characteristics Labour force is supplied to army or local security forces, causal labour,
or labour to middle eastern countries, wholesale and retail trade across
the border, subsistence agriculture and livestock rearing activities.
Women undertake household work, family duties, fuel firewood
collection.
Industry Structure Marble, Guns and Ammo, Agriculture
Source: http://www.fata.gov.pk/index.php
3.7.2 Financing Mechanism for FATA Projects
FATA Finance Department (FFD) was part of NWFP secretariat until 2002; now it is part of FATA
secretariat. The FFD is responsible for allocating funds to development programmes in the region
including TVET with assistance from donors and the federal government. The department of
technical education is managed by a director along with the department of industries (Department of
Industries and Technical Education). The affairs of technical education wing are run by an assistant
director. The DTE envisions providing skilled manpower to industry, trade, banking, office
management in public and private sector with a broader objective of enabling FATA people to earn
livelihood through legal means.
117
The data is also taken from here
http://www.embassyofpakistanusa.org/forms/FATA%20Development%20Program%202008.pdf

Background Situation Analysis of Pakistan‘s TVET System Section III
Janjua and Irfan (SEBCON PVT LTD) 73
3.7.3 Skills Development in FATA
Recently, in year 2000 the government has stepped up its effort to develop the FATA and prepared
a FATA Sustainable Development Plan (SDP) 2000-2015 in this regard. The Skills development is
an integral part of FATA SDP (see Box 1 on next page). In Annual Development Plan (ADP) 2006-
07, almost Rs. 1300 million were allocated for the education sector. The budget for DTE is not part
of the education budget; nevertheless, it is included in the Department of Industries and Technical
Education (DITE) budget. In 2006-07, a sum of Rs. 200 million was allocated for DITE; the
breakdown for Industries and Technical Education is not known; however, it is only 3.2% of the
total ADP allocation. The FATA SDP planned to spend Rs 100 Mn over a 5 year period.
Box 1: FATA Technical Education Development Strategy
Table 44: FATA TVET Profile
Institutions Enrolments Teachers
Male Female Mixed Total Male Female Total GPI Male Female Total GPI STR
Monotechnic 0 0
Polytechnic 1 1 72 37 109 0.51 5 5 0.00 21.8
Vocational 12 149 24 185 1058 6196 7254 5.86 75 192 267 2.56 27.2
Total 12 149 25 186 1130 6233 7363 5.52 80 192 272 2.40 27.1
Source: AEPM Pakistan Education Statistics 2005-06
According to FATA secretariat website the DTE development strategy is as follows:
Develop market oriented, area and sector specific skills in men and women to be
employable (locally, nationally and internationally); and be able to start, run and grow
enterprises.
Enhance the quality of the skill development courses, & introduce modern required
courses.
Build capacity of the Directorates, Institutes and Centres for effective and efficient
functioning.
Collect and update data on a regular basis regarding labour market demands, skills
needed and available to meet these demands; institutions within FATA and Pakistan
available to satisfactorily develop the required skills, to make planning meaningful and
link up the skilled people with employment opportunities Upgrade skills of already
employed men and women through on the job trainings, along with literacy programmes
to promote all around improvement.
Run public sector institutions effectively and efficiently to develop a pool of the trained
workforce paving the way for the private sector, in the years to come. GoP's ample
spending for skill development is necessary at this stage only, because of the negligibly
existing private sector in FATA, high cost of skill training and poverty of most seekers of
such trainings.
Identify potential investors to promote public private partnerships.
Promote a gender balance in the training programmes.
Integrate skill development with secondary education
Source: http://www.fata.gov.pk/subpages/te.php

Background Situation Analysis of Pakistan‘s TVET System Section III
Janjua and Irfan (SEBCON PVT LTD) 74
According to AEPM (PES 2005-06) there is only one polytechnic in FATA and 185 vocational
institutes118
in which 7363 students are enrolled (1130 male and 6233 Female). The STR of 21.8 in
FATA polytechnics is worst after Baluchistan and AJK as compared to rest of the country and as
well as per international norms (see table 44 below). It is the worst for vocational institutes in the
entire country (27.2). The GPI for students is 0.51 in case of polytechnics and 5.86 for vocational
institutes. There are more female teachers employed as compared to male teachers probably due to
the fact that most vocational training institutes (centres) are for women.
3.8 Key Supply Side Stakeholders in Pakistan’s TVET System
The following stakeholders are considered important in Pakistan‘s TVET landscape:
The Pakistan National Accreditation Council (PNAC)
National Institute of Science and Technical Education
Directorate of Workers Education
Ministry of Labour, Manpower and Overseas Pakistanis and its Labour and Manpower
Division
National Staff Training institute
Skill Development Councils
Ministry of Youth Affairs
National Institute of Labour Administration and Research
National Training Bureau and National Training Board
Overseas Pakistanis Foundation
The Punjab Vocational Training Councils
Technology Up-gradation and Skills Development Company
3.8.1 Pakistan National Accreditation Council
The Pakistan National Accreditation Council (PNAC) was established under the administrative
control of the Ministry of Science and Technology. It is the apex agency that accredits competence
and conformity assessment bodies such as laboratories, certification boards and councils. The
PNAC started its accreditation services in 2001. In 2003 Canada entered into an agreement to help
Pakistan develop an improved accreditation system. It is also responsible for the formulation and
implementation of National Quality Policy and Implementation Plan (NQP & IP). PNAC reports on
its website that it represents Pakistan in the following regional and international forum:
International Laboratory Accreditation Cooperation (ILAC)
International Accreditation Forum (IAF)
Asia Pacific Laboratory Accreditation Cooperation (APLAC)
Pacific Accreditation Cooperation (PAC)
3.8.2 National Institute of Science and Technical Education (NISTE)119
In 1997 the government of Pakistan established (NISTE) under MoE by merging National
Technical Teachers Training College (NTTC) and Institute for the Promotion of Science Education
and Training (IPSET). The primary objectives of the NISTE are to improve the quality of scientific
118
The type and status of vocational institutes is not known 119
The NAVTEC claims a conflict of roles with NISTE and NTB (see Janjua and Naveed 2008).

Background Situation Analysis of Pakistan‘s TVET System Section III
Janjua and Irfan (SEBCON PVT LTD) 75
and technical education consistent with latest standards and to produce well trained manpower
equipped with latest scientific and technological knowledge inline with trends and practices of other
advanced economies. The NISTE is mandated with the following tasks:
developing research curriculum for science and technical education;
developing teaching learning resource materials;
training of trainers in technical and science education;
conducting training need assessments;
developing cost effective Teaching-Learning Resources (TLRs) instructional materials and
audio-video teaching aids;
monitoring and evaluation of the technical and science education curricula;
providing policy option and direction for promoting excellence in science and technical
education;
establishment of a management information system for science and technical education;
undertake research in science and technical education;
liaison with industry and co-ordination with national and international organizations in
science and technical education; and
development of projects/schemes/proposals in science and technical education
3.8.3 Directorate of Workers Education
The Directorate of Workers Education (DWE) established in 1982 is an educational and training
organization under the Ministry of Labour, Manpower and Overseas Pakistanis. It provides services
on labour policy and social issues to workers and their union leaders. The DWE has also carries out
educational and training activities through its head quarters and 2 Regional Centres located at
Karachi, Hyderabad, Sukkur, Lahore, Multan, Faisalabad, D.G. Khan, Peshawar, Haripur, Quetta,
Hub and Islamabad. According to its website120
since its establishment, the Directorate of Workers
Education at Headquarters and its Regional Centres has organized 17,077 courses of different
duration in which 464,000 representatives of different workers, trade unions, and departments, have
been trained up to 31st May, 2003.
3.8.4 Labour and Manpower Division of the Ministry of Labour, Manpower and Overseas Pakistanis
The Labour and Manpower Division of the MoL provides services including apprentice training,
skill upgrading courses at National Staff Training Institute (NSTI), and trade testing and
certification. It has also helped to establish Skills Development Council (SDC) which promotes
public private partnerships in training need assessments and job placements.
(i) National Staff Training Institute (NSTI)
The National Staff Training institute works under Labour and Manpower Division of the Ministry
of Labour, Manpower and Overseas Pakistanis. It offers skill up gradation courses121
.
(ii) Skill Development Councils
120
http://www.ilo.org/public/english/region/asro/bangkok/skills-ap/skills/pakistan_links.htm 121
ibid

Background Situation Analysis of Pakistan‘s TVET System Section III
Janjua and Irfan (SEBCON PVT LTD) 76
The Skill Development Council (SDC) Islamabad was constituted by the Ministry of Labour
Manpower & Overseas Pakistanis. It operates through Public-Private Partnership, with the active
involvement of the Employers Federation of Pakistan (EFP). Its objective is to identify, develop and
arrange vocational, technical, professional, and IT related training programmes through need
assessment. These training programmes are demand driven, cost effective, and flexible with
maximum participation from the employers. SDC, Islamabad also designs courses according to the
enterprise needs on their request. The Training Needs Assessment (TNA) Surveys are an important
component of its course design process. Similar councils are established in the provinces of
Pakistan. The SDC Karachi is one of the active councils and is known to be the brainchild of the
Employers Federation. SDC Karachi was the first ever SDC in Pakistan and was formed as a PPP,
constituted by the Ministry of Labour, Manpower and Overseas Pakistanis with the assistance of the
World Bank, ILO and EFP. The SDCs are employer-driven autonomous organisation, functioning
legally under the National Training Board. The SDCs are usually governed by a SDC Council with
the following composition of members: the government 50%; employers 40%; and trade unions
10%. The ILO and FES are major funding partners in their programmes.
The SDC functions include the following:
Training needs assessments
Demand led design and development of training courses
Identification and selection of training providers, both public and Private
M & E of training programmes
Arrange and conduct trade testing and certification.
Assists students in internships and job placement.
Develop tailor-made courses for staff training according to enterprise needs
Organises workshops, seminars and to promote training and employment.
3.8.5 Ministry of Youth Affairs
The Ministry of Youth Affairs is constructing Youth Development Centres across the country to
provide cultural, recreation along with vocational training facilities to the youth of the country.
According to its Yearbook allocations for the two development projects have been made in the
Public Sector Development Programme (PSDP) 2005-2006: i) Construction of Youth Development
Centre at Quetta, ii) Construction of Youth Development Centre at Peshawar. It has established
88 vocational training centres (VTC) all over Pakistan; of which 48 are for females.
3.8.6 National Institute of Labour Administration and Training (NILAT)122
The NILAT was established by the government of Pakistan in 1956 in Karachi. It is tasked with the
development of competent labour administrators, improving and increasing productivity and
efficiency of manpower in the federal and provincial governments as well as in businesses and the
industry in the private sector through skills development. It imparts knowledge on industrial
relations, trade unionism, collective bargaining, labour legislation, health and safety issues, working
conditions and environment, wages and other relevant issues through training course. NILAT
conducts workers training of trainers in labour administration and industrial relations. It also assists
its course participants in developing computer skills.
122
http://www.sesrtcic.org/research_inst_detail.php?c_code=41

Background Situation Analysis of Pakistan‘s TVET System Section III
Janjua and Irfan (SEBCON PVT LTD) 77
3.8.7 National Training Bureau aka National Training Board
The National Training Board (NTB) was established under the Ministry of Labour, Manpower &
Overseas Pakistanis through promulgation of the National Training Ordinance 1980. Under the
NTB, a Directorate General of Technical Training (DTT) was also established. The NTB, having
representatives from both the private and public sectors, is mandated with developing training
programmes, standardising skills, upgrading technical standards in existing institutions, expanding
and regulating standards of the TVET institutions and training centres in both public and private
sector123
. Four Provincial Training Boards (PTB) were set up under NTB and were assigned the task
of planning and executing provincial training plans, trade testing, and registration and evaluation of
training schemes in each province. The Vocational Training Programmes (VTP) in Pakistan are
being administered by a number of Federal, Provincial and Private agencies, e.g. Government
Vocational Institutes (GVIs), administered by the Provincial Education Department; Technical
Training Centres (TTCs), Vocational Training Centres (VTCs), Government Vocational Institute
(GVI) and Apprenticeship Training Centres (ATCs), administered by the Provincial Labour
Departments; In-Plant training Programmes i.e. Apprenticeship Training under the Apprenticeship
Training Ordinance, 1962, administered by the Provincial Directorates of Manpower and Training
of Labour Departments in establishment employing 50 or more workers. The statistics on training
institutes running under NTB is given on their website and is as follows:
Table 45: Training Institutes under NTB in Public Sector
Region No. of Institutes Capacity
Punjab 177 32821
Sindh 313 9319
NWFP 676 4694
Baluchistan 61 922
Federal 08 655
Total 1235 48411
Source: NTB website124
3.8.8 Boards of Technical Education
The National Training Board ordinance also established provincial technical training boards with
the aim to regulate TVET in provinces. The boards have the mandate to organise, regulate, develop
and control technical, vocational, industrial and commercial education. BTEs also hold and conduct
all final examinations relevant to technical, vocational, industrial and commercial education below
degree level and such other examinations as may be determined by government. The boards also lay
down the conditions for recognition of institutions and grant certificates and diplomas to persons
who have passed the boards‘ examinations.
3.8.9 Overseas Pakistanis Foundation (OPF)
The Foundation was established in March 1979 under the Emigration Ordinance. It works under the
administrative control of the Ministry of Labour, Manpower and Overseas Pakistanis of the
Government of Pakistan. The OPF has several Vocational Training Institutions and Commercial
Industrial or Service Enterprises which can be mobilized for PPP.
123
See Kardar 124
http://www.pakistan.gov.pk/divisions/ContentInfo.jsp?DivID=32&cPath=349_566&ContentID=2262

Background Situation Analysis of Pakistan‘s TVET System Section III
Janjua and Irfan (SEBCON PVT LTD) 78
3.8.10 The Punjab Vocational Training Council (PVTC)
The PVTC is corporate autonomous body which utilizes Zakat Funds for poverty alleviation by
providing training in demand led courses to Mustahqeen-a-Zakat (marginalised who are eligible for
special Islamic mode of Philanthropy called Zakat). It also helps them in job placement. PVTC runs
several vocational training centres and institutes in Punjab. The council claims to develop,
standardize and approve curriculum for trainees. On is website it asserts that in order to carry out
these functions, PVTC has been developed and staffed with qualified and competent people. Its
Objectives are as follows:
To establish at least two VTIs in each Tehsil
To impart intensive vocational training n employable skills to mustahqeen as per local
demand for their permanent rehabilitation
To provide OJT ( on the job training ) as part of the curriculum
To assist in placement of pass outs with the help of local private sector
3.8.11 Technology Up-gradation and Skills Development Company (TUSDEC)
The TUSDEC (Technology Up-gradation and Skill Development Company) was established by the
Ministry of Industries and Production to upgrade technology and skills of key and strategic
industrial clusters in Pakistan. It aims to connect Pakistan‘s industries in global value chains. The
TUSDEC is a Guaranteed Limited Company, wholly owned by the Government of Pakistan but
managed by the private sector.
The TUSDEC is setup with the following objectives:
to benchmark technologies in use in Pakistan and research technology gaps,
to facilitate and upgrade common technology needs of an industrial cluster,
to develop linkages between donors, industry, universities, and the government,
to manage a technology up-gradation fund and finance SMEs to acquire and upgrade
technology.

Background Situation Analysis of Pakistan‘s TVET System Section IV
Janjua and Irfan (SEBCON PVT LTD) 79
IV
SKILLS FORMATION IN AND OUTSIDE THE FORMAL SYSTEM
The Skills formation process in a country is reflective of its priorities for human resource
development, institutionalizing technological advancement, poverty reduction, increasing national
productivity, and economic growth. According to ADB (2004)125
“Technological change has shifted demand toward higher skills in the labour force.
New technologies are knowledge and skill intensive, and there is a need to train
people to work with those technologies. As with capital-skill complementarity,
complementarities also exist between technology and skills. The stock of human
capital appears to be positively correlated with technological dynamism. The
introduction of new technologies in lower income countries implies a reallocation of
labour from low to high productivity activities, the latter being generally both more
capital and skill intensive. This means that increased technology imports are likely to
be accompanied by a rising ratio of capital to labour, and by demand for skilled
labour.”
Skills formation in Pakistan takes place through formal, non-formal, and informal means.
According to UNEVOC 2006 the concept of education and learning is classified in the three
categories (see table 46 below). The vocational education and training programmes can be classified
as general, pre-vocational, vocational and training126
. At lower secondary level (ISCED 2) the
courses are taken by ‗less academic‘ students and were introduced in middle and secondary schools
during 1970s. However, these are mostly phased out due to lack of teaching staff and interest
among students. Similarly, upper secondary level (ISCED 3) courses were also started at the same
time. Some one year courses in polytechnics, colleges of technology, and commerce colleges may
be classified as Post Secondary non tertiary level (ISCED 4); however, no documentation has been
known in this regard. Tertiary Level (ISCED 5B) technical and vocational courses are common in
Pakistan and most three year Diplomas of Associate Engineering fall under this category.
4.1 Pathways to Skills Acquisition and the Labour Market
In the context of Pakistani society, it is very important to understand the formal, non-formal, and
informal pathways to skills acquisition and the labour market in order to design a comprehensive
reform programme for the TVET system.
4.1.1 Formal Skill Formation
According to NPO (2005) formal skills formation takes place in the following institutions in
Pakistan:
(i) Colleges of Technology/Polytechnics.
(ii) Weaving & Finishing Institutes.
(iii) Colleges of Commerce/Commercial Training Institutes.
125
ADB 2004 page 29. 126
UNESCO-UNEVOC (2006)
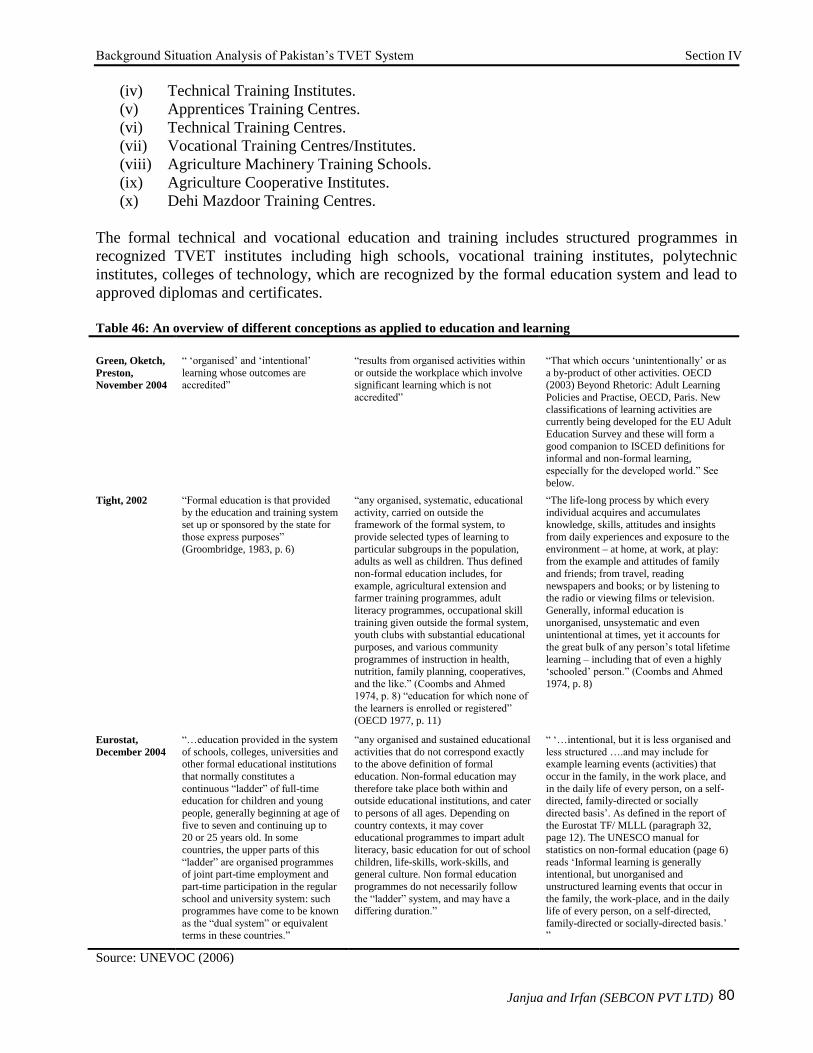
Background Situation Analysis of Pakistan‘s TVET System Section IV
Janjua and Irfan (SEBCON PVT LTD) 80
(iv) Technical Training Institutes.
(v) Apprentices Training Centres.
(vi) Technical Training Centres.
(vii) Vocational Training Centres/Institutes.
(viii) Agriculture Machinery Training Schools.
(ix) Agriculture Cooperative Institutes.
(x) Dehi Mazdoor Training Centres.
The formal technical and vocational education and training includes structured programmes in
recognized TVET institutes including high schools, vocational training institutes, polytechnic
institutes, colleges of technology, which are recognized by the formal education system and lead to
approved diplomas and certificates.
Table 46: An overview of different conceptions as applied to education and learning
Formal Education Non-Formal Education Informal Learning
Green, Oketch,
Preston,
November 2004
― ‗organised‘ and ‗intentional‘
learning whose outcomes are accredited‖
―results from organised activities within
or outside the workplace which involve significant learning which is not
accredited‖
―That which occurs ‗unintentionally‘ or as
a by-product of other activities. OECD (2003) Beyond Rhetoric: Adult Learning
Policies and Practise, OECD, Paris. New
classifications of learning activities are currently being developed for the EU Adult
Education Survey and these will form a
good companion to ISCED definitions for informal and non-formal learning,
especially for the developed world.‖ See
below.
Tight, 2002 ―Formal education is that provided
by the education and training system set up or sponsored by the state for
those express purposes‖
(Groombridge, 1983, p. 6)
―any organised, systematic, educational
activity, carried on outside the framework of the formal system, to
provide selected types of learning to
particular subgroups in the population, adults as well as children. Thus defined
non-formal education includes, for
example, agricultural extension and farmer training programmes, adult
literacy programmes, occupational skill
training given outside the formal system, youth clubs with substantial educational
purposes, and various community
programmes of instruction in health, nutrition, family planning, cooperatives,
and the like.‖ (Coombs and Ahmed 1974, p. 8) ―education for which none of
the learners is enrolled or registered‖
(OECD 1977, p. 11)
―The life-long process by which every
individual acquires and accumulates knowledge, skills, attitudes and insights
from daily experiences and exposure to the
environment – at home, at work, at play: from the example and attitudes of family
and friends; from travel, reading
newspapers and books; or by listening to the radio or viewing films or television.
Generally, informal education is
unorganised, unsystematic and even unintentional at times, yet it accounts for
the great bulk of any person‘s total lifetime
learning – including that of even a highly ‗schooled‘ person.‖ (Coombs and Ahmed
1974, p. 8)
Eurostat,
December 2004
―…education provided in the system
of schools, colleges, universities and other formal educational institutions
that normally constitutes a
continuous ―ladder‖ of full-time education for children and young
people, generally beginning at age of
five to seven and continuing up to 20 or 25 years old. In some
countries, the upper parts of this
―ladder‖ are organised programmes of joint part-time employment and
part-time participation in the regular
school and university system: such programmes have come to be known
as the ―dual system‖ or equivalent terms in these countries.‖
―any organised and sustained educational
activities that do not correspond exactly to the above definition of formal
education. Non-formal education may
therefore take place both within and outside educational institutions, and cater
to persons of all ages. Depending on
country contexts, it may cover educational programmes to impart adult
literacy, basic education for out of school
children, life-skills, work-skills, and general culture. Non formal education
programmes do not necessarily follow
the ―ladder‖ system, and may have a differing duration.‖
― ‗…intentional, but it is less organised and
less structured ….and may include for example learning events (activities) that
occur in the family, in the work place, and
in the daily life of every person, on a self-directed, family-directed or socially
directed basis‘. As defined in the report of
the Eurostat TF/ MLLL (paragraph 32, page 12). The UNESCO manual for
statistics on non-formal education (page 6)
reads ‗Informal learning is generally intentional, but unorganised and
unstructured learning events that occur in
the family, the work-place, and in the daily life of every person, on a self-directed,
family-directed or socially-directed basis.‘ ‖
Source: UNEVOC (2006)

Background Situation Analysis of Pakistan‘s TVET System Section IV
Janjua and Irfan (SEBCON PVT LTD) 81
As reported earlier the National Education Census 2005-06 there are a total of 3,059 technical and
vocational training institutes in Pakistan (excluding colleges of commerce and commercial training
institutes); of which 916 are run in public sector while 2,143 are under private administration. The
private sector comprises a large number of TVET providers as it absorbs almost 56% of the
students. It is the largest training provider to females as well as it absorbs 58.5% of female students.
In private sector Student Teacher Ratio (STR) is 16.4 which is slightly higher than accepted
international norm (see ADB 1999) while in public sector the STR is around 14-15. Yet in focus
group discussion it has been learnt the quality of training in privates sector is better than the public
sector. The formal and informal pathways to skill acquisitions and the labour market are shown
below in figure 23.
Figure 23: Formal and Informal Pathways to Skill Acquisition and Job Market
Source: Author
a) Pre-Vocational Training
The pre-vocational training was introduced in 1976-77 in schools at classes 6 to Matric. In urban
area schools, 6-8 grade students were taught industrial arts which included wood work, metal work,
and electricity while in rural areas agro-tech courses were offered. Several other vocational subjects
were offered at grades IX-X. The results were less than expected due to shortage of technical
teachers at school level, lack of physical infrastructure, and non-examinable course syllabi. It is
reported as discontinued recently.
b) Vocational Education and Training
Vocational Education and Training (VET) was offered by many federal and provincial departments
as well as private sector and NGOs. A variety of trades are being offered by both public and private
sector institutes which train both males and females. The majority of vocational institutes were
running under the umbrella of departments of labour and manpower, social welfare, Agency for
Illiterate
44-47%
Formal Sector
Entrepreneurs
Informally
Trained
Informal sector
Literate
53-56%
Unemployed
Not Part of
Labour
Force
Labour
Force Non
formally
Trained
Formally
Trained Employed
Underemployed

Background Situation Analysis of Pakistan‘s TVET System Section IV
Janjua and Irfan (SEBCON PVT LTD) 82
Barani Development, Directorate of Technical education, etc. In Punjab many of these departments
and directorates have been amalgamated under TEVTA. Similar exercises are underway in other
provinces.
c) Commercial Education
Commerce or commercial education is considered in fact professional education leading to white
collar jobs as opposed to TVET. It is however administered under TVET system by provincial
TEVTAs. The commerce institutes and colleges provide certificate courses in commerce known as
C.Com and Diploma in commerce course (D. Com) to students who have completed 10 years of
education. The curriculum approved by the ministry of education focuses on teaching secretarial
skills such as shorthand, typing, basic accountancy and book-keeping. Graduates from these
programmes have an option to continue their learning experience towards I.Com, B.Com and
M.Com which is equivalent to higher secondary, Bachelor, and Masters degree127
.
d) Technical Education
The polytechnic and monotechnic institutes and colleges of technology provide technical education
and training. These colleges were meant to fill the gap between skilled manpower and engineers by
producing associate engineers. They offer a three year post matriculation Diploma of Associate
Engineering (DAE) in several technologies. The graduates can further pursue B. Tech (Pass) and B.
Tech (Hons), each of two year duration. The degrees are awarded by various engineering
universities. However, Pakistan Engineering Council refuses to accept their equivalency to
Bachelors of Engineering. The quality of education is low in these programmes due to market
irrelevance of course taught in these institutes. The curricula are outdated and the instructional
method is typically based on learning from books. The labs are outdated and not equipped properly
therefore practice and application of theory is limited.
e) Polytechnics for Women
In order to address the needs of females in Pakistan the government has opened a few polytechnics
for women. The numbers of institutions are not enough to cater for the needs of female population.
However, due to cultural limitations initially sewing crafts, dress designing, courses were offered.
Over the years, architecture, electronics, and commerce diploma courses have also been introduced.
It has also been documented that both male and female polytechnics are poorly maintained and lab
courses are not conducted due to either lack of equipment or raw materials. The syllabi is not up-to-
date and modern teaching technologies computers, visual aids, e-learning facilities are almost non-
existent (Shah 2004 and Hassan 2007).
f) The Formal Skill Path and Hindrances
In a country that is in transition from agrarian to manufacturing and services oriented production,
upgrading the TVET system is imperative. Unfortunately, the TVET system in Pakistan has not
received significant importance in the past. It has been noted earlier that the average waiting time
for a graduate from polytechnic institutes ranges from six months to two years before they land on a
reasonable job. According to some estimates almost half of the TVET trained labour remains
127
UNESCO-UNEVOC (1995)

Background Situation Analysis of Pakistan‘s TVET System Section IV
Janjua and Irfan (SEBCON PVT LTD) 83
unemployed which gives rise to a paradox and one may ask what has gone wrong with the technical
and vocational education and training sector in Pakistan. For a while enrolment continued to decline
in Pakistan‘s TVET colleges and institutes. As compared to emerging East Asian economies with
TVET enrolment above 15% in Pakistan total enrolment in TVET system is less than 2%128
.
Besides, rates of return to TVET are not high and there are hurdles along the skill acquisition path if
one wants to adopt life long learning path. In Pakistan, transition for a student from TVET to
general education is not easy as TVET has often been associated with stigmas that obstruct
personnel and skill acquisition and development. One has to do lot of effort to overcome these
hurdles in order to move upward along the skill path to reach the pinnacle of skill pyramid. For
example, the pathways leading to technical training from vocational are not clear and obstructed by
several factors such as quotas in higher education colleges, unrecognized certification, etc.
The ADB evaluation of TVET institutions in 1999 revealed that only 10 percent of students opt for
higher studies. The system is plagued with hindrances for further skills acquisitions, growth and
graduation toward higher studies. Even after almost 18 years the problem remains. National
universities have reserved hardly two seats in each discipline for polytechnic colleges‘ DAE
diploma holders in BSc engineering programmes. A news item in the Daily Dawn on Nov 16, 2008
reported that students with trade skills are denied higher education. Some universities have
reportedly refused admission to diploma holders while the DAE is in fact equivalent to higher
secondary school certificate (Intermediate level) according to government notifications. The
universities do not accept its equivalency. They are not even allowed to sit in the University‘s
admission test to prove their eligibility129
.
4.1.2 Non-Formal TVET
The Non-formal education and training includes structured programmes that are outside formal
educational system and are more or less recognized by the industry. It may include apprenticeship
training programmes and structured on-the-job trainings in the formal sector of the economy (see
skill formation path and its relevance to general educational system above in section on Education
System and TVET). According to UNEVOC 1996, vocational training in non-formal TVET sector
in Pakistan is conducted in Technical Training Centres (TTCs), Apprenticeship Training Centres
(ATCs), Government Vocational Institutes (GVIs), and Youth Vocational Training Centres (YVCs).
The Madrassah based skills acquisition programs may also be included in non-formal.
4.1.3 Informal learning
The informal education and training can take place any where in the form of unstructured learning.
In Pakistan, the ustad-shagird (master-apprentice) system of learning is prevalent in both formal
and informal sectors of the economy. Generally, the process of informal learning is relatively slow
and is characterised by trainee abuse, neglect, exploitation, and child labour. According to Kardar
(1997):
“The primary weaknesses of training through the informal system are the excessively
long periods of informal training, in some cases eight to ten years, its inability to
address the demands of rapidly changing production processes and techniques, and
its high cost in terms of productivity and quality.”
128
ibid 129
http://www.dawn.net/wps/wcm/connect/Dawn%20Content%20Library/dawn/the-
paper/local/students+with+trade+skills+denied+higher+education

Background Situation Analysis of Pakistan‘s TVET System Section IV
Janjua and Irfan (SEBCON PVT LTD) 84
However, the most prevalent mode of informal skills acquisition is the ustad-shagird (master-
apprentice) system, followed by family business skills immersion and on-the-job training. The
ustad-shagird system is visible mostly in manufacturing, crafts, trade, transport and music.
Janjua and Janjua (2008) provide account of the informal training covenants in vogue in the
informal sector of Pakistan. There are no pre-conditions for entering the skill acquisition
arrangement with an ustad (master) such as minimum education or a binding contract, minimum
level of prior skills in the same or related discipline, etc. During the training period apprentices are
entitled to a less than subsistence income or stipend. After gaining experience majority of
apprentices proceed to self-employment or may be absorbed in small industries. The informal
learning is driven by local demand which means that apprentices learn the skills ―readily available
and demanded‖ in the market. The figure 24 below depicts informal pathways to skills acquisition.
Figure 24: Informal Pathways for Skills Acquisition
Source: Janjua and Janjua (2008)
The pace of skill formation is slow and generally depends on the willingness of ustad who may not
impart all the skills to a trainee usually to prolong the dependency of the shagird. The entire system
of learning is non-structured based on demonstration, learning by doing, and trail and error. The
ustad imparts skills based on his needs. For example, in automotive shops if he needs help in
degreasing the dismantled parts, which is in fact a dirty and hazardous job, he will teach it to
shagird. The shagird will always prepare the job for ustad so that the later conducts the most
advanced tasks on the cleaned part while the apprentice observes the process. The ustad
demonstrates one process at a time, and the shagird learns by doing and repeating the process as
and when required by the master. The informal nature of learning relationship between ustad-
shagird in the absence of a regulatory framework encourages exploitative practices such as child
labour, long working hours, verbal and physical abuse, etc. However, such factors are considered
part of the learning process due to cultural contexts. The knowledge imparted in informal learning is
less codified and rather more tacit in nature. The technological base on which the learning is
Illiterate
Literate
School
dropouts
Pool of
prospective
trainees for
informal
skill
acquisitions
Family Business in
Informal and Formal
Sectors
Apprenticeship
(Ustad-Shagird) in
Informal and
Formal sectors
Through Family
Through Family
and Acquaintances
Through Friends
and Peers
Through Mentors /or a
Local Influential
On-the-job Training

Background Situation Analysis of Pakistan‘s TVET System Section IV
Janjua and Irfan (SEBCON PVT LTD) 85
founded is relatively narrow; therefore, apprentices seldom learn the advanced trades and use of
new technologies and processes.
Skills acquisition in family enterprises is the second most prevalent source of skill transmission.
Children are expected to learn the skills of their parents, and their peers in the family. It is not only
prevalent in manufacturing, crafts, businesses, but sports and music as well. Females are considered
the most suitable candidates for this type of skill acquisition as they are not allowed to go outside
their home or neighbourhood. Young girls typically learn common skills such as embroidery,
dressmaking, crafts, from skilled women within the family as well as neighbourhood. It is also very
common in agricultural practices where children are expected to take over the family owned farms.
On-the-Job training (OJT) is also known to be an important mode of skill acquisition. This mode of
skill transmission is also very common in both the formal and informal sector. In the informal
sector, for example, construction, agriculture, mining, fishing and quarrying, the OJT is considered
to be the easiest form of learning. Mostly, it is low-end casual labour. However, in the formal sector
OJT imparts high end skills as well, for example, hospitality in tourism, teller services in banks, and
plant operation in industries etc.
It is important to note that in past Pakistan‘s TVET reform process has mainly focused on training
for modern-sector wage employment. The future reform process must take into account the needs of
the informal sector as well. However, reforming TVET system for the benefit of the informal sector
is a monumental and challenging task because the informal sector is mostly composed of self
employed and there are no employers‘ organizations. In the light of ADB 2004, one may summarize
the reform challenges as follows:
a. the existence of informal sector (master crafts people) association is necessary to start with
the reform process,
b. the informal sector associations, if they exist, might be helpful in establishing directions in
skills training,
c. there is a need for market analysis to identify occupations which are oriented towards
productive self employment,
d. rigorous and systematic evaluation of the outcome and impact of training is required for the
informal sector, and
e. the absence of post training support in areas such as access to credit, marketing services, and
continuing business advice is likely to make success of such programmes quite difficult.
4.2 Training Schemes
Kardar (1997) and Shah (2004) provide a detailed account of training programmes run by the
private and public sector.
4.2.1 Trainings in Public Sector Organizations An important feature of Pakistan‘s TVET programme is training and apprenticeship programmes run by the public sector companies such as Pakistan International Airlines (PIA), WAPDA, Pakistan Telecommunication Corporation, Pakistan Railways, Taxila Heavy Industries, Pakistan Steel, Pakistan Television Corporation, Wah Ordinance Factories, etc. The in-service training programmes produce more than 10,000 technicians every year. The Pakistan army also has the capacity to train

Background Situation Analysis of Pakistan‘s TVET System Section IV
Janjua and Irfan (SEBCON PVT LTD) 86
its technicians; many receive early retirement to become part of civilian labour force. The Small Scale Industries Corporations and Industrial Boards which are considered semi autonomous bodies also operate schemes which produce about 9,000 trained personnel each year. Kardar (1997) contends that intake in the training programme is not based on quality of trainees; these decisions are rather influenced by irrelevant factors such as political affiliation, kinship to existing workers, nepotism of bureaucracy, etc.
4.2.2 Training Programmes in the Private Corporate Sector Some large firms and multinational corporations do provide substantial training to their new recruits. They also cooperate with the government on the Apprenticeship programmes setup under Pakistan Apprentice Ship ordinance 1962. Most training is conducted on-the-job within industries and through private institutions. Some important firms in this regard are Nestle, Pakistan Telecommunications, Pak-Saudi fertilizers, etc. Some industry associations have also set up private intuitions, for example, the textile industry. The majority of the schemes are adapted to industry specific requirements. An important feature of these schemes is their relevance to industry demand inline with new technological advancements and production processes. Many NGOs have also set up vocational programmes directed at the poor and at women. There is a need to stimulate industry wide enterprise based training; however, private sector is reluctant and under-train its staff due to lack of company vision, staff retaining policies, fear of poaching of trained staff by other firms, etc
130. An incentive structure has to be in place to
encourage enterprise-based training. This includes but may not be limited to general training subsidies, levy-grant system, and company tax concessions. 4.2.3 The Apprenticeship Programme The Government of Pakistan instituted an apprenticeship programme through Apprenticeship Ordinance, 1962. It was further supplemented with Apprenticeship Rules, in 1966. Under the ordinance all manufacturing firms / enterprises employing fifty or more workers are required to recruit one apprentice for every five skilled workers
131. Though it sounds like a good initiative;
however, discussion in Kardar 1997 suggest that it has increased the cost of doing business. The apprentices attend training course in apprenticeship training institutes or in a private firm. The placements are made by the Regional Directorates. The trainees are offered a stipend which is 60 percent of the ongoing wage for that skill, and rises by 10 percent per annum over the period of training. A failure in compliance with the Ordinance can cost the owner of a firm a minimum fine of Rs. 10,000 or the maximum penalty in the form of six month imprisonment. An additional penalty of Rs. 1,000 per day is also levied if the company fails to pay the fine. Kardar (1997) reported on the inadequacy of the training system as follows:
The formal apprenticeship system produces approximately 1,500 trainees every year while the estimated requirement is more than 20,000. One estimate suggests that training under the apprenticeship programme is imparted by less than half the eligible establishments in Punjab and Sindh and by just a handful of units in NWFP and Baluchistan. Employers are reluctant to participate in a training package over which they have little control and which is thrust upon them under legislation which they consider
130
ADB 2004 page 47. 131
See Kardar (1997) for detailed discussion

Background Situation Analysis of Pakistan‘s TVET System Section IV
Janjua and Irfan (SEBCON PVT LTD) 87
coercive in nature, particularly in view of legislation which they consider coercive in nature, particularly in view of the rather rudimentary training facilities available throughout the country. They are quite unhappy with the quality of the six month training course organised by the Regional Directorates.
It is also reported that implementing agencies use their powers to seek undue rents from enterprises; therefore, many employers either refuse to participate and find other ways to resist the legislation or simply keep the size of their organization small (less than fifty employees). Apprentices are also known to take disadvantage of the clauses of the Ordinance while the government argues that the employers take advantage of the Ordinance and use apprentices as cheap labour. After the completion of the training period the apprentices are not hired as permanent workers. It must be noted that the system of placement does not give any control to enterprises over quality of trainees
132.
132
Kardar (1997).

Background Situation Analysis of Pakistan‘s TVET System Section V
Janjua and Irfan (SEBCON PVT LTD) 88
V
FINANCING OF THE TVET SYSTEM
The TVET system costing and financing has been an issue in Pakistan firstly because of lack of
commitment and secondly lack of capacity. It is evident from table reported in section 5.4 that
government allocations were not fully utilized. Technical education entails high costs as compared
to general education.
5.1 Unit Costs in the Public Sector
A detailed analysis of per unit costs in public sector technical and vocational training institute is not
available. However, some reports and dissertations have reported unit cost calculations in the past.
Shah (2004) has given some useful analysis which is reported here in this section.
Table 47: Unit costs in Colleges of Technology and Government Polytechnic Institutes Year 1987-88
Total
Enroll-
ment
Budget Cost of
Stores133
Expenditure Per
Year (1987-88)
Inflation Adjusted Cost
Projections for 2007-08
Unit cost
per
student
Unit
Store
cost per
student
Unit cost per
student
Unit Store
cost per
student134
GCT Hyderabad 1970 6973600 70000 3539.90 35.53 1341976 13471
GCT Lahore 1800 12089300 301000 6716.28 167.22 2546141 63394
GCT Multan 1732 7831700 258000 4521.77 148.96 1714202 56471
GCT Karachi 1585 9494800 120000 5990.41 75.71 2270964 28702
GCT Sahiwal 1343 4557200 250000 3393.30 186.15 1286399 70570
Sifee EZ Inst 1250 2127400 30000 1701.92 24.00 645198 9098
GPI Sialkot 1181 5125950 215000 4340.35 182.05 1645426 69015
GCI Khairpur 1178 4480980 70000 3803.89 59.42 1442054 22527
GCT Sargodha 1053 4600400 215000 4368.85 204.18 1656231 77404
GCT Peshawar 916 7547700 120000 8239.85 131.00 3123726 49664
GPI Layyah 745 3103200 129000 4165.37 173.15 1579091 65643
Habib CT Nawab Shah 603 2289200 35000 3796.35 58.04 1439197 22004
PSIT Landhi 527 4258100 70000 8079.89 132.83 3063085 50355
SPIT Gujrat 500 5140000 301000 10280.00 602.00 3897148 228218
GPI Nowshera 497 2626100 99700 5283.90 200.60 2003128 76049
GPI Jacobabad 442 1519500 30000 3437.78 67.87 1303263 25731
GPI Quetta 438 2568110 60000 5863.26 136.99 2222764 51932
GPI D.I. Khan 438 2208300 42000 5041.78 95.89 1911339 36352
Total 18198 88541540 2415700 4865.45 132.75 1844494 50324
Source: Shah (2004)
Recent budgets of polytechnic institutes were not available for analysis; however, recurrent budgets
of selected Government Colleges of Technology (GCT) and Polytechnic Institutes (GPI) in the
public sector are reported in Shah (2004) for year 1987-88. The table given above is reproduced
133
There are material supply stores in each polytechnic which provide input for practical. 134
The unit store cost per student is the total cost of stores divided by total enrolment.
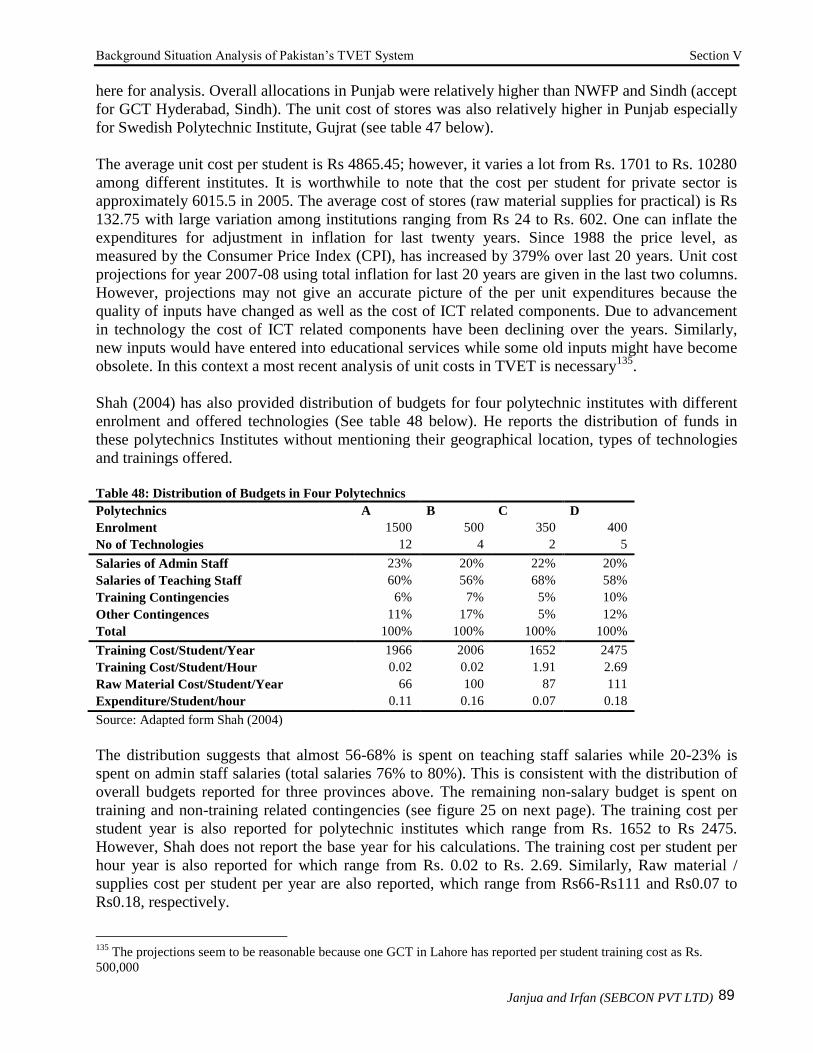
Background Situation Analysis of Pakistan‘s TVET System Section V
Janjua and Irfan (SEBCON PVT LTD) 89
here for analysis. Overall allocations in Punjab were relatively higher than NWFP and Sindh (accept
for GCT Hyderabad, Sindh). The unit cost of stores was also relatively higher in Punjab especially
for Swedish Polytechnic Institute, Gujrat (see table 47 below).
The average unit cost per student is Rs 4865.45; however, it varies a lot from Rs. 1701 to Rs. 10280
among different institutes. It is worthwhile to note that the cost per student for private sector is
approximately 6015.5 in 2005. The average cost of stores (raw material supplies for practical) is Rs
132.75 with large variation among institutions ranging from Rs 24 to Rs. 602. One can inflate the
expenditures for adjustment in inflation for last twenty years. Since 1988 the price level, as
measured by the Consumer Price Index (CPI), has increased by 379% over last 20 years. Unit cost
projections for year 2007-08 using total inflation for last 20 years are given in the last two columns.
However, projections may not give an accurate picture of the per unit expenditures because the
quality of inputs have changed as well as the cost of ICT related components. Due to advancement
in technology the cost of ICT related components have been declining over the years. Similarly,
new inputs would have entered into educational services while some old inputs might have become
obsolete. In this context a most recent analysis of unit costs in TVET is necessary135
.
Shah (2004) has also provided distribution of budgets for four polytechnic institutes with different
enrolment and offered technologies (See table 48 below). He reports the distribution of funds in
these polytechnics Institutes without mentioning their geographical location, types of technologies
and trainings offered.
Table 48: Distribution of Budgets in Four Polytechnics
Polytechnics A B C D
Enrolment 1500 500 350 400
No of Technologies 12 4 2 5
Salaries of Admin Staff 23% 20% 22% 20%
Salaries of Teaching Staff 60% 56% 68% 58%
Training Contingencies 6% 7% 5% 10%
Other Contingences 11% 17% 5% 12%
Total 100% 100% 100% 100%
Training Cost/Student/Year 1966 2006 1652 2475
Training Cost/Student/Hour 0.02 0.02 1.91 2.69
Raw Material Cost/Student/Year 66 100 87 111
Expenditure/Student/hour 0.11 0.16 0.07 0.18
Source: Adapted form Shah (2004)
The distribution suggests that almost 56-68% is spent on teaching staff salaries while 20-23% is
spent on admin staff salaries (total salaries 76% to 80%). This is consistent with the distribution of
overall budgets reported for three provinces above. The remaining non-salary budget is spent on
training and non-training related contingencies (see figure 25 on next page). The training cost per
student year is also reported for polytechnic institutes which range from Rs. 1652 to Rs 2475.
However, Shah does not report the base year for his calculations. The training cost per student per
hour year is also reported for which range from Rs. 0.02 to Rs. 2.69. Similarly, Raw material /
supplies cost per student per year are also reported, which range from Rs66-Rs111 and Rs0.07 to
Rs0.18, respectively.
135
The projections seem to be reasonable because one GCT in Lahore has reported per student training cost as Rs.
500,000

Background Situation Analysis of Pakistan‘s TVET System Section V
Janjua and Irfan (SEBCON PVT LTD) 90
Figure 25: Distribution of Budgets in Polytechnics
Polytechnic A
23%
60%6%
11%
Salaries of Admin Staff Salaries of Teaching Staff
Training Contingencies Other Contingences
Polytechnic B
20%
56%
7%17%
Salaries of Admin Staff Salaries of Teaching Staff
Training Contingencies Other Contingences
Polytechnic C
22%
68%
5% 5%
Salaries of Admin Staff Salaries of Teaching Staff
Training Contingencies Other Contingences
Polytechnic D
20%
58%10%
12%
Salaries of Admin Staff Salaries of Teaching Staff
Training Contingencies Other Contingences
Source: Based on data reported in table 48.
Recently, TEVTA Punjab has reported per year cost of training per student for the year 2006-07
(see Sadiq 2008). The unit costs in vocational training institutes are relatively higher than technical
training institutes (see table 49 below). Sadiq (2008) reports that the calculations are based on a
non-development budget and do not include amortization or depreciation, etc. However, another
training centre in Lahore, visited by Sadiq (2008) reported average cost per student per course as
Rs.70,000; however, if all costs are included the cost of training per student sums up to Rs.500,000
per annum.
Table 49: Unit Cost of Courses Reported by TEVTA
S. No Type of Institution Unit cost in Rs
1. Technical 34,198
2. Vocational 39,561
3. Commerce 22,938
Source: Sadiq 2008
The unit costs for NWFP TVET institutes in 2001-02 were found to be on average Rs. 290 per
capita, which is the lowest as compared to the Punjab province (see table 50 below). The per unit
training cost in colleges of technology and polytechnic institutes range from Rs 123 to Rs 135,
respectively (higher for female polytechnics). The costs are higher for vocational training centres
which is consistent with the findings in Punjab. The cost is highest for Hayatabad technical
vocational training centre which has been set up with the help of Chinese government. It is
interesting to not that the costs in foreign funded programmes are higher than locally financed
programmes.

Background Situation Analysis of Pakistan‘s TVET System Section V
Janjua and Irfan (SEBCON PVT LTD) 91
Table 50: Allocations for training Materials of Technical Education and Vocational Training Institutions in
NWFP in 2001-02
Allocations Training Cost Per Capita
Colleges of Technology 120000 123
Polytechnic Institutes (M) 372000 90
Polytechnic Institutes (F) 40000 135
Technical and Vocational Centers (TTC) 1888000 818
Technical and Vocational Centers (Hayatabad) 80000 1454
Technical and Vocational Centers (Male) 140000 158
Technical and Vocational Centers (Female) 21000 41
Total 2661000 290
Source: Shah (2004)
The allocation for Sindh TVET institutes in 2002 shows that the Government Colleges of
Technology (GCT) and Government Polytechnic Institutes (GPI) receive the highest proportion of
the fund allocations. The commercial training institutes and centres together receive third largest
allocation; however, given their number it is only Rs 46747 per CTC and Rs 136054 per CTI (see
table 51 below). The Monotechnic, commercial training centres, and vocational training centres
receive the lowest allocations per institute in Sindh.
Table 51: Recurrent Budget Allocations for Sindh 2002 (in Rupees)
Number Budget
Allocation
Percentage
Allocation Per
Institute
Colleges of Technology 4 7239210 28.9 1809803
Polytechnic Institutes (M) 13 6190500 24.7 476192
Polytechnic Institutes (F) 3 1228900 4.9 409633
Monotechnic Institutes 18 709420 2.8 39412
Commercial Training Institutes 15 2040816 8.1 136054
Commercial Training Centres 79 3693023 14.7 46747
Vocational Institutes (Boys) 5 976130 3.9 195226
Vocational Institutes (Girls) 5 837430 3.3 167486
Vocational Institutes 62 1828811 7.3 29497
Directorate of Technical Education 1 301670 1.2 301670
Total 204 25045920 100.0 122774
Source: Shah (2004)
5.2 Unit Costs in the Private Sector
The NEC reports figures on private institution enrolment and total expenditure on TVET. The data
can be used for overall average per unit cost calculation. In 2004-05, the total expenditure on
TVET by private sector is reported as Rs. 811.7 million which is 2.3% of the total private sector
education expenditure. Almost 134,935 students are reported as enrolled in private TVET
institutions. A back of the envelope calculation suggests per student per annum expenditure of Rs.
6015.5 in private sector TVET institutions (see national education census 2005). The NEC
document reports summary statistics only and does not provide a breakdown of incomes from
training fees, internally generated funds, external grants from the government or donors, and annual
depreciation of capital and equipment. Therefore, the estimate is just an approximation. It is also
difficult to calculate separate unit costs for technical and vocational institutes in the private sector.
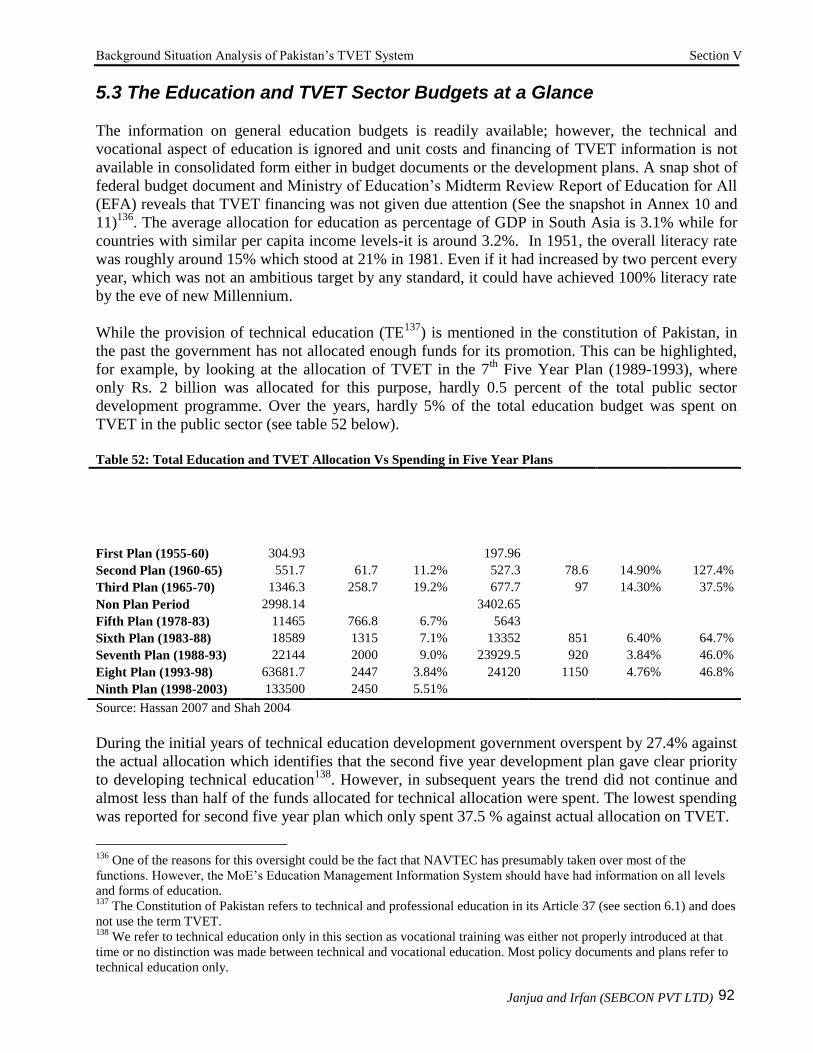
Background Situation Analysis of Pakistan‘s TVET System Section V
Janjua and Irfan (SEBCON PVT LTD) 92
5.3 The Education and TVET Sector Budgets at a Glance
The information on general education budgets is readily available; however, the technical and
vocational aspect of education is ignored and unit costs and financing of TVET information is not
available in consolidated form either in budget documents or the development plans. A snap shot of
federal budget document and Ministry of Education‘s Midterm Review Report of Education for All
(EFA) reveals that TVET financing was not given due attention (See the snapshot in Annex 10 and
11)136
. The average allocation for education as percentage of GDP in South Asia is 3.1% while for
countries with similar per capita income levels-it is around 3.2%. In 1951, the overall literacy rate
was roughly around 15% which stood at 21% in 1981. Even if it had increased by two percent every
year, which was not an ambitious target by any standard, it could have achieved 100% literacy rate
by the eve of new Millennium.
While the provision of technical education (TE137
) is mentioned in the constitution of Pakistan, in
the past the government has not allocated enough funds for its promotion. This can be highlighted,
for example, by looking at the allocation of TVET in the 7th
Five Year Plan (1989-1993), where
only Rs. 2 billion was allocated for this purpose, hardly 0.5 percent of the total public sector
development programme. Over the years, hardly 5% of the total education budget was spent on
TVET in the public sector (see table 52 below).
Table 52: Total Education and TVET Allocation Vs Spending in Five Year Plans
Total
Education
Budget
Allocation
in Rs. Mn
Allocation
for TVET
in Rs. Mn
TVET %
of total
education
Budget
Total
Education
Spending
Actual in
Rs. Mn
TVET
Actual
Spending
in Rs.
Mn
TVET %
of Total
Education
Spending
TVET %
Utilized
Against
Allocation
First Plan (1955-60) 304.93 197.96
Second Plan (1960-65) 551.7 61.7 11.2% 527.3 78.6 14.90% 127.4%
Third Plan (1965-70) 1346.3 258.7 19.2% 677.7 97 14.30% 37.5%
Non Plan Period 2998.14 3402.65
Fifth Plan (1978-83) 11465 766.8 6.7% 5643
Sixth Plan (1983-88) 18589 1315 7.1% 13352 851 6.40% 64.7%
Seventh Plan (1988-93) 22144 2000 9.0% 23929.5 920 3.84% 46.0%
Eight Plan (1993-98) 63681.7 2447 3.84% 24120 1150 4.76% 46.8%
Ninth Plan (1998-2003) 133500 2450 5.51%
Source: Hassan 2007 and Shah 2004
During the initial years of technical education development government overspent by 27.4% against
the actual allocation which identifies that the second five year development plan gave clear priority
to developing technical education138
. However, in subsequent years the trend did not continue and
almost less than half of the funds allocated for technical allocation were spent. The lowest spending
was reported for second five year plan which only spent 37.5 % against actual allocation on TVET.
136
One of the reasons for this oversight could be the fact that NAVTEC has presumably taken over most of the
functions. However, the MoE‘s Education Management Information System should have had information on all levels
and forms of education. 137
The Constitution of Pakistan refers to technical and professional education in its Article 37 (see section 6.1) and does
not use the term TVET. 138
We refer to technical education only in this section as vocational training was either not properly introduced at that
time or no distinction was made between technical and vocational education. Most policy documents and plans refer to
technical education only.
Background Situation Analysis of Pakistan‘s TVET System Section VI
Janjua and Irfan (SEBCON PVT LTD) 93
VI TVET PROGRAMS AND INITIATIVES
This section entails TVET past and present initiatives in Pakistan organized by the public and
private sector and donor agencies.
6.1 Major TVET Programmes
In past, the government of Pakistan has implemented several TVET development initiatives with
the help of donors. The following projects are considered major and important in Pakistan‘s TVET
timeline by UNEVOC (1996) and Shah (2004):
Vocational training Development Programme started in 1968 funded by the World Bank and
UNDP. The first phase was called National Vocational Training Programme (NVTP) Phase
I. The second phase of NVTP was funded by IBRD, ILO, UNDP, EC, and CIDA. Under the
programme several new centres were constructed, expansion for existing centres and
institutes was undertaken and equipment was provided to centres where needed.
NTTC and Polytechnics Project 419-Pak (SF) funded by ADB. An important component of
the project was the establishment of National Teachers Training Centre (NTTC).
Development of Teachers Learning Resources (LTR) helped to develop teaching resources
for course in 7 leading technologies namely, civil, electronic, mechanical, chemical, radio,
TV, and auto and diesel.
Overseas Scholarships for Polytechnic Teachers trained teachers in 7 key technologies.
Teachers were sent for a 10 month diploma course to UK institutes and universities.
Technical and Vocational Education Project Pakistan (TA No. 999-PAK) was implemented
with assistance from ADB under which a major study of TVET system was conducted in
Pakistan in 1989.
ADB 2000-2004 TVET reform project was also a major milestone and the most talked about
in TVET provision in Pakistan.
6.2 Past and Present Donor Cooperation on TVET in Pakistan
Some of the projects are already mentioned above in section 6.2. This section draws upon research
reported in Janjua et al. (2008). A gist of the past and ongoing donor initiatives for curious readers
is given below.
ADB has supported Pakistan to strengthen its TVET system in the following areas a) restructure and
strengthen institutional capacity and promoting efficiency b) improvement in quality of services and
strengthening of industry institution linkages c) increased access for women and poor d) providing
job guidance after training to gender and disabled in earthquake affected areas. Mostly, ADB –
focus appears to be on poverty alleviation, macroeconomic adjustment and rural development. It has
financed two big projects on TVET in Pakistan. A 60 million dollar project that started in 1995 and
lasted until 2002 funded the expansion and capacity enhancement of TVET institutions in Pakistan.
It has also initiated two multi-million US$ ADB projects in 2005 for restructuring of technical and
vocational education in the North West Frontier Province and the Baluchistan Province.

Background Situation Analysis of Pakistan‘s TVET System Section VI
Janjua and Irfan (SEBCON PVT LTD) 94
AusAID has shown increasing interest in TVET and is providing assistance to Pakistan for tertiary
level technical education as part of the tertiary education. The objective is to promote the skills and
knowledge base to address the development, educational and research requirements of the country.
The AusAID has provided support to NAVTEC through exposure trips to the Australian TVET
system and especially the Australian National qualification Framework. Assistance for research and
institutional linkages to increase agricultural productivity is also under consideration.
The British Council (BC) has closely worked with the government of Pakistan in past. It has not
only provided scholarships for higher studies yet helped local institutions in strengthening
partnerships with their counterpart institutions in UK. Other BC Projects include Connecting
Classrooms (promoting schools links), Development Partnerships for Higher Education (DelPHE)
and New Silk Routes (Arts/Design). The BC is also helping Pakistani institutions offering O and A
levels in administering exams. The BC is also helping NAVTEC in its initiatives on Skills for
Employability, building partnerships between Pakistani and UK TVET institutions. It is also
engaged in Youth Engagement Services (YES) Network Pakistan.
China has assisted Pakistan in a number of economic, scientific and technical initiatives. TVET
support has always been a major component of their assistance. It is helping the government of
Pakistan on developing centres of excellence. It has helped to provide advanced technical training
and provision of equipment which can turn Advanced Technical Training Centre (ATTC) Peshawar
into a centre of excellence. Several vocational institutes have been opened in various parts of
Pakistan with cooperation from Chinese government. It is worthwhile to note that new technology
courses have been introduced in these centres such as food technology, renewable energy,
pharmaceutical, and fish and shrimp production and processing.
CIDA has entered into a debt SWAP agreement with the government of Pakistan to improve quality
of basic education through teacher training. The TVET is not part of the SWAP. However, some
livelihood projects in Earthquake areas do have a vocational training component. CIDA's
programme in Pakistan has a major emphasis on promoting the role of women by improving their
access to health care, education, income generation opportunities, access to local politics; and
promoting women in advocacy work with the government and the general public.
EC has renewed its commitment for poverty reduction under the new Third Generation Cooperation
Agreement in 2004 covering the time period 2007-2013. The agreement has two focus areas: a)
improving rural development and natural resource management in NWFP and Baluchistan aiming at
reducing income disparities through improving livelihoods, creating income generating activities
and providing employment opportunities with a special focus on gender; b) education and human
resource development with the aim to produce a skilled and well trained workforce.
GTZ is not providing assistance under stand alone TVET projects at the moment although it has a
long history in doing so. However, it is supporting broader projects having a component for skill
promotion and training provision. The GTZ in partnership with other like minded donors such as
DFID and EC is aiming at strengthening the implementation of NAVTEC‘s Skilling Pakistan
initiative. Initial assessments are underway to design TVET assistance to Pakistan.
ILO has been providing assistance in a number of areas ranging from skill enhancement to
supporting the provision of decent employment. In addition, ILO has assisted in strengthening as
well as establishment of various training institutions like women training centres and Skills

Background Situation Analysis of Pakistan‘s TVET System Section VI
Janjua and Irfan (SEBCON PVT LTD) 95
Development Councils. In accordance with its guiding principle of tripartism, ILO cooperates with
the Government of Pakistan through the Ministry of Labour Manpower and Overseas Pakistan, the
Employers‘ Federation of Pakistan and the Pakistan‘s Worker Federation to achieve its strategic
objectives. ILO assistance has extended a variety of services such as: advisory services, manpower
training, institutional capacity development, knowledge base development and provision of
equipments. The assistance has been provided in the following areas: formulation of policies for
employment; vocational training; child labour; bonded labour; youth engagement in education and
training; poverty reduction; equality and justice at work place; rights for women workers; skill
provision and education and training for workers; and employment and alternative income
generating opportunities for families of child labour. The ILO Training for Rural Economic
Empowerment (TREE) project is worth mentioning. The programme ran from 2003-07 and was
funded by the U.S. Department of Labour. It was aimed to expand economic opportunity and
income security through education, skills development and livelihood creation for the marginalised
groups, people with disabilities in disadvantaged geographical areas of NWFP and Punjab.
The Netherlands has been very active in providing support and assistance to Pakistan in the areas
of Governance, Education and Environment/Water. TVET was not declared as a separate area of
assistance but such activities were an integral part of the support provided by the Netherlands.
Public-Private Partnerships with Pakistani Industrial Associations: leather, textile, paper, sugar: to
introduce cleaner production processes, efficient use of water and energy, waste treatment (with
Pakistan Tanneries Association and Textile Association) are notable areas of TVET cooperation by
the Netherlands government.
USAID has assisted Pakistan in a number of economic, scientific and technical initiatives. TVET
support has always been a major component of their assistance. Its cooperation programmes address
education, health, economic growth and good governance in Pakistan. The Education Sector
Reform Assistance (ESRA) programme is a $74.5 million initiative funded by USAID which aims
at supporting the Government of Pakistan's Education Sector Reform (ESR) effort. Many USAID
project especially focused on increasing competitiveness of Pakistani businesses have built in
components on vocational training. Future areas of cooperation are being considered.
JICA has played a key role in supporting government of Pakistan‘s TVET initiatives not only
directly but through ADB as well. The Government of Japan‘s grant assistance helped in
establishing the Construction Machinery Training Institute (CMTI), now called the Construction
Technology Training Institute (CTTI), in 1986. Over the years Government of Japan and JICA has
played valuable role in developing human resources in Pakistan. Government of Japan has assisted
Pakistan for the reactivation of TVET institutions in earthquake affected areas. In addition, TVET
system has been supported in Balochistan as part of the broader project aiming at improving the
quality and efficiency of education in province. Japan has also supported Pakistan through provision
of scholarship with the aim to support the poor students. JICA enjoys a positive relationship with
NAVTEC and have formed a recent collaboration with it to further the TVET cause. JICA is
looking for opportunities to extend and consolidate activities in relation to TVET which it considers
to be the most important sector of education in Pakistan. Linkages with a running literacy project
are intended with a view to creating employment opportunities for dropouts from formal education.
Japan‘s cooperation in TVET focuses improving the quality of secondary and technical education
with special emphasis on women empowerment.

Background Situation Analysis of Pakistan‘s TVET System Section VI
Janjua and Irfan (SEBCON PVT LTD) 96
UNESCO provides support to Pakistan provincial TVET programmes as well as to NAVTEC for a
number of areas including: improving linkage between TVET and the formal education system;
provision of managerial skills; training of teaching as well as administrative staff; private sector
involvement in TVET; and commissioning research studies on TVET. The UNESCO also provides
direct budget support for education, and education scheme for rural development to the government
of Pakistan. The UNEVOC Centre for Pakistan is the National Institute of Science & Technical
Education. NISTE; however, NAVTEC has indicated that they are also being considered for
cooperation in their capacity as an apex organization.
UNHCR has been supporting Pakistan through provision of vocational training programmes to
female Afghan refugees. Furthermore, it has been involved in support for vocational training in
earthquake affected areas under ‗Community Services‘ and ‗Capacity Building‘ programmes.
According to the 23rd Guiding Principle on Internal Displacement that UNHCR adheres to,
accessibility to training amenities in particular for displaced women and adolescents figures as a
priority along with the provision of education. Also in the ―Strategy for Post Relief Phase 2006‖,
vocational training activities that facilitate displaced persons‘ return to their original homes is
mentioned under the heading of ‗Protection Framework for Return.‘
World Bank is assisting Pakistan for poverty reduction under Pakistan Poverty Alleviation Fund
(PPAF) programme. The project aims at reducing poverty by providing micro credit loans and skills
and training for various poverty alleviation projects. The programme aims to provide training for a
number of areas including management, financial, mechanical and technical, water conservation,
agriculture, horticulture, livestock and marketing. The project has a mandate to cover all the rural
and less developed areas of Pakistan in the coming 10 to 15 years. The PPAF is a US$9 million
project aimed at providing training to community members to enhance their income generating
skills and increase their understanding of markets and marketing practices.
6.3 Prime Minister’s Skill Development Initiative (PMSI)
Recently, in 2006 the government has launched PMSI which is also known as (aka) Hunarmand
Pakistan is a programme running from 2006 to 2013 with an overall allocation of Pak Rs. 2.0
billion. The programme is at the core of so called envisaged target of training 1,000,000 Pakistanis
as stated in the MTDF. The training programme is targeted towards marginalized youth and women.
It covers the cost of training plus pays a stipend of Rs. 3000 per month to trainees for short-term
training programmes, running usually between 3 and 6 months. In some cases, some capital costs
have also been granted to institutions. The programme is criticized for the way it is being
implemented and needs critical evaluation.

Background Situation Analysis of Pakistan‘s TVET System Section VII
Janjua and Irfan (SEBCON PVT LTD) 97
VII CONCLUSION
The analysis in this report suggest that TVET system planning and strengthening did not receive
due recognition in national plans and vision documents along with general education. After the
establishment of NAVTEC and setting up of widely known training target of one million skilled
workers by 2010 there is a strong perception that the government is keen on reforming TVET
system of Pakistan. The NAVTEC is in its formative phase and needs to strengthen its capacity to
implement NSS. It is also felt that the devolution of authority is must for the success of the reform
process so that the training institutes respond quickly to local market demands, resource,
mobilization, and subsequent allocation. The Strengthening of provincial TEVTAs may be
necessary to build effective public private partnerships as they are one of the primary stake holders
in TVET system. It will also help in achieving the goals and objectives of the NSS. The
establishment of a TVET management Information System is imperative for successful
implementation of the NSS as the existing information on Pakistan‘s TVET system has gaps and the
data on enrolments, capacity utilization, and teaching staff strength in TVET is unreliable.
The TVET infrastructure is in need of up-gradation so is the curricula, the capacity and quality to
teaching staff in existing polytechnics and vocational training institutions in Pakistan. The teaching
staff needs new ICT skills so that they can prepare and deliver courses in a better way. The
industry-institution linkages are weak and need to be strengthened in order to develop demand
driven courses for skills acquisition and enhancement. On the other hand, focus on informal
learning is also required. The informal system of learning caters for the skill acquisition need of the
majority of population. Designing a system of training for the informal sector should be given top
priority as it absorbs majority of the labour force. A system of Recognition of Prior Learning (RPL)
may ensure that no one is left behind. A major shift is also necessary from time-based qualifications
to competency based trainings.
Given the gaps in existing studies and shortcomings in labour force databases a comprehensive
labour market review and tracer study is necessary for proper direction and feedback for the reform
process139
. In order for TVET reform to have far reaching impact top priority must be given to a
paradigm shift which should not only focus on incorporating demand led skills and the training
provision and acquisition but also focus on disassociating stigmas attached with TVET through
information and media campaigns.
139
ADB (2004) also highlights this point (see page 91).

Background Situation Analysis of Pakistan‘s TVET System Annexure
Janjua and Irfan (SEBCON PVT LTD) 98
ANNEXURE Annex 1: Labour Market Indicators
Indicators 2003-04 2005-06 Indicators 2003-04 2005-06
Crude Activity (Participation) Rates (%) Labour Force (In millions)
Pakistan Total 45.5 50.05
Total 30.4 32.2 Male 37.35 39.97
Male 48.7 50.3 Female 8.15 10.08
Female 11.2 13.3 Employed
Augmented Total 42 46.94
Total 38.5 40 Male 34.89 37.81
Female 27.5 28.8 Female 7.11 9.13
Rural Unemployed
Total 31 33.2 Total 3.5 3.11
Male 48.2 49.9 Male 2.46 2.16
Female 13.2 16 Female 1.04 0.95
Augmented Employment by Sector (%)
Total 42.2 43.9 Total 100 100
Female 35.8 37.3 Agriculture 43.1 43.4
Urban Manufacturing 20.3 20.7
Total 29.2 30.2 Services 36.6 35.9
Male 49.8 51
Female 7 7.9 Unemployment Rates (%)
Augmented Pakistan
Total 31.1 32.1 Total 7.7 6.2
Female 10.8 11.7 Male 6.6 5.4
Refined Activity (Participation) Rates (%) Female 12.8 9.3
Pakistan Rural
Total 43.7 46 Total 6.7 5.4
Male 70.6 72 Male 5.7 4.6
Female 15.9 18.9 Female 10.9 7.7
Augmented Urban
Total 55.3 57 Total 9.7 8
Female 39.3 41.1 Male 8.4 6.9
Rural Female 19.8 15.8
Total 46.3 48.9 Literacy Rates (%)
Male 72.6 73.8 Pakistan
Female 19.5 23.4 Total 51.6 53.1
Augmented Male 63.7 65
Total 62.9 64.7 Female 39.2 40.6
Female 52.7 54.6 Rural
Urban Total 41.6 43.9
Total 39.2 40.7 Male 56.3 58.2
Male 67.1 68.7 Female 26.6 29.3
Female 9.4 10.6 Urban
Augmented Total 69.7 69.8
Total 41.7 43.2 Male 76.5 77.1
Female 14.5 15.8 Female 62.5 61.8
Source: LFS 2005-06

Background Situation Analysis of Pakistan‘s TVET System Annexure
Janjua and Irfan (SEBCON PVT LTD) 99
Annex 2: Percentage distribution by Gender of those who ever received TVET by Gender 2005/06
S. No Type of Training Male Female Total
1 Computer course 24.61 22.91 24.23
2 Other 12.44 12.70 12.50
3 Driving course 12.73 0.24 9.94
4 Electrician 9.47 0.15 7.38
5 Embroidery & knitting course 2.57 20.45 6.58
6 Garment making 1.90 16.87 5.25
7 Dispenser course 3.71 1.58 3.23
8 Mechanical engineering tech. 3.50 0.82 2.90
9 Draftsman 2.47 4.22 2.86
10 Civil engineering tech. 3.27 0.98 2.76
11 Electrical engineering tech. 2.99 1.23 2.60
12 Auto mechanical course 2.53 1.10 2.21
13 Refrigeration & air conditioning 2.63 0.07 2.06
14 General nursing course 0.43 5.70 1.61
15 Typing & shorthand course 1.95 1.51
16 Welding course 1.81 1.41
17 Carpentry 1.65 1.28
18 Auto & farm machinery 1.22 0.95
19 Weaving course 0.61 2.10 0.94
20 Textile tech 0.71 1.47 0.88
21 Diploma in Radio & TV 0.94 0.73
22 Mason 0.83 0.37 0.73
23 LHV course 0.06 2.75 0.66
24 Architect tech 0.77 0.07 0.61
25 Plumbing & pipe fitting 0.77 0.60
26 Diploma in design 0.68 0.16 0.56
27 Laboratory technician 0.59 0.45 0.56
28 Silma tilla (embroidery) 0.14 1.67 0.48
29 Midwifery course 0.07 1.64 0.42
30 Turner course 0.34 0.26
31 X-Ray Tech 0.31 0.24
32 Diploma in Art 0.27 0.21
33 Pattern making course 0.24 0.19
34 Leather work 0.22 0.17
35 Wood work 0.19 0.15
36 Flower making 0.15 0.12
37 Cooking course 0.13 0.10
38 Polishing & soldering 0.31 0.07
39 Livestock & poultry farming course 0.08 0.07
40 Total 100.00 100.00 100.00
Source: Author Calculations from LFS 2005-06
Annex 3: Percentage Distribution of Pakistani Labour Force Supplied to Overseas Markets

Background Situation Analysis of Pakistan‘s TVET System Annexure
Janjua and Irfan (SEBCON PVT LTD) 100
Sr.
No.
Categories 1971-
2000
2001 2002 2003 2004 2005 Total Estimated
Jan-June
2007
1 Engineer 0.78 1.12 0.68 0.45 0.59 0.79 0.76 0.76
2 Welder 1.33 1.13 1.22 1.78 1.20 1.20 1.33 1.33
3 Foremen 1.35 0.81 0.90 1.07 1.04 1.27 1.27 1.27
4 Mason 9.32 10.15 8.90 8.94 9.22 8.09 9.26 9.26
5 Carpenter 6.45 6.69 7.83 7.27 7.59 6.71 6.64 6.64
6 Electrician 4.17 4.32 5.17 4.69 4.07 3.51 4.22 4.22
7 Plumber 1.80 2.21 2.77 2.59 1.99 1.32 1.89 1.89
8 Steel Fixer 3.62 4.28 4.94 4.77 4.51 4.12 3.83 3.83
9 Painter 2.49 2.78 2.48 2.72 2.18 2.10 2.48 2.48
10 Technician 4.08 5.70 7.37 6.93 6.92 7.23 4.71 4.71
11 Mechanic 3.49 2.90 3.26 3.46 2.98 3.10 3.42 3.42
12 Cable worker 0.13 0.03 0.08 0.03 0.05 0.07 0.11 0.11
13 Driver 11.41 16.90 14.16 11.54 10.02 9.71 11.59 11.59
14 Operator 1.41 1.38 1.92 2.02 1.24 3.10 1.52 1.52
15 Surveyor 0.25 0.15 0.14 0.13 0.12 0.11 0.22 0.22
16 Fitter 0.59 0.81 0.77 0.80 0.77 1.29 0.65 0.65
17 Programmer 0.07 0.53 0.32 0.19 0.25 0.37 0.12 0.12
18 Designer 0.01 0.17 0.22 0.31 0.07 0.04 0.05 0.05
19 Rigger 0.05 0.25 0.06 0.05 0.11 0.10 0.06 0.06
20 Draftsman 0.04 0.10 0.05 0.32 0.08 0.05 0.06 0.06
Total Professional and Skilled 52.83 62.40 63.22 60.07 54.98 54.27 54.21 54.21
21 Laborers 47.17 37.60 36.78 39.93 45.02 45.73 45.79 45.79
Total Emigrated 100 100 100 100 100 100 100 100
Source: Adapted from World Bank 2007

Background Situation Analysis of Pakistan‘s TVET System Annexure
Janjua and Irfan (SEBCON PVT LTD) 101
Annex 4: Supply of Pakistani Labour to Oversees Markets
Sr.
No.
Categories 1971-
2000
2001 2002 2003 2004 2005 Total Estimated
Jan-June
2007
1 Engineer 18,338 1,227 861 821 880 951 23,078 975
2 Welder 31,103 1,237 1,545 3,263 1,770 1,435 40,353 1,706
3 Foremen 31,528 884 1,147 1,964 1,544 1,522 38,589 1,631
4 Mason 218,229 11,083 11,312 16,415 13,645 9,685 280,369 11,851
5 Carpenter 151,112 7,304 9,954 13,355 11,231 8,027 200,983 8,495
6 Electrician 97,623 4,718 6,570 8,614 6,024 4,201 127,750 5,400
7 Plumber 42,067 2,412 3,517 4,760 2,944 1,581 57,281 2,421
8 Steel Fixer 84,786 4,674 6,273 8,760 6,680 4,935 116,108 4,908
9 Painter 58,327 3,032 3,146 4,995 3,233 2,516 75,249 3,181
10 Technician 95,569 6,229 9,366 12,719 10,250 8,651 142,784 6,035
11 Mechanic 81,820 3,169 4,142 6,358 4,406 3,705 103,600 4,379
12 Cable worker 2,932 35 96 50 70 78 3,261 138
13 Driver 267,078 18,467 17,984 21,182 14,830 11,626 351,167 14,843
14 Operator 32,966 1,504 2,433 3,707 1,829 3,709 46,148 1,951
15 Surveyor 5,769 163 183 237 185 128 6,665 282
16 Fitter 13,737 884 974 1,475 1,141 1,547 19,758 835
17 Programmer 1,523 583 404 354 371 443 3,678 155
18 Designer 327 181 277 564 104 46 1,499 63
19 Rigger 1,144 277 74 97 156 118 1,866 79
20 Draftsman 847 106 62 594 113 63 1,785 75
Total
Professional
and Skilled
1,236,825 68,169 80,320 110,284 81,406 64,967 1,641,971 69,404
21 Laborers 1,104,353 41,074 46,726 73,318 66,650 54,735 1,386,856 58,621
Total
Emigrated
2,341,178 109,243 127,046 183,602 148,056 119,702 3,028,827 128,025
Source: WB (2007)

Background Situation Analysis of Pakistan‘s TVET System Annexure
Janjua and Irfan (SEBCON PVT LTD) 102
Annex 5: Definitions of programme orientations according to ISCED and the UIS
ISCED UIS
GENERAL
Similarities
Designed mainly to lead pupils to a deeper understanding of a subject or group of subjects, especially, but not
necessarily, with a view to preparing pupils for further education at the same or a higher level.
Typically school-based.
Differences regarding labour market-relevant qualifications
Successful completion of these programmes may
or may not pro-vide participants with a labour
market-relevant qualification at this level.
They do not typically allow successful completers to enter
a particular occupation or trade or class of occupations or
trades without further training.
Other differences
Programmes with a general orientation and not
focusing on a particular specialisation should be
classified in this category.
Successful completion of these programmes may or may
not lead to an academic qualification.
May or may not contain vocational elements.
General education has a technical or vocational content of
less than 25%, but pre-technical/pre-vocational
programmes (i.e. programmes with a technical/vocational
content of more than 25% that do not lead to a labour
market-relevant vocational or technical qualification) are
typically reported with general programmes.
PRE-VOCATIONAL
Similarities
Mainly designed to introduce participants to the world of work and to prepare them for entry into vocational or
technical education programmes.
Successful completion of such programmes does not yet lead to a labour market-relevant vocational or
technical qualification.
For a programme to be considered as pre-vocational or pre-technical education, at least 25% of its content has
to be vocational or technical.
Differences
This minimum is necessary to ensure that the vocational subject or the technical subject is not only one among
many others.
VOCATIONAL
Designed mainly to lead pupils to acquire the practical skills, know-how and understanding necessary for
employment in a particular occupation or trade (or class of occupations or trades).
Successful completion of such programmes normally leads to a labour-market relevant vocational qualification
recognized by the competent authorities (e.g. Ministry of Education, employers‘ associations, etc.) in the
country in which it is obtained.
Source: UNEVOC (2006)

Background Situation Analysis of Pakistan‘s TVET System Annexure
Janjua and Irfan (SEBCON PVT LTD) 103
Annex 6: The System of Education and Training in Pakistan
Source: UNEVOC 1995
Annex 7: Difference between Technical and General Education
Technical Education General Education
Provides skills with knowledge Provides knowledge only
Focused on job oriented terminal education Not target towards jobs.
More value addition in all diplomas & degrees,
through learning by doing
No value addition, at all. Provides only
theoretical knowledge.
Academic & technical skills are more useful for
Industry.
Only bookish knowledge not useful for
industry/employment.
Enables trainees to get into job market much earlier
in life
In the majority of cases low rate of
employment with no career growth
opportunities, most of the jobs are
clerical/office work
Less dependence on parents’ income More dependence on parents‘ income
An ever increasing demand of skills Most of the times become burden on the
country‘s resources.
Market forces demand skilled workers. Market can not consume unskilled
employees
Enables self-employment and generates possibilities
of export of trained manpower, which remains a big
source of balance of payments and budgetary
support
Less possibility of self - employment

Background Situation Analysis of Pakistan‘s TVET System Annexure
Janjua and Irfan (SEBCON PVT LTD) 104
Source: Kazmi (2007)

Background Situation Analysis of Pakistan‘s TVET System Annexure
Janjua and Irfan (SEBCON PVT LTD) 105
Annex 8: District Wise Enrolments in Punjab TEVTA institutes
District *Population Seats Available Enrollment Percentage
Boys Girls Co-
Education
Total Capacity
Utilization
of Population
covered
Attock 1,447,000 3,269 1,779 287 0 2,066 63 0.14%
Bahawalnagar 2,340,000 4,837 2,642 727 0 3,369 70 0.14%
Bahawalpur 2,761,000 6,265 3,920 1,108 1,119 6,147 98 0.22%
Bhakkar 1,193,000 3,268 2,110 1,030 0 3,140 96 0.26%
Chakwal 1,230,000 1,073 555 352 0 907 85 0.07%
D.G.Khan 1,865,000 6,084 1,045 1,872 3,055 5,972 98 0.32%
Faisalabad 6,162,000 8,742 6,076 731 618 7,425 85 0.12%
Gujranwala 3,860,000 3,359 3,930 357 0 4,287 128 0.11%
Gujrat 2,325,000 3,341 3,227 342 26 3,595 108 0.16%
Hafizabad 945,000 356 250 58 0 308 87 0.03%
Jhang 3,217,000 2,670 1,784 562 0 2,346 88 0.07%
Jhelum 1,064,000 2,850 939 593 836 2,368 83 0.22%
Kasur 2,696,000 2,152 1,777 544 0 2,321 108 0.09%
Khanewal 2,348,000 2,905 839 591 1,816 3,246 112 0.14%
Khushab 1,028,000 1,262 1,179 168 0 1,347 107 0.13%
Lahore 7,171,000 14,320 8,702 2,283 327 11,312 79 0.16%
Layyah 1,272,000 4,415 3,352 605 0 3,957 90 0.31%
Lodhran 1,330,000 711 569 63 0 632 89 0.05%
Mandi Baha-ud-din 1,317,000 3,422 3,399 60 0 3,459 101 0.26%
Mianwali 1,199,000 2,606 1,753 870 0 2,623 101 0.22%
Multan 3,537,000 8,045 6,777 798 2,065 9,640 120 0.27%
Muzaffargarh 2,992,000 1,966 798 246 373 1,417 72 0.05%
Nankana Sahib 331 177 128 0 305 92
Narowal 1,436,000 1,034 878 197 0 1,075 104 0.08%
Okara 2,534,000 1,992 1,710 191 0 1,901 95 0.08%
Pakpattan 1,460,000 794 979 0 0 979 123 0.07%
R.Y.Khan 3,565,000 4,506 3,588 491 0 4,079 91 0.11%
Rajanpur 1,253,000 1,917 1,573 477 0 2,050 107 0.16%
Rawalpindi 3,818,000 6,629 4,186 2,976 0 7,162 108 0.19%
Sahiwal 2,092,000 6,191 4,853 342 667 5,862 95 0.28%
Sargodha 3,026,000 8,028 4,291 824 2,109 7,224 90 0.24%
Sheikhupura 3,769,000 2,196 1,814 220 0 2,034 93 0.05%
Sialkot 3,091,000 5,891 4,550 795 0 5,345 91 0.17%
Toba Tek Singh 1,841,000 3,155 2,507 676 0 3,183 101 0.17%
Vehari 2,373,000 4,202 2,038 903 937 3,878 92 0.16%
Total: 83,557,000 134,784 90,546 22,467 13,948 126,961 94 0.15%
*Population estimates are for year 2004 (NIPS, Islamabad)
Source: Punjab TEVTA

Background Situation Analysis of Pakistan‘s TVET System Annexure
Janjua and Irfan (SEBCON PVT LTD) 106
Annex 9: Formal and Informal Learning
Source: Tazeen Fasih 2008

Background Situation Analysis of Pakistan‘s TVET System Annexure
Janjua and Irfan (SEBCON PVT LTD) 107
Annex 10: Snap Shot of Federal Budget Allocations for Education
Classification Budget
2007-08
Revised
2007-08
Budget
2008-09
EDUCATION AFFAIRS AND SERVICES 24,147 24,280 24,622
Pre-Primary & Primary Education Affairs Services 1,981 2,004 2,368
Secondary Education Affairs and Services 2,801 2,874 3,464
Tertiary Education Affairs and Services 17,283 17,319 17,461
Education Services Non-definable by Level 37 37 35
Subsidiary Services to Educations 23 23 26
Administration 1,552 23 739
Education Affairs, Services (not elsewhere) 470 470 529
Source: Budget in Brief, Ministry of Finance
Annex 11: The Education Budget from 2001-02 to 2005-06
Aspects 2001-02 2005-06 Increase (+) or Decrease (-)
Percent
Pupil Teacher Ratio at Primary 36 40 +11.0
Pupil Teacher Ratio at Secondary 15 15 -100.0
Facilities
Drinking Water 57 69 +21.0
Sanitation 44 63 +43.0
Public Expenditure on Education
Annual Budget of Education (Billion) 78.90 170.70 +116.0
Percentage of Total Government Expenditure 9.60% 12.20% +27.0
Percentage of GNP 1.80% 2.20% +22.0
Percentage on Primary Education 43.10% 43.60% +1.0
Percentage on Secondary Education 16.20% 24.30% +50.0
Percentage on Tertiary Education 4.30% 13.00% +202.0
Per Pupil Expenditure at Primary Level (Rs.) 1,928 6,436 +234.0
Per Pupil Expenditure as % GNP (Primary) 4.00% 8.80% +120.0
Per Pupil Expenditure at Secondary Level (Rs.) 2,536.00 6,815 +278.0
Per Pupil Expenditure as % of GNP (Secondary) 6.40% 9.70% +51.0
Per Pupil Expenditure at Tertiary Level (Rs.) 9,112.00 40,332 +342.0
Source: EFA, Medium term Review 2008

Background Situation Analysis of Pakistan‘s TVET System Bibliography
Janjua and Irfan (SEBCON PVT LTD) 108
BIBLIOGRAPHY
ADB. 1999. Impact Evaluation Study of the Technical and Vocational Education Projects in
Malaysia, Pakistan, Papua New Guinea, and Sri Lanka. Asian Development Bank. IES: REG
99035.
ADB. 2002. Project Performance Audit Report on The Second Barani Area Development Project
(Loan 1012-Pak[Sf]) In Pakistan. Asian Development Bank Report No.Pak 21220.
http://www.adb.org/Documents/PERs/IN213_02.pdf
ADB. 2004. Evaluation of Recent ADB Projects in Skills Development in Improving Technical
Education and Vocational Training Strategies for Asia. Manila.
ADB. 2005. Balochistan Economic Report. Project No. 39003
ADB. 2007. Country Assistance Program Evaluation of Pakistan.
Almeida, Rita K. and Reyes Aterido. 2008. The Incentives to Invest in Job Training: Do Strict
Labor Codes Influence this Decision? The World Bank and IZA
http://siteresources.worldbank.org/SOCIALPROTECTION/Resources/SP-Discussion-
papers/Labor-Market-DP/0832.pdf
Aly, Hasan Javed. 2007. Education in Pakistan: A White Paper (Revised). National Education
Policy Review Team.
Butt, Rafique and Khalid Hayat. 1991. Monitoring of Vocational Training Programmes in
Pakistan.‖ Asian HRD Planning Network working papers RAS/86/071. New Delhi: ILO/ARTEP,
1991. 80 p.
CSF. The State of Pakistan‘s Competitiveness. Various years.
DOL. 2008. Pakistan Country Child Labour Profile. By US Department of Labour Bureau of
International Labour Affairs. http://www.dol.gov/ilab/media/reports/iclp/sweat/pakistan.htm
Fasih, Tazeen. 2008. Linking Education Policy to Labour Market Outcomes
http://siteresources.worldbank.org/EDUCATION/Resources/278200-1099079877269/547664-
1208379365576/DID_Labor_market_outcomes.pdf
FBS. Household Integrated Economic Survey. Various years, Islamabad: Federal Bureau of
Statistics.
FBS. Labour Forces Survey Statistics. Various years, Islamabad: Federal Bureau of Statistics.
FBS. Pakistan Social Living Measurement Survey. Various years, Islamabad: Federal Bureau of
Statistics.
GoP. 1996. Summary results of Child Labour Survey in Pakistan. Federal Bureau of Statistics
(FBS), Statistics Division Ministry of Labour, Manpower and Overseas Pakistanis and the

Background Situation Analysis of Pakistan‘s TVET System Bibliography
Janjua and Irfan (SEBCON PVT LTD) 109
International Labour Organization‘s (ILO) International Programme on the Elimination of Child
Labour (IPEC).
GoP. 1999. Report of National Manpower Commission.
GoP. 2002. Ordinance No. II of 2002: an Ordinance further to amend the National Training
Ordinance, 1980. Islamabad. http://www.pakistan.gov.pk/divisions/law-division/media/II-2002.pdf
GoP. 2004. The Constitution of the Islamic Republic of Pakistan. Islamabad: The National
Assembly of Pakistan. http://www.na.gov.pk/publications/constitution.pdf
GoP. 2004. The Development of Education: National Report of Pakistan. Islamabad: the Ministry of
Education.
GoP. 2005. Medium Term Development Framework. Islamabad: The Planning Commission of
Pakistan.
GoP. 2005. Vision 2030. Islamabad: The Planning Commission of Pakistan.
GoP. 2006. National Education Census: Highlights. The Statistics Division of the Academy of
Education Planning and Management. Islamabad: the Ministry of Education.
GoP. 2006. Pakistan Education Statistics 2005-06. The Academy of Education Planning and
Management. Islamabad: the Ministry of Education.
GoP. 2005. NAVTEC Ordinance 2006. Islamabad.
GoP. 2006. Pakistan Education Statistics 2007. Academy of Education Planning and Management.
Islamabad: the Ministry of Education.
GoP. 2007. Sustainable Economic Growth, Employment and Human Resource Development. A
Manuscript of the Ministry of Labour, Manpower, and Overseas Pakistanis (Policy Planning Cell).
GoP. 2007. Education in Pakistan: A White Paper (Revised). Document to Debate and Finalize The
National Education Policy. February Prepared by Javed Hasan Aly and National Education Policy
Review Team
GoP. 2007. The Demographic Dividend: Unleashing the Human Capital. Background Briefs,
Pakistan Development Forum 25-27 April 2007, the Economic Affairs Division (EAD), Ministry of
Economic Affairs and Statistics, Government of Pakistan, www.pakistan.gov.pk/PDF/index.jsp
GoP. 2008. Draft National Education Policy 2008. Islamabad: the Ministry of Education.
GoP. 2008. Education for All: Mid Decade Assessment. Country Report 2008 by the Ministry of
Education.
GoP. 2008. FATA Development (2000-2015). Economic Division of the Embassy of Pakistan in
USA.
Background Situation Analysis of Pakistan‘s TVET System Bibliography
Janjua and Irfan (SEBCON PVT LTD) 110
GoP. 2008. Federal Budget in Brief. Islamabad: The Ministry of Finance, Government of Pakistan.
GoP. 2008. Reorientation of Education. Message to the All Pakistan Educational Conference held in
Karachi on 27th November, 1947 in Quaid-i-Azam Muhammad Ali Jinnah: Speeches and Quotes.
http://www.pakistan.gov.pk/Quaid/speech13.htm
GoP. 2008. The Economic Survey of Pakistan. Islamabad: the Ministry of Finance.
Government of Azad Jammu and Kashmir. 2003. Between Hope and Despair: Pakistan
Participatory Poverty Assessment Azad Jammu and Kashmir Report. Muzaffarabad: Planning and
Development.
Government of NWFP. 1990. Survey Report on Employability of Technical Manpower in NWFP
during the period 1982-86. Survey carried out by the NWFP Board of Technical Education in
collaboration with Friedrich Ebert Stiftung and the National Manpower Commission.
Government of NWFP. 2007. FATA Sustainable Development Plan 2007-2015. The Civil
Secretariat FATA Peshawar.
Government of Pakistan. 1947. Mr. Jinnah‘s Presidential Address to the Constituent Assembly of
Pakistan. August 11.
Government of Pakistan.1984. Pakistan/Netherlands Study: Profiles of Informal Employment in
Urban Areas. Ministry of Labour and Manpower and Overseas Division.
Government of Pakistan, 1991. Report of the National Manpower Commission. Ministry of Labour,
Manpower and Overseas Pakistanis.
Hassan, Hamid Mian. 2007. Relevance of Diploma of Associate Engineer Curricula with the Job
Requirement. Institute of Education and Research. Lahore: The University of the Punjab.
IFAD. 2001. Pakistan: Theory versus Practice in Demand-Led Vocational Training among Women
in Theme: Demand-led vocational training can have trade-offs in terms of the impact on women.
http://www.ifad.org/gender/learning/sector/extension/pk_vocation.htm
ILO. 1992. Training Needs Survey: Preliminary Report.
ILO. 2007. Decent Employment and the Millennium Development Goals in CEB Toolkit for
Mainstreaming Employment and Decent Work. In Asia and the Pacific: Islamic Republic of
Pakistan. Bangkok: UNESCO Principal Regional Office for Asia and The Pacific.
IMF. 2004. Pakistan: Poverty Reduction Strategy Paper. Washington: International Monetary Fund.
Janjua, Yasin and Arif Naveed. 2008. NAVTEC‘s Current and Projected Activities and Capacity to
Institutionalize and Implement Reforms. Working Paper No. 4, for supporting the program design
process for the National Skills Strategy of Pakistan Nov 2008. Islamabad: SEBCON (pvt) Ltd.

Background Situation Analysis of Pakistan‘s TVET System Bibliography
Janjua and Irfan (SEBCON PVT LTD) 111
Janjua, Yasin and Shehryar Janjua. 2008. A Study of the Informal Economy and Informal Skills
Acquisition in Pakistan. Working Paper No. 2, for supporting the program design process for the
National Skills Strategy of Pakistan Nov 2008. Islamabad: SEBCON (pvt) Ltd.
Janjua, Yasin, Shmyalla Jawad, Wajeeha Bajwa, and Nazam Mehmood. 2008. International Support
to TVET in Pakistan: Past and Present. Working Paper No. 3, for supporting the program design
process for the National Skills Strategy of Pakistan Nov 2008. Islamabad: SEBCON (pvt) Ltd.
Jilani, Anees. The Legal Framework for Combating Child Labour in Pakistan.
http://www.unicef.org/china/P3_JILLANI_paper_child_labor.pdf
Kardar, Shahid. 1999. ―Technical & Vocational Training in Pakistan.‖ The Lahore Journal of
Economics, Vol.2, No.2.
Kazmi, Syeda Wadiat. 2007. ―Vocational Education and Skills Development: A Case of Pakistan.‖
SAARC Journal of Human Resource Development, Vol. 3, No. 1.
Kemal, A.R., and Zafar Mehmood, 1993. Labour Absorption in the Informal Sector and Economic
Growth in Pakistan. Friedrich Ebert Stiftung, Islamabad.
King, Kenneth. 2007. The Politics of Skill, and the Challenge of Supporting Technical and
Vocational Education and Training (TVET) in Pakistan. The Role of Unesco, past, present and
future. Unpublished manuscript.
Mir, Mohammad Ali. 1990. Development of Technical Education in Pakistan: A Critical Study of
Objectives and Achievements. PhD Thesis, University Of Karachi, Karachi.
Munir, Shafqat. 2002. Vocational Education and Training (VET): Pakistan situation analysis (1959-
2002) and Partnership needs to promote VET through research study. Paper in Conference on
―Structural Change in Vocational Education: Promotion of Vocational Education Partnership
between Europe and West and Central Asian Countries‖ held at Forum hotel, Alexanderplatz,
Berlin, September 29-30, 2002
Nawaz, Shuja. 2008. Crossed Swords: Pakistan, its Army, and the Wars Within. Karachi: Oxford.
Rashid, Ahmed. 2008. Descent into Chaos: How the War against Islamic Extremism is being lost in
Pakistan, Afghanistan and Central Asia. London: Allen Lane.
Riboud, Michelle, Yevgeniya Savchenko, and Hong Tan. The Knowledge Economy and Education
and Training in South Asia: A Mapping Exercise of Available Survey Data
http://info.worldbank.org/etools/docs/library/235710/The%20Knowledge%20Economy%20and%20
Education%20and%20Training%20in%20South%20Asia.pdf
Sadiq, Kamran. 2008. Costing and Financing of TVET in Pakistan. Working Paper No. 1, for
supporting the program design process for the National Skills Strategy of Pakistan Nov 2008.
Islamabad: SEBCON (pvt) Ltd.

Background Situation Analysis of Pakistan‘s TVET System Bibliography
Janjua and Irfan (SEBCON PVT LTD) 112
Sajjad, Shahida. 2004. The Status of Vocational Training Programs for the Disabled Persons In
Pakistan. PhD Thesis. the University of Karachi, Karachi.
Semiotics. Priority Areas of Investment in Vocational Education and Skill Development in South
Asia (Final Report). Islamabad.
Shah, Iftikhar Hussain. 2004. Problems and Prospects Technical Education in Pakistan. University
of Arid Agriculture, Murree Road, Rawalpindi http://eprints.hec.gov.pk/89/2/39.htm
Shami, Pervez A. Dawood Shah and Mirza Tauhiduddin Ahmad. 2005. National Core Indicators
and Regional Comparison. The Academy of Education Planning and Management. Islamabad: the
Ministry of Education.
Shami, Pervez A. Dawood Shah and Mirza Tauhiduddin Ahmad. 2006. Retention and Transition
Patterns of Children at School Education 1995-96 to 2004-05. The Academy of Education Planning
and Management. Islamabad: the Ministry of Education.
SMEDA. Developing SME Policy in Pakistan: SME Issues Paper for Deliberation by SME Task
Force. The Ministry of Industries and Production, the Government of Pakistan.
State Bank of Pakistan. 2008. Annual Report 2007-2008. Karachi.
State Bank of Pakistan. 2008. Inflation Monitor. Karachi: Economic Analysis Department.
Tilak, Jandhyala B G. 2002. Vocational Education and Training in Asia. The Handbook on
Educational Research in the Asia Pacific Region (Eds. John P Keeves and Rye Watanabe, Kluwer
Academic Publishers)
UNDP ILO/ARTEP. 1991. Monitoring of Vocational Training Programmes in Pakistan.
UNESCO. 2006. International Standard Classification of Education ISCED 1997. United Nations
Educational, Scientific and Cultural Organization.
http://www.uis.unesco.org/TEMPLATE/pdf/isced/ISCED_A.pdf
UNESCO-UNEVOC. 1995. National Profiles in Technical and Vocational Education in Asia and
the Pacific. Bangkok: UNESCO Principal Regional Office for Asia and the Pacific.
UNESCO- UNEVOC. 2006. Participation in Formal Technical and Vocational Education and
Training Programmes Worldwide: an Initial Statistical Study 2006. Published by the International
Centre for Technical and Vocational Education and Training.
http://info.worldbank.org/etools/docs/library/243595/bparticipation%20in%20formal%20TVET%2
0worlwide.pdf
UNESCO. 2004. Education Sector of Pakistan and Case-Studies on Direct Budget Support (DBS).
http://www.un.org.pk/unesco/dbs/data/booklets/02_Pakistan_Case-Studies.pdf
UNESCO. 2006. Strong Foundations: Early Childhood Care and Education Pakistan Early
Childhood Care and Education (ECCE) programmes. Country profile prepared for the Education for

Background Situation Analysis of Pakistan‘s TVET System Bibliography
Janjua and Irfan (SEBCON PVT LTD) 113
All Global Monitoring Report 2007 Compiled by: International Bureau of Education (IBE) Geneva,
(Switzerland)
http://unesdoc.unesco.org/images/0014/001472/147222e.pdf
UNEVOC. 2006. Participation in Formal Technical and Vocational Education and Training
Programmes Worldwide: An Initial Statistical Study. Bonn, Germany
Valmonte, Dr. Ligaya D. Achieving Sustainable Development through TVET – Experiences of
International Organizations Working With Member States In Asia And The Pacific.
http://www.unescobkk.org/fileadmin/user_upload/apeid/Conference/papers/3B3_paper_Valmonte.d
oc
World Bank. 1987. Assessment of Employers‘ and Employees‘ Opinions on Supply and Demand of
Vocational Manpower in Pakistan's Industry.
World Bank. 2002. Pakistan Development Policy Review. Poverty Reduction and Economic
Management Sector Unit South Asia Region. Washington.
http://siteresources.worldbank.org/PAKISTANEXTN/Resources/pdf-Files-in-Events/IRISD/Pak-
DPR.pdf
World Bank. 2003. Lifelong Learning in the Global Knowledge Economy: Challenges for
Developing Countries. http://siteresources.worldbank.org/INTLL/Resources/Lifelong-Learning-in-
the-Global-Knowledge-Economy/lifelonglearning_GKE.pdf
World Bank. 2005. North West Frontier Province Economic Report. Accelerating Growth and
Improving Public Service Delivery in the NWFP: The Way Forward. Poverty Reduction and
Economic Management Sector Unit South Asia Region, the World Bank.
World Bank. 2007. Pakistan Infrastructure Implementation Capacity Assessment (PIICA). South
Asia Sustainable Development Unit of the World Bank.
World Bank. 2008. Doing Business 2009: Country Profile for Pakistan. Comparing Regulations in
181 Countries. Washington: The World Bank.
Zia, Uzma. 2007. International Competitiveness: Where Pakistan Stands? PIDE Working Papers
No. 28.
Yusufi , Khurshid Ahmad Khan. 1988. Quaid-i-azam Muhammad Ali Jinnah Some Rare Speeches
and Statements 1944-1947 Hardcover.