Munich Personal RePEc Archive - mpra.ub.uni … · the Indian government to protect its domestic...
29
Munich Personal RePEc Archive Impact of TRIPS and RTAs on the Indian Pharmaceutical Product Exports Bishwanjit Singh Loitongbam University of International Business and Economics, Beijing 7 March 2016 Online at https://mpra.ub.uni-muenchen.de/75764/ MPRA Paper No. 75764, posted 17 March 2017 14:37 UTC
-
Upload
vuongxuyen -
Category
Documents
-
view
215 -
download
0
Transcript of Munich Personal RePEc Archive - mpra.ub.uni … · the Indian government to protect its domestic...

MPRAMunich Personal RePEc Archive
Impact of TRIPS and RTAs on theIndian Pharmaceutical Product Exports
Bishwanjit Singh Loitongbam
University of International Business and Economics, Beijing
7 March 2016
Online at https://mpra.ub.uni-muenchen.de/75764/MPRA Paper No. 75764, posted 17 March 2017 14:37 UTC

1
Impact of TRIPS and RTAs on the Indian Pharmaceutical Product Exports
Bishwanjit Loitongbam
Abstract: Until India fully implemented TRIPS in 2005, the Indian pharmaceutical
industry had maintained a comparative advantage of cheap and skilled workers among
developing economies. However, recent changes in regulatory environment have made the
situation challenging for the industry. India seems to be losing its position in the global arena in
both the production of bulk drugs and formulations. This paper investigates how TRIPS
(implemented by partner countries) and Regional Trade Agreements (RTAs) influence Indian
pharmaceutical product exports, using the Gravity Model. This analysis finds that TRIPS has
negative effect on Indian pharmaceutical products exports. And RTAs increase pharmaceutical
products exports.
Keywords: TRIPS, RTA, Gravity Model, Indian Pharmaceutical Industry

2
1. Introduction:
The Indian pharmaceutical industry (IPI) is the leading supplier of cheap generic drugs in
the world. The spectacular growth in this sector is mainly due to various legislative reforms of
the Indian government to protect its domestic pharmaceutical industry and diminish foreign
dominance, and other changes including reverse engineering of patented drug molecules, and the
implementation of the Trade Related Intellectual Property Rights (TRIPS). Since India’s
implementation of TRIPS, in compliance with the World Trade Organization (WTO) accession,
there has been significant change in the policy, growth and development of the IPI. Due to this
new policy regime, India could not produce drugs patented by the foreign companies through
reverse-engineering. Surprisingly, in spite of the very notion that a strong intellectual property
rights would lead to higher drugs’ prices and may hamper their domestic, infant, high
technological industry like pharmaceutical industry in the less developed countries, India has
witnessed a surge in production in the post TRIPS period. The increased number of product
registrations in both regulated and emerging markets is the driving force of this growth. India is
also converging and thereby reaping the advantages of its underdeveloped state. In general, after
the Uruguay Round of trade negotiations under the General Agreement on Tariffs and Trade
(GATT), implementation of TRIPS has been progressing and thereby countries are agreeing to
enforce their domestic laws and regulations designed for the protection of intellectual property
rights (IPRs). But IPRs are highly contentious in international relations. Developing economies
believe that the stronger IPRs only benefit the developed countries at the expense of developing
countries which strengthen the monopoly of big companies based in industrial countries. Still,
implementation of TRIPS is very crucial in knowledge intensive industries like the
pharmaceutical industry. Since the world pharmaceutical industry has had relatively significant
growth during the last several decades, the role of developing countries in the pharmaceutical

3
global value chains (GVCs) is growing. According to IMS Health reports, medication use around
the world will reach 4.5 trillion doses by 2020 with over half of the world’s population taking
one medicine a day, up from one third in 2005. Almost half of the projected growth will be
contributed by just four major emerging economies which include India, China, Brazil and
Indonesia. Access to healthcare in these countries has also increased significantly. With the
increase in access to medicines worldwide, global spending on drugs is expected to rise by 30
percent to $1.4 trillion. Developed countries still contribute the lion’s share of this spending
growth on drugs. Even though the purchasing power of people in the emerging economies has
increased, they can only buy low-cost medications. Sales of generic drugs account for 88
percent of total medications bought, whereas sales of newer, specialty medications that target
chronic, rare or genetic disease like cancer, hepatitis C, and autoimmune diseases account for
only 1% of the total in these countries1.
The case of India is interesting because India has implemented TRIPS in compliance with
the WTO accession in 1995. The Indian Patent Act 1970 has been amended three times; once in
March 1999, again in June 2002, and the third having come in April 2005 (Jha, 2007). India has
undertaken many industrial and trade reforms, such as lowering tariffs levels and eliminating or
decreasing non-tariff barriers, etc. R&D expenditures, by the domestic and foreign
pharmaceutical companies, merger and acquisitions (M&A), and patent activity and patent
filings by Indian pharmaceutical firms, have significantly increased. The consumption of
medications in India is increasing due to the increase in basic healthcare infrastructure and ease
of access. The growth of exports has also increased dramatically. The main reason for this
1How India, the World’s Pharmacy, Is Becoming More Medicated,
http://blogs.wsj.com/indiarealtime/2015/11/19/how-india-the-worlds-pharmacy-is-
becoming-more-medicated/

4
growth has to do with the generic markets, particularly within the regulated market which has
shifted from the export of bulk drugs to formulations which implies that bulk drugs exports don’t
enjoy a comparative trade advantage any longer.
Pharmaceutical industry sector being a knowledge-based sector have been an important
sector both in the developed and developing countries, including India. In amidst of the rapid
globalization process, India shifted its pharmaceuticals trade pattern and faced a tough
competition in the global pharmaceutical markets, particularly from developing countries. Thus,
it is immensely important to analyze the issue of global competitiveness of India in the world
pharmaceutical market. We would like to examine how India achieves such a rapid rise in
pharmaceuticals exports in the world. To estimate the determinant of trade, we use the gravity
model. It explains (the natural logarithm of) trade with (the logs of) the distance between
countries and their joint income. We, then, try to investigate the effect of TRIPS implementation,
Regional Trade Agreements (RTAs) and tariff (proxy for trade openness) on the Indian
pharmaceutical exports. We extended the basic gravity equation with a number of extra
conditioning variables such as common language, health expenditure and foreign direct
investment (FDI). The study finds that the effect of partner countries’ TRIPS implementation is
negative and significant on the IPI. It implies that India is shifting its pharmaceutical exports
from regulated markets to unregulated markets. TRIPS implementation has greater impact on
formulations exports than that on bulk exports. The RTAs have increased the export performance
of India. It benefits more on formulations exports than bulk exports.
This paper is arranged as follows. Section II gives literature review. Section III shows
data and methodology for the study of impact of globalization on the IPI through WTO accession

5
and the integration of global value chains, and its patterns of trade. Finally, Section IV
summarizes the results and concludes.
2. LITERATURE REVIEWS:
By protecting IPR, TRIPS allow technology transfer and diffusion, and relate to a set of
administrative and market-organizing regulated rules. They enable agents to use or transfer
resources among each other, and allow governments to achieve economic efficiency which is one
goal observed in IPR regulations, or product liability and safety regulations. In the context of IPI,
after the implementation of TRIPS, there is a major change in the IPI in terms of output,
productivity, R&D, technological capabilities, etc. at industry level and at firm level. The
implementation of TRIPS has increased the patenting activity and R&D investment of the Indian
pharmaceutical companies (Chaudhuri, 2007; Chadha, 2009; Bedi, et al., 2013) and increased
sales and export performances of the companies (Kiran and Mishra, 2009a). This finding is in
line with that of Guennif & Ramani (2012), that the IPI had had more success in industrial
capabilities than that of Brazil due to State policy after the IPR reform. Fink (2000) examined the
effects of the introduction of product patent protection on the two therapeutic groups in the IPI.
He found that the impact of patent protection on Indian pharmaceutical products depended on the
values of the assumed elasticities. Possibility of increase in prices and welfare losses will be
minimized if close and off-patent substitute drugs are available and vice versa. Watal (2000) also
examined the effects of patent protection in 22 patentable pharmaceutical markets and found that
prices and welfare losses are likely to increase in moving from current market structures to
patent monopoly depending on the demand structure. TRIPS implementation raised drug’s prices
and decreased technological activities and exports in the IPI. Thus, stronger patent protection
leads to higher drug prices and welfare losses in developing economies.

6
Examining the effects of product patent in India and China, Grace (2004) found that
product patent limited profit earnings from the sales of drugs domestically and India increased its
exports to regulated markets to compensate this revenue loss. This finding is confirmed by Jha,
(2007). With the new patent policies, Indian pharmaceutical companies had shifted its business
from domestic markets to regulated markets and had become net exporters of pharmaceuticals
and import dependence on bulk drugs (Jha, 2007). It indicates that India focuses mainly on
regulated markets. Besides TRIPS implementation has a significant effect on the firms’ patenting
activity in India. Patent applications by the Indian companies increased more than proportional to
patents granted over time, suggesting technology transfer to India. This decrease of the granting
ratio might be caused by strict regulations of the TRIPS. Kiran and Mishra (2009a) confirmed
these findings that TRIPS implementation led to increase sales, exports, profits, R&D
expenditures, patents filling and granting by the Indian pharmaceutical firms. But it reduced the
availability of affordable drugs in developing countries (Hafner and Popp, 2011) as these
countries could not do reverse-engineering of patented drugs. They also examined the role of
India and China as suppliers of cheap medicines to other developing countries and the
competitive effect of drug imports from these two countries on the price of drugs imported from
high-income countries. They found that Latin America relies totally on intraregional trade and
imports from the US, while Sub-Saharan Africa depends on India accounting for 45% of its
imports. TRIPS implementation led Latin America to invoke compulsory licensing and negotiate
cheaper drug prices. It also reduced drug imports and the availability of affordable drugs. For
Sub-Saharan Africa, it might not have direct effects on drug prices as most countries have to
implement TRIPS by 2016. They further showed that TRIPS implementation reduced the
availability of affordable drugs both from India and high-income countries due to reduced
competition.
7
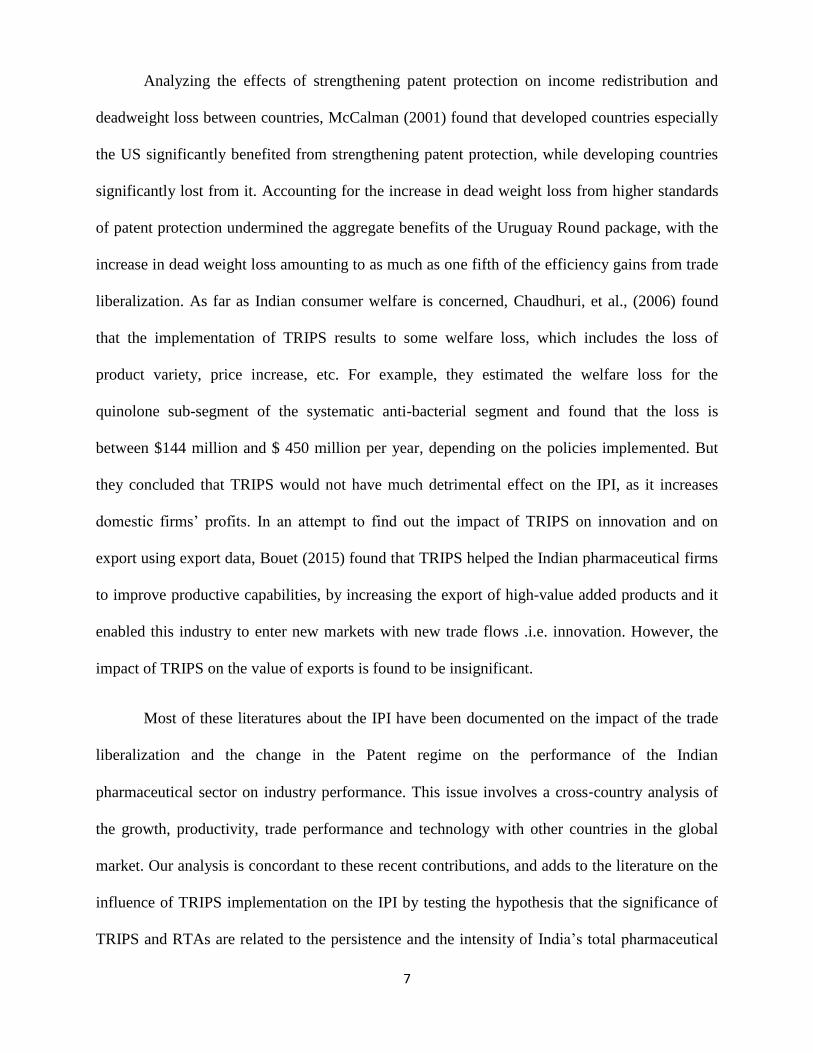
Analyzing the effects of strengthening patent protection on income redistribution and
deadweight loss between countries, McCalman (2001) found that developed countries especially
the US significantly benefited from strengthening patent protection, while developing countries
significantly lost from it. Accounting for the increase in dead weight loss from higher standards
of patent protection undermined the aggregate benefits of the Uruguay Round package, with the
increase in dead weight loss amounting to as much as one fifth of the efficiency gains from trade
liberalization. As far as Indian consumer welfare is concerned, Chaudhuri, et al., (2006) found
that the implementation of TRIPS results to some welfare loss, which includes the loss of
product variety, price increase, etc. For example, they estimated the welfare loss for the
quinolone sub-segment of the systematic anti-bacterial segment and found that the loss is
between $144 million and $ 450 million per year, depending on the policies implemented. But
they concluded that TRIPS would not have much detrimental effect on the IPI, as it increases
domestic firms’ profits. In an attempt to find out the impact of TRIPS on innovation and on
export using export data, Bouet (2015) found that TRIPS helped the Indian pharmaceutical firms
to improve productive capabilities, by increasing the export of high-value added products and it
enabled this industry to enter new markets with new trade flows .i.e. innovation. However, the
impact of TRIPS on the value of exports is found to be insignificant.
Most of these literatures about the IPI have been documented on the impact of the trade
liberalization and the change in the Patent regime on the performance of the Indian
pharmaceutical sector on industry performance. This issue involves a cross‐country analysis of
the growth, productivity, trade performance and technology with other countries in the global
market. Our analysis is concordant to these recent contributions, and adds to the literature on the
influence of TRIPS implementation on the IPI by testing the hypothesis that the significance of
TRIPS and RTAs are related to the persistence and the intensity of India’s total pharmaceutical
8
exports as well as both for bulk drugs and formulations exports. It is quite necessary to examine
how TRIPs implemented by trading partners and RTAs affect Indian pharmaceutical product
exports in the light of the rapid globalization process. Before going forward to empirically
examine all these analyses, it is quite necessary to examine the basic characteristics and
development of this industry.
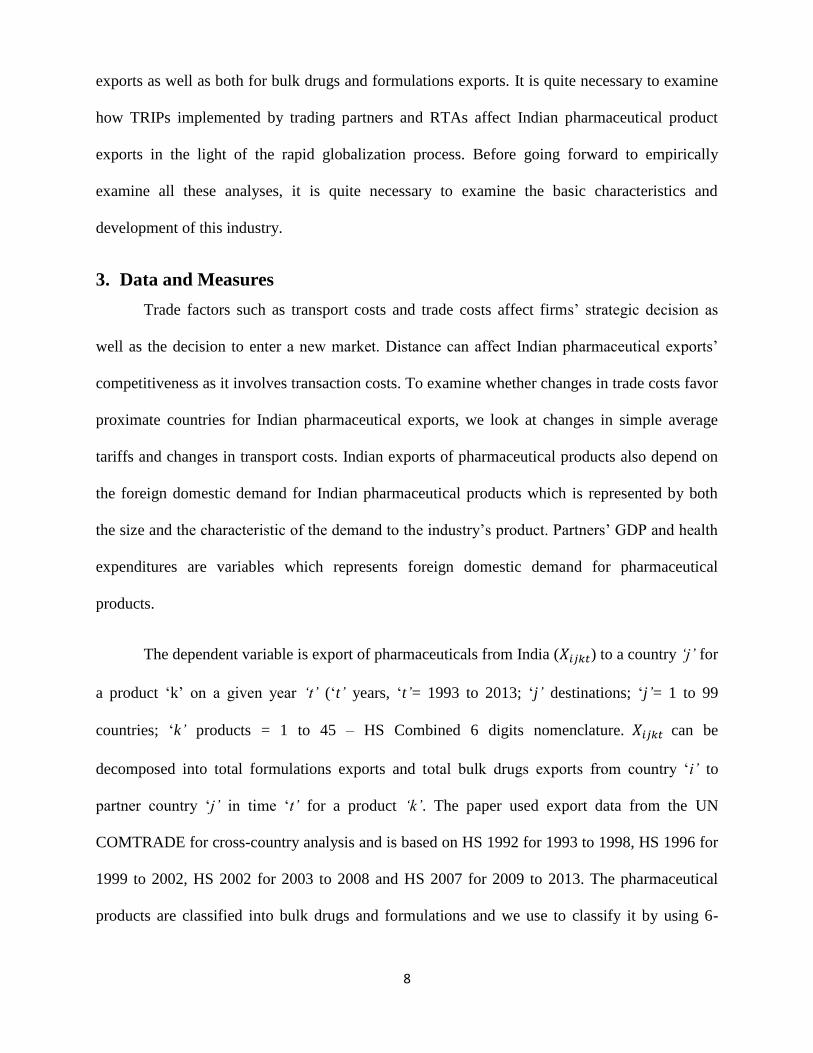
3. Data and Measures
Trade factors such as transport costs and trade costs affect firms’ strategic decision as
well as the decision to enter a new market. Distance can affect Indian pharmaceutical exports’
competitiveness as it involves transaction costs. To examine whether changes in trade costs favor
proximate countries for Indian pharmaceutical exports, we look at changes in simple average
tariffs and changes in transport costs. Indian exports of pharmaceutical products also depend on
the foreign domestic demand for Indian pharmaceutical products which is represented by both
the size and the characteristic of the demand to the industry’s product. Partners’ GDP and health
expenditures are variables which represents foreign domestic demand for pharmaceutical
products.
The dependent variable is export of pharmaceuticals from India (𝑋𝑖𝑗𝑘𝑡) to a country ‘j’ for
a product ‘k’ on a given year ‘t’ (‘t’ years, ‘t’= 1993 to 2013; ‘j’ destinations; ‘j’= 1 to 99
countries; ‘k’ products = 1 to 45 – HS Combined 6 digits nomenclature. 𝑋𝑖𝑗𝑘𝑡 can be
decomposed into total formulations exports and total bulk drugs exports from country ‘i’ to
partner country ‘j’ in time ‘t’ for a product ‘k’. The paper used export data from the UN
COMTRADE for cross-country analysis and is based on HS 1992 for 1993 to 1998, HS 1996 for
1999 to 2002, HS 2002 for 2003 to 2008 and HS 2007 for 2009 to 2013. The pharmaceutical
products are classified into bulk drugs and formulations and we use to classify it by using 6-
9
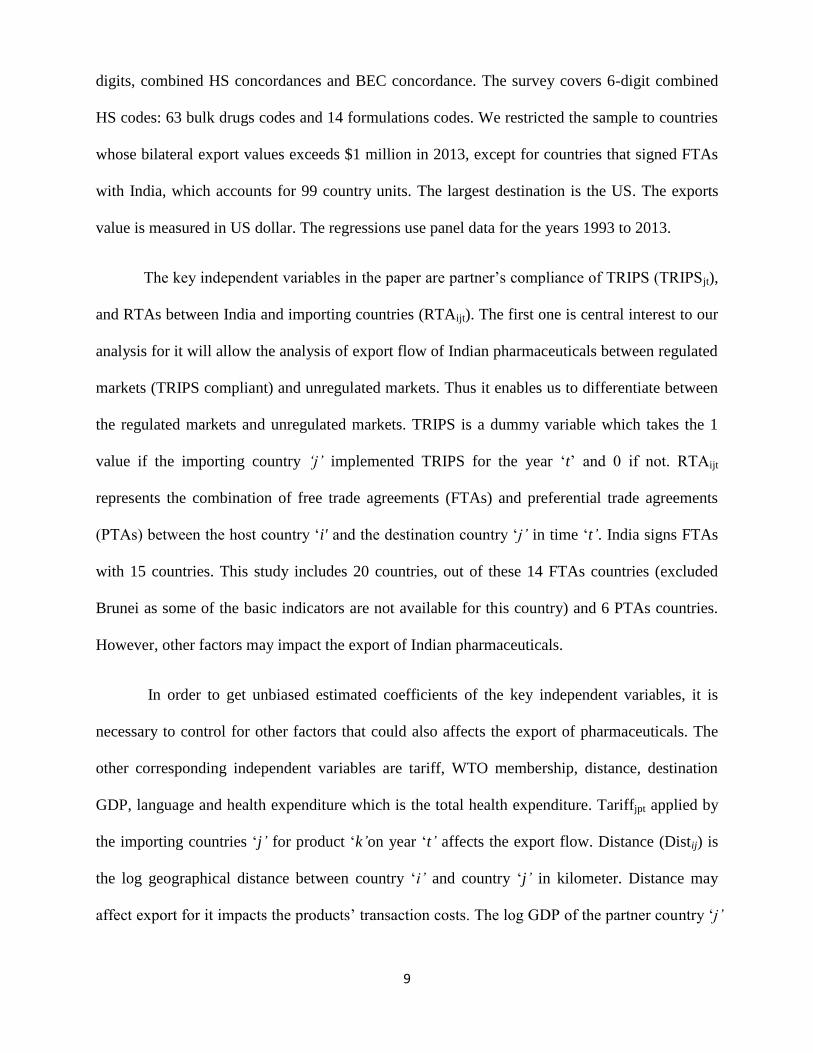
digits, combined HS concordances and BEC concordance. The survey covers 6-digit combined
HS codes: 63 bulk drugs codes and 14 formulations codes. We restricted the sample to countries
whose bilateral export values exceeds $1 million in 2013, except for countries that signed FTAs
with India, which accounts for 99 country units. The largest destination is the US. The exports
value is measured in US dollar. The regressions use panel data for the years 1993 to 2013.
The key independent variables in the paper are partner’s compliance of TRIPS (TRIPSjt),
and RTAs between India and importing countries (RTAijt). The first one is central interest to our
analysis for it will allow the analysis of export flow of Indian pharmaceuticals between regulated
markets (TRIPS compliant) and unregulated markets. Thus it enables us to differentiate between
the regulated markets and unregulated markets. TRIPS is a dummy variable which takes the 1
value if the importing country ‘j’ implemented TRIPS for the year ‘t’ and 0 if not. RTAijt
represents the combination of free trade agreements (FTAs) and preferential trade agreements
(PTAs) between the host country ‘i' and the destination country ‘j’ in time ‘t’. India signs FTAs
with 15 countries. This study includes 20 countries, out of these 14 FTAs countries (excluded
Brunei as some of the basic indicators are not available for this country) and 6 PTAs countries.
However, other factors may impact the export of Indian pharmaceuticals.
In order to get unbiased estimated coefficients of the key independent variables, it is
necessary to control for other factors that could also affects the export of pharmaceuticals. The
other corresponding independent variables are tariff, WTO membership, distance, destination
GDP, language and health expenditure which is the total health expenditure. Tariffjpt applied by
the importing countries ‘j’ for product ‘k’on year ‘t’ affects the export flow. Distance (Distij) is
the log geographical distance between country ‘i’ and country ‘j’ in kilometer. Distance may
affect export for it impacts the products’ transaction costs. The log GDP of the partner country ‘j’

10
for a given year ‘t’ (𝑌𝑗𝑡)represents the demand conditions in the partner countries ‘j’ on year ‘t’.
The values are in $ millions of constant 2005 internationals USD. The health expenditure,
Healthjt, of partner country ‘j’ for a given year ‘t’ indicates the demand conditions of the partner
country ‘j’ in time ‘t’. It is expressed as the total health expenditure (% GDP) of importing
country ‘j’ in time ‘t’. Language is a dummy variable which is 1 if both the country shares a
common English language and zero otherwise. We include language as language barriers inhibit
bilateral trade as it associate costs while communication.
The paper used data from WTO database to create an indicator of FTAs and Ministry of
Commerce and Industry, Government of India for PTAs. The standard gravity variables of
destination GDP which measures the size, health expenditure, come from the World Bank’s
World Development Indicators (WDI) database. However, since the Myanmar’s GDP is not
available at the WDI database, we use this country’s GDP from IMF’s World Economic Outlook
Database. Distance between capital cities and linguistic, are taken from Rose’s 2004 website.
TRIPS compliance data comes from (Kyle and McGahan, 2012). Average tariffs are the
(unweighted) average tariffs from World Integrated Trade System. FDI data is taken from the
Annual Survey of Industries (ASI) database.
4.3.2. Gravity Model
To organize our empirical analysis of globalization and its impact on Indian
pharmaceutical exports, we rely on the Gravity model. As the name suggests, the idea behind the
model comes from the law of universal gravitation and is a widely used tool to understand
bilateral trade flows in international economics. The most robust empirical result in international
economics is that bilateral trade decreases with distance (Melitz, 2007; Disdier, et al.,
2008).Trade flows are positively related to the size of the trading partners and inversely related
11
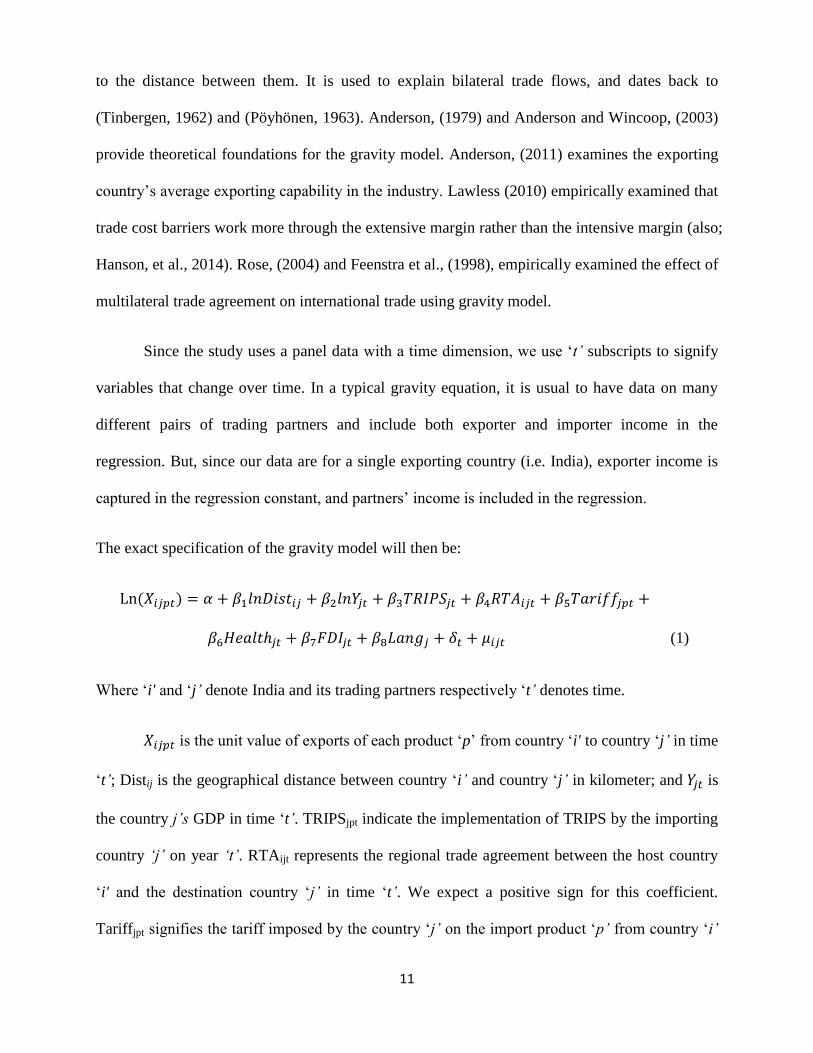
to the distance between them. It is used to explain bilateral trade flows, and dates back to
(Tinbergen, 1962) and (Pöyhönen, 1963). Anderson, (1979) and Anderson and Wincoop, (2003)
provide theoretical foundations for the gravity model. Anderson, (2011) examines the exporting
country’s average exporting capability in the industry. Lawless (2010) empirically examined that
trade cost barriers work more through the extensive margin rather than the intensive margin (also;
Hanson, et al., 2014). Rose, (2004) and Feenstra et al., (1998), empirically examined the effect of
multilateral trade agreement on international trade using gravity model.
Since the study uses a panel data with a time dimension, we use ‘t’ subscripts to signify
variables that change over time. In a typical gravity equation, it is usual to have data on many
different pairs of trading partners and include both exporter and importer income in the
regression. But, since our data are for a single exporting country (i.e. India), exporter income is
captured in the regression constant, and partners’ income is included in the regression.
The exact specification of the gravity model will then be:
Ln (𝑋𝑖𝑗𝑝𝑡) = 𝛼 + 𝛽1𝑙𝑛𝐷𝑖𝑠𝑡𝑖𝑗 + 𝛽2𝑙𝑛𝑌𝑗𝑡 + 𝛽3𝑇𝑅𝐼𝑃𝑆𝑗𝑡 + 𝛽4𝑅𝑇𝐴𝑖𝑗𝑡 + 𝛽5𝑇𝑎𝑟𝑖𝑓𝑓𝑗𝑝𝑡 +
𝛽6𝐻𝑒𝑎𝑙𝑡ℎ𝑗𝑡 + 𝛽7𝐹𝐷𝐼𝑗𝑡 + 𝛽8𝐿𝑎𝑛𝑔𝑗 + 𝛿𝑡 + 𝜇𝑖𝑗𝑡 (1)
Where ‘i' and ‘j’ denote India and its trading partners respectively ‘t’ denotes time.
𝑋𝑖𝑗𝑝𝑡 is the unit value of exports of each product ‘p’ from country ‘i' to country ‘j’ in time
‘t’; Distij is the geographical distance between country ‘i’ and country ‘j’ in kilometer; and 𝑌𝑗𝑡 is
the country j’s GDP in time ‘t’. TRIPSjpt indicate the implementation of TRIPS by the importing
country ‘j’ on year ‘t’. RTAijt represents the regional trade agreement between the host country
‘i' and the destination country ‘j’ in time ‘t’. We expect a positive sign for this coefficient.
Tariffjpt signifies the tariff imposed by the country ‘j’ on the import product ‘p’ from country ‘i’

12
in time ‘t’. Healthjt and Langij indicate the health expenditure (expressed as percentage GDP of
importing countries' health expenditure) of the partner country ‘j’ in time ‘t’ and sharing a
common English language between the country and the importing countries respectively. 𝛿𝑡 and
𝜇𝑖𝑗𝑡 are time dummy and an error term respectively. FDIjt is inward foreign direct investment
(FDI) in the IPI from the country ‘j’ at time ‘t’.
We use ordinary least squares (OLS) to estimate the gravity model. Since the dependent
and explanatory variables are in logarithms, the estimated coefficients correspond to elasticities.
Distance effects are estimated as a parameter in the gravity equation. We define 𝛽1 as the
“distance effect,” the negative of the elasticity of bilateral trade with respect to distance. There is
time subscript for the dummy variables for RTAs. TRIPS and RTAs are the two explanatory
variables of central interest.
4.3.3 Empirical Results
Table 1 reports the results. Column (1), (4) and (7) of Table 1 present the benchmark
gravity model using distance and GDP as explanatory variables. As expected, the distance
variable has an estimated coefficient whose sign is negative and highly significant. The distance
coefficient on total export is -0.14. The estimated coefficient of distance suggests that 10%
increase in distance lowers export of pharmaceuticals by about 1.4%. Splitting the total export
into exports of formulations and exports of bulk drugs, most of the distance effect is negative and
significant at 1 percent level. Its coefficient on the formulations export is -0.31 and that of bulk
export is -0.19 which are slightly higher that of the total exports. The GDP effect has almost
similar pattern across the exports of formulations and bulk drugs with the distance effect. The
GDP effect is also higher in case of formulations exports: the GDP effect for total export,
formulations and bulk drugs are 0.17, 0.26 and 0.25 respectively. The estimated coefficients for

13
GDPs are positive and highly significant at the 1 percent level. The coefficient of GDP suggests
that 10% in increase in partners’ GDP will increase a 1.7% in total exports. It suggests that trade
is sharply decreasing with distance and increasing in destination GDP. Both the distance and
GDP effect is higher in case of formulations exports than that of bulk drugs exports. Thus, India
exports less to countries that are farther apart and increases its exports with economically larger
countries.
Drawing all of the elements together, columns (2), (5) and (8) present results for an
extended gravity model that includes a range of TRIPS, RTAs, tariff, health expenditure,
language and year dummies, in addition to the standard elements of GDP and distance. The fit of
this extended model is higher than that of the benchmark model that contained just GDP and
distance. The R2 for the total trade column has increased slightly from 0.02 to 0.03, for
formulations export, it increases from 0.05 to 0.09, and for bulk drugs export, from 0.04 to 0.04.
The coefficient of distance effect is now only significant on formulations export and insignificant
for both total exports and bulk drug exports. The GDP coefficients are highly positive and
significant for all the three variables.
The dummy variable for TRIPS as whether a trading partner implements TRIPS in time ‘t’
or not is negative and has a highly significant effect on the total exports. The coefficient of
TRIPS on the total exports is -0.55. It confirms our prediction that India has shifted its exports to
unregulated markets from regulated markets. Bouet (2015) had also found the same negative
effect of TRIPS on the Indian pharmaceutical exports. He propounded a possible reason that the
compliance of TRIPS led to increase sanitary and pharmaceutical regulations in importing
countries, which in turn increase costs to the detriment of foreign exporters. As India’s
comparative advantage lies on generic production and cost-based strategies, it reduces the
14
comparative advantage of India. Another possible reason could be rising US concerns over
regulatory standards, quality parameters, etc. and increase global competition in regulated
markets. For instance, according to Ind-Ra estimates, the impacts on Indian pharmaceutical
exports due to import alert by US FDA over issues of data documentation, testing facilities and
procedures at Indian facilities, banned facilities contributed around 7%-8% of the total exports to
the US and around 2% of the overall 2013 pharmaceutical exports from India. In other words,
estimated impact on the existing exports revenue would be around 7-8% of the total exports to
the US, and around 2% of the overall 2013 pharmaceutical exports from India.
From column (5) and (8), the impact of TRIPS implementation on the formulations is
higher than that on export of bulk drugs. The coefficient of TRIPS on the exports of formulations
is -0.69 which is higher than that of bulk drugs (i.e. -0.38) by 0.31. A possible reason could be
that though India exports most of its generic drugs in the regulated markets, India has started
shifting its formulations exports from highly regulated market to unregulated markets. Its impact
on bulk drugs exports is not quite surprising as India mainly exports bulk drugs to developing
and underdeveloped countries. The coefficient of RTA has positive and highly significant effect
on total exports. The RTA coefficient on the total exports is 0.23. Further, its impacts on exports
of formulations and bulk drugs are 0.28 and 0.29 respectively. It indicates that the RTA has also
contributed to the growing bulk drugs exports of India at a very significant rate. Here, it is worth
mentioning that most of the India’s RTA signed countries are developing and underdeveloped
countries. Thus, TRIPS implementation adversely affects developing countries like India by
lowering its comparative advantage and by reducing revenues due to stronger quality control
measures imposed by USFDA. As a result of it, competition among developing economies
increases in the regulated generic markets which directly affect India and in search of new
markets, she has to shift its trade pattern from regulated markets to unregulated markets where

15
lesser patent protection prevails. Improving productivity, quality of its drugs and institutions
becomes mandatory in order to sustain its dominant role in regulated generic market. In short,
pharmaceutical industry in developing countries faces a difficult time as a result of TRIPS
implementation. It again proves that RTAs is helpful in promoting bilateral trade between
countries. It increases Indian pharmaceutical exports within partner countries.
Surprisingly, tariff has positive and significant effect on total exports. The coefficient of
tariff on the total exports is 0.03. It is also positive and significant on both formulations exports
and bulk drugs exports. The tariff coefficient is higher on the bulk drug exports (i.e. 0.02) than
that of the formulations export (i.e. 0.01). This result is against the conventional theory. One
possible explanation is that Most Favored Nation (MNF) tariffs are not the best measure of tariff
restrictions and transaction costs that restricts Indian pharmaceutical exports. India, being a
WTO member, apply MNF tariffs to other member countries, as well as, she can also apply
preferential rates with a limited number of countries, which are lower than MNF tariffs (Bouet,
2015). We run OLS regression on Indian pharmaceutical exports to OECD countries (excluding
Japan and Korea) to double check our arguments.
Table 2 gives the result. The tariff coefficient is negative and significant for total exports.
It implies that 10% increase in tariff rates renders to 0.8% decrease of Indian pharmaceutical
exports to OECD countries. However, the tariff coefficient for formulations is positive and
significant, and negative and insignificant for bulk drugs exports. This positive effect for
formulations exports might be due to the fact that, in the wake of developed countries’ increasing
dependence on Indian pharmaceutical exports, though developed countries applied higher tariff
rates to formulations drugs, they could not resist importing Indian generic drugs due to cheap and
quality drugs. In other words, the domestic demand for Indian made drugs is very high in the

16
host country. The same goes to the developing and underdeveloped countries. Most of these
countries are imposing higher tariff rates on Indian pharmaceutical exports, on the one hand, and,
on the other hand, they still import a large quantity of Indian pharmaceuticals, suggesting that
they are trying to adopt import substitution policy for drugs and pharmaceuticals but had failed.
The coefficient of health care expenditure is negative and insignificant except for bulk
drug exports. The healthcare expenditure effect on bulk drug exports is negative and significant
at 1 percent level. It indicates that 10% increase in healthcare expenditure (expressed as % GDP
of importing countries' health expenditure) of the importing countries will reduce 0.04% bulk
drug exports from India. It is quite opposite to what was expected. One of the possible
explanations of this result could be that as health expenditure increases, rich countries usually
implement more restrictive sanitary and pharmaceutical regulations increasing transactions costs
for exporters making them less competitive (Bouet, 2015). The FDI coefficient is positive and
highly significant for all three variables. Its coefficient for formulations (0.24) is higher than that
of total exports (0.1) and bulk drugs exports (0.1). The dummy variable for English as a common
language is positive and has a highly significant effect on the total exports (0.39) and
formulations (1.1). It suggests that countries sharing common language export more. But the
coefficient of English dummy is positive but insignificant for bulk drug exports. Sharing
English language in common once again favors more on formulations exports than on bulk drug
exports.

17
Table 1: Impact of TRIPS and RTA on Indian Pharmaceutical Exports:
Regressing Log Exports/Log Formulations/Log Bulk Drugs on TRIPS, RTA and Other Variables Using Gravity Model.
Log Export (Total) Log Export (Formulations) Log Export (Bulk Drugs)
OLS OLS FE OLS OLS FE OLS OLS FE
(1) (2) (3) (4) (5) (6) (7) (8) (9)
Distanceij -0.137 -0.029 - -0.308 -0.314 - -0.187 -0.057 -
(7.21)*** (0.96) - (10.27)*** (6.36)*** - (8.54)*** (1.64) -
GDPjt 0.168 0.214 -0.016 0.257 0.324 0.283 0.250 0.302 -0.076
(28.47)*** (18.66)*** (0.17) (28.30)*** (18.43)*** (2.12)** (35.07)*** (22.21)*** (0.72)
TRIPSjt -0.550 0.046 -0.692 -0.137 -0.376 -0.070
(10.85)*** (0.45) (9.19)*** (0.90) (6.22)*** (0.57)
RTAijt 0.226 0.003 0.282 -0.338 0.288 0.124
(3.60)*** (0.03) (2.65)*** (2.52)** (4.16)*** (1.34)
Tariffjpt 0.031 0.029 0.011 0.019 0.017 -0.013
(8.75)*** (6.44)*** (2.29)** (2.41)** (3.58)*** (2.32)**
Health Expjt -0.006 0.031 -0.010 0.055 -0.037 0.005
(0.76) (1.18) (0.84) (1.50) (4.29)*** (0.15)
Ln_FDIjt 0.097 0.053 0.241 0.149 0.094 0.084
(2.22)** (1.19) (3.80)*** (2.35)** (1.79)* (1.58)
Languagej 0.388 - 1.101 - 0.049 -
(9.70)*** - (17.81)*** - (1.05) -
Year Effects NO YES YES NO YES YES NO YES YES
Constant 8.054 4.683 10.714 8.405 2.558 2.296 5.670 2.201 11.336
(42.43)*** (4.72)*** (5.12)*** (27.75)*** (1.77)* (0.77) (25.86)*** (1.83)* (4.57)***
N 45905 25357 25357 17319 8921 8921 28586 16436 16436
RMSE 2.5485 2.5795 2.4173 2.3783 2.3475 2.3876 2.3821
R2 0.0174 0.0252 0.0058 0.0456 0.0879 0.0243 .0413 0.0381 0.0070
Adjusted R2 0.0173 0.0243 0.0011 0.0455 0.0853 0.0112 0.0412 0.0367 -0.0001
NOTES: Robust standard errors are in parenthesis. * indicates significance at 10% level, ** at 5% level and *** at 1%

18
Table 2: Tariffs Effect of Develop Countries on Indian Pharmaceutical Exports:
Regressing Log Exports/Log Formulations/Log Bulk Drugs on TRIPS, RTA and Other Variables
Using Baseline Gravity Model.
Log Export (Total) Log Export (Formulations) Log Export (Bulks Drugs)
OLS FE OLS FE OLS FE
(1) (2) (3) (4) (5) (6)
Distanceij -0.507 - -1.063 - -0.206 -
(1.86)* - (2.31)** - (0.68) -
GDPjt 0.223 -0.854 0.486 -0.200 0.307 -0.969
(8.21)*** (3.28)*** (11.57)*** (0.47) (9.50)*** (3.28)***
TRIPSjt -1.406 -0.435 -0.186 -0.040 -0.691 0.408
(2.32)** (3.35)*** (0.22) (0.05) (0.82) (0.48)
Tariffjpt -0.077 -0.106 0.144 0.030 -0.009 -0.021
(2.44)** (3.35)*** (2.02)** (0.38) (0.29) (0.65)
Health Expjt 0.147 0.133 0.179 0.031 0.116 0.125
(7.01)*** (2.22)** (5.29)*** (0.31) (4.85)*** (1.88)*
Ln_FDIjit -0.068 0.099 0.039 0.212 -0.027 0.137
(1.11) (1.26) (0.42) (1.71)* (0.37) (1.50)
Languagej 0.599 - 1.290 - 0.230 -
(6.23)*** - (8.47)*** - (2.08)** -
Year Effects YES YES YES YES YES YES
Constant 11.141 32.276 6.099 13.840 4.463 33.332
(4.17)*** (5.22)*** (1.43) (1.37) (1.43) (4.72)***
N 9356 9356 3100 3100 6256 6256
RMSE 2.6431 - 2.4796 - 2.4324 -
R2 0.0565 0.0087 0.1662 0.0247 0.0658 0.0094
Adjusted R2 0.0541 0.0040 0.1597 0.0107 0.0622 0.0025
NOTES: Robust standard errors are in parenthesis. * indicates significance at 10% level, ** at 5% level and *** at
1%
4. Conclusions
With the increase in globalization process, the world pharmaceutical industry has also
changed. The role of developing countries in the pharmaceutical GVCs becomes more
momentous due to this growing interconnectedness of production processes across countries. On
the other hand, the developed countries have lost its market shares in the world pharmaceutical
industry. One of the main reasons behind this losing of market share is due to the rapid growth of

19
the major developing countries in the world pharmaceutical sector, particularly China and India.
The IPI has already been affected in its business by other developing countries such as China. A
concern has been growing about the replacement of sales lost to TRIPS compliance. In order to
make up this loss, the leading domestic firms have increased their exports of generic drugs to the
regulated markets. R&D agreements and M&A activities have also been undertaken significantly.
Indian domestic firms must strengthen their industrial capabilities over time. This will enable
them to stay more competitive and able to capture a bigger pie of global pharmaceutical market
share. This raises the question as to what extent India can move forward in the wake of
globalization.
We investigate the determinants of trade in pharmaceutical products using standard
gravity model. Both the distance and GDP effect is higher in case of formulations exports than
that of bulk drugs exports, suggesting that India exports less to countries that are farther apart
and increases its exports with economically larger countries. Interestingly, the coefficient of
TRIPS is found to be negative. Some of the possible reasons are stated. First, due to TRIPS
implementation by partner countries, India finds itself to be in a very difficult position to export
to regulated market due to increase sanitary and pharmaceutical regulations in importing
countries. Such regulations raise exporting costs thereby impeding pharmaceutical exports. As a
result of it, India exports more in unregulated markets. It confirms that after implementation of
TRIPS, India shifts its export market from developed countries to developing and
underdeveloped countries gradually. Second, TRIPS implementation reduces the comparative
advantage of India, i.e. generic production and cost-based strategies. The impact of TRIPS
implementation on the formulations is higher than that on export of bulk drugs. It is believed that
though India exports most of its generic drugs in the regulated markets, India has shifted its
formulations exports from highly regulated market to unregulated markets. The coefficient of

20
RTA has positive and highly significant effect on total exports. It indicates that the RTA has also
contributed to the growing bulk drugs exports of India at a very significant rate.
Surprisingly, tariff has positive and significant effect on total exports and also on both
formulations exports and bulk drugs exports, which is against the conventional theory. One
possible explanation is that Most Favored Nation (MNF) tariffs are not the best measure of tariff
restrictions and transaction costs that restricts Indian pharmaceutical exports. India, being a
WTO member, apply MNF tariffs to other member countries, as well as, she can also apply
preferential rates to selected countries, which are lower than MNF tariffs (Bouet, 2015). To
double check our arguments, we examine the impact of tariffs on Indian pharmaceutical exports
to OECD countries (excluding Japan and Korea). The tariff coefficient turns out to be negative
and significant for total exports and bulk drugs. It confirms the above argument have some
merits. However, the tariff coefficient for formulations is positive and significant. One possible
explanation is that even though developed countries applied higher tariff rates to Indian
formulations drugs, they still import a large quantity of Indian generic drugs due to its cheap and
high quality drugs. In other words, the domestic demand for Indian made drugs is very high in
the host country. The same goes to the developing and underdeveloped countries. Most of these
countries are trying to adopt import substitution policy for drugs and pharmaceuticals but had
failed. The coefficient of health care expenditure is negative and insignificant except for bulk
drug exports. Another unexpected result is the negative effect of health care expenditure on
drugs exports. One of the possible explanation of this result could be, as health expenditure
increases, rich countries usually implement more restrictive sanitary and pharmaceutical
regulations increasing transactions costs for exporters making them less competitive (Bouet,
2014). The FDI coefficient is positive and highly significant for all three variables. The dummy
variable for English as a common language is positive and has a highly significant effect on

21
pharmaceuticals exports, indicating that sharing English as a common language increases
pharmaceutical exports. Thus, widespread regulatory actions by importing countries have
affected Indian pharmaceutical exports. It indicates that after the success in acquiring a favorable
share in the regulated markets, India is trying to bolster its market share in the unregulated
markets.
With changing political and regulatory environment, TRIPS implementation has made
developing countries like India shift its pattern of trade from regulated markets to unregulated
markets, on the one hand, and, on the other hand, it adversely affects these countries by lowering
its comparative advantage and by reducing revenues due to stronger quality control measures
imposed by USFDA. It necessitates developing countries to improve productivity, efficiencies,
institutions, etc. for their survival. RTAs promote bilateral trade between countries. It suggests
that countries at different levels of industrial and technological development may be faced with
varying economic costs and benefits from stronger IPRs.
Policy Implications and Recommendations:
Since developing economies don’t have better technologies and components, they could
not produce niche and high quality medications. Therefore, they should not protect their
domestic industries, for international cooperation is necessary to build their industrial capabilities.
Trade barriers may restrict them to participate in pharmaceuticals GVCs. Thus, a regulatory
regime, adhering to global regulatory practices, to provide healthcare affordable and accessible is
necessary in developing country like India. But it should not be at the cost of the industry, as
stringent regulatory policy with its intended purposes may hinder product launch and lose focus
in India. For instance, a strict price control measure for essential medicines may lead to
unexpected fallout of several drugs due to less profitability. The government should find a

22
balancing path with viability and as such, policy measures like insurance and public private
partnerships could be initiated.

23
References:
Anderson, J. E. (1979). “A Theoretical Foundation for the Gravity Equation”. The American Economic
Review, Vol. 69, No.1, pp.106-116.
Anderson, J. E. (2011). "The Gravity Model". Annual Review of Economics, Vol. 3, No. 3, pp.133-160.
Anderson, J.E. and Wincoop, E. van. (2003). Gravity with Gravitas. The American Economic Review, Vol.
93, No. 1, pp. 170-192.
Bedi, N., Bedi, P.M.S. & Sooch, B.S. (2013). “Patenting and R&D in Indian Pharmaceutical Industry: Post-
TRIPS Scenario”. Journal of Intellectual Property Rights, Vol. 18, No.18, pp.105-110.
Bouet, D. (2015). “A study of intellectual property protection policies and innovation in the Indian
pharmaceutical industry and beyond”. Technovation, Vol. 38, pp. 31–41.
Chadha, A. (2009). “TRIPs and Patenting Activity: Evidence from the Indian Pharmaceutical Industry”.
Economic Modelling, Vol. 26, No. 2, pp.499-505.
Chaudhuri, S. (2007). "Is Product Patent Protection Necessary in Developing Countries for Innovation?
R&D by Indian Pharmaceutical Companies after TRIPs”. Indian Institute of Management,
Calcutta, Working Papers Series No. 614/ Sep. 2007.
Chaudhuri, S. (2011). " Multinationals and Monopolies Pharmaceutical Industry in India after TRIPs”.
Indian Institute of Management, Calcutta, Working Papers Series No. 685/ Nov. 2011.
Chaudhuri, S., Goldberg, P.K., & Jia, P. (2006). “Estimating the Effects of Global Patent Protection in
Pharmaceuticals: A Case Study of Quinolones in India”. The American Economic Review, Vol. 96,
No. 5, pp.1477-1514.
Disdier, Anne-Ce´lia and Head, K. (2008). “The Puzzling Persistence of the Distance Effect on Bilateral
Trade”. The Review of Economics and Statistics, Vol. 90, No. 1, pp. 37-48.
Feenstra, R.C., Markusen, J.A. and Rose, A.K. (1998). “Understanding the Home Market Effect and the
Gravity Equation: The Role of Differentiating Goods”. NBER Working Paper No. 6804.,
http://www.nber.org/papers/w6804.
Fink, C. (2000). “How Stronger Patent Protection in India Might Affect the Behavior or Transnational
Pharmaceutical Industries”. http://www-
wds.worldbank.org/external/default/WDSContentServer/IW3P/IB/2000/06/27/000094946_000
60905463269/additional/11.
Grace, C. (2004). “The Effect of Changing Intellectual Property on Pharmaceutical Industry Prospects in
India and China: Considerations for Access to Medicines”.
http://www.who.int/hiv/amds/Grace2China.pdf .
24
Guennif, S. & Ramani Sh. V. (2012). “Explaining divergence in catching-up in pharma between India and
Brazil using the NSI framework”. Research Policy, Vol. 41, No. 2, pp. 430-441.
Hafner, T. and Popp, D. (2011). “China and India as Suppliers of Affordable Medicines to Developing
Countries”. Working Paper 17249, http://www.nber.org/papers/w17249.
Hanson, G.H., Lind, N. and Muendler M. (2014). “The Dynamics of Comparative Advantage”. NBER
Working Paper No. 21753. , http://www.nber.org/papers/w21753 .
Jha, R. (2007). “Options for Indian Pharmaceutical Industry in the Challenging Environment”. Economic
and Political Weekly, Vol. 42, No. 39, pp. 3958-3967.
Kiran, R. and Mishra, S. (2009a). “Changing Pragmatics of the Indian Pharmaceutical Industry in the Pre
and Post TRIPS Period”. International Journal of Business and Management, Vol. 4, 206-220.
Kyle, M. and McGahan A. (2012). “Investments in Pharmaceuticals Before and After TRIPS ”. The Review
of Economics and Statistics, Vol. 94, 1157-1172.
Lawless, M. (2010). “Deconstructing Gravity: Trade Costs and Extensive and Intensive Margins” .
Canadian Journal of Economics, Vol. 43, 1149-1172.
McCalman, P. (2001). “Reaping What You Sow: An Empirical Analysis of International Patent
Harmonization”. Journal of International Economics, Vol. 55, No. 1, pp.161-186.
Melitz, J. (2007). “North, South and Distance in the Gravity Model”. Europena Economic Review, Vol. 51,
No. 4, pp. 971-991.
Pöyhönen, P. (1963). “A Tentative Model for the Volume of Trade Between Countries”.
Weltwirtschafliches Archiv, Bd. 90, pp. 93-99.
Rose, A. (2004). “Do We Really Know That the WTO Increases Trade?”. The American Economic Review,
Vol. 94, No. 1, pp. 98-114.
Tinbergen, J. (1962). “Shaping the World Economy: Suggestions for an International Economic Policy.”.
New York: Twentieth-Century Fund.
Watal, J. (2000). “Pharmaceutical Patents, Prices and Welfare Losses: Policy Options for India Under the
WTO TRIPS Agreement”. The World Economy, Vol. 23, No. 5, pp.733-752.

25
APPENDICES
A. List of Countries
1 Afghanistan
2 Algeria
3 Angola
4 Argentina
5 Australia
6 Austria
7 Bangladesh
8 Belarus
9 Belgium
10 Benin
11 Bhutan
12 Brazil
13 Burkina Faso
14 Cambodia
15 Cameroon
16 Canada
17 Chad
18 Chile
19 China
20 Colombia
21 Congo, Dem. Rep.
22 Congo, Rep.
23 Costa Rica
24 Cote d'Ivoire
25 Czech Republic
26 Denmark
27 Dominican
Republic
28 Ecuador
29 Egypt, Arab Rep.
30 Ethiopia (excludes
Eritrea)
31 Finland
32 France
33 Germany
34 Ghana
35 Guatemala
36 Guinea
37 Haiti
38 Hong Kong, China
39 Hungary
40 Indonesia
41 Iran, Islamic Rep.
42 Ireland
43 Italy
44 Jamaica
45 Japan
46 Jordan
47 Kazakhstan
48 Kenya
49 Korea, Rep.
50 Lao PDR
51 Libya
52 Malawi
53 Malaysia
54 Mali
55 Malta

26
56 Mauritius
57 Mexico
58 Morocco
59 Mozambique
60 Myanmar
61 Nepal
62 Netherlands
63 New Zealand
64 Niger
65 Nigeria
66 Pakistan
67 Paraguay
68 Peru
69 Philippines
70 Poland
71 Portugal
72 Romania
73 Russian Federation
74 Rwanda
75 Senegal
76 Singapore
77 Slovenia
78 South Africa
79 Spain
80 Sri Lanka
81 Sweden
82 Switzerland
83 Tajikistan
84 Tanzania
85 Thailand
86 Turkey
87 Turkmenistan
88 Uganda
89 Ukraine
90 United Arab
Emirates
91 United Kingdom
92 United States
93 Uruguay
94 Uzbekistan
95 Venezuela
96 Vietnam
97 Yemen
98 Zambia
99 Zimbabwe

27
B. List of Free Trade Agreement Countries
1 Bhutan
2 Cambodia
3 Indonesia
4 Japan
5 Korea, Rep.
6 Lao PDR
7 Malaysia
8 Myanmar
9 Nepal
10 Philippines
11 Singapore
12 Sri Lanka
13 Thailand
14 Vietnam

28
C. List of Preferential Trade Agreement Countries
1 Afghanistan
2 Argentina
3 Brazil
4 Chile
5 Paraguay
6 Uruguay