Munich Personal RePEc Archive - mpra.ub.uni … · Munich Personal RePEc Archive Product Market...
27
Munich Personal RePEc Archive Product Market Competition, Regulation and Dividend Payout Policy of Malaysian Banks Rashid Ameer Aston University 2007 Online at http://mpra.ub.uni-muenchen.de/8579/ MPRA Paper No. 8579, posted 5. May 2008 12:48 UTC
Transcript of Munich Personal RePEc Archive - mpra.ub.uni … · Munich Personal RePEc Archive Product Market...

MPRAMunich Personal RePEc Archive
Product Market Competition,Regulation and Dividend Payout Policyof Malaysian Banks
Rashid Ameer
Aston University
2007
Online at http://mpra.ub.uni-muenchen.de/8579/MPRA Paper No. 8579, posted 5. May 2008 12:48 UTC
1
Product Market Competition, Regulation and Dividend Payout Policy of
Malaysian Banks
Rashid Ameer
Abstract Purpose -This paper investigates the impact of the product market competition, regulations
on the dividend policies of the listed banks, over the period of 1995-2005 in Malaysia.
Methodology - Ordered Probit modelling technique and target adjustment model.
Findings- We find significant differences in the payout of the banks categorized as selling a
non-interest based banking products and mix of both interest and non-interest based banking
products. We find that the decision to increase dividends is significantly related to earnings,
and the decision to cut dividend is significantly related to the changes in the non-performing
loans, corporate and real estate sectors loans ratio and earnings loses.
Research implications – Research findings have implication for the regulators of the banks.
Originality/value - The research provides a clear link between banks' portfolio choice and
earnings that have implications for the dividends in the emerging markets.
Paper Type: Research Paper
JEL: E51, E52, G21, G35,
Key words: Dividends, Banks, Non-performing loans, Ordered Probit Model, Malaysia.
1. Introduction
The question of why firms pay dividends has been examined using agency costs,
signalling and clientele models (see Bhattacharya, 2007 for a review). In perfect markets, it
was argued that dividend policy was irrelevant to a firm’s value (Miller and Modigliani,
1961). Under the assumption of no taxes, no transaction costs, and no information asymmetry
between the managers and the shareholders, the dividend policy was considered irrelevant.
Much attention has been given to dividend policies of the non-financial firms in the emerging
markets (e.g., see Aivazian et al., 2003; Horace, 2003; Pandey, 2003; Adaoglu, 2000; La
Porta et al., 2000; Allen and Veronica, 1996) and complex dividend policies of the financial
firms has not been given such high-level of attention.
The main purpose of this paper is to provide a performance based perspective of
banks’ dividends policy. The main contribution of our paper is that it highlights the impact of
the product market competition and monetary policy on the optimal dividend policy of the
banks. We study banks because such financial firms are different from the non-financial
firms. For financial firms such as the banks, deposits play an important role in both the real

2
and financial decisions. The regulatory restrictions also affect financial firms more than non-
financial firms such as the banks are obliged under prudential regulations to keep a minimum
capital adequacy ratio all the times, and previous studies have shown that such regulatory
reserve requirements influence the financing decisions of the banks (Ogler and Taggart,
1983).
This paper builds up on the limited empirical literature of real and financing decision
of financial firms by examining the dividend policies of banks in Malaysia. It is similar in
spirit to Kopecky and VanHoose (2004) who investigated the impact of monetary policy and
other factors on the optimal bank lending and market loan rates. This paper is also related to
growing literature on the impact of banking sector competition and regulations on the product
market (see Chami and Cosimano, 2001; Kopecky and VanHoose, 2004) and financing
decisions of the banks.
The Malaysian banking sector has a unique combination of Non-Islamic and Islamic
banks. There are subsidiaries of the major European (UK), U.S. and Asian (Japan and
Thailand) banks. In this paper, we argue that selling of different banking product by these
banks might have implications for dividend decisions of the banks because using mixture of
products with/without interest components i.e., with/without Islamic banking window
operations could affect the cash flows of the banks, and thus dividend policies of the banks.
Previous studies have only examined the productivity of banks in Malaysia (see e.g., Sufian,
2004, Krishnasamy et al., 2004; Katib and Mathews, 2005). Second, the banking sector has
undergone major changes due to government policies and the Asian financial crisis1. In the
aftermath of the Asian crisis, the Malaysian government took unprecedented measures for the
1 For instance, in 1994, government created a distinction between larger and sounder banks. To be a Tier I bank,
a bank’s capital had to reach at least RM. 500 Million otherwise a bank was referred to as a Tier II bank.

3
survival of the major banks2. As a result of mergers, following structure of banking sector
emerged (See Table 1).
[Insert Table 1 about here]
The main findings of the paper are as follows, earnings and earnings lose affect
banks’ dividend payout. The deadweight costs of non-performing loans and higher loan
concentration in real estate sector caused Malaysian banks to significantly reduce their
dividends over the period of 1995-2005. The paper is organized as follows. Section 2
provides a review of dividend policy literature and formulates hypotheses. Section 3 sets up
an estimation model and briefly discusses the dataset used for empirical analysis. Section 4
reports the main results and paper concludes in Section 5.
2. Dividends Policy Literature and Hypotheses
Agency Theory
Despite dividend irrelevance to a firm’s value suggested by Miller and Modigliani,
the finance literature offer theoretical insights into how the managers are likely to approach
the issue of dividend policy (see Baker et al, 2002 for managerial perspective on dividend
policy). One of the central assumptions in Miller and Modigliani (1961) is that, managers
take steps in the best interests of the owners of the firm, and therefore, tries to maximise
shareholders’ wealth. This implies that firms with diffuse ownership, other things being
equal, will have the same stock market value as firms which are owned and run largely by
‘insiders’. Agency theory suggests that managers, who work as ‘agents’ for shareholders, are
not necessarily motivated to work in the shareholders’ best interests (Jensen and Meckling
1976). The potential for opportunistic behaviour by managers’ results in lower values for
2 Two special purpose agencies were created: Danaharta for buying non-performing loans (NPLs) and
Danamodel for injecting new equity into banking sector. By the end of July 1999, Danaharta was managing
RM 40 Billion in NPLs and Danamodel had injected a total of RM 7.1 Billion in 10 financial institutions (Bank
Negara Malaysia, 1999). Asian financial crisis exposed the vulnerabilities of the small banks and the need for
these institutions to maintain a high level of capital (Sufian, 2004).

4
firms with managers acting as agents compared to the values of firms which are both owned
and run by managers. The agency theory predicts that given the potential of managerial
hazard, dividends act as the management’s signal to the shareholders about the future
prospectus, or as a mean to constrain managers’ over investment behaviour (Jensen, 1986). If
there are no positive net present value projects available for the firm, it would be better for
the managers to pay dividends rather than waste free cash flows. Likewise, free cash flow
theory favours both dividends and external debt to constrain managerial moral hazard. Free
cash theory predicts that firms with higher free cash flows should pay higher dividends and
vice versa.
The banks face double agency costs due to asymmetric information between bank the
managers and shareholders, bank managers and depositors, and very little between bank
managers and bank regulators. The dividend policy conveys information to the depositors as
well as shareholders –assisting them in uncovering the actual financial conditions of the
banks. Likewise, if regulators ‘force’ a bank to change its dividend policy, this will inevitably
communicate private information to shareholders and depositors about the bank’s solvency
status. Bessler and Nohel (1996) argue that this multidimensional aspect of the asymmetric
information problem faced by banks, customers, and shareholders is an important factor in
arguing that dividend policy of the banks are different from non-financial firms.
Signalling Theory
Miller and Modigliani (1961) suggested that dividends might convey information
about firms’ future earnings if management pursued a policy of dividend stabilisation, and
used changes in the dividends payout to signal a change in their views about the firms’ future
profitability. According to Signalling theory, managers have inside information about a firm
that they cannot, or do not wish to pass on to the shareholders, for example, better estimates
of future earnings. Corporate dividends are considered to be management’s most cost-

5
effective way of reducing the investor uncertainty about the company’s value. Bhattacharya
(1979) and Miller and Rock (1985) suggest that outside investors have imperfect information
about firms’ profitability, and therefore dividends function as a signal of expected cash flows.
Clientele Effect Theory
Black and Scholes (1974) and Allen et al. (2000) propose clientele theories
underlying firms’ dividend policies. Baker and Wurgler (2004) argued that there are several
reasons for the existence of several clientele effects. First, market imperfections, such as
transaction costs, taxes, and institutional investment constraints cause traditional dividend
“clienteles”. Second, there is a widespread popular belief that dividend payers are less risky.
Third, some investors may use dividends to infer managers’ investment plans. They may
interpret dividends omission as evidence that the firm has strong growth opportunities, and
take dividends as evidence that opportunities are weaker.
Product Market competition
The product mix of the firms also affect overall corporate strategy (see Nelson, 1991).
In the case of the banks, Marquez (2002) point out that borrower-specific information
becomes more disperse with increase in competition and it reduces a bank’s competitive
advantage. Consequently, more low-quality borrowers are able to obtain financing. Kim et al.
(2005) found that banks’ ability to avoid loses may act as a strategic variable to make them
different and increase their market power and interest rates. The high quality banks with
lower loses signal their creditworthiness to other stakeholders (such as shareholders) and
through better management of loans change dividends policies.
Regulatory Influence on the Dividends
The regulations on the banks also influence the dividend payouts. Tight money
market conditions lower down the interest income from the loans (see e.g., Hülsewig et al,
2006; Kashyap and Stein, 1995). Hosono (2005) finds that the effect of monetary policy is
stronger for banks that are smaller, less liquid, and more abundant with capital in Japan. It

6
can be hypothesized that fall in the banks’ income would lead management to revise their
earnings’ expectations. If a bank’s product and financial services portfolio is not diverse,
then, such a tight money market condition would hit earnings and dividends. Thus, we
hypothesize that during tight money market conditions, bank would be more inclined to cut
dividends.
A large number of studies have investigated whether investors value dividends less
than capital gains by observing the behaviour of share prices on the day in which shares go
ex-dividend. In this regard, the major findings of the studies (mostly for UK and US firms),
have found that share price reaction is positively correlated to the size of the dividend change
in percentage terms. In the case of financial firms such as banks, Mercado and Willey (1995)
suggest that, dividend policy of banks, are determined by the manger’s portfolio
diversification opportunity set and bank size. Bessler and Nohel (1996) postulate that
announcement effect of dividends cuts should be more severe for banks than for non-
financial firms due to the fact that ‘large’ banks may lose large corporate customers if a bank
is feared to have financial difficulties as evidenced by the fact that dividends need to be cut.
Bessler and Nohel (2000) found that dividends cut announcement by banks can create
information externalities for the banks that do not cut dividends. They suggest that if loan
portfolios are correlated across banks, then, an announcement of dividend cut by some banks
can create contagion i.e., the share prices of the non-dividend cutting banks would also
decrease following such announcements because investors panic in reaction to bad news and
the bank stocks go down regardless of their financial conditions. Amihud and Murgia (1997)
argue that banks have incentive to favour lower dividend ratio and necessarily stable dividend
payouts to shield its debt better from bankruptcy risk. The dividend policies of the banking
subsidiaries of holding companies are also found to be higher than other banks (Mayne,
1980). Gugler (2003) argue that all firms with little or no growth opportunities should have

7
desire to pay substantial dividends. Thus, we can hypothesize those banks with low growth
opportunities pay substantial cash dividends and vice versa.
From a different perspective, some studies has shown that legal and financial
development of a country matters3 (see Aivazian et al., 2003) in the dividends policy of the
firms irrespective of being financial or non-financial. One such example is, La Porta et al
(2000) who argue that dividend payout policies around the world are influenced by law
protecting the shareholders’ rights. Using a large sample of 33 countries, they found that
minority shareholders’ right affect dividend payout across the world.
3. Estimation Model and Data
We use Lintner (1956) model to investigate dividend policies of banks. The changes
in dividends are determined by the difference between last years’ dividends and this year’s
dividends. A bank’s target dividend payout is assumed to be a fixed portion of its current year
earnings, thus, our model take the following form:
titiD ,
*
, Π=τ (1.1)
tititititi DDD ,,,1,, )( εταγ +−Π+=− − (1.2)
titititi DD ,,,, )1( εαατγ +−+Π+= (1.3)
where *
,tiD is the target dividend payout of a bank i in period t, τ is the target payout, ti,Π are
the current year earnings, tiD ,∆ changes in the dividend payments from period t to t-1, α is
speed of adjustment coefficient, 1, −tiD denotes lagged dividends and ε is the normal error
term. The most important parameters are -α and τ which indicate the size of dividend payout
and smoothing. A higher value of α indicates a speedier adjustment to target payouts and
vice versa.
3 Aivazian et al., (2003, p.111) Korea and Malaysia could be characterized as “closest to the USA” with
developed market orientation. India and Pakistan are more bank-oriented. Therefore, dividend policy of firms in
former countries should be similar to the US and greater banking orientation and more concentrated ownership
structure in latter countries would lead to more different dividend policies.

8
Data
We downloaded financial accounting data of all the listed banks on the Kuala Lumpur
stock market over the period of 1995-2005 from Worldscope database4. We examine this 10-
year period of 1995-2005 because first half of this period is characterised by full
liberalization of the banking sector in Malaysia (Laeven, 2003), and second half includes the
period of the Asian financial crisis, bank restructuring, and economic recovery in Malaysia.
Hence, it is likely that banks would have changed their dividend policy due to these economic
events. Our sample is highly representative of the total population of listed banks, as it
contains more than half of the listed banks and represents more than 53% of the market
capitalisation of financial firms.
We obtained the annual data on Revenue, Earnings, Dividends, Deposits, Loan, Non-
Performing Loans (NPLs), Assets, and Capital ratios over the period of 1995-2005. Four
foreign banks - Bank of America Bhd Deutsche Bank (M) Bhd. JP Morgan Chase Bank Bhd.
and Bangkok Bank Bhd. were excluded from the sample because of non-availability of
dividends data5. Table 2 shows the yearly distribution of dividend payments (see Panel A).
The aggregate dividend payments have shown cyclical movements reflecting first, the impact
of financial liberalization on the competition in the banking sector that led to modest increase
in total dividend payments. In the aftermath of the Asian financial crises, dividend payments
dropped to very low level, for instance, a large number of banks did not pay any dividend
over the period of 1999-2000. The dividend policy of banks have changed in the recent times
2001-2005 by observing increase in the dividend payments due to increase in number of
banks increasing amount of dividends (see Column 2, Panel A).
Panel B shows the size of the dividend changes. Almost 44% of the dividend
increases are between 50%and 100 %, whereas 38% of the dividend cuts are between 50%
4 Some of the banks in our sample have been involved in Mergers and Acquisitions deals (see footnote 2)
5 We are greatly indebted to Mariani Abdul Majeed for providing us data on the Islamic banks in Malaysia.
9
and 100% over the entire sample period, which seems to suggest that banks find flexibility in
their dividend policy. About 33% of the all dividend cuts occurred during the period of 1998-
2000 compared to 10% of all the dividend increases during the same period. The dividend
payments became more frequent after 2000. For instance, over the period of 2001-2005, 38%
of dividend increases were more than 50% mostly by local banks rather than foreign banks
which seem to suggest that foreign banks might have been more conservative. One such
example is of Citibank Malaysia Bhd. it increased its capital adequacy ratio by more than
20%, from 6% in 2000 to 25% in 2002, even though ratio of its non-performing loans to total
loans was on average 4%.
Further interesting results emerge when we take into account product market
competition. Irrespective of the bank ownership (i.e., domestic vs. foreign), 34% of all the
dividend increases (43% of all the dividend cuts) were made by banks selling both non-
Islamic and Islamic banking products compared to 62% of all the dividend increases (53% of
all the dividend cuts) by banks selling non-Islamic banking products. This result seems to
suggest that even though banks selling non-Islamic banking products have greater tendency
to cut dividends compared to banks selling both non-Islamic and Islamic banking products
but these banks pay generous dividends when comes to dividend re-initiations. Another
reason might be that they have higher optimal dividend payout ratio. We explore this issue
further in empirical section. These banks face stiffer competition for bank loans and deposits.
The yearly data on the total deposits and loans as percentage of total assets (not reported to
save space) shows that, these banks have 74% total deposits and 67% loans as percentage of
total assets compared to 68% and 70% respectively for the banks selling both non-Islamic
and Islamic banking products. Thus, a relatively lower loan ratio means that these banks do
not earn other loan income generated from the Islamic products such as those offered by
other banks selling both non-Islamic and Islamic banking products. The latter banks seem to

10
have an advantage in selling mixture of non-interest/interest-based products to diverse
clientele. Therefore, these banks are less likely to cut dividends. We explore this issue of
dividend flexibility in section 4.2 later of this paper.
[Insert Table 2 about here]
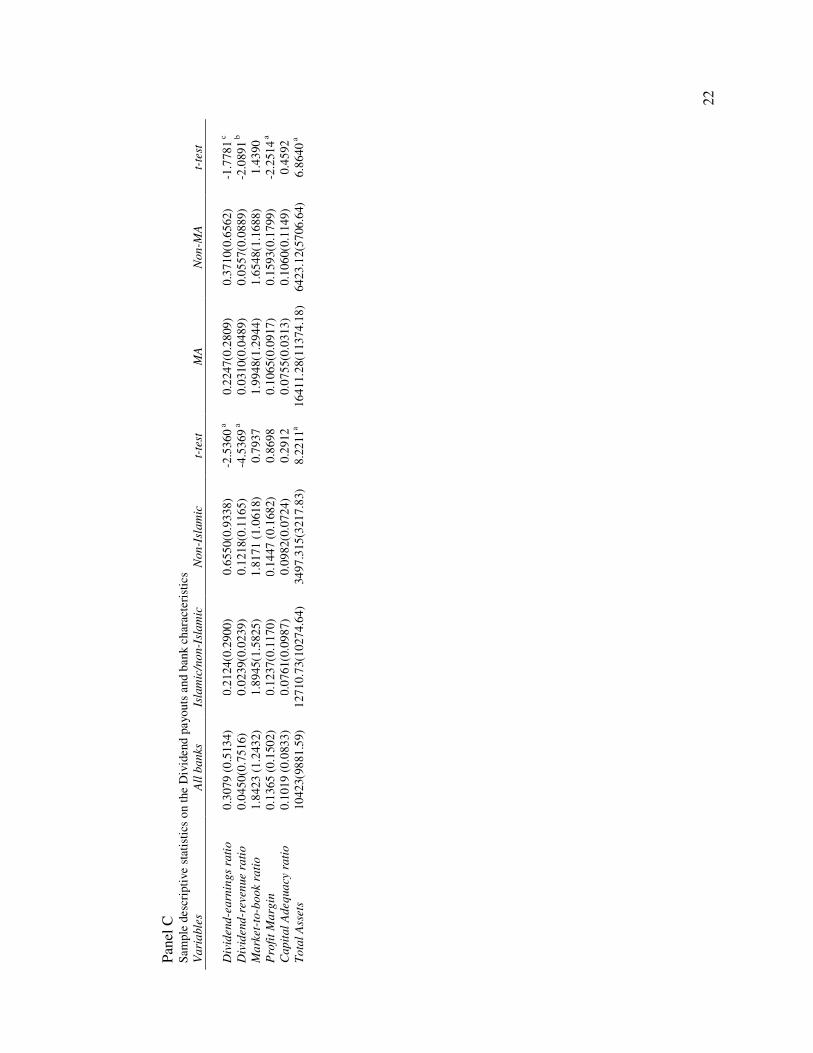
The summary descriptive statistics shows that, on average Dividend-earnings ratio is
30.79% in Malaysia in comparison to other Asian countries such as South Korea 11%,
Indonesia 16%, China 21%, India 23%, Sri Lanka 26% and U.S. banks 26%6(see Panel C).
On the other hand, the payout ratio is lower than 45% in the UK and 37% in Japan. Thus, it
appears that banks follow different payout policies across countries due to the organization of
the capital markets and dividend tax treatments as suggested by Aivazian et al. (2003) and La
Porta et al. (2000). Consistent with our earlier findings, both Dividend-earnings ratio and
Dividend-revenue ratio are significantly higher for Non-Islamic banking products selling
banks compared to banks selling mix of Islamic/non Islamic products. In terms of total assets,
however, latter banks are larger than Non-Islamic counterparts. On average, listed banks
which acquired or merge with other listed banks have significantly lower payout ratio 22%
compared to 37% for those banks which did not acquire or merge with other banks. Thus, it
can be conjectured that mergers and acquisitions might have affected dividend payout
policies of these banks.
4. Results
4.1 Optimal Dividend Payout and Adjustment Speed
We estimated the model in Eq. (1.3). For this purpose, we categorized the banks as
Domestic vs. Foreign, Islamic vs. non Islamic banks, MA vs. Non-MA (i.e., the banks
involved in Merger/Acquisitions vs. the banks which were not involved in Merger/
Acquisitions over the entire sample period). Table 3 reports the estimation results according
6 Based on Author’s own calculations

11
to this classification and Table 4 reports results of hypotheses, which test the impact of
growth and monetary policy changes on the dividend policy of the banks. It is important to
highlight that model has reasonable explanatory power in explaining dividend policy of the
banks7.
[Insert Table 3 about here]
The foreign banks’ dividend policy can be described as the highest dividends payout
ratio compared to the domestic banks whose payout policy can be described as significant
dividends smoothing i.e., (1- α)= 0.6573. The lower speed of adjustment of 0.40 and payout
ratio of 32% for the banks selling mixture of both Islamic/Non Islamic banking products
compared to relatively higher value of 0.42 and 57% for the banks selling only interest based
banking products seem to support hypothesis i.e., product mix of banks has significant
influence on the dividend payouts of the banks. Although the speed of adjustment of the
banks involved in M&A have been low compared to other banks not involved in M&A but it
seem that dividend payout has increased after M&A. Thus, we can only conjecture here that
shareholders of the acquired banks might have benefited from the improvements in the
organization structure and product developments as a result of M&A, these findings can be
further explored in a separate study.
On the other hand, we found that banks with low growth opportunities do not find it
optimal to pay substantial amounts of cash dividends (see Table 4). This result suggest that in
the absence of the protection to shareholders, the managers expropriate cash which is
common in the countries having less shareholders’ protection (see e.g., La Porta et al, 2000).
On the other hand, shareholders of the banks with more growth opportunities might have
benefited from higher payout ratio.
7 Unlike previous studies (e.g., Aivazian et al, 2003) which found that model performed poorly for the
Malaysian firms. The adjusted Adj. R2 is higher compared to the previous studies. Notably our estimation do not
have not problem of auto-correlation indicated by Durbin-Watson (DW) test values for each category of bank
respectively.

12
[Insert Table 4 about here]
Lastly, we examine the whether tight money market condition affects the dividend
policy of the banks. We used ratio of base money defined as the sum of currency in
circulation and the deposits of the commercial banks with the central bank divided by
nominal GDP as indicator of tight (lose) monetary policy. This ratio tends to increase during
expansionary monetary policy regime and decreases during contractionary policy regime
(Hosono, 2005). We interpret the changes in monetary policy will alter the credit demand by
the firms, which will affect the loan portfolio of the banks and subsequently earnings.
Alternatively, we used base rate used by Bank Negara Malaysia as proxy for monetary policy
regime as in Mateut et al. (2006). The results using base money to nominal GDP ratio show
that there are significant differences in the speed of adjustment and payout of the banks in the
two monetary regimes. However, using the base rate there is no significant influence on
either speed of adjustment or payout ratio in the two monetary regimes (see last row Table 4).
4.2 Flexibility of Dividend policy
In this section, we examine whether banks have flexibility to change their dividend
policy or not. Specifically, we investigate whether decision to increase, decrease or maintain
dividends depends on past earnings (EARNINGS), investment opportunities8 (MTB); total
deposits to assets ratio (DEPOSITS), capital adequacy ratio (CAP), non-performing loans to
total loans (NPL) and total loans to total assets ratio (LOANS). The loan products are the
important inputs in the banks production function, and variation in the income from these
products cause earnings volatility. On the other hand, capital adequacy ratio provides
protection against bank run, and reflects bank ability to continue to operate in future.
Previous studies (see e.g., Dickens et al, 2003; Mayne, 1980) have shown that capital
adequacy has a major influence on a banks’ dividend policy. Casey and Dickens (2000) find
8 Barclays et al (1995) measure for a firm’s investment opportunities is its market price per share divided by
book value per share is used in this paper.

13
that the dividend payout is affected by the banks’ current and anticipated need for capital in
relation to growth in assets, and expected future earnings. We argue that economic rationale
of selecting these variables can be tested in our unique setting of Malaysia, where banks have
seen quite ups and downs in recent period. We also include dummy variable (DLOSE) to
investigate whether a fall in earnings triggers dividend reductions, which is set to 1 if the
current net income is negative. These variables are used in ordered probit model also applied
by Goergen et al. (2003). The underlying model is:
ξβ += Xy*
where, y* is an unobserved variable, X is a set of explanatory variables and ζ is the residual.
The decision to cut dividends takes the value of 0; maintain the dividend take the value of 1
and increase takes the value 2. Although y* is not observed, we observe y:
0=y if y* ≤ 0 (2.1)
1=y if 0 < y* ≤ µ (2.2)
2=y if µ ≤ y* (2.3)
µ is an unknown parameter to be estimated with β ′ . Assuming that ζ is normally
distributed across observations (as in the binomial probit model) and the mean and the
variance of are set to 0 and 1 respectively. With the normal distribution we have the
following probabilities:
)()0( XyP β ′−Φ=== (2.4)
)()()1( XXyP ββµ ′−Φ−′−Φ=== (2.5)
)(1)2( XyP βµ ′−Φ−=== (2.6)
where Φ is the cumulative standard normal. The coefficients are estimated by using the
maximum likelihood function. The model is estimated assuming multiplicative

14
heteroskedasticity (i.e. ]exp[]var[ *
izχζ = , essentially adding an additional parameter to the
model)
The explanatory variables denoted by X (defined above) are used not in levels but in
changes. We argue that the changes in the deposits, loans, loans quality and concentration of
loan portfolio of the banks will significant affect the choice to cut, maintain or increase
dividends. Thus, explanatory variables X are:
),,,,,,( ,,,,,, titititititi LOANSNPLCAPDEPOSITSEAREARX ∆∆∆∆∆=
There are some caveats to our results i.e., lack of data or dividend non-payments of
Islamic and foreign banks. Therefore our results should be interpreted with caution. The
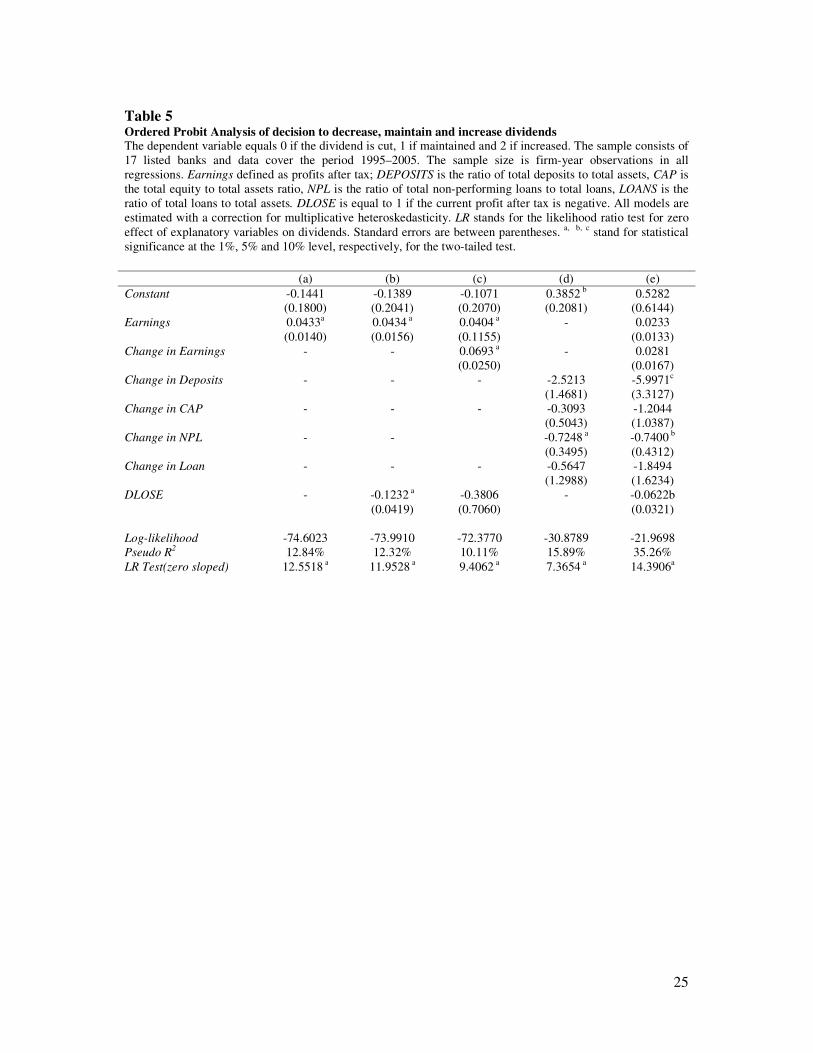
estimation results are shown in Table 5 using several specifications.
[Insert Table 5 about here]
First, we examine the effect of current earnings on the dividend decision
(specification a). The results show that the probability of a dividend increase by a bank is
higher when there are positive earnings in the current year. From the inclusion of an earnings
loss dummy and changes in earnings variables (specification b and c), we found that banks
incurring loses are significantly likely to reduce dividends. This result is consistent with
earlier studies. The results show that increase in the ratio of non-performing loans in the bank
portfolio significantly reduces the bank’s dividends (specification d). It is important to note
here that by inclusion of the bank specific growth variables, explanatory power of the model
has increased from 12% to 15%.
In the final specification (e), after controlling for a bank’s growth opportunities, we
find that changes in the deposits and non-performing loans significantly induce dividends
cuts. Thus, it can be conjectured that deposits and non-performing loans variables provides
better description of the dividend flexibility of the banks in Malaysia. We did not find any
significant effect of the changes in the capital adequacy ratio in any of the specifications (d

15
and e). We suspect that capital injections by the Malaysian government might have provided
safety cushion for the banks against bankruptcy and to maintain depositor’s trust in the banks
to avoid bank runs.
4.3 Robustness Tests
In the previous section, we found that NPLs have significant effect on dividends, but
we suspect this finding might be due to the Asian financial crisis. In order to test the crisis
impact, we included a dummy variable denoted by CRISIS equal to 1 for the years 1997-
1998, and zero otherwise. The results remain unchanged and the coefficient on CRISIS
variable is not significant (see Table 6 column a). Most of the NPLs in Asian countries were
the outcomes of excessive corporate borrowings financed by banks through short-term
borrowing from the international financial markets. It might be possible that banks which
were more (less) exposed to corporate sector, their dividend payout decisions might have
been more (less) sensitive to total exposure to corporate sector. For this purpose, we
calculated ratio of banks’ loans to corporate sector to total assets denoted by CPL. We used
average of this ratio over the past three years for each bank. The estimation results (see
column b) in Table 7 shows a significant negative coefficient on CPL, suggesting that the
reduction in dividends payments of the banks were strongly related to the exposure to
corporate sector.
[Insert Table 6 about here]
It has been argued that high exposure of some banks to real-estate sector was also a
major cause of deterioration of some banks. Therefore, in our final specification (see column
c), we included each bank’s ratio of real-estate loans as a percentage of total assets, denoted
by REL and again used the average over past three years instead of contemporaneous values.
We find that a significant negative coefficient for the variable REL, thus, the exposure
of the banks to real-estate sector significantly influenced the dividends cut by banks. The last

16
two findings taken together suggest that there is a higher probability of dividend cuts due to
high exposure to corporate and real estate sector. This finding is also supported by argument
of loan-portfolios correlation across banks as in Bessler and Nohel (2000).
5. Conclusion
This paper investigates the dividend policy of listed banks in Malaysia. We analyze
the impact of product market competition and regulation on the optimal payout of the banks.
We found that although banks have been affected by changes in the financial market
environment but they maintain flexibility in the changing the dividends. In particular, product
market competition plays an important role.
Our results seems to suggest that, besides net earnings as key determinant of the
dividends, earnings loses and banks’ specific variables such as changes in the deposits and
non-performing loans ratios significantly affect banks’ dividends irrespective of their product
mix. The composition of the banking sector loan portfolios, in particular, high exposure to
corporate and real-estate sector, created deadweight costs for the banks which created bias
toward dividends cut. These findings have implication for the regulators. First, shareholders
have the right to know about non-performing loans of the banks. In this regards, appropriate
disclosures in the annual reports of the banks should be enforced by the regulators.
Shareholders and depositors should be informed regarding the financial risks assumed by the
banks. It would be interesting to explore in future work are there any effect of dividend
changes on the depositors behaviour? The bank would face high bankruptcy risk as
depositors withdraw money after knowing about deteriorating loan performance of banks.
Therefore, banks would need other governance to resolve dual agency problems.

17
References
Adaoglu, C, (2000), “Instability in the Dividend Policy of the Istanbul Stock Exchange (ISE)
Corporations: Evidence from an Emerging Market”, Emerging Market Review, Vol. 1, pp.
252-270.
Amihud, Y. and Murgia, M., (1997), “Dividend, Taxes, and Signalling: Evidence from
Germany”, The Journal of Finance Vol. 52, pp.397-408.
Aivazian, V., Booth, L., and Cleary, S., (2003), “Dividend policy and The Organization of
Capital Markets”, Journal of Multinational Financial Management, Vol. 13, pp. 101-121.
Aivazian, V., Booth, L., and Cleary, S., (2003), “Do Emerging Firms Follow Different
Dividend Policies from US Firms?”, Journal of Financial Research, Vol. 26, No.3, pp. 371-
387.
Allen, F. Bernardo, A. and Welch, I., (2000), “A Theory of Dividends based on Tax
Clienteles”, The Journal of Finance, Vol. 56, No.6, pp. 2449-2536.
Allen, D.E .A and Veronica, S.R., (1996), “Dividend Policy and Stock Price Volatility:
Australian Evidence”, Applied Financial Economics, Vol. 6, pp. 175-188.
Baker, M and Wurgler, J., (2004), “A Catering Theory of Dividends”, The Journal of Finance
Vol. 59, pp. 1125-1165.
Baker, H.K. Powell, G.E. and Veit, T.T., (2002), “Revisiting Managerial Perspectives on
Dividend Policy”, Journal of Economics and Finance, Vol. 26, pp.267–283
Barclays, M.J. Smith, C.W. and Watts, R.L., (1995), “The Determinants of Corporate
Leverage and Dividend Policies”, Journal of Applied Corporate Finance, Vol. 7, pp. 4-19.
Bessler, W. and Nohel, T, (1996), “The Stock Market Reaction to Dividends cuts and
omissions by Commercial Banks”, Journal of Banking and Finance, Vol.20, No.9, pp. 1485-
1508.
Bessler, W. and Nohel, T, (2000), “Asymmetric information, dividend reductions, and
contagion effects in bank stock returns”, Journal of Banking and Finance, Vol. 24, pp. 1831-
1848.
Black, F. and Scholes, M., (1972,) “The Effects of Dividend Yield and Dividend Policy on
Common Stock Prices and Returns”, Journal of Financial Economics, Vol. 1, pp. 1-22.
Bhattacharya, S., (1979), “Imperfect Information, Dividend policy and the ‘Bird in the hand
fallacy”, Bell Journal of Economic, Vol. 10, pp. 259-270.
Bhattacharya, N., (2007), “Dividend Policy: A Review”, Managerial Finance, Vol. 33, No. 1,
pp. 4-13.

18
Casey, K, M. and Dickens, R.N., (2000), “The Effect of Tax and Regulatory Changes on
Commercial Bank Dividend Policy”, Quarterly Review of Economics and Finance, pp. 279-
293.
Chami, R., Cosimano, T., (2001), “The Conduct of Monetary Policy under the Basel Accord,
Manuscript”, International Monetary Fund and University of Notre Dame, January.
Dickens, R.N. Casey, K.M. and Joseph, M, (2003), “Bank Dividend Policy: Explanatory
Factors”, Quarterly Journal of Business and Economics, Vol. 41, No. 1/2,
Goergen, M. Reneeboog, L. and Silva, L.C., (2003), “When Do German Firms Change their
Dividends?” Journal of Corporate Finance, Vol. 11, No. 2, pp. 375-399.
Gugler, K., (2003), “Corporate Governance, Dividend Payout Policy, and The Interrelation
between Dividends, R&D, and the Capital Investment” Journal of Banking and Finance, Vol.
27, pp. 1297-1321.
Horace, H., (2003), “Dividend Policies in Australia and Japan”, International Advances in
Economic Research, Vol. 9, No. 2, pp.91-100.
Hosono, K. ,(2005), “The Transmission Mechanism of Monetary Policy in Japan: Evidence
from Banks’ balance sheets”, The Japanese and International Economies, Vol. 20, pp. 380-
405.
Hülsewig, O. Mayer, E. and Wollmershäuser, T., (2005), “Bank Loan Supply and Monetary
Policy Transmission in Germany: An Assessment based on Matching Impulse Responses”,
Journal of Banking and Finance, Vol. 30 No.10, pp. 2839-2910.
Jensen, M., Meckling, W., (1976), “Theory of the firm, managerial behaviour, agency costs,
and ownership structure”, Journal of Financial Economics 3, 305-360.
Jensen, M.J. (1986). Agency cost of free cash flow, corporate finance, and takeover,
American Economic Review, 76, 323-329.
Kashyap, A. and Stein, J., (1995), “The Impact of Monetary Policy on Bank Balance Sheets
Carnegie Rochester Series on Public Policy”, Vol. 42, pp. 151-195.
Katib, M.N. and Mathews, K., (2000), “A non-parametric approach to efficiency
measurement in the Malaysian banking sector”. The Singapore Economic Review, Vol. 44,
pp. 89-114.
Kim, M. Kristiansen, E.G. and Vale, B., (2005), “Endogenous Product Differentiation in
Credit Markets: What do borrowers pay for?” Journal of Banking and Finance Vol. 29, No. 3,
pp. 681-699.
Kopecky, K. and VanHoose, D., (2004), “A Model of the Monetary Sector with and without
Binding Capital Requirements”, Journal of Banking and Finance Vol. 28, pp.633–646.
Kopecky, K. and VanHoose, D., (2004), “Bank Capital Requirements and the Monetary
Transmission Mechanism”, Journal of Macroeconomics, Vol. 26, No.3, pp. 443-464.

19
Krishnasamy, G., Ridzwa, A.F., Vignesan, P., (2004), “Malaysian Post-Merger Banks’
Productivity: Application of Malmquist Productivity Index”, Managerial Finance, Vol. 30,
pp. 63-74.
La Porta, R, L. Lopez, S. F., Shleifer, A. and Vishny, R.W., (2000), “Agency Problems and
Dividend Policies around the World”, The Journal of Finance, Vol.55, No.1, pp.1-33.
Laeven, L., (2003), “Does Financial Liberalization Reduce Financing Constraints?” Financial
Management, Vol. 32, No.1, 5-34.
Lintner, J., (1956), “Distribution of Incomes of Corporations Among Dividends, Retained
Earnings, and Taxes”, American Economic Review, Vo.46, pp. 97–113.
Marquez, R., (2002), “Competition, Adverse Selection, and Information Dispersion in the
Banking Industry”, The Review of Financial Studies, Vol.15, No.3, pp. 901-926.
Mateut, S. Roughens, S. and Mizen, P., (2006), “Trade credit, Bank lending, and Monetary
Policy Transmission”, European Economic Review, Vol. 50, pp. 603-629.
Mayne, L.S., (1980), “Bank Dividend Policy and Holding Company Affiliation”, Journal of
Financial and Quantitative Analysis, Vol.15, No.2, pp. 469-480.
Mercado-Mendez, J. and Willey, T, (1995), “Agency costs in the Banking Industry: An
Examination of Ownership Behaviour, Leverage and Dividend policy”, Journal of Economics
and Finance, Vol.19, No.3, pp. 105-117.
Miller M., and Modigliani, F., (1961), “Dividend Policy, Growth and the Valuation of
Shares”, Journal of Business, Vol. 34, pp/ 411–433
Miller, M., and Rock, K., (1985), “Dividend policy under asymmetric information”, The
Journal of Finance”, Vol. 40, pp.1031-1051.
Nelson, R.R., (1991), “Why Do Firms Differ, and How Does it Matter?” Strategic
Management Journal, Vol. 12, No.8, pp. 61-74.
Ogler, Y.E., and Taggart, R.A., (1983), “Implications of Corporate Capital Structure Theory
of Banking Institutions”, Journal of Money, Credit and Banking, Vol.15, No.2, pp. 212-221.
Pandey, I.M., (2003), “Corporate Dividend Policy and Behaviour: the Malaysian Evidence”,
Asian Academy of Management Journal, Vol. 8, No.1, pp. 17-32.
Sufian, F., (2004), “The Efficiency Effects of Bank Mergers and Acquisitions in a
Developing Economy: Evidence from Malaysia”, International Journal of Applied
Econometrics and Quantitative Studies, Vol. 1, No.4, pp. 53-74.

20
Table 1 Structure of Banking sector in Malaysia
Local Commercial Banks Islamic Banks Foreign Banks
Affin Bank Bhd. Bank Islam (M) Bhd. ABN Amro Bank Bhd.
Alliance Bank Malaysia Bhd. Bank Mualamat (M) Bhd. Bangkok Bank Bhd.
Arab-Malaysian Bank Bhd. Bank of America (M) Bhd.
Bumiputra-Commerce Bank Bhd. Bank of China (M) Bhd.
EON Bank Bhd. Bank of Tokyo-Mitsubishi (M) Bhd.
Hong Leong Bank Bhd. Citibank Bhd.
Malayan Banking Bhd. Deutsche Bank (M) Bhd.
Public Bank Bhd. HSBC (M) Bhd.
RHB Bank Bhd. JP Morgan Chase Bank Bhd.
Southern Bank Bhd. Bank of Nova Scotia Bhd.
OCBC Bank (M) Bhd.
Standard Chartered Bank (M) Bhd.
United Overseas Bank (M) Bhd. Source: Bank Negara Malaysia
Note: Ten banking groups or anchor banks were formed as a result of merger drive: 1)Arab Malaysian Bank
Bhd., 2)Bumiputra-Commerce Bank Bhd., 3)RHB Bank Bhd., 4)Southern Bank Bhd., acquired Ban Hin Lee
Bank; 5)Malaysian Banking Bhd., acquired The Pacific Bank and Phileo Allied Bank; 6)Public Bank Bhd.,
acquired or merged with Hock Hua Bank; 7)Multi-Purpose Bank Bhd.., merged or acquired International Bank
Malaysia Sabah Bank; 8)Hong Leong Bank merged/acquired Wah Tat Bank; 9)Perwira Affin Bank
acquired/merged with BSN Commercial Bank, 10)EON Bank Bhd., with Oriental Bank Bhd.

21
Tab
le 2
Dis
trib
uti
on
of
Div
iden
ds
an
d D
esc
rip
tive
Sta
tist
ics
This
table
sh
ow
s th
e year
ly d
istr
ibuti
on o
f th
e div
iden
d p
aym
ents
of
the
list
ed M
alaysi
an b
anks
from
199
5 t
o 2
00
5 (
Pan
el A
). D
ivid
end p
aym
ents
are
def
ined a
s to
tal
cash
div
idend p
aym
ents
to p
refe
rred
and o
rdin
ary s
har
ehold
ers.
The
colu
mn c
han
ges
in d
ivid
end p
aym
ents
show
s th
e nu
mber
of
banks
incr
easi
ng (
dec
reas
ing)
and n
ot
payin
g c
ash
div
idends
in c
olu
mn
s 2,
3,
and 4
. P
anel
B r
eport
s th
e re
sult
s of
dif
fere
nce
in t
he
div
idend
payouts
of
the
ban
ks
usi
ng t
-test
. Is
lam
ic/n
on I
slam
ic b
ank
s ar
e th
ose
lis
ted b
anks
whic
h s
ell
both
Isl
am
ic c
om
pla
int
and t
radit
ional
inte
rest
bea
rin
g p
roduct
s, a
nd N
on-I
sla
mic
ban
ks
are
those
whic
h d
o n
ot
sell
Isl
amic
pro
duct
s. M
A a
re t
hose
banks
whic
h
hav
e ac
quir
ed o
ther
lis
ted b
anks
(see
footn
ote
) and N
on-M
A a
re t
hose
banks
whic
h d
id n
ot
take
over
an
y b
ank d
uri
ng t
he
sam
ple
per
iod.
Div
idend-e
arn
ings
rati
o d
efin
ed a
s
the
tota
l ca
sh d
ivid
end p
aid t
o p
refe
rred
and c
om
mon s
har
ehold
ers
div
ided
by E
arn
ing
s def
ined a
s pro
fits
aft
er t
ax;
Div
idend-r
evenue r
ati
o d
efin
ed a
s th
e as
the
tota
l ca
sh
div
idend p
aid t
o p
refe
rred
and
com
mon s
har
ehold
ers
div
ided
by t
ota
l in
tere
st i
nco
me;
Mark
et-
to-b
ook r
ati
o i
s ra
tio o
f m
arket
val
ue
of
equit
y t
o b
ook v
alue
of
equit
y (
pro
xy
for
futu
re g
row
th o
pp
ort
unit
ies)
; P
rofi
t M
arg
in i
s th
e r
atio
of
pro
fit
afte
r ta
x t
o t
ota
l re
ven
ue,
Ca
pit
al
Adequacy r
ati
o i
s ra
tio o
f ca
pit
al t
o a
sset
s ra
tio o
f th
e ban
ks.
a b
c s
how
s
stat
isti
cal
sign
ific
ance
at
1,
5,
ad 1
0 p
erce
nt
level
res
pec
tivel
y.
Pan
el A
D
istr
ibuti
on
of
ban
ks
wit
h y
earl
y c
han
ges
(in
crea
se,
dec
reas
e, n
on-p
aym
ent
over
the
per
iod o
f 1
995-2
005
Yea
r N
um
ber
of
ban
ks
Div
iden
ds
RM
. M
ill
Chan
ges
in D
ivid
end p
aym
ents
In
crea
se
Dec
reas
e N
on-p
aym
ent†
19
95
-
1,2
97.0
2
- -
-
19
96
11
1,6
71.6
6
6
2
3
19
97
10
1,5
72.5
2
2
4
4
19
98
10
721.0
5
- 6
4
19
99
14
590.3
3
2
5
7
20
00
14
1,2
17.7
9
4
2
8
20
01
13
2,1
52.1
2
7
1
5
20
02
21
2,1
84.3
2
8
5
8
20
03
19
3,9
79.0
8
11
2
6
20
04
20
4,0
57.5
8
7
7
6
20
05
18
4,2
78.8
3
8
4
6
Pan
el B
D
istr
ibuti
on
of
chan
ges
in t
he
div
idends
Ran
ge
of
chan
ges
in D
ivid
end
s In
crea
ses
%
of
tota
l in
crea
ses
Dec
reas
es (
cuts
) %
of
tota
l dec
reas
es
(cuts
)
0 <
10%
14
25.4
5
5
12.8
2
10-<
20%
6
10.9
0
7
17.9
5
25-5
0%
11
20.0
0
12
30.7
6
50-1
00%
24
43.6
4
15
38.4
6
Tota
l
55
39
†N
on-p
aym
ents
als
o i
nclu
des
mis
sing d
ata
on d
ivid
en
d p
aym
ents
22
Pan
el C
S
ample
desc
ripti
ve
stat
isti
cs o
n t
he
Div
idend p
ayouts
and b
ank c
har
acte
rist
ics
Vari
able
s
All
banks
Is
lam
ic/n
on-I
slam
ic
Non-I
slam
ic
t-te
st
MA
N
on-M
A
t-te
st
Div
idend-e
arn
ings
rati
o
0.3
079 (
0.5
13
4)
0.2
124(0
.2900)
0.6
550(0
.9338)
-2.5
360
a
0.2
247(0
.2809)
0.3
710(0
.6562)
-1.7
78
1 c
Div
idend-r
even
ue r
ati
o
0.0
450(0
.7516)
0.0
239(0
.0239)
0.1
218(0
.1165)
-4.5
369
a
0.0
310(0
.0489)
0.0
557(0
.0889)
-2.0
89
1 b
Mark
et-
to-b
ook r
ati
o
1.8
423 (
1.2
43
2)
1.8
945(1
.5825)
1.8
171 (
1.0
61
8)
0.7
937
1.9
948(1
.2944)
1.6
548(1
.1688)
1.4
390
Pro
fit
Marg
in
0.1
365 (
0.1
50
2)
0.1
237(0
.1170)
0.1
447 (
0.1
68
2)
0.8
698
0.1
065(0
.0917)
0.1
593(0
.1799)
-2.2
51
4 a
Capit
al
Adeq
uacy
rati
o
0.1
019 (
0.0
83
3)
0.0
761(0
.0987)
0.0
982(0
.0724)
0.2
912
0.0
755(0
.0313)
0.1
060(0
.1149)
0.4
592
Tota
l A
ssets
10
423(9
881.5
9)
127
10.7
3(1
027
4.6
4)
34
97.3
15(3
21
7.8
3)
8.2
211
a
16
411.2
8(1
13
74.1
8)
64
23.1
2(5
706.6
4)
6.8
640
a

23
Table 3 Optimal Dividend payout and speed of adjustment of Malaysian Listed Banks The table reports the estimation result of Eq (1.3):
titititi DD ,,,, )1( εαατγ +−+Π+=
where tiD , is the dependent variable defined as the total cash dividend to preference and common share holders.
α is the speed of adjustment and τ is optimal dividend payout ratio. The standard errors are heteroscedastic-
consistent and shown in the parenthesis. DW is the Durbin-Watson test for testing first order auto-correlations in
the residuals of the estimated model.
α τ Adj. R
2 DW
All banks 21 0.4262 a
(0.1330)
0.5445 a
(0.1068)
0.5786 1.9834
Domestic banks 12 0.3427 a
(0.1540)
0.5137 a
(0.1935)
0.5946 1.9937
Foreign banks 9 0.9050 a
(0.1741)
0.7023 a
(0.0897)
0.5442 1.8443
Islamic/Non Islamic banks 10 0.4014 a
(0.1116)
0.3257 a
(0.1157)
0.3246 2.2893
Non-Islamic banks 11 0.4240 a
(0.1651)
0.5761 a
(0.1651)
0.6143 2.0521
MA banks 7 0.3837 a
(0.2133)
0.6104 a
(0.2348)
0.5744 1.9493
Non-MA banks 14 0.4454 a
(0.0971)
0.3352 a
(0.0821)
0.4353 2.2642
a, b, c shows statistical significance at 1, 5, ad 10 percent level respectively.

24
Table 4 Growth opportunities and Monetary Policy Effects on the Dividend payout
This table reports the values of the speed of adjustment to optimal dividend denoted by α and optimal payout of
the firms denoted byτ . Growth is defined as the market value of equity to book value of equity of a bank at the
year end. We used median of Growth to divide banks into high growth H-GROWTH and low growth L-
GROWTH banks. We used ratio of base money to nominal GDP to define monetary policy regime as tight
money T-MONEY and loose money L- MONEY. The last row of the table shows results using alternate measure
of tight (lose) monetary policy using base interest rate used by Bank Negara Malaysia. The data on base money,
GDP and interest rates was obtained from IMF International Financial Statistics and Bank Negara Malaysia
respectively. Chi-test gives value of chi-square test of the difference in the speed of adjustment and optimal
payout of the banks.
α τ Chi--test
H-GROWTH 0.3683(0.2376) 0.6167(0.2745) 16.2753 a
L-GROWTH 0.3315(0.0988) 0.3846(0.0843)
T-MONEY 0.0634(0.0274) 0.1741(0.0134) 18.6195 a
L-MONEY 0.3808(0.1369) 0.4399 (0.1434)
T-MONEY2 0.1134(0.1211) 0.1341(0.0404) 2.3390
L-MONEY2 0.1808(0.1369) 0.3399 (0.2434) a,
b,
c shows statistical significance at 1, 5, ad 10 percent level respectively.
25
Table 5 Ordered Probit Analysis of decision to decrease, maintain and increase dividends The dependent variable equals 0 if the dividend is cut, 1 if maintained and 2 if increased. The sample consists of
17 listed banks and data cover the period 1995–2005. The sample size is firm-year observations in all
regressions. Earnings defined as profits after tax; DEPOSITS is the ratio of total deposits to total assets, CAP is
the total equity to total assets ratio, NPL is the ratio of total non-performing loans to total loans, LOANS is the
ratio of total loans to total assets. DLOSE is equal to 1 if the current profit after tax is negative. All models are
estimated with a correction for multiplicative heteroskedasticity. LR stands for the likelihood ratio test for zero
effect of explanatory variables on dividends. Standard errors are between parentheses. a,
b,
c stand for statistical
significance at the 1%, 5% and 10% level, respectively, for the two-tailed test.
(a) (b) (c) (d) (e)
Constant -0.1441
(0.1800)
-0.1389
(0.2041)
-0.1071
(0.2070)
0.3852 b
(0.2081)
0.5282
(0.6144)
Earnings 0.0433a
(0.0140)
0.0434 a
(0.0156)
0.0404 a
(0.1155)
- 0.0233
(0.0133)
Change in Earnings - - 0.0693 a
(0.0250)
- 0.0281
(0.0167)
Change in Deposits - - - -2.5213
(1.4681)
-5.9971c
(3.3127)
Change in CAP - - - -0.3093
(0.5043)
-1.2044
(1.0387)
Change in NPL - - -0.7248 a
(0.3495)
-0.7400 b
(0.4312)
Change in Loan - - - -0.5647
(1.2988)
-1.8494
(1.6234)
DLOSE - -0.1232 a
(0.0419)
-0.3806
(0.7060)
- -0.0622b
(0.0321)
Log-likelihood -74.6023 -73.9910 -72.3770 -30.8789 -21.9698
Pseudo R2 12.84% 12.32% 10.11% 15.89% 35.26%
LR Test(zero sloped) 12.5518 a 11.9528
a 9.4062
a 7.3654
a 14.3906
a

26
Table 6 Ordered Probit Analysis of decision to decrease, maintain and increase dividends The dependent variable equals 0 if dividend is cut by a bank, 1 if dividend is maintained and 2 if dividend is
increased. The sample consists of 17 listed banks and data cover the period 1995–2005. Earnings defined as
profits after tax; DEPOSITS is the ratio of total deposits to total assets. CAP is the ratio of total equity to total
assets, NPL is the ratio of total non-performing loans to total loans, and LOANS is the ratio of total loans to total
assets. DLOSE is equal to 1 if the current profit after tax is negative. CRISIS is a dummy variable equal to 1 for
the period 1997-1998 and zero otherwise. CPL is the ratio of total corporate loans to total assets. REL is the ratio
of total real-estate loans to total assets. All models are estimated with a correction for multiplicative
heteroskedasticity. LR stands for the likelihood ratio test for zero effect of explanatory variables on dividends.
Standard errors are between parentheses. a,
b,
c stand for statistical significance at the 1%, 5% and 10% level,
respectively, for the two-tailed test.
(a) (b) (e)
Constant 0.6770 c
(0.4000)
0.5282
(0.6144)
0.5411
(0.6144)
Earnings 0.0142
(0.0200)
0.0322
(0.0233)
0.0239
(0.0222)
Change in Earnings 0.0266
(0.0690)
0.0281
(0.0767)
0.0244
(0.0767)
Change in Deposits -9.5941c
(5.7839)
-5.9971c
(3.3127)
-0.8221b
(0.3127)
Change in CAP -1.7520
(1.1803)
-1.2044
(1.0387)
-0.9158
(1.0164)
Change in NPL -0.8484 b
(0.4232)
-0.7400 b
(0.4312)
-0.8756 b
(0.3952)
Change in Loan -1.7152
(1.7862)
-1.9454
(1.7304)
-1.4920
(1.5515)
DLOSE -0.4548
(1.4641)
-0.0522
(0.0421)
-0.5841 b
(1.0321)
CRISIS -0.0082
(0.1144)
-0.0078
(0.1144)
-0.0009
(0.0065)
CPL -0.0212 b
(0.0113)
-0.0198
(0.0100)
REL - - -0.0281 b
(0.0167)
Log-likelihood -20.7017 -25.3412 -19.9698
Pseudo R2 49.97% 33.13% 33.76%
LR Test(zero sloped) 23.9168 a 15.2032 a 15.4839a