Munich Personal RePEc Archive - mpra.ub.uni … · Munich Personal RePEc Archive Is there room for...
17
Munich Personal RePEc Archive Is there room for shared cars in Italy? Considerations from some recent experiences Antonio Laurino and Raffaele Grimaldi Politecnico di Milano 1. September 2011 Online at https://mpra.ub.uni-muenchen.de/33100/ MPRA Paper No. 33100, posted 1. September 2011 13:09 UTC
Transcript of Munich Personal RePEc Archive - mpra.ub.uni … · Munich Personal RePEc Archive Is there room for...

MPRAMunich Personal RePEc Archive
Is there room for shared cars in Italy?Considerations from some recentexperiences
Antonio Laurino and Raffaele Grimaldi
Politecnico di Milano
1. September 2011
Online at https://mpra.ub.uni-muenchen.de/33100/MPRA Paper No. 33100, posted 1. September 2011 13:09 UTC

IS THERE ROOM FOR SHARED CARS IN ITALY? CONSIDERATIONS FROM SOME RECENT
EXPERIENCES
Antonio Laurino*, Raffaele Grimaldi
DiAP – Politecnico di Milano, Via Bonardi 3, 20133, Milano – Italia
*Corresponding author, [email protected], DiAP – Politecnico di Milano, Via Bonardi 3,
20133, Milano – Italia
Abstract
Car sharing is increasing its role worldwide as an alternative transport mode, that could contribute to a
more sustainable urban mobility by reducing congestion and pollution. The paper focuses on the
understanding of which are the main characteristics of this service starting from the literature on this topic
both in terms of user profile and impact of the service; in the second part of the paper, the Italian context
will be presented starting from the analysis of four Italian experiences with a particular focus on Milan’s car
sharing. Summarizing the conclusion, it emerges that to date, the overall impact on transport is still quite
low, in part due to a scarce integration and coordination with other transport modes and in part because
car is still perceived primarily as a status symbol and a “good” rather than as a “service”. Therefore, car
sharing can perform as a significant complementary and sustainable solution to mobility needs only in a
context of cultural change and inside a transport policy aimed at changing transport behavior.
JEL classification: Q50; R40
Keywords: car sharing, sustainable mobility, transport policy, urban mobility, peer to peer car sharing
________________________________________________________________________________
1. INTRODUCTION
Urban contexts are experiencing in time growing problems related to mobility, like congestion, parking
scarcity and environmental issues; in the last decades, car sharing (hereafter CS) has gained popularity as a
different strategy to help solving these problems. Together with other measures (such as road pricing, park
pricing, improvement of public transport services), it can contribute to improve efficiency and sustainability
of mobility in urban contexts promoting a change in mobility behaviours
In the following paragraphs, after an overview on the literature reviews on car sharing, the current
situation of some Italian cities will be presented with a specific focus on the case of Milan’s car sharing. In
the end, we propose some considerations on a very promising alternative to traditional car sharing that is
getting importance worldwide, the so called “peer-to-peer” (P2P) car sharing; finally some consideration on
potential car sharing market in Italy will be done.

2. WHAT IS CAR SHARING?
Owning a car represents, for many people, an essential element for mobility due to its flexibility and
availability that contribute to achieve an independent lifestyle; for other people, car is seen as a
supplementary transport alternative assuring a mobility solution for occasional events and emergencies.
Many people prefer to own a car even if their annual driving mileage is low, since car is seen as a mobility
guarantee while for others, car is also a status symbol, whatever the case. Furthermore, the majority of the
costs borne by motorists are fixed and they do not depend on the travelled kilometres and since the
variable costs of a car are relatively lower compared to the fixed ones, car owners tend to use the vehicle as
much as they can (Shaheen and Martin, 2006) even if the increase in fuel prices can contribute to reduce
car use.
In this context, CS can be seen as a viable alternative for users since it enables the flexibility and availability
of a car to households for short periods without bearing the whole costs and the responsibilities of
ownership. A traditional CS organization maintains a fleet distributed in neighbourhood locations, made of
different types of cars to accommodate users’ different requirements and preferences; vehicles are located
in the living area and users, in general, pay electronically both for the time of usage and for the travelled
distance1. The idea of CS is that a vehicle is used by different people in different moments of the day
determining a more efficient use of a resource, whereas private autos are in general used only for few
hours a day while for the majority of the time they are parked consuming urban space. The typical CS
organization relies on a centralized system for bookings, data collection and billing; there are different
schemes applied to provide the service but the basic idea is that an user reserves his/her car by internet,
mobile phone, smart phone or call centre deciding the location and the usage time. Since CS members pay
higher variable costs compared to fixed ones, they can estimate the cost of an auto trip in advance and
compare it with the other available alternative transportation modes (public transit, car rental, taxi, etc). CS
differs from traditional car rental in several ways. For example, the user’s identification procedure is
speeded up2, the reservation, pickup and return processes are all self-service so there's no limitation
determined by office hours; cars are located and distributed in areas easily accessible by walking or public
transport instead of being in only few locations in a given city3.
The spread and the popularity of CS depend from a series of user/context related elements that can help to
understand the potentiality of this system; for example, the frequency and the trip purpose, the annual
mileage of a user or the quality and reliability of public transport (Loose et al., 2004).
In the last decade the application of CS schemes worldwide has been positive but it’s still a niche product
(Ciari, 2009) far from a level that can deliver significant aggregate benefits (Duncan, 2010). According to the
results of the European Project Momo (Loose, 2010), at the beginning of 2009, there were approximately
380 000 car-sharing participants in Europe and the total vehicles available were around 11 900. The first
experiences of car sharing started in Switzerland and Germany in the late 1980s and early 1990s, most car
sharing organizations started as small, local, not-for-profit operations, in many cases they were largely run
1 This in order to consider both the cases of high mileage trip during short rental time and low mileage time during
long rental trip (VTPI, 2010).
2 In general a contactless chip card is used for locking and unlocking cars and users are already registered.
3 Moreover for rental service, costs are mainly related to time (fuel is normally not included in the price) the minimum
rental time is higher (in general a day).

by small groups of individuals highly concerned with environmental issues that wanted to reduce car use
and avoid the high fixed costs of private cars. Even if environmental reason is still seen as an important
motivation to join CS, economic considerations have gained increasing importance for users (Loose, 2010)
since CS may determine cost savings whereas it is widespread, integrated with other mobility instruments
and flexible enough.
3. CHARACTERISTICS OF CAR SHARING: A LITERATURE REVIEW
The recent growth of CS as a new sustainable transport initiative has stimulated numerous academic
studies on the characteristics of this service with respect to its users, the neighbourhood features, the
benefits both for the user and the community, etc.
The majority of these studies are based on surveys conducted among the members of car sharing
organizations but in many cases the sample dimension and differences in data collection and study
methodology produce inconsistent or not comparable results, so the final results should be considered with
caution4.
Many researches focus on the analysis of existing experiences deepening the characteristics of both the
users and the system evidencing the peculiarities that make car sharing a viable alternative in urban
context (TCRP, 2005; Sullivan and Magid, 2007). Other studies tried to analyze the market potential of this
service (Shaheen et al. 2001, 2006, 2008), in many cases they evidence how it is still a niche product (Ciari
et al. 2009) needing a more supportive policy approach (Shaheen et al. 2007). Other research have
deepened the socio economic characteristics of the users (TCRP, 2005; Andrew and Douma, 2006) and the
overall impacts determined by the system (Cervero et al., 2007; Shaheen et al., 2007; Martin et al. 2010).
Starting from the literature review, in the next paragraphs we will present the main characteristics of
typical CS systems (user profile, overall impact on mobility and environment).
3.1 Car sharing: demographic and travel characteristics of users
Academic researches and many experiences around the world evidence a series of common characteristics
for the typical car sharing user worldwide. Here we will report the main and common results (further
information can be found in the cited studies):
- Car sharing seems more attractive to men (Harmer and Cairns 2011, TCRP 2005, Loose 2010) even
if the number of female users has increased in the recent years;
- The user average age is comprised between 25 and 45 years old (TfL 2008, TCRP 2005, Huwer
2004, Muhr 2009);
- The majority of members are singles or live in small households (TCRP 2005, Cervero and Tsai 2003,
Martin and Shaheen 2010, Harmer and Cairns 2011, Loose 2010);
- Members are in general well educated people with median or higher than average income, cost
sensitive and environmentally conscious (TCRP 2005, Andrew and Douma 2006, Cervero et al. 2007,
Muhr 2009);
4 In the case of stated preference survey, the data obtained may not guarantee that respondents will actually behave
as they stated.

- Users live in location well served by public transportation and car sharing is seen as a mean to
increase members mobility, it is mainly used for recreation/social trips or for shopping related
purposes (TCRP 2005, Cervero and Tsai 2003);
- Trips frequency and average miles per year are quite low (less than 10 000 km) since members use
public transport for the majority of their trips (Haefeli and Matti 2006, TCRP 2005, Martin and
Shaheen 2010);
Moreover, other studies and surveys on CS evidence that members use public transport, bicycle and walk
much more than the general average population (this attitude is increased after joining a car sharing
program). In general, CS users rely on public transport for daily commuting trips (work and study reasons)
while CS is used for occasional trips mainly for leisure reasons (shopping, visit a friend, etc).
A recent survey in UK (Harmer and Cairns 2011) evidenced that the average frequency of use made by
active members is quite low (75% of the members hire a car up to 5 times a year) with a distance travelled
per trip up to 40 chilometres (64% trips). In Belgium, a survey on Brussels (Muhr, 2009) and another one on
the Wallonia Region (Muhr, 2010) evidenced that the majority of members use CS cars at most three times
per month mainly during their free time (for shopping, visiting someone or relaxing).
These results are similar to the Italian ones where, at the national level, the frequency of use of CS is about
1 run per member per month, with an average trip length of about 40 km and 6 hours in duration
(Mastretta, 2010a).
3.2 Impacts
Impacts of car sharing can be significant only within a context of a sound and integrated urban policy where
its complementary role to public transport could be stronger. Impacts can involve transport,
environmental, land use and social issues. Even if an agreed methodology for evaluating car sharing still
lacks, there is general agreement about some benefits entitled by car sharing that involve vehicle
ownership, travel behaviour changes and related impacts:
- Reduction in vehicle ownership5 (TCRP 2005, Martin and Shaheen 2010a, 2010b, Shaheen et al.
2008);
- Save transportation costs (Shaheen et al., 2008, Cervero et al. 2007, Barth and Shaheen 2002);
- Reduction in Vehicle miles or kilometres travelled (Cervero and Tsai 2003, Cervero et al. 2007, TCRP
2005, Shaheen and Choen, 2006, Koch. 2001);
- Increase in public transport use (TCRP 2005, Shaheen et al. 2008, Shaheen and Choen, 2006, Koch
2001);
- Reduction in pollutants emission (Martin and Shaheen 2010b);
- Reduction in parking spaces requirements (Sullivan and Magid 2007);
Regarding the effects on the number of vehicles removed from transport network per car sharing vehicle,
there are several estimates ranging from 6.8 (Cervero and Tsai 2003) to 10.8 (Lane, 2005) but considering
also the cars sold or not purchased, the number of cars taken off the streets could be nearly 20 (Harmer
and Cairns, 2011). Moreover, CS provides an incentive to minimize car use and at the same time it allows
low-income households (and students) to have access to a car on a pay as you use principle.
5 Both in terms of vehicles sold after joining car sharing than in terms of avoided car purchasing.

Concerning the decrease in pollution, the available data are mainly focused on CO2 reduction6 while data on
other pollutants more dangerous for health (PM10, PM2,5, NOx etc) are less common. In general, pollutants
reduction derives both from cars sold by the members7 and from the use of more efficient vehicles
8;
decrease in annual mileage may result also in a reduction of congestion9, crashes, energy use and parking
facility costs. Concerning the last point, parking spaces reduction has a wider impact since it could allow a
more efficient use of roadways and of urban spaces10
(that might result in more attractive overall layouts)
and, at the same time, it forces public authorities to implement and integrate fair and equitable parking
policies in order to favour the growth of CS services11
. The space freed by CS could be devoted, for
example, to non motorized modes or it could be used to reorganize square and street space in order to
improve the quality of life.
Finally, parking availability is also one of the most important issue perceived by CS users that should be
carefully implemented, since members want to easily pick up and return the vehicles without spending
time searching for a parking stall.
In Table 1, the results of some CS experiences are presented; even if the different studies do not use the
same indicators, we preferred to use these values just to provide an order of magnitude of the possible
impacts of CS initiatives.
6 Assuming a unitary external cost of 25€/ton (CE Delft, 2008), the annual savings, due to pollution reduction
determined by CS for the experience considered in Table 1, are less than 1 million euro per year.
7 Which in turn usually implies a reduction in VKT or VMT.
8 A survey among five UK car sharing organizations evidenced that CS vehicles “tend to be 26% more efficient in terms
of emission of CO2 per kilometer compared to the average UK car” (see Harmer and Cairns 2011).
9 With a reduction of the “searching for parking” time that contributes to the overall urban traffic problem.
10 Worldwide, there are several experiences aimed at encouraging low car developments (e.g. Bremen, Hammarby
Sjöstad, some cities in USA).
11 For further information concerning Car Sharing and Public Parking Policies see Shaheen et al.,2010.

STUDIES
VEHICLE OWNERSHIP REDUCTION AMONG MEMBERS (%) or
CARS TAKEN OFF THE ROAD PER CAR SHARING VEHICLE
REDUCTION IN MILEAGE
(or in %) INCREASE IN PUBLIC
TRANSPORT USE
POLLUTION
REDUCTION [per year] FOR SELLING A CAR
FOR AVOIDING PURCHASING A
CAR VKT VMT
Econsult Corporation
2010 (Philadelphia, USA) 15.3*
-17.3 Million
per year n/a -7k tons CO2
City Car Share (San
Francisco) -30%** -67%** -60k per day*** n/a -27k tons CO2***
Lane 2005 (Philadelphia,
USA) 10.8 12 n/a n/a n/a
Muhr 2009 (Brussels) 11 n/a On average 1 on 4
customers use more PT n/a
Muhr 2010 (Wallonia
Region) 15 n/a
On average 1 on 4
customers use more PT n/a
Rydén and Morin 2005
(Bremen)
-34% -17%
7 – 10 private cars off the road -45% +45 % -40 % in CO2
Rydén and Morin 2005
(Belgium)
-21% -14%
4 – 6 private cars off the road
-28% +28 % -40 % in CO2
IPR, 2009 (Italy) -63% 26,7% +14 % -8,8k tons CO2****
TfL, 2008 (London) -13% immediately before
joining
- 6% after joining
(=1,680 cars removed from
road)
-29%
(=2,250 potential cars
removed)
n/a +9% among members n/a
*Cars taken off the road for each PhillyCarShare’s 300 cars, **2004 Data, City car share press release January 2004 , ***2010 Data, City car share press release April 2011,
****Mastretta, 2010a
Table 1 - Impacts of considered car sharing initiatives.

4. THE ITALIAN CONTEXT
In Italy, car sharing has gained increasing importance in the last years thanks to the institution in October
2000 of a national co-ordination structure known as Iniziativa Car Sharing12
(ICS), promoted by the Ministry
of the Environment; the objective of this structure is to support municipalities in implementing local CS
services coordinated and integrated in a standardised operational scheme.
ICS support encompasses different aspects, ranging from financial support13
to the operation and service
related aspects (technology, marketing and communication, technical and legal consultancies, etc). In order
to provide a standard scheme for different cities, ICS imposes to its members a series of fixed
homogeneous standards regarding services, emissions and safety (ICS, 2003) in order to assure the
interoperability among the various operators in the different cities where CS is applied. CS organizations,
are responsible for site specific aspects on the supply side of the service (price policies and cooperation
with other mobility services companies, vehicles maintenance and cleaning, customer satisfaction, etc).
To date, there are twelve cities actively involved in ICS, as reported in Table 2.
CITY START UP CARS MEMBERS PARKING LOTS CORPORATE
ORGANIZATION
Bologna August 2002 39 1 146 31 LPT
Brescia February 2010 6 174 6 PS
Florence April 2005 22 815 21 PS
Genoa and
Savona*
July 2004, June
2009*
78 2 069 55 M
Milan September 2001 96 3 200 60 LPT
Palermo March 2009 36 476 41 LPT
Parma February 2007 18 403 12 P
Rome March 2005 107 2 073 61 P
Turin November 2002 119 2 590 85 M
Venice August 2002 47 3 389 11 P
Source: ICS website (February 2011 data) and Mastretta, 2010b.
LPT = Local Public Transport Agency, PS = Private subject, P = Public subject, M = Private-Public subject.
Table 2 - ICS car sharing organizations in Italy
The overall number of members is nearly 16 000 with 570 cars and 380 parking lots. Apart from the number
of members, the most important indicator, not always available, to evaluate the impact of CS is the number
of active members. In fact, since CS could be seen as a supplement to mobility habits, having only a
psychological function and being used very infrequently or for occasional events, it might not induce a
significant modification in members’ travel behaviour in the long run, making the impact of CS on urban
mobility nearly irrelevant.
In order to promote the use of CS services, municipalities could provide users with free access to Limited
Traffic Zones (LTZs), use of public transport reserved lanes, free parking in tolled areas in city centres;
12 For further information on ICS see http://www.icscarsharing.it
13 According to ICS, the breakeven point, from an economical point of view, with the ICS costs structure is over 40-50
cars with about a 30% use of the fleet (Mastretta, 2003).

moreover, since CS in Italy is mainly operated by Local Public Transport Companies, users can have a
discount on the annual fee if they have a public transport season ticket.
Figure 1 - ICS car sharing organizations in Italy
Notwithstanding all these incentives, car sharing in Italy still remains a niche product; a recent survey by IPR
Marketing for ICS financed by the Ministry of Environment (IPR 2009), tried to investigate both the
customer satisfaction among CS users, the level of knowledge and the propensity toward this alternative
mobility solution. The results of this study confirm the findings in literature (see paragraph 3) regarding the
user profile. In fact it emerges that the majority of users are well educated male (58% of respondents) living
in small households with one or zero car, using public transport every day (41% of CS users have a public
transport season ticket and 19% of them has purchased a season ticket simultaneously or after joining the
CS service). Annual mileage for CS users (around 11 000km/year) seems relatively low compared to average
national data (17 000km/year), moreover car are daily used only by a small percentage (35%) of CS
members (IPR 2009).
The main reason for joining CS is the absence of a car in the household (48% of respondents) followed by
the cost effectiveness of the service; the number of CS trips is quite low (less than 3 trips per months for
the majority of the users) while the average mileage per month is just around 50 km. As in other CS
experiences around the world, also in the Italian case, CS is mainly used for leisure reasons or for shopping,
while work related use is minor. The survey evidenced two elements that do not satisfy users’
requirements: parking (whose number and visibility should be improved) and tariffs and fines.
In the next section, four Italian experiences, namely Milan (deeper analysed), Turin, Genoa and Palermo
will be presented in order to bring a first contribution in literature (to be expanded in the next future) on
the state of the art of Italian car sharing.

5. RESULTS AND EFFECTS
In this subsection, we will shortly present some data for three Italian cities
Palermo (Caminiti, 2010b) and Genova
Due to the scarcity of available information, the significance of the data provided is quite low but in general
data seems similar to other European experiences both in terms of
following subsection the CS initiative in Milan will be analysed more in deep.
Population
Turin 907 090
Palermo 655 737
Genoa 607 906
Table 3 - Comparison among characteristics of the Italian cities of Turin, Palermo and Genoa
*data referred to April 2011, ** 2010 data
*data 2009
• 62% male
• 60% between 25 and 45 years old
• 50% employee
• 45% university education
• 70 % without a car
• 41% use regularly public transport
User Profile
• 6.4 hours/run (average)*
• 31 km/run (average)*
• 16.6 average runs per user**
• 20.2% time use of fleet (% on 24 hours) **
Service
• 59% between 30 and 49 years old
• lives in the city centreUser Profile
• 7.29 hours/run (average)*
• 54.3 km/run (average)*
• cars are used mainly during morning hours
Service
EFFECTS OF CS SERVICES IN SOME ITALIAN CITIES
, we will shortly present some data for three Italian cities - Torino
and Genova (Silvestri, 2010) - where CS has been introduced in the last years
Due to the scarcity of available information, the significance of the data provided is quite low but in general
data seems similar to other European experiences both in terms of user’s profile and use of CS.
following subsection the CS initiative in Milan will be analysed more in deep.
Extension (km2) Start Up Fleet
130 November 2002 119
158 March 2009 36
243 July 2004 78
Comparison among characteristics of the Italian cities of Turin, Palermo and Genoa
, ** 2010 data
62% male
60% between 25 and 45 years old
50% employee
45% university education
70 % without a car
41% use regularly public transport
6.4 hours/run (average)*
31 km/run (average)*
16.6 average runs per user**
20.2% time use of fleet (% on 24 hours) **
59% between 30 and 49 years old
lives in the city centre
7.29 hours/run (average)*
54.3 km/run (average)*
cars are used mainly during morning hours
CITIES
Torino (Orazzini, 2011),
has been introduced in the last years.
Due to the scarcity of available information, the significance of the data provided is quite low but in general
user’s profile and use of CS. In the
Parking Lots
85
41
55
Comparison among characteristics of the Italian cities of Turin, Palermo and Genoa
TURIN
GENOA
*our elaboration on Caminiti 2010a
Genoa slightly differs, since its users are mainly "family" and the average user is older compared to the
other two cases. Concerning the use of CS, available data confirm
of use of CS is very low, about 1 trip / month
hours in duration (Mastretta, 2010a); this result suggests
trips are not possible using public transport.
explained considering the results of a survey
2009). In fact, the survey evidences
the respondents states that they would share
the bond with their cars seems very strong, meaning that car is not seen just as a means of transport and a
status symbol, but also as a sort of extension of the space of their "intimacy" to prot
2009).
5.1 Milan car sharing
Milan has been a pioneer in Italy for car sharing since it had
service. The first one, Car Sharing Italia Ltd
environmental association “Legambiente” . The second car sharing organization,
was supported by the municipality of Milan and
Public Transport organization, ATM Group, took con
the other car sharing operator in Milan, Car Sharing Italia Ltd. To date,
provider in Milan offering an interoperable service in the ICS network.
GuidaMi is a two way service (i.e. car should be returned in the initial location) where users reserve the car
by internet or call centre, choosing the time and the pick
smart card then pick the keys in the car and start their t
bus lanes, moreover they can park for free on both
a form of non-monetary support to CS.
be reduced by 50% if member has a
the category of vehicle and considers
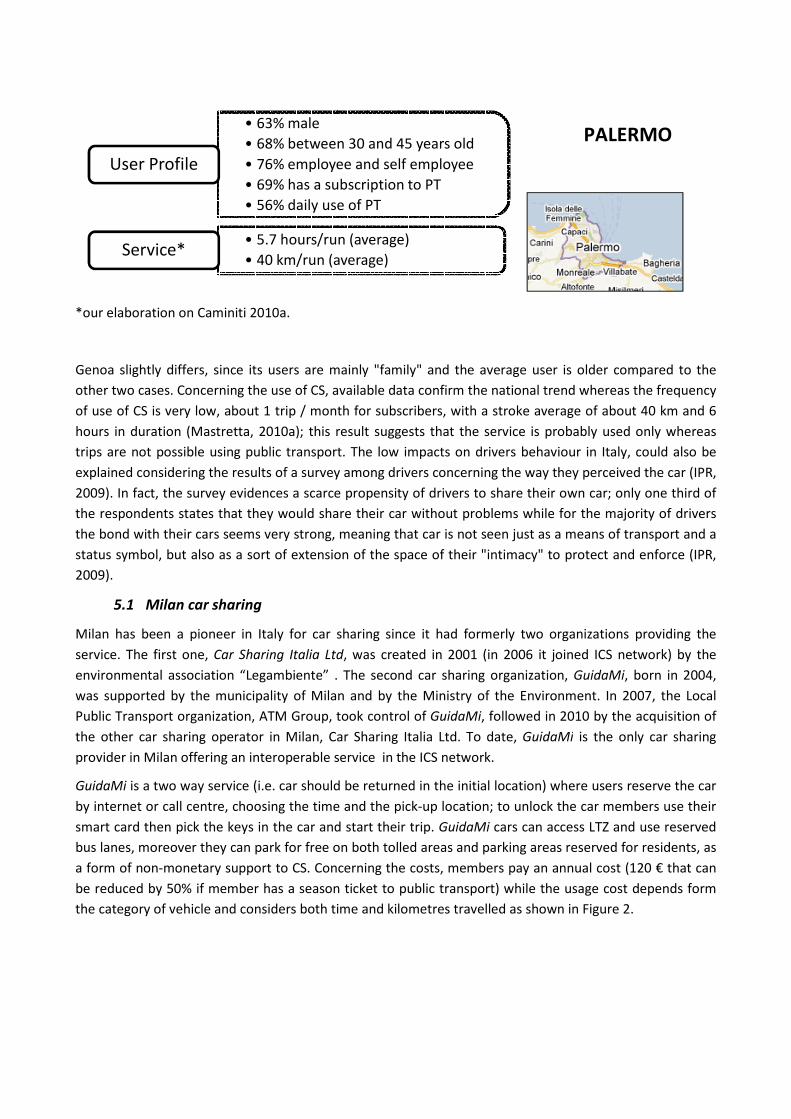
• 63% male
• 68% between 30 and 45 years old
• 76% employee and self employee
• 69% has a subscription to PT
• 56% daily use of PT
User Profile
• 5.7 hours/run (average)
• 40 km/run (average)Service*
a.
users are mainly "family" and the average user is older compared to the
Concerning the use of CS, available data confirm the national trend whereas the
about 1 trip / month for subscribers, with a stroke average of abou
hours in duration (Mastretta, 2010a); this result suggests that the service is probably used
trips are not possible using public transport. The low impacts on drivers behaviour in Italy, could also be
of a survey among drivers concerning the way they
s a scarce propensity of drivers to share their own car; only one
that they would share their car without problems while for the majority of drivers
the bond with their cars seems very strong, meaning that car is not seen just as a means of transport and a
status symbol, but also as a sort of extension of the space of their "intimacy" to prot
Milan has been a pioneer in Italy for car sharing since it had formerly two organizations providing the
Car Sharing Italia Ltd, was created in 2001 (in 2006 it joined ICS network) by th
environmental association “Legambiente” . The second car sharing organization,
was supported by the municipality of Milan and by the Ministry of the Environment. In 2007, the Local
Public Transport organization, ATM Group, took control of GuidaMi, followed in 2010 by the acquisition of
the other car sharing operator in Milan, Car Sharing Italia Ltd. To date, GuidaMi
interoperable service in the ICS network.
service (i.e. car should be returned in the initial location) where users reserve the car
, choosing the time and the pick-up location; to unlock the car members use their
smart card then pick the keys in the car and start their trip. GuidaMi cars can access LTZ and use reserved
bus lanes, moreover they can park for free on both tolled areas and parking areas reserved for residents,
monetary support to CS. Concerning the costs, members pay an annual cost (120
has a season ticket to public transport) while the usage cost
the category of vehicle and considers both time and kilometres travelled as shown in
63% male
68% between 30 and 45 years old
76% employee and self employee
69% has a subscription to PT
56% daily use of PT
5.7 hours/run (average)
40 km/run (average)
users are mainly "family" and the average user is older compared to the
the national trend whereas the frequency
troke average of about 40 km and 6
that the service is probably used only whereas
impacts on drivers behaviour in Italy, could also be
they perceived the car (IPR,
a scarce propensity of drivers to share their own car; only one third of
their car without problems while for the majority of drivers
the bond with their cars seems very strong, meaning that car is not seen just as a means of transport and a
status symbol, but also as a sort of extension of the space of their "intimacy" to protect and enforce (IPR,
two organizations providing the
, was created in 2001 (in 2006 it joined ICS network) by the
environmental association “Legambiente” . The second car sharing organization, GuidaMi, born in 2004,
Environment. In 2007, the Local
followed in 2010 by the acquisition of
GuidaMi is the only car sharing
service (i.e. car should be returned in the initial location) where users reserve the car
up location; to unlock the car members use their
cars can access LTZ and use reserved
tolled areas and parking areas reserved for residents, as
Concerning the costs, members pay an annual cost (120 € that can
to public transport) while the usage cost depends form
as shown in Figure 2.
PALERMO
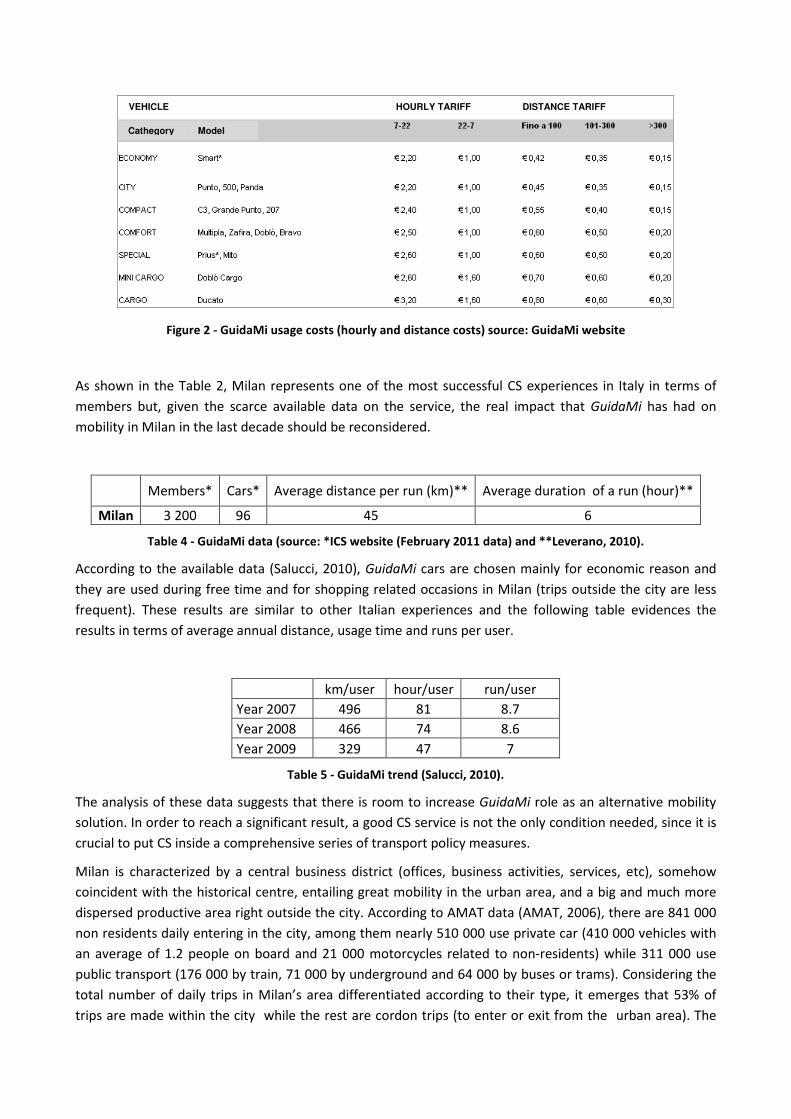
Figure 2 - GuidaMi usage costs (hourly and distance costs) source: GuidaMi website
As shown in the Table 2, Milan represents one of the most successful CS experiences in Italy in terms of
members but, given the scarce available data on the service, the real impact that GuidaMi has had on
mobility in Milan in the last decade should be reconsidered.
Members* Cars* Average distance per run (km)** Average duration of a run (hour)**
Milan 3 200 96 45 6
Table 4 - GuidaMi data (source: *ICS website (February 2011 data) and **Leverano, 2010).
According to the available data (Salucci, 2010), GuidaMi cars are chosen mainly for economic reason and
they are used during free time and for shopping related occasions in Milan (trips outside the city are less
frequent). These results are similar to other Italian experiences and the following table evidences the
results in terms of average annual distance, usage time and runs per user.
km/user hour/user run/user
Year 2007 496 81 8.7
Year 2008 466 74 8.6
Year 2009 329 47 7
Table 5 - GuidaMi trend (Salucci, 2010).
The analysis of these data suggests that there is room to increase GuidaMi role as an alternative mobility
solution. In order to reach a significant result, a good CS service is not the only condition needed, since it is
crucial to put CS inside a comprehensive series of transport policy measures.
Milan is characterized by a central business district (offices, business activities, services, etc), somehow
coincident with the historical centre, entailing great mobility in the urban area, and a big and much more
dispersed productive area right outside the city. According to AMAT data (AMAT, 2006), there are 841 000
non residents daily entering in the city, among them nearly 510 000 use private car (410 000 vehicles with
an average of 1.2 people on board and 21 000 motorcycles related to non-residents) while 311 000 use
public transport (176 000 by train, 71 000 by underground and 64 000 by buses or trams). Considering the
total number of daily trips in Milan’s area differentiated according to their type, it emerges that 53% of
trips are made within the city while the rest are cordon trips (to enter or exit from the urban area). The
VEHICLE HOURLY TARIFF DISTANCE TARIFF
Cathegory Model

majority of cordon trips are made by car with an higher degree of trips from municipalities included in the
first belt around Milan. It thus seems that, in this area, a stronger policy towards modal shift is needed to
boost the use of public transport.
Concerning the urban area, Milan faces strong parking problem due to double parking, other infractions
and inadequate drivers’ behavior in general14
; this problem influences mobility since double parking
contribute to the increase of congestion and compromise public transport reliability and speed (e.g. a car
could block trams or trolley buses path until it is removed from the street).
This facts make it clear that limited success of CS in Milan is for many aspects linked to a transport policy
which is still too weak. New parking policies based on a more complex pricing structure15
and on the strict
sanction of incorrect behavior with high fines and frequent controls, together with the improvement of
public transport in terms of frequency, comfort, reliability, clarity of information (also in real time) and
other more general measures might change the situation. On the other hand, the overall good service
provided by the local public transport (in particular thanks to the three underground lines), might reduce
the number of potential users that will continue to use PT for their daily movements, considering CS only
for occasional trips.
Also CS service, however, can still be improved a lot, for example through an increased capillarity of parking
locations or through the integration and collaboration of CS with other operators in the transport sector
(car rental companies, railways operators, etc.)
In order to fully benefit from the impacts of car sharing in Milan, all the problems here briefly summarised
should be faced since they can influence the impact and the potentiality of the service; in this perspective,
the likelihood of CS as an alternative solution would be evident and it will determine a significant shift in
urban contexts both in mobility and environmental terms. Finally since CS services and parking in Milan are
managed by the same entity, ATM Group, the combined strategies described above could be realistically
implemented.
6. WHAT’S IN THE FUTURE? PEER-TO-PEER CAR SHARING
We conclude this overview on car sharing with some considerations on a very promising alternative to
traditional car sharing that is getting importance worldwide: the so called peer-to-peer (P2P) car sharing. To
date there are several initiatives around the world16
, P2P car sharing represents an innovative form of both
service and business: it allows car owners to share their cars with other people when they are not using it,
in exchange of a monetary compensation. If expectations will be met, this should free a good potential of
cars standing still for 90% of their time, overcoming a series of obstacles often faced by traditional car
sharing (Hampshire and Gaite, 2010), in particular:
14 According to an estimate made by the Automobile Club Italia (May 2010), there are between 60 000 and 100 000
cars double parked every day in Milan.
15 For example introducing higher rates and shorter pricing periods at more convenient parking spaces (like on street
spaces and parking near building entrances) during peak hours in order to increase turnover and favor higher-priority
uses.
16 In USA there are some experiences such as RelayRides, GetAround, Go Op, Sprideshare, in France there are Buzzcar
and Cityzencar while other experiences like Whipcar (UK), Tamyca.de (Germany), or Drive My Car Rentals (Australia)
require that owner and borrower meet each other in order to swap the keys.

- by spreading car ownership through many owners, it should avoid the problem of bearing the initial
fixed cost of a new car fleet by a single investor;.
- it should need lower users per shared car to be financially viable (Hampshire and Gaite (2010)
estimated 10 users per car needed with respect to 25 for traditional car sharing);
- lower usage thresholds should make the service viable also in less dense areas, allowing a higher
geographic spread and capillarity of the service;
- usually P2P systems are conceived as a market themselves, tariffs owners propose to users are free,
so the system is more flexible in adapting to the real equilibrium between offer and demand.
Obviously, also many concerns exist on the actual viability of such a sharing system:
- people might not be willing to share their own car, seen as a personal and intimate object, or the
monetary compensation they require might be too high with respect to the willingness to pay of
potential users;
- owners might be scared of improper usage of their car by unknown users, and users might be
scared of unacceptable conditions (especially cleanliness) of shared cars. This problem might be
partially solved using a ranking system for owners and users, just like it happens on other P2P
services on the internet;
- especially in older cities in the EU, where considerable parking problems exist, it might be very
difficult for users to bring the car back to the place where the owner left it, or even in a reasonable
radius of distance;
- innovative insurance systems have to be developed in order to allow users, owners and possible
third parties to be properly protected;
- fiscal problems should be faced according to countries’ legislations.
P2P car sharing should provide the same benefits of traditional car sharing in terms of less propensity to
purchase new cars and to drive in general, with potential higher usage of public transport (second order
benefit). Moreover, even if P2P cars would probably be on average older (and thus more polluting) than
traditional car sharing vehicles, the service would use already existing resources, avoiding up and
downstream environmental costs embedded with new car production.
7. FINAL CONSIDERATIONS AND FUTURE POTENTIAL MARKET
The analysis of present car sharing services in Italy seems to show still potential for increase, both in its
classical form and in innovative forms, like peer-to-peer car sharing.
Italian total potential market for CS is estimated at about 170 000 users, with a value of about 60 to 70
million € per year (Mastretta, 2010a). The final result will be largely influenced by mobility policies that
both the national government and municipalities will introduce in the future. First of all, a legislation
concerning car sharing is needed in order to promote the involvement of private initiatives, through simple
and clear procedures to activate the service that also ensures minimum guaranteed characteristics to
citizens and users. Considering that drivers show a scarce propensity towards “sharing”, mobility policies
should evidence the advantages, both in economical and practical terms, offered by CS with respect to
private car trying to promote a cultural change, shifting the idea of the car as a “service” rather than as a
“good”.

Finally, the analysis of CS organizations also evidence that, to date, an important market such as business
fleet market (Shaheen 2007b), it is not adequately served. Assuming that in business fleet we can include
both the fleet of medium firms, that need cars for employees’ daily activities, and also small business
activity that need a car seldom on a random basis (e.g. professional offices, small enterprises, etc), it
emerges that the potential of this market is not negligible at all17
. In order to bridge this market space, CS
organizations could assist companies in the analysis of car fleets and their mobility needs, offering the
introduction or replacement of CS vehicles in their fleet. CS organizations could even provide the entire
fleet to the companies offering an all-inclusive service18
(like the Swiss operator Mobility Car Sharing
through the Mobility Business service); companies will still pay on a hourly basis plus a pre-paid cost per
kilometre while companies’ CS cars will enjoy CS benefits like access to the LTZ , to reserved lanes and free
parking on the tolled areas. This solution could help companies to more efficiently manage their fleet
reducing costs.
To reach all these objectives, policies should be concentrated on an improved and integrated public
transport system (in terms of reliability, frequency, partnership with other transport operators) and on the
control of road infractions oriented at modifying drivers behavior; in this prospective, CS could play an
important role as a complementary solution to urban mobility needs.
REFERENCES
AMAT (2006), “Strategia per la mobilità sostenibile al fine della tutela della salute e dell’ambiente Milano
2006-2011” , Milan November 2006.
Andrews, J. and Douma, F. (2006), “Developing a model for carsharing potential in Twin Cities
neighborhoods”, Compendium of Papers for the 85th Annual Meeting of the Transportation Research
Board.
Barth M. and Shaheen S. (2002), “Shared-use vehicles systems: framework for classifying carsharing, station
cars and combined approaches”, Transportation Research Record, Vol. 1791, p. 105-112.
Bergmaier R., Mason C., McKenzie M., Campbell S. and Hobson A. (2004), “Car Sharing: An Overview”,
Australian Government, Canberra.
Caminiti D. (2010b), “Il Servizio di Car Sharing nell’ambito del sistema di mobilità metropolitana del
Comune di Palermo”, presentation at the workshop Il ruolo del Car Sharing per un’offerta integrata dei
servizi di Trasporto Pubblico Locale, Rome 12 October 2010.
Caminiti D. (2010a), “Il Servizio di Car Sharing nell’ambito del sistema di mobilità metropolitana del Comune
di Palermo”.
CE Delft (2008), “Handbook on estimation of external costs in the transport sector”, Produced within the
study Internalisation Measures and Policies for All external Cost of Transport (IMPACT), Version 1.1. Delft
(The Netherlands).
17 In Germany (DB Rent GmbH) and Switzerland (Mobility Car Sharing) business customers represent an essential
market share (Momo, 2009).
18 Including insurance, maintenance, service support, cleaning, etc.

Ciari F., Balmer M. and Axhausen K.W. (2009), “Concepts for Large-Scale Carsharing System: Modeling and
Evaluation with Agent-Based Approach”, Paper presented at the 88th Annual Meeting of the
Transportation Research Board, Washington, D.C., January 2009.
Cervero R. and Tsai Y.H. (2003), “San Francisco City CarShare: Second-Year Travel Demand and Car
Ownership Impacts”, IURD Working Paper Series.
Cervero R., Golub A. and Nee B. (2007), “City Carshare: Longer-Term Travel Demand and Car Ownership
Impacts.” Transportation Research Record: Journal of the Transportation Research Board, No. 1992.
Transportation Research Board of the National Academies, Washington DC (2007): 70–80.
Duncan M. (2010), “The Cost Saving Potential of Carsharing in a US context”, Transportation, Vol. 38, No. 2,
pp. 363-382.
Econsult Corporation (2010), “The economic and environmental impact of Phillycarshare in the Philadelphia
region”, Final Report, February 15, 2010.
Haefeli U. and Matti D. (2006), “Evaluation Car-Sharing”, Bundesamt für Energie BFE.
Hampshire R. and Gaites C. (2010), “Peer-to-peer car sharing: market analysis and potential growth”, paper
presented at 90th Transportation Research Board Annual Meeting 2011, Paper 11-3463.
Harmer C. and Cairns S. (2011), “Carplus annual survey of car clubs 2010/11”, Transport Research
Laboratory, Published Project Report PPR567, Final Draft.
ICS (2003), “ICS Project – The state of the art”, Bucarest 30 June 2003.
IPR (2009), “Servizio Car Sharing del circuito nazionale indagine di custode satisfaction presso gli utenti,
privati ed aziende e di notorietà e di interesse presso il target potenziale. Report di Ricerca”, research
financed by the Ministry of Environment.
Koch, H. (2001), “User needs report”, MOSES (Mobility Services for Urban Sustainability) Project –
Workpackage 2.2, European Commission, DG TREN. University of Bremen. 2001. pp. 22-24.
Lane, C. (2005.), “PhillyCarShare: First-Year Social and Mobility Impacts of Carsharing in Philadelphia”,
Pennsylvania. Transportation Research Record: Journal of the Transportation Research Board, 1927, pp
158-166.
Leverano A. (2010), “Il car sharing come parte integrante del servizio di Trasporto Pubblico Locale”,
presentation at the workshop Il ruolo del car sharing per un'offerta integrata di servizi di tpl, Rome 12
October 2010.
Loose W. (2010), “The State of European Car-Sharing”, Project Momo Final Report D 2.4 Work Package 2.
Martin E. and Shaheen S.A. (2010b), “Greenhouse Gas Emission Impacts of Carsharing in North America”,
MTI Report 09–11, Mineta Transportation Institute, San Jose, California, US.
Martin E., Shaheen S.A. and Lidicker, J. (2010a), “Impact of Carsharing on Household Vehicle Holdings”
Transportation Research Record, Vol. 2143, pp. 150-158.
Mastretta M. (2010a), “Il car sharing in Italia”, presentation at the workshop La diffusione del Car Sharing
negli enti locali: prospettive di sviluppo, Genova 4 February 2010.
Mastretta M. (2010b), “I benefici dell’integrazione tra car sharing e tpl”, presentation at the workshop Il
ruolo del car sharing per un'offerta integrata di servizi di tpl, Rome 12 October 2010.
Momo Project (2009), “Business Car Sharing”, Car Sharing Fact sheet No. 4.

Muhr E. (2009), “Report Customer Survey Car-Sharing Brussels”, Project MOMO Grant agreement No.:
IEE/07/696/SI2.499387.
Muhr E. (2010), “Report survey on satisfaction of Cambio clients in Wallonia”, : Project MOMO Grant
agreement No.: IEE/07/696/SI2.499387.
Orazzini F. (2011), “Car City Club”, presentation at the workshop Momo Project Car Sharing Evaluation
Workshop, Rome 6 June 2011.
Salucci F. (2010), “Il progetto milanese di integrazione tra car sharing e Tpl”.
Shaheen S. (2001), “Carsharing in the United States: Examining Market Potential”, ITS World Congress,
Sydney, Australia, October 2001.
Shaheen S. and Martin E., (2006) “Assessing Early Market Potential for Carsharing in China: A Case Study of
Beijing”, Institute of Transportation Studies, University of California, Davis, Research Report UCD-ITS-RR-06-
21.
Shaheen S. A., Cohen A.P., Roberts J. D. (2007a), “Carsharing in North America: Market Growth, Current
Developments, and Future Potential”, Transportation Research Record 2006 (1986), 116 – 124.
Shaheen S. A., Cohen A. P. (2007b), “Growth in Worldwide Carsharing: An International comparison”,
Transportation Research Record 1992, 81 – 89.
Shaheen S., Cohen A. P. and Chung M. (2008), “North American Carsharing: A Ten-Year Retrospective”,
Institute of Transportation Studies, University of California, Davis, Research Report UCD-ITS-RR-08-38.
Shaheen S., Rodier C., Murray G., Cohen A., Martin E. (2010), “Carsharing and Public Parking Policies:
Assessing Benefits, Costs, and Best Practices in North America”, Mineta Transportation Institute, Report 09-
09.
Silvestri M. (2010), “Il car sharing a Genova e Savona”, presentation at the workshop Il ruolo del Car Sharing
per un’offerta integrata dei servizi di Trasporto Pubblico Locale, Rome 12 October 2010.
Synovate (2007), ”Attitudes towards Car Clubs”, research prepared for Transport for London.
Sullivan E., and Magid L. (2007), “Bringing Car Sharing to Your Community – Long Guide”, San Francisco:
City CarShare.
Transit Cooperative Research Program TCRP (2004), “Car sharing – Where and How it succeeds”, TCRP
Report 108 published by the Transportation Research Board Washington DC, USA.
Transport for London (2008), “Car Club Strategy”, TfL Group Publishing.
VTPI (2010), “Car Sharing. Vehicle Rental Services That Substitute for Private Vehicle Ownership”, TDM
Encyclopedia, Victoria Transport Policy Institute.