Munich Personal RePEc Archive - [mpra.ub.uni … · Munich Personal RePEc Archive Is the adoption...
28
Munich Personal RePEc Archive Is the adoption of Strategic Management Accounting techniques really “strategy-driven”? Evidence from a survey Lino Cinquini and Andrea Tenucci Scuola Superiore Sant’Anna, Scuola Superiore Sant’Anna June 2007 Online at http://mpra.ub.uni-muenchen.de/11819/ MPRA Paper No. 11819, posted 3. December 2008 06:26 UTC
-
Upload
phungtuong -
Category
Documents
-
view
216 -
download
0
Transcript of Munich Personal RePEc Archive - [mpra.ub.uni … · Munich Personal RePEc Archive Is the adoption...

MPRAMunich Personal RePEc Archive
Is the adoption of Strategic ManagementAccounting techniques really“strategy-driven”? Evidence from asurvey
Lino Cinquini and Andrea Tenucci
Scuola Superiore Sant’Anna, Scuola Superiore Sant’Anna
June 2007
Online at http://mpra.ub.uni-muenchen.de/11819/MPRA Paper No. 11819, posted 3. December 2008 06:26 UTC

1
MAR 2007 - COST AND PERFORMANCE IN SERVICES AND OPERATIONS
TRENTO (ITALY) JUNE, 18-20 2007
Is the adoption of Strategic Management Accountingtechniques really “strategy -driven”?
Evidence from a survey
Lino Cinquini & Andrea Tenucci
Scuola Superiore Sant’Anna Piazza Martiri della Libertà, 33
56127 Pisa - ItalyPh.: +39 050 883320Fax: +39 050 [email protected]@sssup.it

2
Is the adoption of Strategic Management Accountingtechniques really “strategy -driven”?
Evidence from a survey
Abstract:Several different approaches to Strategic Management Accounting (SMA) can
be found in the literature of management ac counting since Simmonds (1981) coined theterm. However, there is a little survey research about SMA practice, with the exceptionof the studies of Guilding et al. (2000) and Cravens & Guilding (2001).
The paper aims to enrich the fragmented knowledge on t he topic by acontingency research study based on an internet questionnaire survey on Italiancompanies. The study focuses on the characteristics at the heart of SMA techniques thatmay help in classifying and grouping them and on the investigation of vari ables thatmay influence/explain the use of SMA techniques within companies. Company size,industry and strategy (in the sub -dimensions of pattern, mission and positioning) are thevariables considered in the exploration.
The findings reveal that SMA techn iques appear to be extensively used.Attribute costing, Customer accounting, Strategic Pricing and Competitive PositionMonitoring represent the most widely used SMA techniques. Four features of thepattern of Strategic Management Accounting practice emerg e clearly from the factoranalysis: competitor, long run, process and customer orientation. In the correlationanalysis only strategic positioning is weakly found to play a contingent role in SMAtechnique usage, while strategic pattern, strategic mission, company size and industryvariables do not provide any results. Such a finding reveal that, surprisingly, SMAtechniques adoption doesn’t seem to be “strategy -driven”.
Keywords:
Strategic Management Accounting; Strategy
Acknowledgments: The authors are grateful to Falconer Mitchell, Hanne Nørreklit and
Frank Selto for their valuable comments and suggestions. Thank are also due to the
participants of the “5 th Conference on New Directions in Management Accounting:
Innovations in Practice and Research” h eld in Brussels on December 14 -16, 2006 who
commented the presentation of this paper.

3
INTRODUCTION
Since the 80s a new term has been coined in management accounting literature:“Strategic Management Accounting” (SMA) (Simmonds, 1981). Since then an ongo ingdebate about what SMA comprises has been originated. It is well accepted that SMA isidentified as a generic approach to accounting for strategic positioning (Roslender &Hart, 2003). This wide definition leaves unsolved the problem of defining what isintended with the term “SMA techniques”.
In accounting literature the “external” orientation of Strategic ManagementAccounting is well established. However it can be interpreted in different ways. Firstlyit can be referred to as “competitors”. Simmonds (1981) developed a conceptualframework underlying the importance of competitor information (related to cost, prices,market share and so on) in developing and monitoring business strategy. Later, variousauthors recognized the value that competitor infor mation plays in achieving acompetitive advantage (Jones, 1988; Bromwich, 1990; Ward, 1992; Moon & Bates,1993). Secondly, the term “external” can be referred to as “suppliers and customers”. Ina value chain perspective Shank & Govindarajan (1993b) widely demonstrated theusefulness of external information that enable the company to fruitful exploit linkageswith suppliers as well as customers. Ultimately “external” can be referred to the“market”. It means focusing on the product offer to satisfy customer s needs but takingcare in the meantime of the product attribute costs (Bromwich, 1990). Moreover it ispossible an interpretation as satisfaction of customers needs by achieving a desiredtarget profit/cost (Monden & Hamada, 1991; Morgan, 1993; Ewert & Er nst, 1999) orperformance (Narver & Slater, 1990). In general, it has been argued that the “strategic”characteristic embraces those practices highlighting an external or future focus (Cravens& Guilding, 2001; Guilding et al., 2000; Roslender & Hart, 2003).
Recently the relationship between strategy and management control systems(MCS) has also been an issue widely explored. The interest in the topic has beengrowing since the 1980s, when strategy began to be considered as a contingent variable;surveys and case studies started to investigate the connection between particularelements of the MCS and the specific strategy adopted by the firms (Miller & Friesen,1982; Govindarajan & Gupta, 1985; Simons, 1987 and 1990; Govindarajan, 1988;Shank & Govindarajan, 1992a; Bruggeman & Van der Stede, 1993; Chenhall &Langfield-Smith, 1998). All of these studies adopted a contingency theory approach tothe research.
The proclivity in these types of research is to analyse strategy from the businesslevel; the most widely discussed problem regards the generic constructs of strategy(Miller & Dess, 1993; Kotha & Vadlamani, 1995; Chenhall & Langfield -Smith, 1998;Bouwens & Abernethy, 2000; Chenhall, 2005a). In general, there are four differentclassifications of business s trategy accepted and used in most of this research. We referto Miles & Snow (1978), Porter (1980, 1985), Miller & Friesen (1982) and Gupta &Govindarajan (1984).
The schemes of Miles & Snow (1978), Porter (1980, 1985) and Gupta &Govindarajan (1984) have attracted most attention. Each of the classification turns outto be very useful in conducting empirical research regarding the relationship betweenstrategy and management accounting/control systems, because it is possible to clusterfirms with (apparently) homogeneous features. However these research studies have notgenerated comparable findings because of the different paths adopted inoperationalizing business strategy. The main reason for this, according to Langfield -Smith (1997: p. 212), lies in the different scope and focus used by these typologies. In

4
seeking to integrate the dimensions of strategy Shank & Govindarajan (1992a) foundsome consistent fit between Porter’s classification and that of Gupta & Govindarajan.They observed that companies pur suing a differentiation and a build strategy faced thesame environmental uncertainty; similar considerations could be developed for costleadership and hold mission follower. A few years later Langfield -Smith (1997), andthen Kald et al. (2000), sought to integrate all the three mentioned classifications; theyproposed a series of viable combinations among them that needed empirical research tobe validated.
Some contingent studies have tested the relationship between strategy, MCS andperformance (among the others see Simons, 1987; Govindarajan & Fisher, 1990;Chenhall & Langfield-Smith, 1998); but many authors call for research into the rolestrategy might play also in accounting system design (Dent, 1990; Chapman, 1997;Langfield-Smith, 1997; Chenhall, 2005b; Langfield-Smith, 2005).
In recent years such approaches have influenced research conducted around thefactors affecting SMA techniques implementation (Cravens & Guilding, 2001; Guildinget al., 2000; Cadez, 2006), confirming the increasing interest on the assessment of theextension of their use within companies and the factors affecting it.
This research addresses this topic, aiming at extending previous results aroundthe fundamental question of the “drivers of choice” of SMA techniques into compa nies.The issue is relevant, due to the wide range of approaches available to SMA and theconsequent need of orientation by managers in choices related to the adoption of atechnique in a specific company setting.
Therefore the paper, based on a survey of a sample of Italian large-medium sizemanufacturing companies, aims at contributing to the research debate around thefeatures of Strategic Management Accounting to be found in the real world and thefactors influencing the implementation and use of SMA te chniques. The resultsconcerns the focussing on characteristics at the heart of SMA techniques - stemmingfrom their contents – that may help in classifying and grouping them and theinvestigation of variables that may influence/explain the use of SMA tec hniques withincompanies. The variables include company size, sector and strategy.
This last variable, widely adopted in MCS studies as mentioned, is new withrespect of contingent studies about SMA and its consideration. It may help in exploringthe selectivity in techniques adoption by different firms and its consideration gives ananswer to a fundamental research question: “Does SMA techniques adoption differ withregard to different strategies adopted?”.
Summing up, two main research questions are pos ited in the paper: what are thedistinctive features/orientation of SMA techniques that can help in grouping themcoherently? To what extent the adoption can be explained by variables such as strategy,company size and industry? In particular, strategy has been studied as a variableaffecting the design of Management Accounting or Management Control systems; forthis reason we could reasonably expect that it will be even more critical in the design ofStrategic Management Accounting systems.
The paper follows this structure: in the first part a brief review of the ways usedto operationalize strategy is conducted and a description of the adopted research modelis provided. It also contains an explanation of the strategic management accountingtechniques included in the research. The second section is dedicated to the empiricalstudy: the research method adopted, the variable measurement and the results are

5
presented. Finally, the main findings of the study and some limitations and conclusionsare discussed.
1. THE THEORETICAL APPROACH: CONTINGENCY THEORY AND SMA
1.1. Operationalization of Business strategy in contingency research
Empirical contingency research has widely adopted different “typologies” asclassifications of strategy. In particular, as mentioned, th e schemes of Miles & Snow(1978), Porter (1980, 1985) and Gupta & Govindarajan (1984) have mainly attractedattention when referring to business -unit strategy. In their original version the threeclassifications perform unique aspects and represent differe nt business strategydimensions. Also Langfield -Smith (1997: p.212) underlines that each strategyclassification holds different characteristics related to scope and focus (in particulardefender/prospector distinction presents a broader scope than the oth ers). Eachclassification will now be briefly presented and discussed with respect to the concerningstrategic element.
Miles & Snow (1978) consider that management has to face three types ofproblem: the entrepreneurial (the strategic management of produc t and markets), thetechnological (the production and distribution of products) and the administrative one(the organization to support the entrepreneurial and technical decisions). When theseproblems are solved in a successful manner, a stable strategic pattern is identified.Within this path three typologies according to their rate of change in product or marketare shown1. Prospectors mainly compete through product innovation, offer a wideproduct range and are considered pioneer in product and market a rea. Marketing andResearch & Development are the principal functions in these organizations. Defenders,on the other hand, operate in a relatively stable environment and offer a narrow productrange. They focus on efficiency, so they prefer production and engineering functions.Analysers combine features of the previous typologies because they compete in a twotype of product-market domain; one is more stable so, as defenders, they concentrate onefficiency, while the other is more dynamic so, as prospecto rs, they contrast competitorsthrough product innovation.
Gupta & Govindarajan (1984) adopt a life -cycle approach using the concept ofstrategic mission (or portfolio strategy). According to life -cycle stage in which themarket and product match each other , the company will prefer one mission or anotherone. Gupta & Govindarajan describe four strategic missions depending on the balancebetween the objectives of market -share growth and short-run profit maximization. Buildstrategy aims to increase market sha re and competitive position, even at the expense ofshort term earnings and cash flow. Harvest strategy aims at maximising short termearnings and cash flow rather than improving market share. Hold strategy finds itself inthe middle between the previous c onfigurations and divest strategy implies the choice toend the activity.
Ultimately, Porter (1980, 1985) distinguishes three generic strategies that allowthe company to achieve a sustainable competitive advantage. Cost leadership implies toobtain the lowest cost relative to the competitors; it is possible by exploiting theeconomies of scale and scope and reaching a superior technology that grant a low cost.
1 The authors describe another type of organization: reactor. It is not considered because it seems not tobe a “successful” type in the sense that it does not present a stable strategy -structure relationship.

6
The differentiation strategy focuses on providing products that are perceived to beunique by the customers. This is possible offering superior quality, customer service,brand image and so on. The sources of this advantage could be: brand loyalty, productdesign, after-sale services and retail facilities. The focus strategy implies to compete in aspecific market segment through either cost leadership or differentiation.
Summing-up, each typology presents its own characteristics.Prospector/Defender regards the rate of change in product and markets. Build/Harvestconcerns the strategic mission. Differ entiation/Cost leadership relates to the way thecompany decide to compete in the market.
Various criticisms have been made about the way in which a researcher decideto operationalize strategy but, as noted by Weick (1979), the research process involvesinevitable trade-offs among generalizability, accuracy, and simplicity. It only dependson the aims of the research. In their simplicity, these typologies could be very usefulbecause each of them underlines a particular aspect of the business -unit strategy,however they will become more useful if a clear connection among them will be traced.In general, the aim of research using typologies concerns the generalizability of resultsmore than the accuracy of the classification. Several studies criticise the va lidity of thetypologies in contemporary contexts because they had origins in the 80s (Shortell &Zajack, 1990; Kotha & Vadlamani, 1995). They mainly contest that strategy became acomplex and variable factor in the last years. Upon this point, we suggest that bycombining the presented typologies it will be possible to recast the multidimensionalnature of strategy: a way to study the complexity of strategy could be to combine (andthen integrate) the three mentioned typologies, instead of creating new one s. In this waythe limits of each classification could be mitigated in a renewed framework (Langfield -Smith, 1997). This does not mean that all the weaknesses in strategy operationalizationwill be solved, but it could contribute to reduce them. The multid imensional nature ofstrategy, the difference between intended and realized strategy, the difficulty ofcommunicating the significance of typologies to managers and the recognition ofstrategy as an ongoing development process, all represent weak elements inoperationalizing strategy underlined by Langfield -Smith (1997: p.127).
1.2. SMA and Contingency Theory in the Research Model performed
Normally, the development and use of SMA techniques is linked to the issue ofthe need for external information to face t he uncertainties of environment and to supportstrategic decisions. The growth of research in SMA is rooted in the basic considerationof the increasing relevance of information outside the boundaries of the firm: Simmonds(1981) and Bromwich (1990) highli ghted the external focus of SMA and furtherresearch has been consistent with this premise.
Only in recent years, however, research in this field has highlighted thecontingent factors underpinning the implementation and use of SMA: assessingcontingent variables linked to the adoptions of competitor -focused accounting (CFA)techniques Guilding (1999) found a significant relationships between CFA andcompetitive strategy, strategic mission and company size; competitive strategy wasderived by Miles and Snow’s (1978) prospector/defender typologies, while strategicmission was measured using Govindarajan & Gupta’s approach (1985); in exploring therelationship between SMA usage and competitive strategy Cravens & Guilding (2001)used eight sub-dimensions based on Porter (1985: R&D, product quality, producttechnology, product range, service quality, price level, advertising expenditure level,

7
market coverage) and significant relationships were found with R&D and breath ofmarket coverage; Guilding & McManus ( 2002) explored the use of CustomerAccounting (CA) techniques and their findings suggested a greater incidence of CApractices and a positive relation between competition intensity (measured by scale ofperceived intensity related to selling and distribut ion, quality and variety of products,price, market share and customer service) and market orientation.
In these research studies, only some of the aforementioned dimensions ofstrategy (pattern, mission and positioning) – or completely different ones as i n Cravens& Guilding (2001) - have been considered and operationalized in the contingency modeladopted; none of them assumed the framework of Langfield -Smith. In this research thevariables concerning business strategy have been operationalized in terms of pattern,mission and positioning in order to provide a wider framework of this variable that issupposed to be the main driver of SMA techniques adoption (strategy). In addition,company size and industry have been considered in the model as variables a ffecting theuse of SMA techniques.
The definition of SMA techniques derives from the literature, in particular theyrepresent an elaboration of Cravens & Guilding’s study (2001); according to theexternal orientation, fourteen SMA techniques have been ide ntified2:
Activity Based Costing/Management (ABC/M) . The technique is based on thedefinition of the activities performed by the company; they are considered the ultimatecauses of indirect costs (Cooper et al., 1992). ABC strategic focus consists in themanagement of the activities through which it is possible to define actions aiming atachieving a competitive advantage (Palmer, 1992; Shank and Govindarajan, 1989).
Attribute Costing. It considers products as a bundle of different features; in thisvein, Bromwich (1990) suggests product attributes can be viewed as cost objects. Theattributes differentiate the products, and from the contact between product attributes andconsumers’ taste the market share is determined. In this sense it can be interpreted theexternal (market) orientation of the technique.
Benchmarking. The technique involves identifying the best practices andcomparing the organization's performance to those practices with the goal ofimprovement. There are many types of benchmarking ( Mi ller et al., 1992; McNair &Leibfried, 1992) but, in general, they underline the external strategic orientation towardcompetitors.
Competitive Position Monitoring. The technique is constituted by the provisionof competitor information. These include sal es, market share, volume and unit costs(Simmonds, 1981). Basing on the information provided, the company is able to assessits own position relative to main competitors and, consequently, control or formulate itsstrategy.
Competitor Cost Assessment . In contrast to the previous technique, Competitorcost assessment concentrates uniquely on cost structures of competitors (Simmonds,1981). There can be different sources of such information. Ward (1992) suggests someindirect sources like physical observatio n, common suppliers or customers and ex -employees of competitors.
2 Compared to Cravens & Guilding’s (2001) study it was decided not to consider Brand valuationbudgeting and monitoring, but to include Customer accounting.

8
Competitor performance appraisal based on public financial statements . Arelevant source of competitors evaluation is constituted by public financial statements.Moon & Bates (1993) underline the strategic insights that it is possible to obtain fromthis type of analysis. The technique, which represents an elaboration of common andtraditional methods, finds a strengthness in today’s evolution of IASB that could permita simpler comparison between companies of different countries.
Customer Accounting. The technique considers customers or group of customersas unit of accounting analysis (Bellis -Jones, 1989; Guilding & McManus, 2002).Customer accounting includes all the practices directed t o appraise profit, sales or costsderiving from customers or customer segments. Because it is widely related with“relational marketing”, this accounting approach is classified as a SMA technique.
Integrated Performance Measurement . The consideration of both financial andnon-financial measures defines an Integrated performance measurement system (Cross& Lynch, 1989; Nanni et al., 2002). Balanced Scorecard belongs to this class, and itsrole in strategic management cycle is apparent through the four persp ectives (Kaplan &Norton, 1996a, 1996b, 2000; Malina & Selto, 2001).
Life Cycle Costing. It aims at calculating the total cost of a product throughoutits life cycle (from the design to the decline, through introduction, growth and maturity)(Berliner & Brimson, 1988; Shields & Young, 1991;Wilson, 1991). It’s clear long termaccounting perspective and market orientation make it part of the group as SMAtechniques. In a similar vein, Total Cost of Ownership has been underlined as a longterm and strategic orientation SMA tool (Ellram & Siferd, 1998).
Quality Costing. Product quality has become a precondition to compete in themarket. This technique classifies and monitors costs as deriving from qualityprevention, appraisal, internal and external failures ( Heagy, 1991). Modern competitionrequires also the monitoring of safety and environmental costs. In a strategicperspective, the technique must support the pursuit of quality (Simpson & Muthler,1987; Carr & Tyson, 1992).
Strategic Costing. According to Shank & Govindarajan (1989, 1993a, 1993b)costing systems are progressively getting into the strategic management process. Itmeans that costing systems must explicitly consider strategy and the pursuit of long -term competitive advantage. The authors underl ine the marketing and competitiveconcepts to which the technique refers (product positioning and market penetration).
Strategic Pricing. Simmonds (1982) describes this pricing technique. Its focus ison the use of competitor information, like competitors ’ reactions to price changes, priceelasticity, economies of scale and experience, in the pricing process.
Target Costing. According to the technique, a target cost results from thedifference between the product price, derived from how much the market is willing topay, and a desired target profit. Through an accurate product design, the costs must becontained to achieve the target cost (Monden & Hamada, 1991; Morgan, 1993).External market factors intervene frequently in this SMA technique.

9
Value Chain Costing. Developing the value chain model (Porter, 1985), Shank& Govindarajan (1992b) propose an approach to accounting that considers all theactivities performed from the design to the distribution of the product. The strategicimplications regard the exploiting of the economies and efficiencies deriving from theexternal linkages between the company and both suppliers and customers.
The scheme of the research model is depicted in Figure 1.
Figure 1 – Research Model
CONTINGENT
VARIABLES→ SMA TECHNIQUES
ADOPTION
Strategic Pattern
Strategic Mission
Strategic Positioning
Company size
Industry
→
ABC/M
Attribute Costing
Benchmarking
Competitive Position Monitoring
Competitor Cost Assessment
Competitor Performance Appraisal on
public financial statements
Customer Accounting
Integrated Performance Management
Systems
Life Cycle Costing
Quality Costing
Strategic Costing
Strategic Pricing
Target Costing
Value Chain Costing
A first general hypothesis pertain to the whole SMA techniques adoption. It isexpected that depending on the strategic orientation and the specific companycharacteristics, specific SMA techniques will be selected. This means that c ompanies donot indifferently adopt SMA techniques.
The investigation around the variables influencing SMA se lection and adoptionhas been based on some hypotheses. These are treated in relation to each contingentvariable:
Strategic Pattern (Prospector vs. Defender – Miles & Snow, 1978):Guilding (1999) underlines the more external (strategic) orientation of
“prospector” compared with “defender” in studying Competitor -focus Accountingtechniques. In this way we could expect that ( Hp. 1): SMA techniques usage rate ishigher in “prospectors” than in “analysers” or “defenders”.

10
Strategic Mission (Build vs. Harvest – Gupta & Govindarajan, 1984):Guilding (1999) found a weak, although positive and statistically significant
relationship between “build” and competitor -focus accounting usage rate. For thisreason the following hypothesis is formulated ( Hp. 2): SMA techniques usage rate ishigher in “build” than in “hold” or “harvest”.
Strategic Positioning (Differentiation vs. Cost Leadership – Porter, 1980,1985):Shank & Govindarajan (1992a) argued that “cost leadership” companies use
mainly traditional costing system s anyway in the meantime competitors (cost) analysiswould be useful. In the opposite way, the authors underline that “differentiation”companies would pay attention to marketing and differentiation costs. For this reasonwe could expect that (Hp. 3): SMA techniques usage rate is, in general, higher in“differentiators” than in “cost leaders”. But in the same time, SMA techniquesaddressing cost information are used more by “cost leaders” than “differentiators”.
Company size:Previous studies (Bruns & Wate rhouse, 1975; Merchant, 1981; Guilding, 1999;
Guilding & McManus, 2002) demonstrated that larger companies are more willing touse accounting sophistication. Considering SMA as advanced accounting techniques itis expected to find a positive relation betwe en company size and SMA usage rate. Sothe following hypothesis is postulated ( Hp. 4): SMA techniques usage rate is higher inlarger companies.
Industry:Many contingent studies identified technology and competition (Khandwalla,
1972) like factors influencing management accounting/control design and use.Therefore, assuming that industry is generally considered as deriving from thecompetition and the technology that characterize similar companies, the followinghypothesis is postulated (Hp. 5): SMA techniques usage rate differs among differentindustries.
2. RESEARCH METHOD
2.1. Data collection
Data were collected using an internet questionnaire survey. The initial samplecomprised 328 companies obtained from “Business International” database 3 and itcomprises the largest Italian manufacturing firms (measured by sales higher than 25millions euro) from different industrial sectors. A prior phone contact directed to “chiefaccountant”, “chief financial officer” or “controller” was made to present the researchand to ensure the participation related to a single business unit (if the company hadmore than one). Then an e -mail was sent containing the cover letter, the access codes(username and password) and the web link to the questionnaire only to those whoagreed to participate. In according to Kittleson’s (1997) follow -up advice on internet
3 Business International is an Italian consulting and training company linked to “The Economist” group.Its database comprises about 30.000 Italian firms (it can be consulted at www.whoswho.it ).

11
based surveys, after one week, a first reminder was e -mailed; a second one followed oneweek later. Then fifteen days after the second reminder the web site of the questionna irewas disabled.
From the first phone contact 113 companies declared they would not participate,so they were classified as “non participants” and removed from the sample. Five ofthem were included in the category because they were business units of a co rporatewhich had already been included; other four companies did not participate because theywere ceasing activity. The reasons for not participating were divided in a “too busy atthe moment” or “not enough time” (51), “not interested in the research be cause themanagement accounting techniques considered in the questionnaire are irrelevant formy organization” (17), “the company policy does not permit us to compile researchquestionnaire” (19) and “we outsource the accounting activities” (17). The final samplesize was made up of 215 companies.
Ninety-three responses were received (43.3 %). Only one was unable to be used.It means that 92 responses were received with a usable response rate of 42.8 %. Table 1offers a summary of the research process.
Table 1 – Survey sample summary
Initial sample size 328
Non participants 113
Final sample size 215
o Initial respondents 46
o First reminder respondents 28
o Second reminder respondents 19
Total respondents (usable) 93 (92)Response rate (%) 43.3Usable response rate (%) 42.8
Three investigations to estimate possible non -response bias were undertaken.The first one concerned a new contact by e -mail, when the research process wasfinished and the web-site disabled, for 10 non-respondents in order to unders tand thereason of their non response. They mainly justify with “I am sorry, but I was too busy”.The second investigation pertained to the comparison of the characteristics (in terms ofsales and number of employees) of the respondents and non -respondents; this waspossible because the used database contained that information. These investigationsshowed that the “non respondents” category had no substantial differences or featuresrespect to “respondents” category. The third analysis was conducted to inve stigate fordifferences in responses provided by “initial”, “first reminder” and “second reminder”respondents. At first the comparison of the usage means of each SMA technique amongthe three groups was conducted. Then an ANOVA test to verify the differen ces betweenthe means of the three groups was carried out. None of the variables revealed anystatistically significant association with the time of responses. This means that non -response bias is not a significant threat to the validity of the research.
2.2. Variable Measurement
12
2.2.1. SMA techniques usage rate measurement
The following main question was included in the questionnaire: “To what extentdoes your company (or business unit) use the following accounting techniques?”. Thenthe list of the 14 management a ccounting techniques followed. Next to each one, aLikert scale ranging from 1 (“never”) to 5 (“always”) was provided. Respondents couldeventually mark “I don’t know/ I don’t answer” if the technique was unknown to theirorganization or if they did not wa nt to answer. Next to each accounting technique a linkto the glossary permitted a clear understanding of their significance. Appendix Aprovides the definitions of the accounting techniques included as glossary in thequestionnaire. The same method was em ployed by other studies (Guilding, 1999;Guilding, Cravens and Tayles, 2000; Cravens and Guilding, 2001) with the exception ofa different length of the Likert scale (from 1 - “never”- to 7 - “always”).
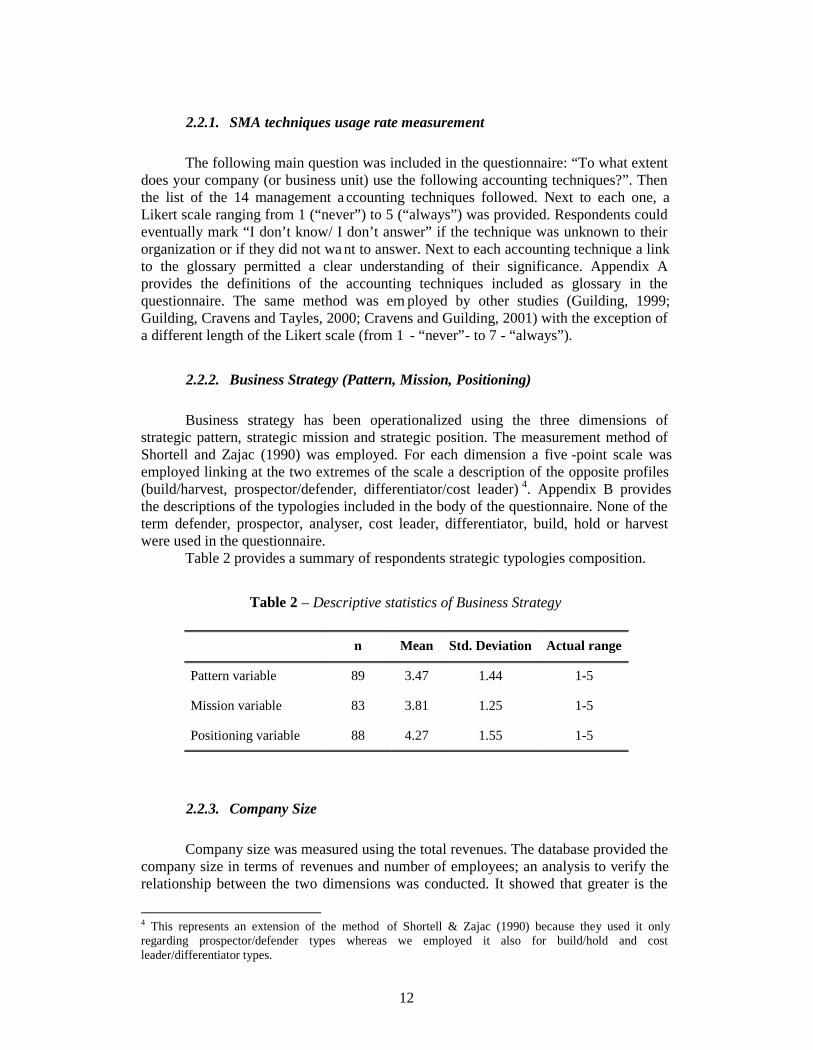
2.2.2. Business Strategy (Pattern, Mission, Positioning)
Business strategy has been operationalized using the three dimensions ofstrategic pattern, strategic mission and strategic position. The measurement method ofShortell and Zajac (1990) was employed. For each dimension a five -point scale wasemployed linking at the two extremes of the scale a description of the opposite profiles(build/harvest, prospector/defender, differentiator/cost leader) 4. Appendix B providesthe descriptions of the typologies included in the body of the questionnaire. None of theterm defender, prospector, analyser, cost leader, differentiator, build, hold or harvestwere used in the questionnaire.
Table 2 provides a summary of respondents strategic typologies composition.
Table 2 – Descriptive statistics of Business Strategy
n Mean Std. Deviation Actual range
Pattern variable 89 3.47 1.44 1-5
Mission variable 83 3.81 1.25 1-5
Positioning variable 88 4.27 1.55 1-5
2.2.3. Company Size
Company size was measured using the total revenues. The database provided thecompany size in terms of revenues and number of employees; an analysis to verify therelationship between the two dimensions was conducted. It showed that greater is the
4 This represents an extension of the method of Shortell & Zajac (1990) because they used it onlyregarding prospector/defender types whereas we employed it also for build/hold and costleader/differentiator types.

13
number of employees and greater is the revenues value. This means that the twocompany size dimensions were co herent each other5.
In order to normalize the data, a logarithmic transformation of the measure wasnecessary. Table 3 presents descriptive statistics of the revenues measure.
Table 3 - Descriptive statistics of Company Size (in millions €)
n Mean Std. Deviation Min. Max.
Revenues 92 197.20 891.74 25.00 8,442.00
Revenues (log) 92 1.79 0.43 1.40 3.93
2.2.4. Industry
The employed database provided the classification of each company by industry.Seven categories are represented in the sample, plus a mixed o ne collecting companiesfrom the remaining sectors: Furniture and wooden products (27 companies), Mechanicaland Electronic equipment (19), Chemical and Oil (15), Automotive (9), Textile, Fashionand Clothing (7), Printing and Editing (4), Buildings (2) an d Other sectors (9).
3. RESULTS
3.1. SMA adoption and intensity of use
Table 4 provides frequencies and descriptive statistics for the fourteen SMAtechniques usage rates that helps in understanding the extent of adoption of SMAtechniques by Italian companies. They are presented in descending order of usage; themean scores range from 3.77 (Attribute Costing) to 2.28 (Life Cycle Costing) and theactual range coincide with the theoretical range (1 -5). An apparent sign of huge use ofthe SMA techniques is evident noticing that seven of the fourteen mean usage scores aresituated above the midpoint of the measurement scale.
The provision of frequencies information could help in a deeper interpretation ofthe results. In particular the first consideration regards th e distinction between “nonadopters” and “adopters” of SMA. Those respondents indicating 1 are classified as “nonadopters” (1 means “never” used) instead of those indicating 2, 3, 4 and 5 areconsidered “adopters” of SMA techniques.
5 A correlation coefficient between the two measures of 0.98 (p<0.01) was found.

14
Table 4 – Frequencies and Descriptive statistics of the SMA techniques usage rate
FrequenciesVariable N. of
respondents Non adoption(1)
Low adoption(2/3)
High adoption(4/5)
I don't know/I don't answer
Median Mean S.D. ActualRange
Attribute Costing 90 (100 %) 10 (11 %) 22 (24 %) 58 (65 %) 2 4 3.77 1.43 1 - 5
Customer Accounting 89 (100 %) 8 (9 %) 32 (36 %) 49 (55 %) 3 4 3.57 1.36 1 - 5
Strategic Pricing 86 (100 %) 10 (11 %) 29 (34 %) 47 (55 %) 6 3 3.51 1.28 1 - 5
Competitive position monitoring 87 (100 %) 7 (8 %) 39 (45 %) 41 (47 %) 5 3 3.46 1.21 1 - 5
Competitor performance appraisal basedon published financial statements
85 (100 %) 13 (15 %) 32 (38 %) 40 (47 %) 7 3 3.29 1.37 1 - 5
Strategic Costing 85 (100 %) 15 (18 %) 35 (41 %) 35 (41 %) 7 3 3.16 1.36 1 - 5
Quality Costing 87 (100 %) 14 (16 %) 40 (46 %) 33 (38 %) 5 3 3.08 1.37 1 - 5
Competitor cost assessment 86 (100 %) 12 (14 %) 43 (50 %) 31 (36 %) 6 3 2.96 1.23 1 - 5
Target Costing 82 (100 %) 24 (29 %) 30 (37 %) 28 (34 %) 10 3 2.74 1.47 1 - 5
Benchmarking 84 (100 %) 19 (23 %) 39 (46 %) 26 (31 %) 8 3 2.73 1.33 1 - 5
Value Chain Costing 84 (100 %) 28 (33 %) 32 (38 %) 24 (29 %) 8 2,5 2.62 1.47 1 - 5
ABC/M 82 (100 %) 29 (35 %) 30 (37 %) 23 (28 %) 10 2 2.51 1.48 1 - 5
Integrated performance measurement 83 (100 %) 32 (38 %) 28 (34 %) 23 (28 %) 9 2 2.45 1.41 1 - 5
Life Cycle Costing 79 (100 %) 37 (47 %) 24 (30 %) 18 (23 %) 13 2 2.28 1.40 1 - 5
15
Among the “adopters” two clusters have been created to distinguish the intensityof use of the techniques. The first one collects respondents indicating 2 or 3 (2 means“very rarely” and 3 means “sometimes” used); this class indicates a low usage level ofthe technique. The second cluster collects respondents indicating 4 or 5 (4 means“frequently” and 5 means “always” used); this class indicates an high usage level of thetechnique. The last column of the frequencies indicates the number of “I don’t know/Idon’t answer.
Seven SMA techniques (Attribute Costing, Strategic Costing, Quality Costing,Customer Accounting, Strategic Pricing, Competitive position monitoring, Competitorperformance appraisal based on published financial statements) present the mean scoreover 3. The addressed techniques are indeed strongly oriented towards the provision ofinformation for decision making involving the two main external actors influencing thestrategic success for the firm, i.e. customers and competitors.
It is noteworthy that the two activity -costing oriented techniques (Value ChainCosting, ABC/M) have high “non adoptio n” rate (33% and 35% respectively); the ABChigh adoption rate resulting from the research (28%) is consistent with the results ofother recent surveys in Italy (Arena & Azzone, 2005) and confirm the difficulty ofItalian companies in implementing this tec hnique (Cinquini et al., 1999).
The highest “non adoption” rates regards Integrated PMSs and LCC, that havethe lowest mean score in the sample; the latter presents the highest number (13) of “Idon't know/ I don't answer” responses among the considered t echniques. The IntegratedPMSs high adoption rate (28%) in this research is less than the adoption rate of BSC(39,3%) resulting from the Arena & Azzone (2005) survey on Italian companies.
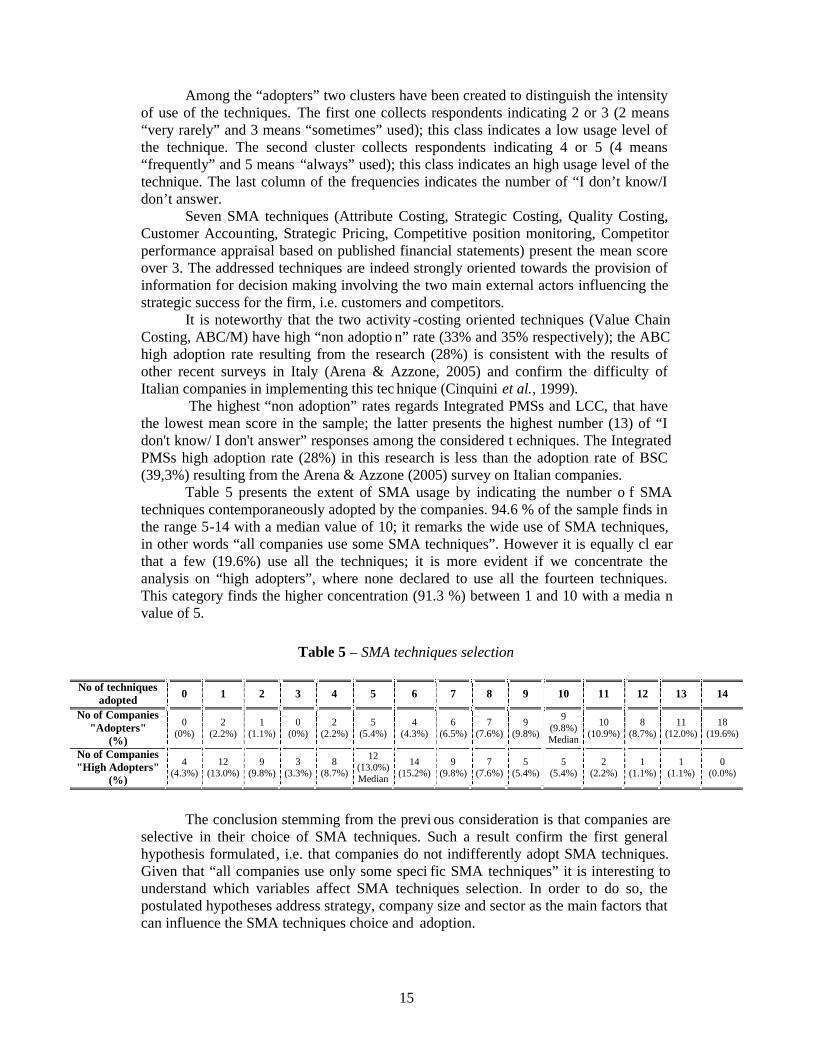
Table 5 presents the extent of SMA usage by indicating the number o f SMAtechniques contemporaneously adopted by the companies. 94.6 % of the sample finds inthe range 5-14 with a median value of 10; it remarks the wide use of SMA techniques,in other words “all companies use some SMA techniques”. However it is equally cl earthat a few (19.6%) use all the techniques; it is more evident if we concentrate theanalysis on “high adopters”, where none declared to use all the fourteen techniques.This category finds the higher concentration (91.3 %) between 1 and 10 with a media nvalue of 5.
Table 5 – SMA techniques selection
No of techniquesadopted 0 1 2 3 4 5 6 7 8 9 10 11 12 13 14
No of Companies"Adopters"
(%)
0(0%)
2(2.2%)
1(1.1%)
0(0%)
2(2.2%)
5(5.4%)
4(4.3%)
6(6.5%)
7(7.6%)
9(9.8%)
9(9.8%)Median
10(10.9%)
8(8.7%)
11(12.0%)
18(19.6%)
No of Companies"High Adopters"
(%)
4(4.3%)
12(13.0%)
9(9.8%)
3(3.3%)
8(8.7%)
12(13.0%)Median
14(15.2%)
9(9.8%)
7(7.6%)
5(5.4%)
5(5.4%)
2(2.2%)
1(1.1%)
1(1.1%)
0(0.0%)
The conclusion stemming from the previ ous consideration is that companies areselective in their choice of SMA techniques. Such a result confirm the first generalhypothesis formulated, i.e. that companies do not indifferently adopt SMA techniques.Given that “all companies use only some speci fic SMA techniques” it is interesting tounderstand which variables affect SMA techniques selection. In order to do so, thepostulated hypotheses address strategy, company size and sector as the main factors thatcan influence the SMA techniques choice and adoption.

16
3.2. Exploring distinctive features and complementarities of SMA techniques
In order to evaluate the features of Strategic Management Accounting related tothe first research question, an exploratory factor analysis of usage rates was employed.The latter permits a deeper reflection in a double sense. Firstly it highlights positiverelationships across SMA techniques, meaning they can be grouped in coherent clusters.Secondly, stemming from the analysis of the techniques comprised in each factor, it ispossible to associate and define distinctive features/dimensions underlying StrategicManagement Accounting. The principal component method of extraction with varimaxrotation was used. Selecting factors with eigenvalues greater than one (Sharma, 1996) ,four factors with a percentage of variance explained of 67 .13 have been determined.Benchmarking and Integrated Performance Measurement did not significantly load onany of the factors, so they were excluded from the analysis. Table 6 details the results ofthe factor analysis.
Table 6 – Factor Analysis results
SMA techniques Factorscore Eigenvalue Cronbach
AlphaFactor Label
(tech. orientation)
Competitor Cost Assessment .798Competitor Performance Appraisalbased on published FinancialStatements
.779
Competitive Position Monitoring .705
Strategic Pricing .625
4.220 .771Competitor-oriented
techniques
Quality Costing .845
Life Cycle Costing .749
Strategic Costing .516
1.569 .680Long term/
Future-orientedtechniques
ABC/M .831
Value Chain Costing .680
Target Costing .614
1.154 .656Process/Activity
orientedtechniques
Customer Accounting .823
Attribute Costing .7871.114 *
Customer-orientedtechniques
* Corr. (Customer Accounting, Attribute Costing) = .456 at p<0.00 1
The four factors induce in reflecting on some features characterising SMA. Thefirst factor (Competitor Cost Assessment, Competitor performance appraisal on publicfinancial statements, Competitor position monitoring and Strategic Pricing) underlines astrong orientation towards competitor information. The word “competitor” appearscontinuously except for the technique “Strategic Pricing”. The latter, even if apparentlyincoherent with the other techniques, recalls the pricing process related to competit orreaction and price decision. In this vein it is well acceptable as synthesized by thefactor.
The second factor (Quality Costing, Life Cycle Costing and Strategic Costing)collects techniques with a long term/future orientation. Life Cycle Costing, appr aisingthe cost of the product/service along the life cycle, and Strategic costing, pursuing the

17
long term competitive advantage, clearly recall the long run focus. Quality Costingreveals a forward orientation not when it is used as a mere costing techniq ue aiming atcalculating the quality and non-quality costs, but when quality costs are analysed as astrategic tool to obtain a competitive advantage in the long run.
The third factor (Activity-based Costing/Management, Value Chain Costing andTarget Costing) mainly reflects costing techniques. From an in depth analysis it emergesclearly the common process vision that characterises each technique. The activityconcept constitutes the core of ABC/M and Value Chain Costing but it is also recalledin Target Costing. The latter focuses on the product design activity, but, at the sametime, it involves all the activities of the value chain in order to reduce costs and attainthe target profit.
The fourth factor (Customer Accounting and Attribute Costing) heavily focuseson customers and market. Customer accounting aims at calculating the customerprofitability while Attribute costing aims not only at calculating the cost of productattributes, but also at managing and offering those attributes that appeal to cust omers.
Summing up, each factor underlines a particular aspect of Strategic ManagementAccounting (deriving from the defined SMA techniques). Competitor -focus, long-term,process/activity and customer orientations emerge as heavily characterizing SMA fromthis research.
From the factor analysis is once more clear that companies select SMAtechniques, and do not adopt them indifferently ; the statistical tool reveals that the use isbased on coherent clusters of techniques in terms of objectives . As mentioned, eachfactor, grouping the techniques with similar level of usage, shows that a selection ofSMA techniques implementation is made by companies.
3.3. Analysing variables influencing the use and selection of SMA techniques
A substantial objective of the resear ch concerned the investigation of variablespotentially explaining the use and selection of SMA techniques. To test the hypothesesposited in the study, a Pearson correlation analysis between fourteen SMA techniquesand twelve variables was employed. Three variables concern “strategy type” (Pattern,Mission and Positioning), one “company size” and other eight regard “industry”. Table7 details the correlation output.
The strategic pattern variable results are not statistically significant in relation toany of the SMA techniques. This means that the hypothesis 1 is rejected.
Hypothesis 2 stated a positive relationship between the mission variable andSMA techniques usage. An unique support evidence is provided as mission is positiveand statistically significant related to Target Costing (p < 0.10). So Hp. 2 is confirmedfor only one of the fourteen techniques.
The positioning variable has a negative and statistically significant correlationwith Life Cycle Costing (p < 0.10), Strategic Costing (p < 0.10), AB C/M (p < 0.10) andValue Chain Costing (p < 0.01). It is interesting to note that all of these are costingtechniques related to factor 2 and 3 (long term/ future and process/activity orientation).This means that cost leaders have a greater use of four co sting techniques (Life CycleCosting, Strategic Costing, ABC/M and Value Chain Costing) compared todifferentiators. The evidence confirms the stated Hp. 3 for few of the fourteentechniques.
Finally hypothesis 4 stated a positive relationship between comp any size andSMA techniques usage. These results lead to a clear rejection of this hypothesis.

18
Table 7 – Pearson Correlation results
* p<0.1 ** p<0.05 *** p<0.01
Pattern Mission PositioningCompany
size
Furniture &Woodenproducts
Mechanical& ElectricalEquipment
Chemical& Oil
Textile,Fashion &Clothing
AutomotivePrinting &
Editing Building
Competitive PositionMonitoring
0.07 -0.02 0.05 0.06 0.01 0.09 -0.25** 0.08 0.04 -0.02 -0.06
Competitor CostAssessment
-0.01 -0.18 -0.13 -0.20* 0.10 0.04 -0.12 0.04 0.07 -0.06 0.00
Competitor PerformanceAppraisal based onpublished financial
statements
0.12 0.02 -0.11 -0.11 0.04 0.11 -0.17 -0.02 0.11 -0.09 -0.15
Factor 1(Competitor
orientedtechniques)
Strategic Pricing -0.05 0.06 -0.17 -0.18* 0.05 -0.08 -0.20* -0.09 0.11 0.13 0.13
Quality Costing -0.15 -0.02 -0.07 -0.07 0.02 0.05 0.05 -0.08 -0.05 0.03 -0.07
Life Cycle Costing -0.16 -0.04 -0.19* 0.08 -0.17 0.10 0.14 -0.16 0.13 -0.03 0.20*
Factor 2(Long-term
orientedtechniques) Strategic Costing 0.06 -0.07 -0.20* -0.02 0.07 -0.06 -0.17 -0.07 0.14 0.10 0.04
ABC/M -0.08 0.02 -0.22* -0.10 -0.06 0.10 0.01 -0.23** 0.07 0.15 0.11
Value Chain Costing -0.10 0.03 -0.32*** -0.17 -0.04 0.02 -0.12 -0.07 0.03 0.21** 0.15
Factor 3(Activityoriented
techniques) Target Costing 0.11 0.20* -0.16 -0.02 0.01 0.07 -0.22** -0.03 0.29*** 0.03 -0.13
Customer Accounting -0.04 0.16 -0.05 0.07 0.12 0.16 -0.28*** -0.18* 0.05 0.19* -0.06Factor 4(Customeroriented
techniques)Attribute Costing -0.10 -0.03 -0.10 0.08 -0.01 0.01 -0.08 -0.07 0.13 0.04 -0.03
Integrated PerformanceMeasurement
-0.14 -0.10 0.05 0.04 -0.02 0.05 -0.05 -0.08 0.21** 0.08 -0.16
Benchmarking -0.13 0.04 0.18 0.11 -0.12 0.03 0.02 -0.14 -0.06 0.03 0.15

19
Out of the 112 correlations between the fourte en SMA techniques and the eightsectors, only eleven are statistically significant. Among them, only five reveal a positiverelation: “Automotive” industry finds a positive and statistically significant relationwith Target Costing and Integrated Performan ce Measurement, “Printing and Editing”with Value Chain Costing and Customer Accounting while “Building” with Life CycleCosting. None of the sectors reveal a particular predisposition to SMA techniquesadoption, even though it is weakly noticeable the dis persion in the adoption among thedifferent sectors. In general is well known that competition and technology characterizethe industry, but in this case it is impossible to define a certain level of competition ortechnology, stemming from the industry, a nd correlate them to SMA techniquesadoption. This leads to a partial rejection of hypothesis 5.
DISCUSSION AND CONCLUSIONS
The survey at the base of the research has showed a significant use of SMAtechniques by Italian companies. Seven of the fourteen mean usage scores present ascore value 3 (in a 1-5 Likert measurement scale). Attribute Costing, CustomerAccounting, Strategic Pricing and Competitive Position Monitoring result the widelyused techniques. Oppositely Integrated Performance Measurement S ystems and LifeCycle Costing register a limited use. The results explain that many of the companies(94.6 %) adopt from 5 to 14 techniques in the same time, but only a few (19.6 %) usecontemporaneously all the 14 techniques. This address that companies a re selective intheir choice of SMA techniques.
In order to answer the main research questions (what are the distinctivefeatures/orientation of SMA techniques that can help in grouping them coherently? Towhat extent the adoption can be explained by varia bles such as strategy, company sizeand industry?) a factor analysis and a Pearson correlation analysis were employed. Thefirst one conducted to a double conclusion. From one side it helps in the comprehensionof SMA techniques selection, because compleme ntarities and positive relationshipsacross techniques (summed by the factors) mean they will be selected in coherentclusters. From the other side it provides evidence in the definition of SMA distinctivefeatures. In fact, as perceptible from the account ing literature (Guilding et al., 2000;Cravens & Guilding, 2001; Roslender & Hart, 2003), here is provided empirical supportto the definition of SMA features as competitor, long term, process and customeroriented. Summarizing theoretical and empirical wo rks, the word “strategic” into SMAcould be related to: impact on business strategy (Shank & Govindarajan, 1992a; Roslender & Hart,
2002); competitive advantage achievement (Wilson, 1991; Shank & Govindarajan, 1992a;
Ward, 1992); external orientation (competitors and customers) (Simmonds, 1981, 1986;
Bromwich, 1990); future orientation (long term outlook) (Hoque, 2002); “advanced” internal orientation (processes instead of functions).
Strategy typologies (pattern, mission and positioning), company size andindustry were selected as contingent variables potentially explaining SMA techniquesadoption. Regarding pattern variable, the uncovered evidence here suggests a substantialincoherence with prior research (Abernethy & Guthrie, 1994; Simons, 1987; Guildin g,

20
1999). While Guilding (1999) found that prospectors make a greater use of Competitor -focus accounting practices, it would be expected that they make a greater use of SMAtechniques as well. The research do not confirm this; no relationship between stra tegicpattern and SMA usage rate was found. Marginal confirmation and extension of priorstudies relate to mission variable. Govindarajan & Gupta (1985) found greater relianceon long-run performance to be more appropriate in build firms, and Guilding (199 9)extended these results evidencing that build firms have a greater propensity to useStrategic Pricing and Strategic Costing. Further extension is provided here, as TargetCosting results in a positive relation to mission variable. Despite the fact that Porter’s(1980, 1985) typologies have been widely debated and criticized in their validity(Chenhall, 2003), this typology represents the most significant strategy classification inthe research. It has been posited that differentiators would have used ext ensively SMAtechniques, in general, but cost leaders use those SMA techniques addressing costinformation. This last hypothesis was supported by the results; it confirms the validityof Porter’s competitive strategy classification in empirical research an d the extension ofShank & Govindarajan’s (1992a) study. Little evidence has been found about therelation between company size and SMA techniques usage. It was expected to find apositive relationship between company size and SMA techniques adoption consi deringthat prior studies underlined a positive relationship between company size andaccounting sophistication (Bruns & Waterhouse, 1975; Merchant, 1981), Competitor -focus accounting (Guilding, 1999), or Customer Accounting (Guilding & McManus,2002). Surprisingly Competitor Cost Assessment and Strategic Pricing underline anopposite relationship and disconfirm the hypothesis. The small average dimension ofthe companies of the sample could be a possible reason to explain this finding. Finally,neither industry variable helps in explain SMA techniques adoption. Fundamentalcontingencies (competition and technology characterising each industry) do not explainchoice in one sub-category of management accounting even if they are influential inoverall management accounting design. This result could be addressed by the problemof under-definition and unclearness of industrial classification scheme. A more effectiveresearch would have been focussed on specific industry variables like competition ortechnology.
A summary of the Hypothesis testing results is presented in table 8.
Table 8 – Summary of the research results
Hypothesis Results
- (Hp. 1) SMA techniques usage rate is higher in “prospectors” than in“analysers” or “defenders” (PATTERN) NO
- (Hp. 2) SMA techniques usage rate is higher in “build” than in “hold” or“harvest” (MISSION)
VERYPARTIAL
- (Hp. 3) SMA techniques usage rate is, in general, higher in “differentiators”than in “cost leaders”. But in the same time, SMA techniques addressing costinformation are used more by “cost leaders” than “differentiators”(POSITIONING)
YES(PARTIAL)
- (Hp. 4) SMA techniques usage rate is higher in larger companies(COMPANY SIZE)
NO
- (Hp. 5) SMA techniques usage rate differs among different industries(INDUSTRY)
NO (PARTIAL)

21
A number of limitations characterize the research.The first limit regards the operationalization of the strategy concept. As
explained earlier strategy represent s a matter if considered as contingent variable to beoperationalized in empirical studies (Chapman, 1997). Langfield-Smith (1997)underlined some weaknesses in operationalizing strategy like its multidimensionalnature, the distinction between intended and realized strategy and its developmentalessence. Aware that these will continue to be the main limitations of this research, it isnoteworthy the attempt to catch the strategy multidimensionality through theconsideration of three strategic variables (pattern, mission and position) simultaneously.In the mean time it is well known that the research takes a picture of the firm’s strategyputting each firm into boxes labelled as “prospector”, “build mission”, “differentiator”an so on instead of considering the dynamic development of strategy, but it represents away to solve the recall trade-off in the research process underlined by Weick (1979).
A second matter to be solved attains to the identification of SMA techniques.Which management accounting techniques could be defined “strategic”? Adopting aliterature approach to define SMA techniques (Cravens & Guilding, 2001) does notsolve the problem. Ambiguous interpretation rises about the significance of SMA andthis consequently reflects on the definition of SMA techniques; it should be interpretedas in continuous evolution.
Strictly related to the previous, another issue comes out: how the investigatedtechnique is used? This study considers if and to what extent (frequency) the techniqueis used but not how. ABC, for instance, could be used as a purely accurate costaccounting technique and not in a strategic way like Palmer (1992) postulates. Thisregards a clear choice of the survey research: field research would be more suitable toinvestigate “how” Italian companies adopt SMA techniques.
Within the management accounting su b-set of SMA techniques, companiesshow evidence of choosing clusters of techniques which appear to reflect thecomplementarities and integrative benefits of the overall package. Normal contingenciesdo not seem to play a great effect on the selection of S MA techniques. This impliessome considerations.
At first SMA adoption is technique oriented with similar clusters found acrossdifferent sizes of companies and in different sectors. Secondly, paradoxically strategydoes not generally drive the choice of S MA technique: what does the adjective of“strategic” in SMA is refer to? If SMA adoption is not “strategy -driven”, then whichvariables drive the choice? This implies the view (with the possible exception of costrelated techniques) that the same SMA techn iques as being able to support differentstrategic approaches. At least, how this is achieved in practice could be researched by aseries of case study comparing companies following different strategies whileemploying the same or similar set of SMA techni ques. In this vein, given that strategy,company size and industry are not good explanators of SMA techniques ado ption, thereare probably other contingent factors (like technology, national culture or other specificcontingencies) that intervene and shoul d be considered in future analysis.
Despite the critics and doubts about Strategic Management Accounting essence(Tomkins & Carr, 1996; Lord, 1996), some characteristics of differentiation fromconventional management accounting are provided and discussed here. This and otherresearch (Guilding et al., 2000; Cravens & Guilding, 2001) provide that SMAtechniques diffusion cannot be considered a marginal topic and, for this reason,Strategic Management Accounting constitute a significant issue and research a reawithin management accounting.

22
APPENDIX A – Definitions of the management accounting techniques provided inthe questionnaire
Activity Based Costing/ManagementAn approach where costs are allocated to specific activities based on structural and execut ionalcost drivers. The activities require resources and the product/service uses activities.
Attribute CostingThe costing of specific product attributes that appeal to customers. Attributes considered mayinclude: reliability, warranty arrangements, aft er sale service.
BenchmarkingThe comparison of company performance to an ideal standard.
Competitive position monitoringThe analysis of competitor positions within the industry by assessing and monitoring trends incompetitor sales, market share, volum e, unit costs and return on sales (ROS). This informationcan provide a basis for the assessment of a competitor’s market strategy.
Competitor cost assessmentThe provision of regularly scheduled update estimate of a competitor’ unit cost. Suchinformation could derive from different sources (direct observation, common suppliers orcustomers or competitors ex-employees).
Competitor performance appraisal based on published financial statementsThe numerical analysis of a competitor’s published financial st atements (balance sheets) as apart of an assessment of a competitor’s key sources of competitive advantage.
Customer AccountingAnalysis directed to appraise profit, sales or costs deriving from customers or customersegments.
Integrated performance measurement systems (Balanced Scorecard or non financialindicators)A measurement system which focuses typically on acquiring performance knowledge based oncustomer requirements and frequently encompass non -financial measures. These measuresimply the monitoring of factors for the attainment of customer satisfaction and competitiveadvantage.
Life Cycle CostingThe appraisal of costs along all the stages of a product or service’s life. In general these stagesmay include design, introduction, growth, declin e and eventually abandonment.
Quality CostingIdentification and control of the costs associated with the creation, identification, repair andprevention of defects. The target is to direct management attention to prioritise quality (in abroader sense also safety and environment) problems.
Strategic CostingThe use of cost data based an strategic and marketing information to develop and identifysuperior strategies that will produce a sustainable competitive advantage.

23
Strategic PricingThe analysis of strategic factors in the pricing decision process. These factors may include:competitor price reaction, elasticity, market growth, economies of scale and experience.
Target CostingA method used during product and process design that involves estimating a cost calculated bysubtracting a desired profit margin from an estimated (or market based) price to arrive at adesired production, engineering or marketing cost. The product is then designed to meet thatcost.
Value Chain CostingAn activity-based approach where costs are allocated to activities required to design, procure,produce, market, distribute and service a product/service along the entire industry value chain. Itembraces the consideration of the linkages with suppliers and customers to attain higherefficiency.
APPENDIX B – Definition used in the questionnaire to operationalize strategyconcept
STRATEGIC PATTERN
Defenderthe business is characterized by a constant competition, relatively stableset of product/service, efficiency and spec ialization tendency and acentralized organization.
Prospectorthe business is characterized by a dynamic competition, relatively frequentchanges in its set of product/service, continuous efforts to pioneer in newmarket areas and a flexible structure.
STRATEGIC MISSION
Buildincrease sales and market share, be willing to accept low returns on
investment in the short-medium term.
Harvestmaximise profitability in the short -medium term, be willing to sacrifice
market share.
STRATEGIC POSITIONING
Cost leadership the primary focus is to achieve low costs relative to competitors.
Differentiationthe primary focus is to create something that is perceived as unique by thecustomers through superior product features, customer service, brandimage and/or performance.

24
REFERENCES
Abernethy M.A., Guthrie C.H., 1994, An empirical assessment of the “Fit” betweenstrategy and management information systems design, Accounting and Finance , 34,pp. 9-66.
Arena M., Azzone G., 2005, ABC, Balanced Scorecard, EVA TM: an empirical study onthe diffusion of innovative management accounting techniques, InternationalJournal of Accounting, Auditing and Performance evaluation , 2 (3), pp. 206-225.
Bellis-Jones R., 1989, Customer Profitability Analysis, Management Accounting, 67(2), pp. 26-28.
Berliner C., Brimson J., 1988, Cost Management for Today's Advanced Manufacturing,Harvard Business School Press, Boston.
Bouwens J., Abernethy M.A., 2000, The consequences of customization onmanagement accounting system design, Accounting, Organizations and Society, 25(3), pp. 221-259.
Bromwich M., 1990, The case for strategic management accounting: the role ofaccounting information for strategy in competitive markets, Accounting,Organizations and Society, 15 (1/2), pp. 27-46.
Bruggeman W., Van der Stede W., 1993, Fitting management control systems tocompetitive advantage, British Journal of Management, Vol. 4, pp. 205-218.
Bruns Jr., W.J., Waterhouse J.H., 1975, Budgetary control and organizational structure,Journal of Accounting Research, Autumn, pp. 177-203.
Cadez S., 2006, Strategy, Market orientation, and Company performance: themediating role of Strategic Management Accounting Systems , paper presented at theConference “Integrating Global Organization: the role of Performa nce MeasurementSystems”, July 13-14, Siena, Italy.
Carr L., Tyson T., 1992, Planning quality cost expenditures, Management Accounting,October, pp. 52-56.
Chapman C.S., 1997, Reflections on a contingent view of accounting, Accounting,Organizations and Society, 22 (2), pp. 189- 205.
Chenhall R.H., 2003, Management Control System design within its organizationalcontext: findings from contingency -based research and directions for future,Accounting, Organizations and Society, 28, pp. 123-168.
Chenhall R.H., 2005a, Integrative strategic performance management systems, strategicalignment of manufacturing, learning and strategic outcomes: an exploratory study,Accounting, Organizations and Society, 30, pp. 395-422.
Chenhall R.H., 2005b, Content and Process App roaches to Studying Strategy andManagement Control Systems, in Chapman C.S. (ed.), Controlling Strategy:Management, Accounting and Performance Measurement , Oxford University Press,Oxford.
Chenhall R.H., Langfield-Smith K., 1998, The relationship between strategic priorities,management techniques and management accounting: an empirical investigationusing a system approach, Accounting, Organizations and Society, 23 (3), pp. 243-264.
Cinquini L., Collini P., Marelli A., Quagli A., Silvi R., 1999, A survey on costaccounting practices in Italian large and medium size manufacturing firms , Paperpresented at the 22th Annual Congress of the European Accounting Association,Bordeaux, May, 5-7.

25
Cooper R., Kaplan R.S., Maisel R.S., Morrissey E., Oehm R.M., 1992, ImplementingActivity-based Cost Management – Moving From Analysis To Action , Ima, NewYork.
Cravens K.S., Guilding C., 2001, An empirical study of the application of StrategicManagement Accounting Techniques, Advances in Management Accounting, 10, pp.95-124.
Cross K., Lynch R., 1989, Accounting for competitive performance, Journal of CostManagement, Spring, pp. 20-28.
Dent J.F., 1990, Strategy, Organization and Control: some possibilities for accountingresearch, Accounting, Organizations and Society, 15 (1/2), pp. 3- 25.
Ellram L.M., Siferd S.P., 1998, Total Cost of Ownership: a key concept in StrategicCost Management Decisions, Journal of Business Logistics, 19 (1), pp. 55-84.
Ewert R., Ernst C., 1999, Target Costing, co -ordination and Strategic CostManagement, European Accounting Review, 8 (1), pp. 23-49.
Govindarajan V., 1988, A contingency approach to strategy implementation at thebusiness-unit level: integrating administrative mechanisms with strategy, TheAcademy of Management Journal, 31, pp. 828-853.
Govindarajan V., Fisher J., 1990, Strategy, control systems, and Resource sharing:Effects on Business-unit performance, The Academy of Management Journal, 33(2), pp. 259-285.
Govindarajan V., Gupta A.K., 1985, Linking control systems to business unit strategy:impact on performance, Accounting, Organizations and Society, 10, pp. 51-56.
Guilding C., 1999, Competitor -focused accounting: an exploratory note, Accounting,Organizations and Society, 24 (7), pp. 583-595.
Guilding C., Cravens K.S., Tayles M., 2000, An international comparison of strategicmanagement accounting practices, Management Accounting Research, 11 (1),pp.113-135.
Guilding C., McManus L., 2002, The incidence, perceived merit and antecedents ofcustomer accounting: an exploratory no te, Accounting, Organizations and Society,27, pp. 45-59.
Gupta A.K., Govindarajan V., 1984, Business unit strategy, Managerial characteristics,and Business unit effectiveness at strategy implementation, The Academy ofManagement Journal, 27 (1), pp. 25-41.
Heagy C.D. , 1991, Determining optimal quality costs by considering cost of lost sales,Journal of Cost Management, Fall, pp. 64-72.
Hoque Z., 2002, Strategic Management Accounting: Concepts, Processes and Issues ,Spiro Press, London.
Jones L., 1988, Competitor cost analysis at Caterpillar, Management Accounting,October, pp. 32-38.
Kald M., Nilsson F., Rapp B., 2000, On strategy and Management Control: Theimportance of Classifying the strategy of the Business, British Journal ofManagement, Vol. 11, pp. 197-212.
Khandwalla P.N., 1972, The Effect of different types of competition on the use ofManagement Controls, Journal of Accounting Research , Autumn, pp. 275-285.
Kaplan R.S., Norton D.P., 1996a, Using the balanced scorecard as a strategicmanagement system, Harvard Business Review, January-February, pp. 75–85.
Kaplan R.S., Norton D.P., 1996b, Linking the balanced scorecard to strategy, CaliforniaManagement Review, Fall, pp. 53-79.
Kaplan R.S., Norton D.P., 2000, The Strategy-Focused Organization, Harvard BusinessSchool Press, Boston.

26
Kittleson M.J., 1997, Determining effective follow -up of e-mail surveys, AmericanJournal of Health Behaviour, 21(3), pp. 193-196.
Kotha S., Vadlamani B.L., 1995, Assessing generic strategies: an empiricalinvestigation of two competing typologies in discrete manufacturing industries,Strategic Management Journal, Vol. 16, pp. 75-83.
Langfield-Smith K., 1997, Management Control Systems and Strategy: A CriticalReview, Accounting, Organizations and Society, 22 (2), pp. 207-232.
Langfield-Smith K., 2005, What do we know about Management Control Systems andStrategy?, in Chapman C.S. (ed.), Controlling Strategy: Management, Accountingand Performance Measurement , Oxford University Press, Oxford.
Lord B., 1996, Strategic Management Accounting: the emperor's new clothes,Management Accounting Research , 7 (3), pag.347-366.
Malina N.A., Selto F.H., 2001, Communicating and controlling strategy: an empiricalstudy of the effectiveness of the Balanced Scorecard, Journal of ManagementAccounting Research, Vol. 13, pp. 47-90.
McNair C.J., Leibfried K., 1992, Benchmarking: A Tool for Continuous Improvement,Omneo, Texas.
Merchant K., 1981, The design of the corporate budgeting system: influences onmanagerial behaviour and performance, The Accounting Review, October, pp. 813-829.
Miles R.E., Snow C.G., 1978, Organizational strategy, structure, and process,McGraw-Hill, New York.
Miller A., Dess G.G., 1993, Assessing Porter's (1980) Model in terms of itsgeneralizability, accuracy and simpl icity, Journal of Management Studies , 30 (4),pp. 553-585.
Miller D., Friesen P.H., 1982, Innovation in conservative and entrepreneurial firms: twomodels of strategic momentum, Strategic Management Journal, 3, pp. 1- 25.
Miller G., De Meyer A., Nakane J. , 1992, Benchmarking Global Manufacturing,Business One Irwin, Illinois.
Monden Y., Hamada K., 1991, Target Costing and Kaizen Costing in JapaneseAutomobile Companies, Journal of Management Accounting Research, Fall, pp.16-34.
Moon P., Bates K., 1993, Core analysis in strategic performance appraisal, ManagementAccounting Research, 4 (4), pp.139-152.
Morgan M.J., 1993, Accounting for strategy, Management Accounting , May, pp.20-24.Nanni A.J., Dixon J.R., Vollman T.E., 1992, Integrated performance measurem ent:
Management accounting to support the new manufacturing realities, Journal ofManagement Accounting Research, Fall, pp. 1-19.
Narver J.C., Slater S.F. , 1990, The effect of a market orientation on businessprofitability, Journal of Marketing , October, pp. 20-35.
Palmer R.J., 1992, Strategic goals and the design of strategic management accountingsystems, Advances in Management Accounting , 1, pp. 179-204.
Porter M., 1980, Competitive Strategy, Free Press, New York.Porter M., 1985, Competitive Advantage, Free Press, New York.Roslender R., Hart S.J., 2002, Integrating Management Accounting and Marketing in
the pursuit of competitive advantage: the case for Strategic ManagementAccounting, Critical Perspectives on Accounting , 13, pp. 255-277.
Roslender R., Hart S.J., 2003, In search of strategic management accounting: theoreticaland field study perspectives, Management Accounting Research, 14 (3), pp. 255-279.

27
Shank J.K., Govindarajan V., 1989, Strategic Cost Analysis: the evolution frommanagerial to strategic accounting, Homewood, Richard Irwin Inc.
Shank J.K., Govindarajan V., 1992a, Strategic Cost Management: Tailoring Controls toStrategies, Journal of Cost Management, Fall, pp. 14-24.
Shank J.K., Govindarajan V., 1992b, Strategic Cost Management: The Value Chainperspective, Journal of Management Accounting Research, Fall, pp. 179-198.
Shank J.K., Govindarajan V., 1993a, What "drives" cost? A strategic cost managementperspective, Advances in Management Accounting, 2, pp. 27-46.
Shank J.K., Govindarajan V., 1993b, Strategic Cost Management: The new tool forcompetitive advantage, Free Press, New York.
Sharma S., 1996, Applied Multivariate Techniques , Wiley and sons Inc., New York.Shields M.D., Young S.N., 1991, Managing product life cycle costs: an or ganizational
model, Journal of Cost Management, 5 (3), pp.39-52.Shortell S.M, Zajack E.J., 1990, Perceptual and Archival Measures of Miles and Snow's
Strategic Types: A Comprehensive Assessment of Reliability and Validity, TheAcademy of Management Journa l, 3 (4), pp. 817- 832.
Simmonds K., 1981, Strategic Management Accounting, Management Accounting(UK), April, pp.26-29.
Simmonds K., 1982, Strategic Management Accounting for Pricing: A Case Example,Accounting and Business Research, 12 (47), pp. 206-214.
Simmonds K., 1986, The Accounting Assessment of Competitive Position, EuropeanJournal of Marketing, 20 (1), pp. 16-32.
Simons R., 1987, Accounting control systems and business strategy: an empiricalanalysis, Accounting, Organizations and Society, 12 (4), pp. 357-374.
Simons R., 1990, The role of management control systems in creating competitiveadvantage: new perspectives, Accounting, Organizations and Society, 15 (1/2), pp.127-143.
Simpson J.B., Muthler D.L. , 1987, Quality costs: facilitating the qu ality initiative,Journal of Cost Management, Spring, pp. 25-34.
Tomkins C., Carr C., 1996, Reflections on the papers in this issue and a commentary onthe state of strategic management accounting, Management Accounting Research , 7(2), pp. 271-280.
Ward K., 1992, Strategic Management Accounting, Butterworth-Heineman, Oxford.Weick K., 1979, The social psychology of organizing , Josey Bass, San Francisco.Wilson R.M.S., 1991, Strategic management accounting, in Issues in Management
Accounting, Ashton D.J., Hopper T.M., and Scapens R.W., editors. Prentice -Hall,London.