Muni Performance and System Needs San Francisco Board of Supervisors Land Use and Economic...
29
Muni Performance and System Needs San Francisco Board of Supervisors Land Use and Economic Development Committee 5 | 28 | 2013 SAN FRANCISCO, CALIFORNIA SFMTA Municipal Transportation Agency Image: Historic Car number 1 and 162 on Embarcadero
-
Upload
gavin-sullivan -
Category
Documents
-
view
216 -
download
0
Transcript of Muni Performance and System Needs San Francisco Board of Supervisors Land Use and Economic...

Muni Performance and System Needs
San Francisco Board of Supervisors Land Use and Economic Development Committee
5 | 28 | 2013 SAN FRANCISCO, CALIFORNIA
SFMTA Municipal Transportation Agency Image: Historic Car number 1 and 162 on Embarcadero
Who We Are

3
Performance Metric Areas
The SFMTA measures Muni service in the following key areas:
A. Overall Performance
B. Maintenance
C. Vehicle Availability
D. Labor
E. Service Disruptions

4
How are we doing?Performance Metric FY 2013 To Date April 2013 April 2012
On-Time Performance 58.7% 61.3% 60.5%
Gaps 19.1% 15.9% 20.5%
Percentage of Scheduled Service Delivered 96.6% 99.2% 95.1%
Bus Crowding (over 100% capacity)
7.7% (AM inbound) 7.0% (AM inbound) 5.9% (AM inbound)7.7% (PM outbound) 7.6% (PM outbound) 8.2% (PM outbound)
Vehicle Availability(Percentage of Weekdays with Sufficient Vehicles to Deliver Scheduled Peak Service)
100.0% (Motor Coach) 100.0% (Motor Coach)100.0% (Motor Coach)64.0% (Trolley Coach) 50.0% (Trolley Coach) 66.7% (Trolley Coach)
33.1% (Train) 9.1% (Train) 9.5% (Train)
Mean Distance Between Failure (MDBF)4,602 (Motor Coach)1,892 (Trolley Coach)
3,796 (Train)
5,064 (Motor Coach) 6,749 (Motor Coach)1,578 (Trolley Coach)
3,765 (Train)1,917 (Trolley Coach)
3,655 (Train)
Average Daily Hold Count (Vehicles unavailable for revenue service)
181 189 195
Line delays (over 10 minutes)
216 200 242
Estimated Customer Delay Hours N/A
151,263 (Maintenance-related)
20,932 (Other Operations-
related)
N/A
Better than last year Worse than last year
Muni Today

5
What affects Muni’s Performance Today? • Under-investment in the system
– Aging fleet and infrastructure– Outdated technology
• Insufficient operator, maintenance, and supervision staffing– Not filling scheduled service– Crowded vehicles– Longer customer waits
• Operating in mixed flow traffic– Delays, service gaps, slow speeds
Muni Today
Crowding
Crowding
Traffic Delays

6
• Reducing travel times– All-Door Boarding – J Church priority lanes
• Increasing system efficiency– Transit Effectiveness Project (TEP) – Customer First initiatives
• Supervision– Line Management Center– Use of modern technology
• Schedules– More frequent and demand-based schedule
adjustments
Initiatives to Improve Performance
All Door Boarding
Dynamic Supervision
Scheduling Efficiencies
Transit Only Lanes
Muni Today

7
Initiatives to Improve Performance • Realignment of capital program to address
aging Transit fleet and infrastructure
• Fleet and infrastructure rehabilitation and replacement– Bus fleet replaced in next five years– Rail replacements (Duboce, Sunset, etc.)
• Focus on maintenance– More comprehensive preventive
maintenance– Targeted component rehabilitation
• Reduced subway delays– Replacing worn infrastructure– Clearing disabled trains faster
Reduce Subway Delays
Fleet Replacement
Muni Today
Infrastructure Rehabilitation

8
Improving Customer Communications
• Communications – Real-time customer communication via Twitter,
NextBus and audio announcements– New website
• Customer Outreach – Rider alerts– New subway signage and audio system– Pilot electronic signage
Improved Communications
Muni Today
9
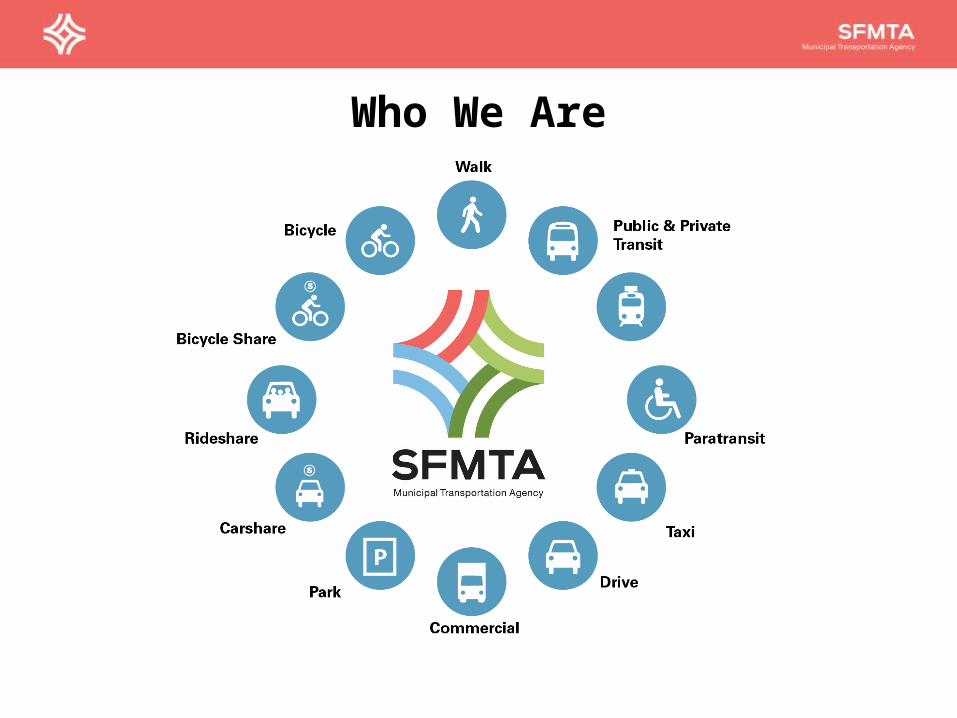
Investment Needed to Meet Today’s Needs• The SFMTA faces a $320M annual structural budget deficit
– $70M in unfunded operating needs ($50M for transit alone)– $260M in State of Good Repair needs
• Decades of under-investment have contributed to a system that does not meet Proposition E standards
Muni Today
• Service levels have not kept up with recent population growth
• Quality of service compromised

10
Transit System – State of Good Repair • The SFMTA has total assets
of $12.35 billion• Assets classified as
“Transit Service Dependent”
– Assets that directly impact the provision of transit services; reduce day-to-day maintenance and/or operating costs
– Total Transit Service Dependent Assets = $6.69 billion
– Deferrals = $680 million as of 2010
Muni Today
ASSET CLASS TOTAL VALUE
%Deferred
2010
Light Rail Vehicles
$1,006 M 2%
Motor Coach Vehicles
$1,168 M 5%
Train Control and Communications
$876 M 11%
Trolley Coach Vehicles
$742 M 17%
Overhead Lines $2,177 M 17%
Track/Rail $724 M 22%
TOTAL $6,693 M
10%

People = 920,230(+15%)
Jobs = 625,000(+25%)
Source: SF City Planning
City’s 2035 Population & Job Growth Requires More Transit
11
Muni Tomorrow
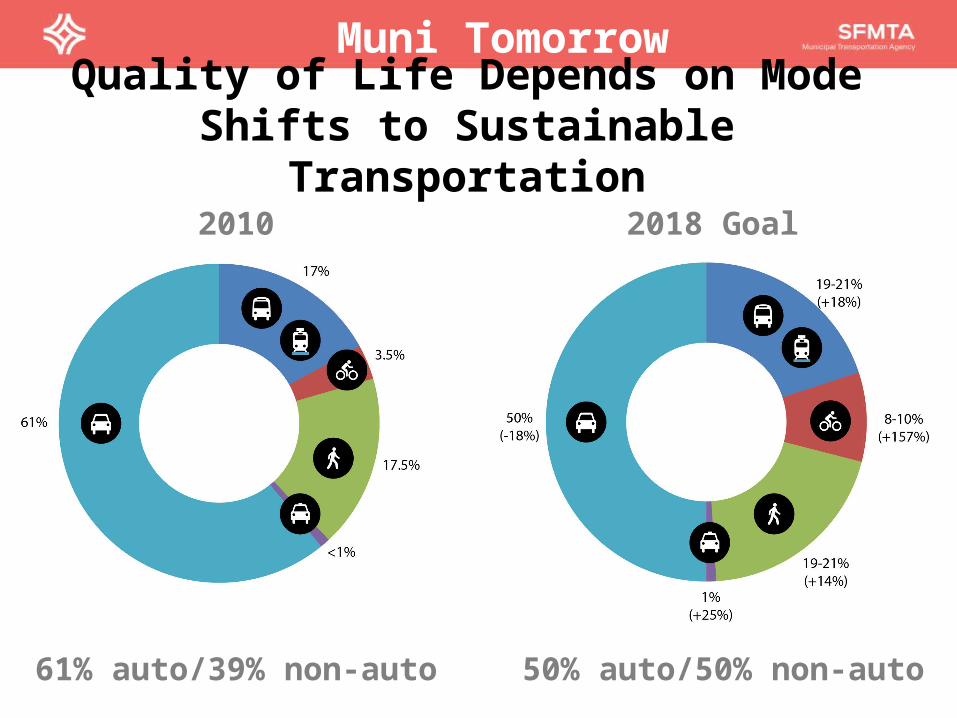
2010 2018 Goal
61% auto/39% non-auto 50% auto/50% non-auto
Quality of Life Depends on Mode Shifts to Sustainable Transportation
Muni Tomorrow

13
Residents Make Choices Based on the Quality of the Transportation System
• Where to Live?
• Where to Work?
• Where to Shop?
• How to Travel?
• Willingness to pay for housing?
Muni Tomorrow

14
“Quality” Means Different Things
Poor quality transportation reduces the quality of life in San Francisco
Quality
Speed
Cost of Time
Comfort
Enjoyment
Travel Productivity
Access to jobs and shopping
Out-of-Pocket Costs
Reliability
Muni’s Economic Value

15
Economic Impacts of Low Quality Transportation
• Higher Labor Costs• Lower Property Values
Lower Quality of
Life for Residents
• Less Access to Skills• Higher Labor Costs• Weaker
Competitiveness
Smaller Labor Pool
for Businesses
Muni’s Economic Value

16
Muni Delays, April 2013:Impact on Commuters
• 86,000 customer-hours* lost in peak-hour delays due to maintenance or other Muni-related reason.
• Increased commute time for San Franciscans by 1.5%
• Caused economic loss of $4.2 million ($50 million** annualized), due to higher costs and lower competitiveness.
* Total customer-hours in peak period estimated at 1,900,000
** Excludes the impacts of reduced shopping access and off-peak delays
Muni’s Economic Value

17
Implications
• Reducing transit delays creates economic benefits.
• Improving transit performance can create additional economic benefits.
• Investment in Muni and other city transportation infrastructure can create economic benefits that exceed their cost.
• Economic analysis of these benefits can help identify investments with the greatest potential return on investment.
Muni’s Economic Value

18
Economic impact of delays is estimated at $50 million annually
• With a $50 million recurring annual investment, here are examples of how the SFMTA could improve Muni service:
Additional Funding Yields a Return on Investment
Muni’s Economic Value
Meet service delivery goals
Improve on-time performance
Reduce gaps
Reduce crowding
Improve service frequency
Improve vehicle reliability
Replace 10 trains per year
Increase service by 8%
Rehabilitate 170 buses per year
Replace 64 buses per year
or
or
or
or

19
Questions?

20
Reference Slides

21
Muni Performance Metrics
Performance Metric Methodology
On-Time PerformancePercentage of vehicles passing each timepoint within -1/+4 min. of schedule
GapsPercentage of vehicles passing each timepoint where gaps are at least 5 minutes longer than the route's scheduled headway
Percentage of Scheduled Service Delivered
Percentage of scheduled runs that are delivered
Bus Crowding Percentage of buses that are over capacity at the maximum load pointMean Distance Between Failure (MDBF)
Distance between vehicle breakdowns by vehicle type
Unscheduled Operator Absenteeism
Unscheduled absence rate for Transit Operators due to sickness or other reasons
Line delaysNumber of line delays (at least 10 minutes long) as reported in the SFMTA's Central Control Log
Est. Customer Delay HoursEstimated number of customer-hours of delay resulting from (a) maintenance-related line delays and (b) non-maintenance line delays related to Muni, such as accidents
• The following major performance metrics help illustrate how Muni performance impacts customer service
• In support of Proposition E and the SFMTA Strategic Plan
22
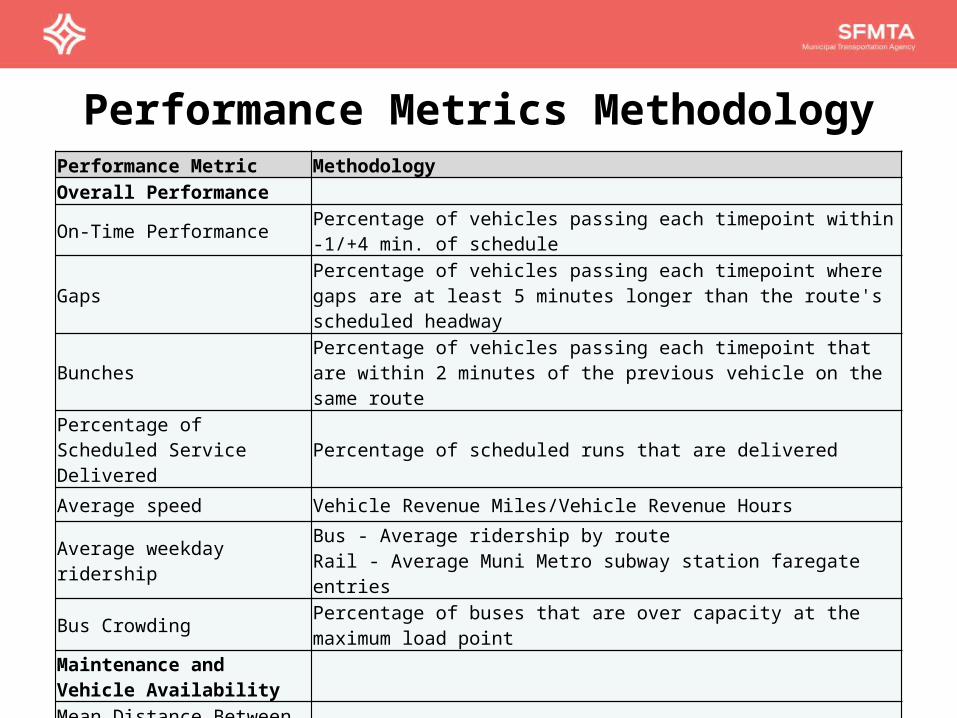
Performance Metrics MethodologyPerformance Metric MethodologyOverall Performance
On-Time PerformancePercentage of vehicles passing each timepoint within -1/+4 min. of schedule
GapsPercentage of vehicles passing each timepoint where gaps are at least 5 minutes longer than the route's scheduled headway
BunchesPercentage of vehicles passing each timepoint that are within 2 minutes of the previous vehicle on the same route
Percentage of Scheduled Service Delivered
Percentage of scheduled runs that are delivered
Average speed Vehicle Revenue Miles/Vehicle Revenue Hours
Average weekday ridershipBus - Average ridership by routeRail - Average Muni Metro subway station faregate entries
Bus Crowding Percentage of buses that are over capacity at the maximum load pointMaintenance and Vehicle AvailabilityMean Distance Between Failure (MDBF)
Distance between vehicle breakdowns by vehicle type
Maintenance Staffing Vehicles per Maintenance employee full-time equivalent (FTE)
Number of Active VehiclesThe current number of active light rail vehicles, diesel coaches, and electric trolleys available on the property
23
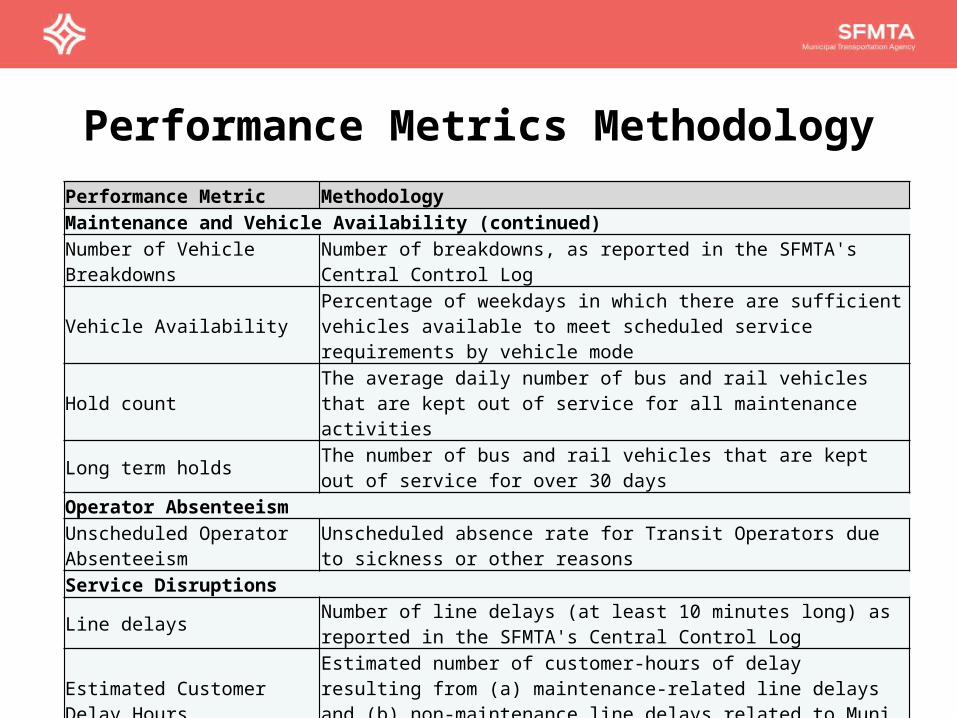
Performance Metric MethodologyMaintenance and Vehicle Availability (continued)Number of Vehicle Breakdowns
Number of breakdowns, as reported in the SFMTA's Central Control Log
Vehicle AvailabilityPercentage of weekdays in which there are sufficient vehicles available to meet scheduled service requirements by vehicle mode
Hold countThe average daily number of bus and rail vehicles that are kept out of service for all maintenance activities
Long term holdsThe number of bus and rail vehicles that are kept out of service for over 30 days
Operator AbsenteeismUnscheduled Operator Absenteeism
Unscheduled absence rate for Transit Operators due to sickness or other reasons
Service Disruptions
Line delaysNumber of line delays (at least 10 minutes long) as reported in the SFMTA's Central Control Log
Estimated Customer Delay Hours
Estimated number of customer-hours of delay resulting from (a) maintenance-related line delays and (b) non-maintenance line delays related to Muni, such as accidents
Performance Metrics Methodology

24
Sample ReportMetric Goal FY13 Avg Jul
2012Aug 2012
Sep 2012
Oct 2012
Nov 2012
Dec 2012
Jan 2013
Feb 2013
Mar 2013
Apr 2013
Overall Performance StatisticsPercentage of on-time performance 85% 58.7% 59.0% 55.6% 56.0% 56.6% 58.9% 59.0% 60.5% 59.8% 60.7% 61.3%Percentage of transit trips with + 5 min gaps 19.1% 20.4% 21.4% 20.0% 19.7% 18.1% 20.4% 18.8% 19.1% 17.5% 15.9%Percentage of transit trips with + 5 min gaps on Rapid Network 13.9% 17.7% 19.1% 20.3% 19.1% 18.8% 17.0% 18.6% 16.6% 17.0% 15.7% 15.2%Percentage of transit trips with <2 min bunching 4.9% 4.8% 5.6% 5.5% 5.4% 4.6% 4.6% 4.5% 4.6% 4.6% 4.8%Percentage of transit trips with <2 min bunching on Rapid Network
5.3% 7.0% 7.0% 8.0% 7.7% 7.6% 6.5% 6.5% 6.3% 6.5% 6.6% 6.9%
Average Number of Missed RunsPercentage of service delivered 98.5% 96.6% 95.3% 94.0% 95.7% 96.2% 96.7% 96.0% 97.8% 96.7% 98.4% 99.2%Average Muni System Speed (mph)Ridership (rubber tire, average weekday) 495,716 486,497 505,630 517,674 515,379 484,545 500,121 467,267 488,616 -Ridership (Clipper rail station entries, average weekday) 56,151 63,561 63,176Percentage of bus trips beyond capacity (8 am hour, inbound) 7.7% 7.5% 7.7% 8.5% 9.4% 7.8% 7.1% 6.6% 7.6% 7.4% 7.0%Percentage of bus trips beyond capacity (5 pm hour, outbound) 7.7% 7.7% 10.1% 8.5% 8.9% 6.7% 8.0% 6.4% 5.9% 7.0% 7.6%Maintenance StatisticsMean distance between failure (Motor Coach & Trolley) 3,259 2,877 3,087 2,815 2,877 3,071 3,197 3,631 3,723 4,170 3,712 Mean distance between failure (LRV) 3,796 4,211 3,654 3,657 3,660 3,910 3,167 3,927 4,440 3,984 3,655 Mean distance between failure (Historic) 2,247 2,454 6,566 2,200 2,144 1,990 1,891 1,958 2,316 1,620 2,530 Mean distance between failure (Cable Car) 3,627 4,571 6,202 4,248 2,386 4,244 2,624 2,649 2,811 4,814 5,488 Vehicles per maintenance employee full-time equivalent (FTE) 0.67 0.67Vehicle Availability StatisticsNumber of active vehicles 1,050 1,050 1,050 1,050 1,048 1,048 1,036 1,036 1,036 1,036 1,036 Number of chargeable roadcalls 687 751 702 734 868 692 689 636 548 562Percentage of weekdays with sufficient vehicles (Motor Coach)
100.0% 100.0% 100.0% 100.0% 100.0% 100.0% 100.0% 100.0% 100.0% 100.0% 100.0%
Percentage of weekdays with sufficient vehicles (Trolley) 64.0% 0.0% 60.9% 45.0% 95.7% 95.5% 81.0% 95.7% 40.0% 76.2% 50.0%Percentage of weekdays with sufficient vehicles (LRV) 33.1% 40.9% 8.7% 55.0% 47.8% 31.8% 0.0% 30.4% 55.0% 52.4% 9.1%Percentage of weekdays with sufficient vehicles (Historic) 84.2% 31.8% 30.4% 80.0% 100.0% 100.0% 100.0% 100.0% 100.0% 100.0% 100.0%Percentage of weekdays with sufficient vehicles (Cable Car) 99.0% 100.0% 100.0% 95.0% 100.0% 100.0% 95.2% 100.0% 100.0% 100.0% 100.0%Average daily hold count 181 198 192 204 168 179 179 149 158 189 189Long term (30+ days) holds 85 91 85 90 94 91 84 85 86 94 44Labor StatisticsUnscheduled absence rate by employee group (Transit operators)
8.6% 9.4% 10.5% 9.3% 6.6% 7.0% 9.0% 8.9% 10.3% 8.5% 6.9%
Service Disruption StatisticsLine delays greater than 10 minutes (overall) 216 209 250 197 230 229 222 220 191 207 200Est. Maintenance-Related Customer Delay Hours 88,065 130,849Est. Other Operational-Related Customer Delay Hours 23,241 20,932Est. Economic Impact of Maintenance-Related Delays $1,320,000Est. Economic Impact of Other Operational-Related Delays $349,000

Slow travel times frustrate customers and increase Muni costs

30 minutes
30 minutes
Bus every 10 minutes = = 6.0 => 6 buses + 6 drivers60
10
Bus route…60 min running time
Round Trip Travel Time = 60 minutes

30 minutes
30 minutes
Bus every 10 minutes = = 5 buses + 5 drivers50
10
Remove congestion…reduce time, reduce resources
Round Trip Travel Time = 60 minutes
25
25
50

28
Ridership

29
Ridership