Multiwavelength Transit Observations of the Candidate ...
17
Multiwavelength Transit Observations of the Candidate Disintegrating Planetesimals Orbiting WD 1145+017 The MIT Faculty has made this article openly available. Please share how this access benefits you. Your story matters. Citation Croll, Bryce, Paul A. Dalba, Andrew Vanderburg, Jason Eastman, Saul Rappaport, John DeVore, Allyson Bieryla, et al. “Multiwavelength Transit Observations of the Candidate Disintegrating Planetesimals Orbiting WD 1145+017.” The Astrophysical Journal 836, no. 1 (February 2017): 82 © 2017 The American Astronomical Society As Published http://dx.doi.org/10.3847/1538-4357/836/1/82 Publisher IOP Publishing Version Final published version Citable link http://hdl.handle.net/1721.1/109507 Terms of Use Article is made available in accordance with the publisher's policy and may be subject to US copyright law. Please refer to the publisher's site for terms of use.
Transcript of Multiwavelength Transit Observations of the Candidate ...

Multiwavelength Transit Observations of the CandidateDisintegrating Planetesimals Orbiting WD 1145+017
The MIT Faculty has made this article openly available. Please share how this access benefits you. Your story matters.
Citation Croll, Bryce, Paul A. Dalba, Andrew Vanderburg, JasonEastman, Saul Rappaport, John DeVore, Allyson Bieryla, etal. “Multiwavelength Transit Observations of the CandidateDisintegrating Planetesimals Orbiting WD 1145+017.” TheAstrophysical Journal 836, no. 1 (February 2017): 82 © 2017 TheAmerican Astronomical Society
As Published http://dx.doi.org/10.3847/1538-4357/836/1/82
Publisher IOP Publishing
Version Final published version
Citable link http://hdl.handle.net/1721.1/109507
Terms of Use Article is made available in accordance with the publisher'spolicy and may be subject to US copyright law. Please refer to thepublisher's site for terms of use.

Multiwavelength Transit Observations of the Candidate Disintegrating PlanetesimalsOrbiting WD 1145+017
Bryce Croll1, Paul A. Dalba2, Andrew Vanderburg3, Jason Eastman3, Saul Rappaport4, John DeVore5, Allyson Bieryla3,Philip S. Muirhead1,2, Eunkyu Han2, David W. Latham3, Thomas G. Beatty6, Robert A. Wittenmyer7, Jason T. Wright6,8,
John Asher Johnson3, and Nate McCrady91 Institute for Astrophysical Research, Boston University, 725 Commonwealth Avenue, Room 506, Boston, MA 02215, USA; [email protected]
2 Department of Astronomy, Boston University, 725 Commonwealth Avenue, Boston, MA 02215, USA3 Harvard-Smithsonian Center for Astrophysics, 60 Garden Street, Cambridge, MA 02138, USA
4 Kavli Institute for Astrophysics and Space Research, Massachusetts Institute of Technology, Cambridge, MA 02139, USA5 Visidyne, Inc., Santa Barbara, CA 93105, USA
6 Department of Astronomy and Astrophysics and Center for Exoplanets and Habitable Worlds, The Pennsylvania State University, University Park, PA 16802, USA7 School of Physics and Australian Centre for Astrobiology, UNSW Australia, Sydney, NSW 2052, Australia
8 NASA Nexus for Exoplanet System Science9 Department of Physics and Astronomy, University of Montana, 32 Campus Drive, No. 1080, Missoula, MT 59812, USA
Received 2015 October 7; revised 2016 December 18; accepted 2016 December 19; published 2017 February 9
Abstract
We present multiwavelength, ground-based follow-up photometry of the white dwarf WD 1145+017, which hasrecently been suggested to be orbited by up to six or more short-period, low-mass, disintegrating planetesimals. Wedetect nine significant dips in flux of between 10% and 30% of the stellar flux in our ∼32 hr of photometry,suggesting that WD 1145+017 is indeed being orbited by multiple, short-period objects. Through fits to theasymmetric transits that we observe, we confirm that the transit egress is usually longer than the ingress, and thatthe transit duration is longer than expected for a solid body at these short periods, all suggesting that these objectshave cometary tails streaming behind them. The precise orbital periods of the planetesimals are unclear, but at leastone object, and likely more, have orbital periods of ∼4.5 hr. We are otherwise unable to confirm the specificperiods that have been reported, bringing into question the long-term stability of these periods. Our high-precisionphotometry also displays low-amplitude variations, suggesting that dusty material is consistently passing in front ofthe white dwarf, either from discarded material from these disintegrating planetesimals or from the detected dustydebris disk. We compare the transit depths in the V- and R-bands of our multiwavelength photometry, and find nosignificant difference; therefore, for likely compositions, the radius of single-size particles in the cometary tailsstreaming behind the planetesimals must be ∼0.15 μm or larger, or ∼0.06 μm or smaller, with 2σ confidence.
Key words: eclipses – planetary systems – stars: individual (WD 1145+017) – techniques: photometric
1. Introduction
The white dwarf WD 1145+017 was recently announced tohost up to six or more disintegrating candidate planetesimals inextremely short-period orbits: Vanderburg et al. (2015)presented two-wheeled Kepler Space Telescope (K2) photo-metry (Howell et al. 2014) of WD 1145+017 with six distinctoccultations with periods from ∼4.5–4.9 hr and depths up to afew percent. The depth of the main ∼4.5 hr transiting objectalso evolved from undetectable to a few percent over the 80days of long cadence K2 photometry. As the long cadence(∼29.4 minutes) Kepler integrations were poorly suited toresolve what likely should be events with very short transitdurations (∼1 minute) at these ultra-short periods, follow-upphotometry was performed: Vanderburg et al. (2015) detected∼40% eclipses with an asymmetric transit profile using the 1.2m Fred L. Whipple Observatory, and the MEarth South arrayof 0.4 m telescopes (Nutzmann & Charbonneau 2008; Irwinet al. 2015). These observed apparent occultations of WD 1145+017 displayed many characteristics in common with othercandidate disintegrating, ultra-short period planets, includingvariable transit depths, and an asymmetric transit profilefeaturing a sharp ingress and gradual egress; in this case—and in the case of the three other ultra short-period, low-mass,disintegrating planet candidates that have been claimed to date(KIC 12557548; Rappaport et al. 2012, KOI-2700b; Rappaport
et al. 2014, and K2-22b; Sanchis-Ojeda et al. 2015)—thesecharacteristics are interpreted as being due to a variable amountof material disintegrating from the planets/planetesimals thatcondenses at altitude into a dusty cometary tail streamingbehind the planets/planetesimals.That WD 1145+017 might be the best example of a white
dwarf orbited by close-in planets/planetesimals is strengthenedby two additional lines of evidence: the spectrum of WD 1145+017 is significantly polluted, and it displays an infraredexcess. A visible spectrum of WD 1145+017 revealed spectrallines of calcium, aluminum, magnesium, silicon, nickel, andiron (Vanderburg et al. 2015); as the settling time of theseelements is rapid (∼1 million years) compared with the age ofthis white dwarf (∼175 million years), these elements musthave recently accreted onto the white dwarf. Vanderburg et al.(2015) also found evidence for an infrared excess likely arisingfrom a ∼1150 K warm dusty debris disk; such a debris diskcould be the source of the planetesimals that have beenobserved to pass in front of this white dwarf.WD 1145+017 is arguably the most compelling example of
the many white dwarfs that have been observed to besignificantly polluted as a result of what has been claimed tobe the accretion of rocky bodies. Approximately 1/3 of allwhite dwarfs cooler than 20,000 K display the presenceof elements heavier than hydrogen/helium (Zuckermanet al. 2003, 2010; Koester et al. 2014); for white dwarfs of
The Astrophysical Journal, 836:82 (16pp), 2017 February 10 doi:10.3847/1538-4357/836/1/82© 2017. The American Astronomical Society. All rights reserved.
1

these temperatures, elements heavier than hydrogen and heliumsink beneath the outer layers quickly compared to the coolingtime. Although it was originally suggested that this materialoriginated from the interstellar medium (e.g., Dupuiset al. 1993), the currently accepted, canonical origin for theseelements is that they resulted from material from asteroids ormore massive rocky bodies that have been orbitally perturbed(Debes & Sigurdsson 2002), are tidally disrupted—often into adebris disk—and then material from these bodies gradually orquickly accretes onto the white dwarf (Jura 2003; Zuckermanet al. 2010). The reason that the origin of these pollutingelements is thought to result from rocky bodies is that analysesof high-resolution spectra of polluted white dwarfs haveallowed the elemental abundances of these polluting materialsto be measured, and they are broadly consistent with rocky,terrestrial solar system bodies with refractory-rich and volatile-poor material10 (e.g., Zuckerman et al. 2007; Dufour et al.2010; Klein et al. 2010).
One method of lending credence to the disintegrating planet/planetesimal candidate scenario is through multiwavelengthobservations to constrain the particle size of the dusty materialin the cometary tails trailing these objects. This has already
been attempted for the candidate disintegrating planet KIC12557548b; optical and near-infrared observations of twotransits of KIC 12557548b suggested that the grain sizestrailing KIC 12557548b were ∼0.5μm in radius or larger(Croll et al. 2014), while optical multiwavelength observationssuggested the particle sizes were 0.25–1.0μm (Bochinskiet al. 2015). Multiwavelength optical photometry of one transitof the disintegrating low-mass candidate exoplanet K2-22bsuggests approximate particle sizes of 0.2–0.4μm in thecometary tail trailing that body (Sanchis-Ojeda et al. 2015).For the candidate planetesimals orbiting WD 1145+017,
multiwavelength observations may help determine the mech-anism that generates the dust that is believed to be trailing theseobjects. The preferred explanation of Vanderburg et al. (2015)for the apparent dusty tails was that the high temperatures ofthese planetesimals in these short-period orbits would result inmaterial sublimating off the planetesimals’ surfaces withsufficient thermal speed to overcome the escape speed onthese low surface gravity objects; at altitude these vapors wouldcondense into dust. For the other disintegrating, planet-masscandidates, vapor is believed to be driven from the highersurface gravity of these planets by a Parker-wind, beforesimilarly condensing into dust at altitude (Rappaportet al. 2012, 2014; Perez-Becker & Chiang 2013; Sanchis-Ojeda et al. 2015). In these other disintegrating systems, the
Table 1Observing Log
Date Telescope Observing Duration Exposure Overheada Airmass Conditions Apertureb
(UTC) and Instrument Band (hr) Time (s) (s) (pixels)
2015 May 08 Perkins/PRISM V 3.85 45 6.3 1.21 1.20 1.98 Occasional clouds 8, 16, 242015 May 08 FLWO/KeplerCam V 1.77 60 16.0 1.16 1.30 Occasional clouds 8, 20, 322015 May 09 MINERVA T1 R 3.88 60 6.0 1.16 2.19 Clear 8, 20, 322015 May 09 MINERVA T3 air 3.77 60 6.0 1.16 2.22 Clear 8, 20, 322015 May 09 MINERVA T4 air 4.50 60 6.0 1.18 1.16 1.99 Clear 8, 20, 322015 May 10 MINERVA T1 R 5.15 60 6.0 1.16 5.81 Clear 8, 20, 322015 May 10 MINERVA T2 V 4.91 60 6.0 1.16 4.86 Clear 8, 20, 322015 May 10 MINERVA T3 air 4.46 60 6.0 1.20 7.91 Clear 8, 20, 322015 May 10 MINERVA T4 air 2.79 60 6.0 1.52 7.94 Clear 8, 20, 322015 May 11 DCT/LMI V 3.40 30 8.6 1.48 1.03 Clear 13, 25, 352015 May 11 FLWO/KeplerCam V 4.53 60 16.0 1.17 1.16 2.17 Clear 8, 20, 322015 May 11 MINERVA T1 R 2.17 60 6.0 1.24 1.92 Clear 8, 20, 322015 May 11 MINERVA T2 V 4.17 60 6.0 1.17 1.16 1.91 Clear 8, 20, 322015 May 11 MINERVA T3 air 4.24 60 6.0 1.18 1.16 1.92 Clear 8, 20, 322015 May 11 MINERVA T4 air 4.21 60 6.0 1.17 1.16 1.92 Clear 8, 20, 322015 May 12 Perkins/PRISM R 3.96 45 6.0 1.21 1.20 1.97 Clear 8, 16, 242015 May 12 MINERVA T1 V 3.99 60 6.0 1.16 1.91 Occasional clouds 8, 20, 322015 May 12 MINERVA T2 V 4.15 60 6.0 1.17 1.16 1.91 Occasional clouds 8, 20, 322015 May 12 MINERVA T3 air 3.99 60 6.0 1.16 1.90 Occasional clouds 8, 20, 322015 May 12 MINERVA T4 air 4.15 60 6.0 1.17 1.16 1.91 Occasional clouds 8, 20, 322015 May 13 Perkins/PRISM V 2.34 45 6.5 1.26 1.97 Thin clouds to clear 8, 16, 242015 May 13 MINERVA T1 R 1.56 60 6.0 1.34 1.94 Occasional clouds 8, 20, 322015 May 13 MINERVA T2 B 4.13 60 6.0 1.17 1.16 1.95 Occasional clouds 8, 20, 322015 May 13 MINERVA T4 air 4.13 60 6.0 1.16 1.95 Occasional clouds 8, 20, 322015 May 18 DCT/LMI R 0.96 30 8.5 1.27 1.43 Clear 10, 20, 302015 May 18 MINERVA T1 R 3.20 60 6.0 1.16 1.88 Clear 8, 20, 322015 May 18 MINERVA T2 B 3.72 60 6.0 1.16 1.93 Clear 8, 20, 322015 May 18 MINERVA T4 air 3.71 60 6.0 1.16 1.93 Clear 8, 20, 322015 May 22 Perkins/PRISM R 2.79 45 6.0 1.22 1.90 Clear 8, 16, 242015 May 23 Perkins/PRISM R 2.15 45 7.0 1.22 1.59 Occasional clouds 8, 16, 24
Notes.a The overhead includes time for read-out, and any other applicable overheads.b We give the radius of the aperture, the radius of the inner annulus and the radius of the outer annulus that we use for sky subtraction in pixels.
10 Although there have now been a few polluted white dwarfs with spectra thatare believed to result from volatile/water-rich asteroids (e.g., Farihi et al. 2013;Raddi et al. 2015).
2
The Astrophysical Journal, 836:82 (16pp), 2017 February 10 Croll et al.

presumed higher planet masses of these candidates, andtherefore the higher surface gravities, require a Parker-wind,compared to the assumed Ceres-mass planetesimals of the WD1145+017 system, where the lower surface gravities allowmaterial to freely stream from the planetesimals. Alternativepossibilities to explain the dusty material in the cometary tailsof the planetesimals in this system include (i) that these bodiescould be similar to comets in our own solar system with lowenough surface gravities that their dust tails are carried off bythe disintegration of volatiles, (ii) that these planetesimals andtheir cometary tails are the result of collisions with otherplanetesimals in the system or the observed debris disk, or (iii)that tidal forces from the white dwarf have ripped larger bodiesapart, or are in the process of ripping apart such bodies, and weare observing the tidally disrupted bodies that have possiblyformed the observed debris disk. The rigid-body Roche limitfor a Ceres-density asteroid around this white dwarf (using theassumed white-dwarf mass of 0.6 M ; Vanderburg et al. 2015)is at an orbital period of ∼3.4 hr, suggesting that if theseplanetesimals are similar to the asteroids in our own solarsystem they should already be subjected to considerable tidal
forces that may be threatening to rip them apart. In the lattertwo cases of a collision or a tidally disrupted body, shear wouldlikely quickly result in material trailing behind the planetesi-mals (Veras et al. 2014), forming cometary tails. Naively, atidally disrupted body would suggest larger particle sizes in thetrailing tails, if they are similar to disrupted bodies in ourown solar system (e.g., Michikami et al. 2008; Jewittet al. 2010, 2013).Here we report a wealth of multiwavelength follow-up
photometry of WD 1145+017 that considerably strengthensthe conclusion that this star is being orbited by a number oflow-mass bodies with dusty trails trailing behind them. Wepresent multiwavelength ground-based photometry from avariety of telescopes in Section 2; we display a number ofsignificant decrements in flux of up to ∼30% of the stellar flux,likely the result of planetesimals with dusty tails passing infront of the white dwarf host and scattering light out of the lineof sight. We analyze the depths, duration, and timing of theseeclipses in Section 3; the egress timescale of these transits isusually longer than the ingress timescale, and the transitduration is longer than we would expect for a circular orbit of
Figure 1. Perkins/PRISM, DCT/LMI, FLWO/KeplerCam, and MINERVA photometric observations of WD 1145+017. The UTC date of observations are given inthe lower-left of each panel, while the telescope and band of observations are given in the legend at the lower-right. The minutes from mid-event for each night ofobservations are given from the deepest decrement in flux observed in each night, if this decrement in flux is believed to be statistically significant. For the“MINERVA air x2” and “MINERVA V-band x2” data, observations of two MINERVA telescopes in the “air” and V-bands respectively, have been combined usingtheir weighted mean.
3
The Astrophysical Journal, 836:82 (16pp), 2017 February 10 Croll et al.

an Earth-sized body at these short periods, findings that areboth consistent with the hypothesis that this system containsshort-period planetesimals trailed by dusty, cometary tails. Theexact periods of these planetesimals are uncertain, but severalobjects appear to have periods of approximately ∼4.5 hr; withthis many objects with nearly identical periods it is unclearwhether the orbits of these objects are stable. Lastly, the ratio ofthe transit depths from our multiwavelength V and R-bandobservations allow us to conclude that if the dust grains trailingthe planetesimals in the WD 1145+017 system are all of asingle size then they have a radius of ∼0.15μm or larger, or∼0.06μm or smaller, with 2σ confidence.
2. Observations
We observed WD 1145+017 on a variety of nights in 2015May with a number of different ground-based telescopes.These include the Discovery Channel Telescope (DCT) and itsLarge Monolithic Imager (LMI; Massey et al. 2013), thePerkins 1.8 m telescope and its PRISM imager (Janeset al. 2004), the Fred L. Whipple Observatory 1.2 m telescopeand its KeplerCam imager (Szentgyorgyi et al. 2005), and thefour MINERVA 0.7 m robotic telescopes, labeled T1-T4 (Swiftet al. 2015). We summarize these observations in Table 1. Forthe DCT/LMI observations, we utilized 4-amplifier read-outand 2×2 pixel binning to improve the duty-cycle. The DCT/LMI, Perkins/PRISM and MINERVA data are processed bydark/bias subtracting the data, and then we divide through by asky-flat. The FLWO/KeplerCam data are processed using the
techniques discussed in Carter et al. (2011). Aperturephotometry is performed using the techniques discussed inCroll et al. (2015) and references therein; the aperture radii, andthe radii of the inner and outer annuli we use to subtract the skyare given in Table 1. The filters used on the various telescopeswere: the DCT/LMI observations utilized an Andover V-bandfilter and a Kron Cousins R-band filter, the FLWO/KeplerCamobservations utilized a Harris V-filter, the MINERVA observa-tions utilized Johnson B, V and R-band filters, while the thePerkins/PRISM observations utilized Johnson V and R-bandfilters. The MINERVA “air”-band observations are simplythose conducted without a filter, and therefore the wavelengthdependence is given by the quantum efficiency of theMINERVA CCDs (Swift et al. 2015); the MINERVA CCDsare quantum efficient across a wide wavelength range—fromnear-ultraviolet to near-infrared wavelengths—with centralwavelengths of: ∼0.64μm for the MINERVA T1 and T4telescopes, and ∼0.71μm for the MINERVA T3 telescope.11
As our observations indicate that WD 1145+017 displayslow level variability, likely due to dusty material passingconsistently in front of the star (see Section 3.5), to estimate theerrors on our photometry we cannot take the root mean squareof the differential photometry of WD 1145+017; instead wetake the mean of the root mean square of the differentialphotometry of nearby reference stars that have similar apertureflux values as WD 1145+017 (we take the mean of the rootmean square of the differential photometry of all stars, that are
Figure 2. DCT, Perkins, FLWO, and MINERVA multiwavelength photometry of WD 1145+017, zoomed-in on durations when significant decrements in flux areobserved. The UTC dates of observations are given in the lower-left of each panel, while the telescope and band of observations are given in the legend at the lower-right. For the “MINERVA air x2” and “MINERVA V-band x2” data, observations of two MINERVA telescopes in the “air” and V-bands respectively, have beencombined using their weighted mean. The minutes from mid-event are given from the deepest decrement in flux observed in each panel.
11 The MINERVA T2 telescope observed only in the B and V-bands.
4
The Astrophysical Journal, 836:82 (16pp), 2017 February 10 Croll et al.

not obvious variables, with aperture flux values within 20% ofWD 1145+017). All the Julian dates have been converted toand presented as barycentric Julian dates using the terrestrialtime standard (Eastman et al. 2010).
We present our DCT, Perkins, FLWO, and MINERVAobservations in Figure 1. We observe occasional significantdecrements in flux of up to ∼30% that we interpret as objects,likely with dusty tails streaming behind them, passing in frontof the white dwarf along our line of sight. We present ourmulti-telescope, and often multiwavelength, observations ofthese significant flux decrements in Figure 2.
3. Analysis
For our light curves where a significant flux decrement isobserved we fit the apparent asymmetric transit dips with an“asymmetric hyperbolic secant,” which has been appliedpreviously to fit the transit profile of the candidate disintegrat-ing low-mass planet KOI-2700b (Rappaport et al. 2014). As theperiods of the planetesimals around WD 1145+017 are notwell defined, we replace the explicit reference to phase withthat of the time, t, in the asymmetric hyperbolic secantexpression of Rappaport et al. (2014); therefore the profile wefit our transits with has a flux, F, at time, t, of:
( ) [ ] ( )( ) ( )= - +t t t t- - - -F t F C e e 1t t0
10 1 0 2
F0 is the out-of-transit flux, C/2 is approximately the transitdepth as indicated in Equation (2), t0 is approximately thetransit mid-point, and t1 and t2 are the characteristic durationsof the ingress and egress, respectively. The minimum of thefunction has a depth—which we will refer to as the transitdepth, D—given by:
( )( )xx
=+
x x+D
C
12
1
and occurs at a time Tmin of:
( ) ( )tt t t t
t t= +
+T
ln3min 0
1 2 2 1
1 2
where ξ=t t2 1.For those transits that we observe with a single telescope we
fit these light curves individually using Equation (1); the resultsare given at the bottom of Table 2 and are presented inFigure 3. For the transits where we are able to obtain multi-telescope coverage, and usually multiwavelength coverage, wefit F0 and C individually for each light curve, while fitting t0, t1and t2 jointly. The results for the joint fits are given at the topof Table 2 and are presented in Figure 4. We quote D and Tmin ,rather than C and t0, in Table 2. We use Markov Chain MonteCarlo (MCMC) fitting, as described for our purposes in Croll(2006). As a metric of the goodness-of-fit we also quote thereduced c2 (cR
2 ) in Table 2; occasionally we observe large cR2
values, and in some cases we believe this may be evidence forlow-level variability of WD 1145+017, which we discuss indetail in Section 3.5. When multiple apparent dips are observedin a single evening of observations, we differentiate betweenthese different transits using a letter label; we label the firsttransit of the evening with “A,” the next with “B,” and so-on.We note that we bin our asymmetric hyperbolic secant modelto account for the finite exposure times when comparing withour photometry during our fitting process.
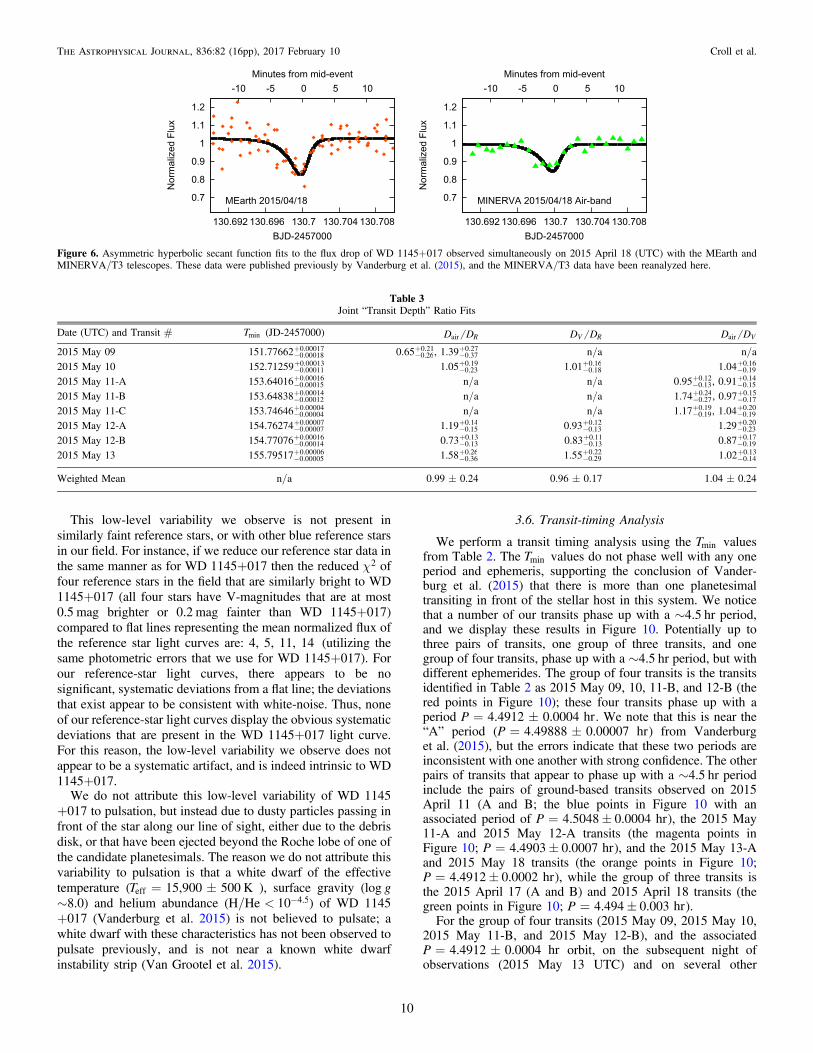
We also fit the ∼40% occultations of WD 1145+017 thatwere detected with the FLWO and MEarth telescopes that werepublished in Vanderburg et al. (2015); we also confirm two otherevents that were listed as possible events in Vanderburg et al.(2015), including an additional ∼25% event observed with theFLWO on 2015 March 22, and a ∼15% event observed on 2015April 18 with the MEarth and MINERVA/T3 telescopes. TheMEarth data are reduced and photometry is produced as outlinedin Vanderburg et al. (2015), while the FLWO and MINERVA/T3 data are reduced as discussed in Section 2. The MINERVA/T3 data on 2015 April 18 (UTC) were obtained with thealtitude–azimuth derotator not functioning, and therefore sufferfrom systematics that are most apparent after the drop in flux thatwe interpret as a transit that evening; we therefore, conserva-tively, artificially scale up the errors on these points to 10%, anddo not use this transit for transit depth comparisons. The fits tothe Vanderburg et al. (2015) photometry are presented inFigures 5 and 6, and are given in Table 2.Lastly, we summarize the ratio of the transit depths, D, we
find for our multiwavelength observations in Table 3.
3.1. The Frequency of Significant Transits
In Table 2 we present nine transits with depths, D, greaterthan ∼10% of the stellar flux from our 2015 May photometry.The number of non-overlapping hours of observation fromMINERVA, FLWO, the DCT, or the Perkins telescope duringthe month of 2015 May that would be sensitive12 to thesenine significant transits is ∼32 hr; therefore during ourobservations the frequency of 10% transit dips is ∼0.28 perhour, or ∼3.6 hr per significant event.
3.2. Transit Duration Changes
We approximate the transit duration by 3×( )t t+ ;1 2 thiscaptures ∼94% of the area of the asymmetric hyperbolic secantcurve, and appears to qualitatively match the approximatetransit duration as indicated by visually inspecting Figures 3–6.The weighted mean of the transit durations we measure is:3×( )t t+1 2 =7.49± 0.15minute. In comparison the cross-ing time of an object with a 4.5–4.9 hr period in a circular orbitaround WD 1145+017 should be ∼1 minute.If we assume that all the ground-based eclipses in Table 2 have
the same transit duration, the reduced c2 of this model is 12.6.Therefore, there may be evidence that the transit duration is notconstant for the transits we observe. For instance, the 2015 May11 “A” transit has an eclipse duration of 3×( )t t+1 2 =10.0-
+1.61.4
minute. We display the transit duration of the eclipses observedfrom the ground in the top panel of Figure 7.Our mean transit duration also informs us on the size of the
occulting region transiting in front of the white dwarf—in thiscase the size, or the length, of the candidate planetesimal andthe cometary tail streaming behind it. Using the typicalequation for the transit duration (Equation (14) of Winn 2010)and assuming a circular, edge-on orbit with a ∼4.5 hr period,the stellar radius and mass (R*=1.4 R⊕; M*=0.6 Me)quoted in Vanderburg et al. (2015), and a planetesimal massmuch lower than the stellar mass, a transit duration of3×( )t t+1 2 ∼ 7.49 minutes is produced by an occultingregion of size Ro ∼ 9.5 R⊕.
12 To be conservative we exclude ∼10 minutes at the start and end of eachnight of observations, and exclude data with significant cloud cover, or that isotherwise unreliable.
5
The Astrophysical Journal, 836:82 (16pp), 2017 February 10 Croll et al.

Table 2Hyperbolic Secant Fits
Date (UTC) Telescope Band F0 D (%) Tmin t1 t2 t2/t1 3×(t t+2 1) cR2
and Transit # (JD-2457000) (minute) (minute) (minute)
Joint Fits2015 May 09 MINERVA/T1 R 1.005-
+0.0090.009 14.5-
+4.03.6 151.77662-
+0.000180.00017 0.20-
+0.200.10 1.96-
+0.730.52 8.3-
+7.14.7 6.5-
+2.31.6 5.99-
+0.150.11
2015 May 09 MINERVA/T3 Air 1.042-+
0.0080.007 20.1-
+3.82.9
2015 May 09 MINERVA/T4 Air 1.000-+
0.0090.009 9.2-
+3.53.1
2015 May 10 MINERVA/T1 R 1.028-+
0.0080.008 27.7-
+5.14.5 152.71259-
+0.000110.00013 0.35-
+0.210.17 1.08-
+0.320.27 3.0-
+2.31.6 4.3-
+1.21.0 1.94-
+0.060.05
2015 May 10 MINERVA/T2 V 1.018-+
0.0050.005 28.1-
+3.33.0
2015 May 10 MINERVA/T3 Air 1.021-+
0.0120.012 29.2-
+5.14.7
2015 May 11-A FLWO V 1.018-+
0.0050.004 11.0-
+0.80.9 153.64016-
+0.000150.00016 1.92-
+0.380.33 1.42-
+0.400.32 0.7-
+0.30.2 10.0-
+1.61.4 2.09-
+0.150.10
2015 May 11-A MINERVA/T3 Air 1.026-+
0.0060.005 10.5-
+1.21.2
2015 May 11-A MINERVA/T4 Air 0.999-+
0.0070.007 10.1-
+1.41.4
2015 May 11-B FLWO V 1.016-+
0.0050.005 11.0-
+1.51.2 153.64838-
+0.000120.00014 0.37-
+0.160.18 2.59-
+0.460.41 7.0-
+3.62.5 8.9-
+1.51.3 1.77-
+0.250.17
2015 May 11-B MINERVA/T2 V 1.045-+
0.0100.009 19.2-
+2.62.2
2015 May 11-B MINERVA/T3 and T4 Air 1.021-+
0.0050.005 10.6-
+1.91.6
2015 May 11-C DCT V 0.996-+
0.0000.000 3.8-
+0.10.1 153.74646-
+0.000040.00004 1.44-
+0.100.10 1.15-
+0.100.09 0.8-
+0.10.1 7.8-
+0.40.4 56.89-
+0.060.05
2015 May 11-C FLWO V 0.996-+
0.0020.002 4.4-
+0.70.7
2015 May 11-C MINERVA/T3 and T4 Air 0.999-+
0.0020.002 4.0-
+0.70.7
2015 May 12-A Perkins R 1.005-+
0.0020.002 13.0-
+0.80.8 154.76274-
+0.000070.00007 0.79-
+0.150.14 1.23-
+0.220.20 1.6-
+0.50.4 6.1-
+0.80.7 2.05-
+0.120.09
2015 May 12-A MINERVA/T1 and T2 V 1.000-+
0.0050.005 12.0-
+1.61.5
2015 May 12-A MINERVA/T3 and T4 Air 1.000-+
0.0050.005 15.5-
+1.81.8
2015 May 12-B Perkins R 1.022-+
0.0020.002 14.1-
+1.31.1 154.77076-
+0.000140.00016 0.16-
+0.120.08 2.62-
+0.320.32 14.0-
+7.65.8 8.3-
+1.01.0 2.82-
+0.110.08
2015 May 12-B MINERVA/T1 and T2 V 1.010-+
0.0050.004 11.8-
+1.61.5
2015 May 12-B MINERVA/T3 and T4 Air 1.006-+
0.0050.005 10.4-
+1.91.7
2015 May 13-A MINERVA/T1 R 0.991-+
0.0050.005 16.2-
+2.72.7 155.79517-
+0.000050.00006 0.33-
+0.070.06 1.03-
+0.140.13 3.1-
+0.90.8 4.1-
+0.50.4 1.45-
+0.060.05
2015 May 13-A Perkins V 1.007-+
0.0030.003 25.1-
+1.41.4
2015 May 13-A MINERVA/T4 Air 0.996-+
0.0060.006 25.6-
+3.53.2
Individual Fits2015 May 13-B Perkins V 1.017-
+0.0050.005 15.9-
+4.43.1 155.81033-
+0.000110.00010 0.36-
+0.260.18 0.66-
+0.220.21 1.9-
+1.51.0 3.0-
+1.00.8 2.95-
+0.420.26
2015 May 18 MINERVA/T4 Air 0.998-+
0.0070.007 32.8-
+6.34.6 160.66062-
+0.000100.00010 0.43-
+0.160.16 0.59-
+0.250.25 1.4-
+1.10.7 3.1-
+0.90.9 1.92-
+0.520.38
Individual Fits to Ground-Based Eclipses Presented by Vanderburg et al. (2015)2015 Mar 22 FLWO V 0.999-
+0.0020.002 19.6-
+3.32.5 104.69519-
+0.000190.00018 1.61-
+0.210.20 0.21-
+0.210.11 0.1-
+0.10.1 5.5-
+0.90.7 6.16-
+0.120.07
2015 Apr 11-A FLWO V 1.023-+
0.0010.001 56.5-
+1.11.2 123.66918-
+0.000030.00003 0.43-
+0.040.04 2.40-
+0.080.08 5.6-
+0.60.5 8.5-
+0.30.3 24.49-
+0.090.05
2015 Apr 11-B FLWO V 1.028-+
0.0010.002 49.6-
+0.80.7 123.85688-
+0.000040.00004 1.20-
+0.070.07 2.07-
+0.100.10 1.7-
+0.20.2 9.8-
+0.40.3 8.34-
+0.080.05
2015 Apr 17-A MEarth MEarth 1.012-+
0.0170.017 42.0-
+16.313.9 129.57600-
+0.000290.00035 0.98-
+0.610.47 0.85-
+0.810.41 0.8-
+0.80.6 5.5-
+3.01.9 0.28-
+0.030.02
2015 Apr 17-B MEarth MEarth 1.034-+
0.0200.019 26.7-
+10.410.0 129.76344-
+0.000540.00047 1.39-
+1.220.81 1.93-
+1.420.95 1.3-
+1.21.0 10.0-
+5.63.8 0.52-
+0.030.02
Joint Fits to Ground-Based Eclipses Presented by Vanderburg et al. (2015)2015 Apr 18 MEarth MEarth 1.027-
+0.0150.014 14.9-
+7.36.3 130.69954-
+0.000620.00062 2.41-
+1.901.36 1.73-
+1.490.88 0.7-
+0.70.4 12.4-
+7.24.9 0.24-
+0.020.02
2015 Apr 18 MINERVA/T3 Air 1.004-+
0.0230.018 12.7-
+7.06.0
6
TheAstro
physica
lJourn
al,
836:82(16pp),
2017February
10Croll
etal.
3.3. Transit Profiles and a Limit on the Variability ofthe Ratio of Egress to Ingress Times
The weighted mean of the ratio of the egress to ingresstimes for all the ground-based transits in Table 2 ist2/t1=0.73±0.06. A constant egress to ingress time ratiomodel fits our eclipses with a reduced c2 of 11.8. Therefore theremay be evidence of variations in the ratio of egress to ingresstimes. Although the weighted mean of the ratio of the egress toingress times is just below unity, for most transits the egress lastssignificantly longer than the ingress. For a few of our ground-based transits, the ingress seems to last marginally longer than theegress, and the errors on the ratio are smaller for these transits,leading to the weighted mean being near unity. In comparison, themedian egress and ingress times from our ground-based transitsare t1=0.79minute and t2=1.42minute, respectively, and themedian ratio of the egress to ingress times is t2/t1=1.73,suggesting that indeed the egress typically lasts longer than theingress.
We display the ratio of the egress to ingress times for theeclipse observed from the ground in the bottom panel ofFigure 7. That the ingress is longer than the egress for at leastsome of our transits suggests the possibility of a leadingcometary tail in addition to a trailing cometary tail for at leastone or more of the planetesimals.
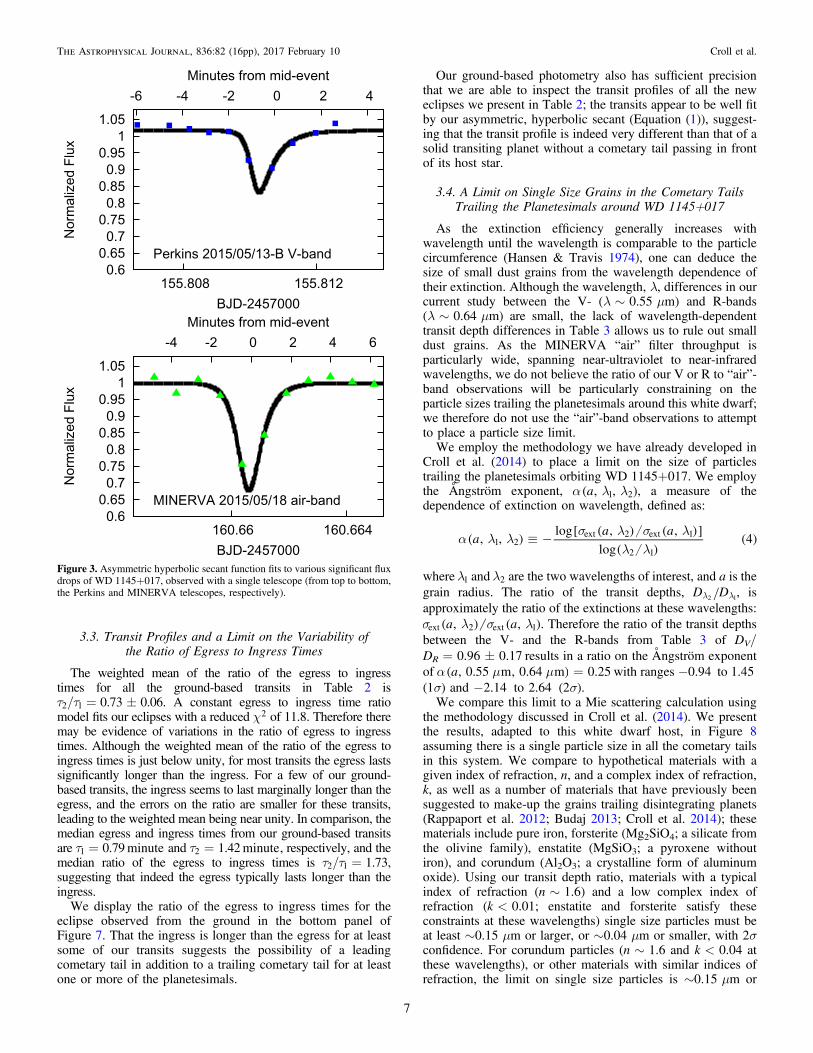
Our ground-based photometry also has sufficient precisionthat we are able to inspect the transit profiles of all the neweclipses we present in Table 2; the transits appear to be well fitby our asymmetric, hyperbolic secant (Equation (1)), suggest-ing that the transit profile is indeed very different than that of asolid transiting planet without a cometary tail passing in frontof its host star.
3.4. A Limit on Single Size Grains in the Cometary TailsTrailing the Planetesimals around WD 1145+017
As the extinction efficiency generally increases withwavelength until the wavelength is comparable to the particlecircumference (Hansen & Travis 1974), one can deduce thesize of small dust grains from the wavelength dependence oftheir extinction. Although the wavelength, λ, differences in ourcurrent study between the V- (λ∼0.55μm) and R-bands(λ∼0.64μm) are small, the lack of wavelength-dependenttransit depth differences in Table 3 allows us to rule out smalldust grains. As the MINERVA “air” filter throughput isparticularly wide, spanning near-ultraviolet to near-infraredwavelengths, we do not believe the ratio of our V or R to “air”-band observations will be particularly constraining on theparticle sizes trailing the planetesimals around this white dwarf;we therefore do not use the “air”-band observations to attemptto place a particle size limit.We employ the methodology we have already developed in
Croll et al. (2014) to place a limit on the size of particlestrailing the planetesimals orbiting WD 1145+017. We employthe Angström exponent, ( )a l la, ,1 2 , a measure of thedependence of extinction on wavelength, defined as:
( ) [ ( ) ( )]( )
( )a l ls l s l
l lº -a
a a, ,
log , ,
log41 2
ext 2 ext 1
2 1
wherel1 andl2 are the two wavelengths of interest, and a is thegrain radius. The ratio of the transit depths, l lD D2 1, isapproximately the ratio of the extinctions at these wavelengths:
( ) ( )s l s la a, ,ext 2 ext 1 . Therefore the ratio of the transit depthsbetween the V- and the R-bands from Table 3 of DV/DR=0.96±0.17 results in a ratio on the Angström exponentof ( )a m ma, 0.55 m, 0.64 m =0.25 with ranges −0.94 to 1.45(1σ) and −2.14 to 2.64 (2σ).We compare this limit to a Mie scattering calculation using
the methodology discussed in Croll et al. (2014). We presentthe results, adapted to this white dwarf host, in Figure 8assuming there is a single particle size in all the cometary tailsin this system. We compare to hypothetical materials with agiven index of refraction, n, and a complex index of refraction,k, as well as a number of materials that have previously beensuggested to make-up the grains trailing disintegrating planets(Rappaport et al. 2012; Budaj 2013; Croll et al. 2014); thesematerials include pure iron, forsterite (Mg2SiO4; a silicate fromthe olivine family), enstatite (MgSiO3; a pyroxene withoutiron), and corundum (Al2O3; a crystalline form of aluminumoxide). Using our transit depth ratio, materials with a typicalindex of refraction (n∼1.6) and a low complex index ofrefraction (k<0.01; enstatite and forsterite satisfy theseconstraints at these wavelengths) single size particles must beat least ∼0.15μm or larger, or ∼0.04μm or smaller, with 2σconfidence. For corundum particles (n∼1.6 and k<0.04 atthese wavelengths), or other materials with similar indices ofrefraction, the limit on single size particles is ∼0.15μm or
Figure 3. Asymmetric hyperbolic secant function fits to various significant fluxdrops of WD 1145+017, observed with a single telescope (from top to bottom,the Perkins and MINERVA telescopes, respectively).
7
The Astrophysical Journal, 836:82 (16pp), 2017 February 10 Croll et al.
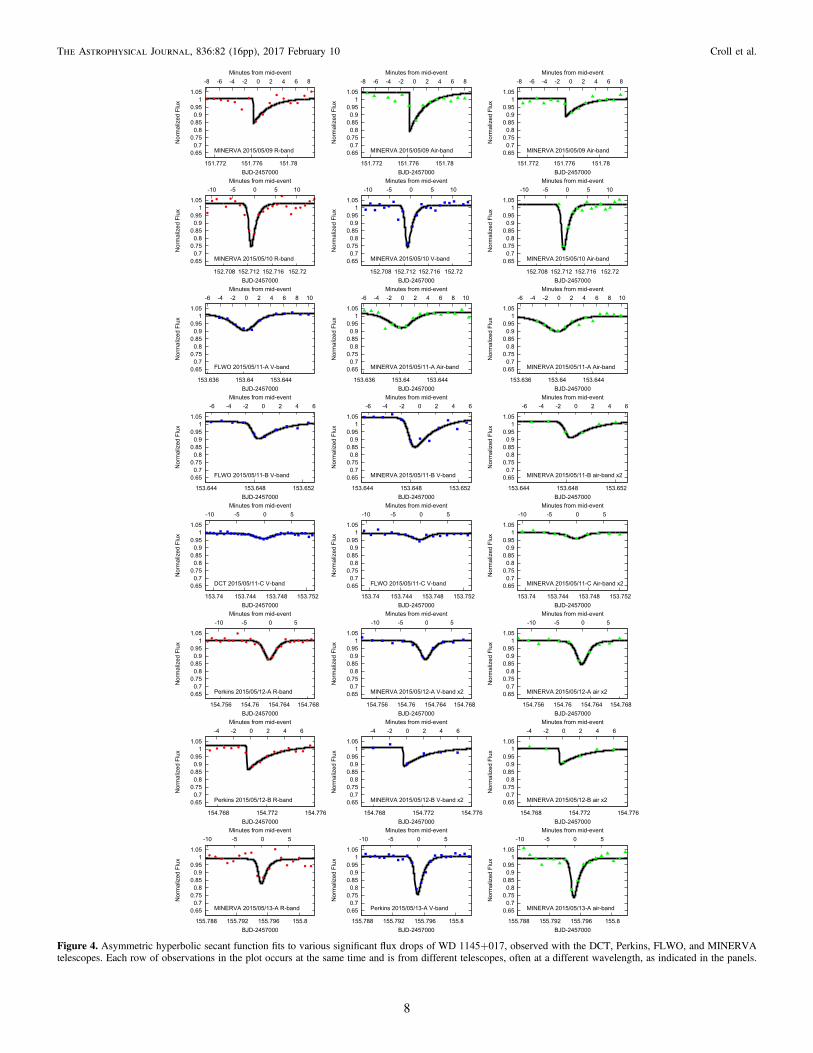
Figure 4. Asymmetric hyperbolic secant function fits to various significant flux drops of WD 1145+017, observed with the DCT, Perkins, FLWO, and MINERVAtelescopes. Each row of observations in the plot occurs at the same time and is from different telescopes, often at a different wavelength, as indicated in the panels.
8
The Astrophysical Journal, 836:82 (16pp), 2017 February 10 Croll et al.

larger, or ∼0.06μm or smaller, with 2σ confidence. We cannotplace a limit on pure iron particles, or on other materials with ahigh complex index of refraction (k>0.1).These limits prompt the question of whether such small iron,
corundum, enstatite, and forsterite particles could survive for longenough to create the observed transits in the ∼1100 Kenvironment (assuming the dust particles reradiate isotropically)at these short orbital periods around this white dwarf. Theexpected time for grains to travel the length of the cometary tail inthis system (from Equation (6) of Rappaport et al. 2012, using thesize of the occulting region, Ro=9.5 R⊕ from Section 3.2) is∼1.6 ×10³ s. Kimura et al. (2002) presents the sublimationlifetimes of various grains at various solar insolation levels. Thestellar insolation of a dust grain in a ∼4.5 hr period around WD1145+017 is equivalent to an orbit of 12 Re around our Sun(ignoring the difference in the shape of the stellar spectra); at thesedistances an amorphous olivine particle of size a ∼ 0.15μmsurvives for ∼100 s, while similar size crystalline olivines andpyroxenes survive for several orders of magnitude longer. Iron,which has a vapor pressure ∼50 times greater than that forolivines (Perez-Becker & Chiang 2013), and non-crystallineforsterite, seem unlikely to survive for the travel time required tocreate the observed transit durations. Orthoclase, albite, andfayalite were also mentioned by Vanderburg et al. (2015) aspossible materials that might make up the cometary tails of theseplanetesimals; as they have similar or higher vapor pressures thaniron, it seems unlikely that small particles of these materials couldsurvive for long enough to create the observed transit durations.Crystalline forsterite, enstatite, and corundum of ∼0.15μm orlarger should survive for long enough without sublimating totravel the length of the occulting region. Generally, sublimationtimescales, tsub, scale with the radius of the particle (Lebertonet al. 2015), and therefore a related question is whether particlessmaller than ∼0.15μm are likely to survive the stellar insolationlevels in this system for the required travel time. Even very smallpyroxene particles, such as enstatite, should be able to survivethese stellar insolation levels; it is less clear whether very smallcrystalline olivines, such as forsterite, are able to survive withoutsublimating. Given these arguments, henceforth we quote ourlimit on the radius of single-size particles in this system of∼0.15μm or larger, or∼0.06μm or smaller, with 2σ confidence,which applies to crystalline forsterite, enstatite, corundum, andmaterials with similar properties.
3.5. The Low-level Variability of WD 1145+017
Our photometry of WD 1145+017 also displays low-levelvariability; this low-level variability is best displayed in our2015 May 11 and 18 DCT/LMI photometry of WD 1145+017(Figure 9). On 2015 May 11 the variability we observe in ourDCT light curve is generally consistent with the FLWO andMINERVA observations taken simultaneously.13 For our 2015May 11 photometry, even after excluding the data around thesignificant flux decrement at BJD-2457000 ∼ 153.74646 (weexclude data from BJD-2457000=153.735 to 153.750), thereduced c2 of our data compared to a flat line representing themean normalized flux is ∼65, suggesting a flat line is anextremely poor fit to the data.
Figure 5. Asymmetric hyperbolic secant function fits to the significant fluxdrops of WD 1145+017 published previously by Vanderburg et al. (2015), andobserved with the FLWO and MEarth telescopes.
13 On 2015 May 18 the MINERVA data obtained simultaneously is not ofsufficient precision to make the statement that it is generally consistent (orinconsistent) with the DCT data obtained simultaneously.
9
The Astrophysical Journal, 836:82 (16pp), 2017 February 10 Croll et al.
This low-level variability we observe is not present insimilarly faint reference stars, or with other blue reference starsin our field. For instance, if we reduce our reference star data inthe same manner as for WD 1145+017 then the reduced c2 offour reference stars in the field that are similarly bright to WD1145+017 (all four stars have V-magnitudes that are at most0.5 mag brighter or 0.2 mag fainter than WD 1145+017)compared to flat lines representing the mean normalized flux ofthe reference star light curves are: 4, 5, 11, 14 (utilizing thesame photometric errors that we use for WD 1145+017). Forour reference-star light curves, there appears to be nosignificant, systematic deviations from a flat line; the deviationsthat exist appear to be consistent with white-noise. Thus, noneof our reference-star light curves display the obvious systematicdeviations that are present in the WD 1145+017 light curve.For this reason, the low-level variability we observe does notappear to be a systematic artifact, and is indeed intrinsic to WD1145+017.
We do not attribute this low-level variability of WD 1145+017 to pulsation, but instead due to dusty particles passing infront of the star along our line of sight, either due to the debrisdisk, or that have been ejected beyond the Roche lobe of one ofthe candidate planetesimals. The reason we do not attribute thisvariability to pulsation is that a white dwarf of the effectivetemperature (Teff =15,900±500 K ), surface gravity (log g∼8.0) and helium abundance (H/He< -10 4.5) of WD 1145+017 (Vanderburg et al. 2015) is not believed to pulsate; awhite dwarf with these characteristics has not been observed topulsate previously, and is not near a known white dwarfinstability strip (Van Grootel et al. 2015).
3.6. Transit-timing Analysis
We perform a transit timing analysis using the Tmin valuesfrom Table 2. The Tmin values do not phase well with any oneperiod and ephemeris, supporting the conclusion of Vander-burg et al. (2015) that there is more than one planetesimaltransiting in front of the stellar host in this system. We noticethat a number of our transits phase up with a ∼4.5 hr period,and we display these results in Figure 10. Potentially up tothree pairs of transits, one group of three transits, and onegroup of four transits, phase up with a ∼4.5 hr period, but withdifferent ephemerides. The group of four transits is the transitsidentified in Table 2 as 2015 May 09, 10, 11-B, and 12-B (thered points in Figure 10); these four transits phase up with aperiod P=4.4912±0.0004 hr. We note that this is near the“A” period (P=4.49888±0.00007 hr) from Vanderburget al. (2015), but the errors indicate that these two periods areinconsistent with one another with strong confidence. The otherpairs of transits that appear to phase up with a ∼4.5 hr periodinclude the pairs of ground-based transits observed on 2015April 11 (A and B; the blue points in Figure 10 with anassociated period of P=4.5048± 0.0004 hr), the 2015 May11-A and 2015 May 12-A transits (the magenta points inFigure 10; P=4.4903± 0.0007 hr), and the 2015 May 13-Aand 2015 May 18 transits (the orange points in Figure 10;P=4.4912± 0.0002 hr), while the group of three transits isthe 2015 April 17 (A and B) and 2015 April 18 transits (thegreen points in Figure 10; P=4.494± 0.003 hr).For the group of four transits (2015 May 09, 2015 May 10,
2015 May 11-B, and 2015 May 12-B), and the associatedP=4.4912±0.0004 hr orbit, on the subsequent night ofobservations (2015 May 13 UTC) and on several other
Figure 6. Asymmetric hyperbolic secant function fits to the flux drop of WD 1145+017 observed simultaneously on 2015 April 18 (UTC) with the MEarth andMINERVA/T3 telescopes. These data were published previously by Vanderburg et al. (2015), and the MINERVA/T3 data have been reanalyzed here.
Table 3Joint “Transit Depth” Ratio Fits
Date (UTC) and Transit # Tmin (JD-2457000) D DRair D DV R D DVair
2015 May 09 151.77662-+
0.000180.00017 0.65-
+0.260.21, 1.39-
+0.370.27 n/a n/a
2015 May 10 152.71259-+
0.000110.00013 1.05-
+0.230.19 1.01-
+0.180.16 1.04-
+0.190.16
2015 May 11-A 153.64016-+
0.000150.00016 n/a n/a 0.95-
+0.130.12, 0.91-
+0.150.14
2015 May 11-B 153.64838-+
0.000120.00014 n/a n/a 1.74-
+0.270.24, 0.97-
+0.170.15
2015 May 11-C 153.74646-+
0.000040.00004 n/a n/a 1.17-
+0.190.19, 1.04-
+0.190.20
2015 May 12-A 154.76274-+
0.000070.00007 1.19-
+0.150.14 0.93-
+0.130.12 1.29-
+0.230.20
2015 May 12-B 154.77076-+
0.000140.00016 0.73-
+0.130.13 0.83-
+0.130.11 0.87-
+0.190.17
2015 May 13 155.79517-+
0.000050.00006 1.58-
+0.360.26 1.55-
+0.290.22 1.02-
+0.140.13
Weighted Mean n/a 0.99±0.24 0.96±0.17 1.04±0.24
10
The Astrophysical Journal, 836:82 (16pp), 2017 February 10 Croll et al.

occasions, we have photometry that overlaps with a predictedtransit for this period and ephemeris; no obvious deep transits(>10% of the stellar flux) are observed. Similarly, the ground-based photometry of Vanderburg et al. (2015) on 2015 April 17displayed a pair of ∼40% deep transits separated by ∼4.5 hrthat was followed by ∼15% transits on the following night.Given the variability that we observe in the depths and shapesfor the transits on 2015 May 09, 10, 11-B, and 12-B, the lack oftransits on subsequent nights, and the similar deep transitsfollowed by much shallower transits displayed in the Vander-burg et al. (2015) ground-based photometry, this suggests thatthe dust tail trailing these candidate planetesimals evolvesrapidly.
On the evenings of 2015 May 11 and 2015 May 12, the 2015May 11-B and 2015 May 12-B transits come accompanied byanother event that occurs approximately ∼12 minutes earlier;this event may occur on 2015 May 10 as well.
We have attempted to phase our ground-based eclipses withthe periods and ephemerides of the A–F periods fromVanderburg et al. (2015) and include these in the bottom panelof Figure 10; our ground-based times are not obviouslycoincident with the predicted transit times from these periodsand ephemerides, and therefore we cannot provide evidence infavor of the six specific periods and ephemerides given byVanderburg et al. (2015). Arguably, this could have beenforeseen as the durations of the events in the K2 photometry are
generally inconsistent with the sharp, short-duration events thathave been observed from the ground (Vanderburg et al. 2015).Our ground-based transits also do not phase with the predictedephemerides from the ground-based MEarth and FLWO transitsand the ∼4.5 hr period observed by Vanderburg et al. (2015).We have also performed a blind period search to determine
whether there are any other compelling periods for which alarge fraction of the ground-based transit times phase up with agiven period. To perform this search, we step through infrequency space in small frequency increments from periods ofa few hours to a few days, and for each of the Tmin values wepredict future and past ephemerides using this tested period.We then determine the number of other Tmin values that areclose to the predicted ephemerides (we allow the Tmin values todiffer from the predicted ephemerides by at most 2% from theinteger number of cycles of the tested period). No period otherthan the ∼4.5 hr period was particularly compelling.Although period evolution (e.g., orbital decay) could reduce
the number of planetesimals needed to explain the number andtiming of the observed ground-based transits, nonetheless itappears that multiple planetesimals would still be required.Therefore, the timing of the eclipses we observe supportsmultiple planetesimals orbiting in close-period orbits aroundthis white dwarf, but the exact number and periods of thesebodies are unclear.
3.7. Analysis of the Persistence of the Six PeriodicTransits in the K2 Photometry
Given the apparent rapid evolution of the depths and profilesof the transits in the ground-based photometry of WD 1145+017, we reanalyzed the K2 photometry of this system todetermine whether the six claimed transiting bodies in thissystem persist in duration and depth throughout the 80 days ofK2 photometry. To do this, we split the K2 photometry intothree equal sections of ∼26.6 days; three equal 26.6 daysections were chosen as these sections were long enough induration to allow for sufficient statistical accuracy, and shortenough to allow for the evolution of these K2 signals to beinvestigated. Reduction of the photometry was performed asdiscussed in Vanderburg et al. (2015). On each third of the K2
Figure 7. Constraints on the transit duration (3t1+3t ;2 top panel) and the ratioof the egress to ingress times (t2/t ;1 bottom panel) of the transits of WD 1145+017 observed from the ground; in both panels the horizontal dashed lineshows the weighted mean of the transit duration (top) and egress to ingresstimes (bottom), while the dotted line shows the 1σ uncertainty in these values.The transit duration and the ratio of the egress to ingress times display evidencethat they may not be constant from eclipse to eclipse.
Figure 8. Plot of the Angström exponent for spherical grains of a given radiusfor various materials, and for an index of refraction of n=1.6 and for variousimaginary components of the index of refraction, k. The horizontal dashed linesgive the 1 and 2σ limits on the ratio of the transit depths, D, between our V-and R-band observations. Our limits on the Angström exponent allow us tostate that the radius of single sized grains in the dusty tails streaming behindthese planetesimals must be ∼0.15μm or larger, or ∼0.06μm or smaller, with2σ confidence.
11
The Astrophysical Journal, 836:82 (16pp), 2017 February 10 Croll et al.

photometry we perform a harmonic-summed Lomb–Scargle(LS) periodogram (Lomb 1976; Scargle 1982; Ransomet al. 2002), where the amplitudes from the first two harmonicsare added to the fundamental frequency in the period rangefrom 4 to 5 hr. We display these results, compared to theoriginal LS periodogram signal from all the K2 photometry, inFigure 11. We also phase the K2 photometry to these periods,and present the phase binned transit signals in Figure 12. Thetransit dips at the original Vanderburg et al. (2015) A (∼4.499day) and B (∼4.605 day) periods are present in all three thirdsof the K2 photometry, although they appear to vary in depth.The situation is less clear for the transits dips at the C (∼4.783day), D (∼4.550 day), E (∼4.823 day), and F (∼4.858 day)periods. For the C, D, and F periods, in addition to varying indepth, it is unclear whether these signals exist in all three thirdsof the K2 photometry; for the C and D periods it is unclearwhether the signal exists in the last third of K2 photometry,while the F period is not clearly present in the first and secondthird of K2 photometry. Although there appears to be a slightdecrement at the transit mid-point in all three thirds of the K2photometry for the E period, the statistical significance of the Eperiod detections in each third of K2 photometry are notoverwhelming. Therefore, one possibility is that this analysisindicates that the transits at the A–F periods simply evolve indepth over the 80 day of K2 photometry; another possibility isthat the transits at the C–F periods may not start to transit or
may cease to transit for up to or more than ∼26 day of the 80day of K2 photometry.
4. Discussion and Conclusions
We have presented multiwavelength, multi-telescope, ground-based photometry of the white dwarf WD 1145+017 thatrevealed nine significant dips in flux of more than 10% of thestellar flux, and up to∼30%. During our 2015 May observationswe observe a transit with a depth greater than 10% of the stellarflux on average every ∼3.6 hr of observations, likely from morethan one transiting body. Through fits to the transits that weobserve, we confirm that the transit egress timescale is usuallylonger than the ingress timescale, and that the transit duration islonger than expected for a solid body at these short periods. Allthese lines of evidence support the conclusion of Vanderburget al. (2015) that WD 1145+017 is likely orbited by multiple,low-mass planets/planetesimals in short-period orbits, likelywith dusty cometary tails trailing behind them.The exact number of planets/planetesimals orbiting WD
1145+017 and the periods of these objects is unclear. Giventhe substantial number of transit events that we observed,and that have been previously observed by Vanderburg et al.(2015), it seems likely that there are a number of planetesimalsorbiting WD 1145+017. A number of our ground-basedtransits phase up well with a ∼4.5 hr period, however theseevents are best fit by drastically different ephemerides. Four of
Figure 9. DCT/LMI observations of WD 1145+017 on UTC 2015 May 11 in the V-band (top) and on 2015 May 18 in the R-band (bottom). The observed low-levelvariability is unlikely to be due to pulsations, and is likely due to dusty material passing in front of the white dwarf and scattering light out of the line of sight.
12
The Astrophysical Journal, 836:82 (16pp), 2017 February 10 Croll et al.

our ground-based transit times are consistent with a constantephemeris and a ∼4.5 hr period, but this ephemeris is notobviously consistent with the ephemerides of our other ground-based transits, the ground-based transit ephemerides ofVanderburg et al. (2015), or the K2 periods and ephemeridesof Vanderburg et al. (2015). This suggests that there are likelymultiple objects in this system, and a number of these objectsmight have ∼4.5 hr orbital periods.14
We have also reanalyzed the K2 photometry of this system todetermine whether the signals for the six claimed transitingobjects persist throughout the K2 photometry. For four of thesix claimed signals, the K2 photometry is consistent with eitherdepths that vary to nearly undetectable levels over the 80 daysof K2 photometry, or signals that may not transit or cease to
transit during a significant fraction of the 80 days of K2photometry. This suggests that the amount of material in thecometary tails trailing these candidate planetesimals mayevolve rapidly, or that we may be observing collisions, tidalbreak-up, or gravitational interactions that cause the orbits ofthese planetesimals to rapidly evolve.15
That we are unable to establish the rough number and theexact periods of the candidate planetesimals orbiting WD 1145+017 has implications on the mass of these objects. Thesuggestion that the planetesimals orbiting WD 1145+017might be approximately Ceres-mass (∼1.6×10⁻⁴ M⊕) or less,came from an N-body simulation assuming six stable orbitswith periods from ∼4.5–4.9 hr—such a collection of short-period objects with higher masses would quickly becomeunstable. Since we are unable to confirm the strict periodicity
Figure 10. Transit-timing analysis (the black and colored points) phased to a period, P=4.4914 hr , using the mid-transit times, Tmin , and associated errors fromTable 2. The top panel features only the ground-based transit detections, while the bottom panel includes the six K2 detections from Vanderburg et al. (2015). Thex-error bars in the bottom panel signify that those data-points are averages over the ∼80 days of K2 data. Multiple separate groups of transits (four transits denotedwith red points, three transits denoted with green points, two transits denoted with with blue points, two transits denoted with magenta points, and two transits denotedwith orange points) appear to phase with a ∼4.5 hr period, which is near the “A” period of Vanderburg et al. (2015).
14 We note that while this manuscript was being revised, Gänsicke et al. (2016)and Rappaport et al. (2016) submitted manuscripts that made it much clearerthat WD 1145+017 is orbited by up to 15 or more different transiting bodies,with different ephemerides; Rappaport et al. (2016) suggest this is due tomultiple bodies being tidally ripped off a main asteroid in the system.
15 While this manuscript was under revision, Rappaport et al. (2016) submitteda manuscript that argues that the many transiting bodies in the system aresmaller fragmented pieces that are tidally broken off of a larger asteroid in thesystem.
13
The Astrophysical Journal, 836:82 (16pp), 2017 February 10 Croll et al.

suggested by the K2 photometry of this system, strict stabilityis not required by our observations and higher mass objectsmay be possible, including even planetary-mass objects;16 suchan orbital configuration is arguably unlikely, as a number ofshort-period, planet-mass objects would likely become unstableafter a few million orbits or less (Vanderburg et al. 2015),17
meaning that we would have to be observing this system duringa unique epoch in its history.
The mechanism for the mass loss leading to the cometarytails that are believed to be trailing the candidate planetesimals
in this system is also unclear. Our 2σ limit that the radius ofsingle-size particles in the cometary tails streaming behindplanetesimals in this system must be ∼0.15μm or larger, or∼0.06μm or smaller, is consistent with a variety ofscenarios.18 If the objects in this system have a mass moretypically associated with planets than planetesimals, then aParker thermal wind may be required to lift material and escapethe relatively strong surface gravity, similar to the otherdisintegrating planetary-mass candidates that have been pre-sented thus far (Perez-Becker & Chiang 2013). If the objects inthis system are planetesimal-mass objects—a more likelyscenario since the orbits of such objects could be stable for afew million orbits or more—then in this lower surface gravityregime, the dusty material may escape the planetesimal via anumber of mechanisms. For the first, analogous to comets inour own solar system (Cowan & A’Hearn 1979), vaporizationof volatiles from the planetesimal’s surface would drive dustymaterial from the surface. The second possibility is that thehigh temperature on the surface of the planetesimal wouldcause sublimation of rocky material into metal vapors. Underthese high temperatures, the thermal speed of metal vaporswould exceed the escape speed of the planetesimal; at altitudethese vapors could condense into dusty material forming theobserved cometary tails. Lastly, two other very differentmechanisms may explain the candidate planetesimals and theircometary tails: collisions with other planetesimals in the systemor with the debris disk, and tidal disruption of theseplanetesimals. For the collision scenario, if there are a numberof planetesimals with short-period orbits that are embeddedwithin, or nearby, the observed debris disk, collisions couldlead to material trailing behind the planetesimals that wouldquickly shear to form tails (Veras et al. 2014); shear would alsolead to cometary tails in a tidally disrupted body. Numericalsimulations will have to be performed to determine whethersuch scenarios are consistent with the rapid night-to-nightvariability observed in both the transit depth and shape,including that deep transits are followed a night later bysignificantly shallower transits.19
Also, our highest precision photometry, obtained with theDCT, displays low amplitude variations. These variations arenot believed to be due to pulsations from the white dwarf.Instead, this variability more likely suggests that dusty materialconsistently passes in front of the white dwarf. This observedmaterial could be either from the detected debris disk in thissystem, or could be from material that has been ejected beyondthe Roche lobe of the candidate planetesimals; either possibilitycould be consistent with the idea that these planetesimalsare analogous to the Jupiter Ring–Moon system (Burnset al. 2004). If these lower amplitude events are periodic,due, for instance, to a number of smaller planetesimals in thesystem, then these lower amplitude variations could beresponsible for the C–F periods from the K2 photometry(Vanderburg et al. 2015).
Figure 11. Summed Lomb–Scargle (LS) periodogram analysis of the K2photometry of WD 1145+017 (top panel), and the K2 photometry split in threeequal ∼26.6 day sections (bottom three panels). The vertical red dashes denotethe A–F periods of Vanderburg et al. (2015). The horizontal blue line marked“DP” denotes the frequency resolution of the LS periodogram given byDP=1/T, where T is the duration of the photometry (80 day in the top panel,and ∼26.6 day in the bottom panels).
16 We note that observations of the WD 1145+017 system that were submittedwhile this manuscript was under revision suggest that the bodies orbiting thiswhite dwarf are asteroid-mass, with the main body in the system having a massabout 1/10th the mass of Ceres (Rappaport et al. 2016).17 We also point the interested reader to the numerical simulations of Veraset al. (2016), which were submitted while this manuscript was being revised.
18 We note that while this manuscript was under revision, Alonso et al. (2016)and Zhou et al. (2016) submitted manuscripts that placed even more stringentlimits on the size of single-size particles in the cometary tails streaming behindobjects in the WD 1145+017 system: the particles must be larger than ∼0.5mm from four transits (Alonso et al. 2016) and larger than ∼0.8 mm from twotransits of the WD 1145+017 system (Zhou et al. 2016).19 This statement assumes that these transits are associated with an object witha ∼4.5 hr period, that we have identified as the most likely for at least some ofthe planetesimals we have observed.
14
The Astrophysical Journal, 836:82 (16pp), 2017 February 10 Croll et al.

That we are unable to determine the number of candidateplanetesimals, and with the rapid transit-to-transit depth orprofile evolution that we observe, suggests the possibility thatrather than observing a planet or asteroid that has beendisrupted, we may be observing a planet or asteroid in themidst of being tidal disrupted. Tidal disruption events havebeen previously suggested to endure for as short as a few years(Debes et al. 2012; Xu & Jura 2014). Therefore, follow-upobservations over the next few years will determine whetherthe transit frequency, depths, and profiles are consistent withprevious observing seasons, and whether there are a consistentnumber of orbiting objects in the system.20
Lastly, that we observe a significant transit dip (greater than10% of the stellar flux) on average every ∼3.6 hr ofobservations, indicates that WD 1145+017 is a very favorablecandidate for follow-up observations with larger telescopes. Ifthis frequency of transit dips persists into the future then it islikely that a single night of observations of WD 1145+017with larger ground-based or space-based telescopes will detectsignificant transit events, and reveal further information aboutthis fascinating and confounding system.
We point the interested reader to the following manuscriptsthat present additional observations of this system and weresubmitted while this manuscript was being revised: Xu et al.(2016), Gänsicke et al. (2016), Rappaport et al. (2016), Alonsoet al. (2016), Zhou et al. (2016), and Gary et al. (2016).
We thank the referee for a thorough review of thismanuscript.
These results made use of Lowell Observatory’s DiscoveryChannel Telescope. Lowell operates the DCT in partnershipwith Boston University, Northern Arizona University, theUniversity of Maryland, and the University of Toledo. Partialsupport of the DCT was provided by Discovery Communica-tions. LMI was built by Lowell Observatory using funds fromthe National Science Foundation (AST-1005313).MINERVA is a collaboration among the Harvard-Smithso-
nian Center for Astrophysics, The Pennsylvania State Uni-versity, the University of Montana, and the University of NewSouth Wales. It is supported with generous funds from the USNSF, NASA, and the Australian Research Council. MINERVAis made possible by generous contributions from its collaborat-ing institutions and Mt. Cuba Astronomical Foundation, TheDavid and Lucile Packard Foundation, National Aeronauticsand Space Administration (EPSCOR grant NNX13AM97A),The Australian Research Council (LIEF grant LE140100050),and the National Science Foundation (grant 1516242). Anyopinions, findings, and conclusions or recommendationsexpressed are those of the author and do not necessarily reflectthe views of the National Science Foundation.J.A.J. is supported by a generous grant from the David and
Lucile Packard Foundation. The Center for Exoplanets andHabitable Worlds is supported by the Pennsylvania StateUniversity, the Eberly College of Science, and the Pennsylva-nia Space Grant Consortium.We thank Dan Feldman and Connor Robinson for their
assistance in observing this object with the Discovery ChannelTelescope, Zachary Hall for his assistance with observing thisobject with the Perkins Telescope, Brian Taylor for hisassistance in preparing observations of this object on both thePerkins and Discovery Channel Telescope, and Gilles Fontaineand Patrick Dufour for helpful conversations on white dwarfvariability and pulsations.
Figure 12. K2 photometry of WD 1145+017 folded on the Vanderburg et al. (2015) A–F periods as indicated at the top of each panel. The red circles represent thefirst third (∼26.6 day) of the K2 photometry, while the second and third ∼26.6 day stretches of K2 photometry are represented by the blue and green circles,respectively. The data are binned every ∼0.033 in phase, and the various light curves are vertically offset for clarity.
20 Follow-up photometry that was performed while this manuscript was underrevision during the Fall 2015 to Spring 2016 observing season (Gänsickeet al. 2016; Gary et al. 2016; Rappaport et al. 2016) suggests that there was aconsiderable increase in the number of transiting objects passing in front ofWD 1145+017, and the depth of these transits, during that observing season,compared to the observations that we present here in Spring 2015.
15
The Astrophysical Journal, 836:82 (16pp), 2017 February 10 Croll et al.

References
Alonso, R., Rappaport, S., Deeg, H. J., & Palle, E. 2016, A&A, 589, 6Bochinski, J. J., Haswell, C. A., Marsh, T. R., Dhillon, V. S., & Littlefair, S. P.
2015, ApJL, 800, L21Budaj, J. 2013, A&A, 557, A72Burns, J. A., Simonelli, D. P., Showalter, M. R., et al. 2004, in Jupiter:
The Planet Satellites and Magnetosphere, ed. F. Bagenal et al. Vol. 1;Cambridge: Cambridge Univ. Press) 241
Carter, J. A., Winn, J. N., Holman, M. J., et al. 2011, ApJ, 730, 82Cowan, J. J., & A’Hearn, M. F. 1979, M&P, 21, 155Croll, B. 2006, PASP, 118, 1351Croll, B., Albert, L., Jayawardhana, R., et al. 2015, ApJ, 802, 28Croll, B., Rappaport, S., DeVore, J., et al. 2014, ApJ, 786, 100Debes, J. H., & Sigurdsson, S. 2002, ApJ, 572, 556Debes, J. H., Walsh, K. J., & Stark, C. 2012, ApJ, 747, 148Dufour, P., Kilic, M., Fontaine, G., et al. 2010, ApJ, 719, 803Dupuis, J., Fontaine, G., & Wesemael, F. 1993, ApJS, 87, 345Eastman, J., Siverd, R., & Gaudi, B. S. 2010, PASP, 122, 935Farihi, J., Gänsicke, B. T., & Koester, D. 2013, Sci, 342, 218Gänsicke, B. T., Aungwerojwit, A., Marsh, T. R., et al. 2016, ApJL, 818, L7Gary, B. L., Rappaport, S., Kaye, T. G., Alonso, R., & Hambschs, F. J. 2017,
MNRAS, 465, 3267Hansen, J. E., & Travis, L. D. 1974, SSRv, 16, 527Howell, S. B., Sobeck, C., Haas, M., et al. 2014, PASP, 126, 398Irwin, J. M., Berta-Thompson, Z. K., Charbonneau, D., et al. 2015, in 18th
Cambridge Workshop on Cool Stars, Stellar Systems, and the Sun, ed.G. van Belle & H.C. Harris, 767
Janes, K. A., Clemens, D. P., Hayes-Gehrke, M. N., et al. 2004, BAAS, 36, 672Jewitt, D., Agarwal, J., Weaver, H., Mutchler, M., & Larson, S. 2013, ApJL,
778, L21Jewitt, D., Weaver, H., Agarwal, J., Mutchler, M., & Drahus, M. 2010, Natur,
467, 817Jura, M. 2003, ApJL, 584, L91
Kimura, H., Mann, I., Biesecker, D. A., & Jessberger, E. K. 2002, Icar, 159, 529Klein, B., Jura, M., Koester, D., Zuckerman, B., & Melis, C. 2010, ApJ,
709, 950Koester, D., Gänsicke, B. T., & Farihi, J. 2014, A&A, 566, A34Leberton, J., van Lieshout, R., Augereau, J.-C., et al. 2015, A&A, 555, A146Lomb, N. R. 1976, Ap&SS, 39, 447Massey, P., Dunham, E. W., Bida, T. A., et al. 2013, AAS, 221, #345.02Michikami, T., Nakamura, A. M., Hirata, N., et al. 2008, EP&S, 60, 13Nutzmann, P., & Charbonneau, D. 2008, PASP, 120, 317Perez-Becker, D., & Chiang, E. 2013, MNRAS, 433, 2294Raddi, R., Gänsicke, B. T., Koester, D., et al. 2015, MNRAS, 450, 2083Ransom, S. M., Eikenberry, S. S., & Middleditch, J. 2002, AJ, 124, 1788Rappaport, S., Barclay, T., DeVore, J., et al. 2014, ApJ, 784, 40Rappaport, S., Gary, B. L., Kaye, T., et al. 2016, MNRAS, 458, 3904Rappaport, S., Levine, A., Chiang, E., et al. 2012, ApJ, 752, 1Sanchis-Ojeda, R., Rappaport, S., Pallè, E., et al. 2015, ApJ, 812, 112Scargle, J. D. 1982, ApJ, 263, 835Swift, J. J., Bottom, M., Johnson, J. A., et al. 2015, JATIS, 1, 2Szentgyorgyi, A. H., Geary, J. G., Latham, D. W., et al. 2005, BAAS, 37, 1339Vanderburg, A., Johnson, J. A., Rappaport, S., et al. 2015, Natur, 526, 546Van Grootel, V., Fontaine, G., Brassard, P., & Dupret, M.-A. 2015, A&A,
575, A125Veras, D., Leinhardt, Z. M., Bonsor, A., & Gänsicke, B. T. 2014, MNRAS,
445, 2244Veras, D., Marsh, T. R., & Gänsicke, B. T. 2016, MNRAS, 461, 1413Winn, J. N. 2010, arXiv:astro-ph/1001.2010Xu, S., & Jura, M. 2014, ApJL, 792, L39Xu, S., Jura, M., Dufour, P., & Zuckerman, B. 2016, ApJL, 816, L22Zhou, G., Kedziora-Chudczer, L., Bailey, J., et al. 2016, MNRAS, 463, 4422Zuckerman, B., Koester, D., Melis, C., Hansen, B. M., & Jura, M. 2007, ApJ,
671, 872Zuckerman, B., Koester, D., Reid, I. N., & Hünsch, M. 2003, ApJ, 596, 477Zuckerman, B., Melis, C., Klein, B., Koester, D., & Jura, M. 2010, ApJ,
722, 725
16
The Astrophysical Journal, 836:82 (16pp), 2017 February 10 Croll et al.


![1305.2162v1 [Detection of the Cosmic Gamma Ray Horizon From Multiwavelength Observations of Blazars]](https://static.fdocuments.in/doc/165x107/577cd55d1a28ab9e789a962c/13052162v1-detection-of-the-cosmic-gamma-ray-horizon-from-multiwavelength.jpg)