Triplet Extinction Coefficients, Triplet Quantum Yields, and (mainly) Laser Flash Photolysis This.

Multiview Triplet Embedding:Learning Attributes in Multiple Maps
Ehsan Amid [email protected]
Aalto University and Helsinki Institute for Information Technology HIIT, Finland
Antti Ukkonen [email protected]
Finnish Institute of Occupational Health, Helsinki, Finland
AbstractFor humans, it is usually easier to make state-ments about the similarity of objects in relative,rather than absolute terms. Moreover, subjec-tive comparisons of objects can be based on anumber of different and independent attributes.For example, objects can be compared based ontheir shape, color, etc. In this paper, we con-sider the problem of uncovering these hidden at-tributes given a set of relative distance judgmentsin the form of triplets. The attribute that was usedto generate a particular triplet in this set is un-known. Such data occurs, e.g., in crowdsourcingapplications where the triplets are collected froma large group of workers.
We propose the Multiview Triplet Embedding(MVTE) algorithm that produces a number oflow-dimensional maps, each corresponding toone of the hidden attributes. The method can beused to assess how many different attributes wereused to create the triplets, as well as to assess thedifficulty of a distance comparison task, and findobjects that have multiple interpretations in rela-tion to the other objects.
1. IntroductionHigh-dimensional data can be analyzed by first embeddingit into a low-dimensional space (Kruskal, 1964; Tenen-baum et al., 2000; Belkin & Niyogi, 2003; Saul & Roweis,2003). A usual input to such methods is a distance ma-trix of the items, and the objective is to create an em-bedding that aims to preserve these distances as well aspossible. However, eliciting absolute distance informa-
Proceedings of the 32nd International Conference on MachineLearning, Lille, France, 2015. JMLR: W&CP volume 37. Copy-right 2015 by the author(s).
tion can be hard in a number of cases. This is espe-cially true if the judgments must be collected from hu-man evaluators. Therefore, a number of recent methods,such as Generalized Non-metric Multidimensional Scaling(GNMDS) (Agarwal et al., 2007), the Crowd Kernel algo-rithm (Tamuz et al., 2011), and Stochastic Triplet Embed-ding (STE) (van der Maaten & Weinberger, 2012), only userelative distance judgments, or some other type of quali-tative information (Gomes et al., 2011). These are moreamenable to applications in, e.g., crowdsourcing and hu-man computation.
Relative distances are often collected in the form of triplets,where the evaluator must answer the following task:
“Which of the items A and B is closer to itemX?”
A common problem when collecting such data is that theevaluators may provide inconsistent answers. Someonemight say thatA is closer toX , while somebody else mightsays that B is closer. A lot of research on human compu-tation tends to make the assumption that the tasks have asingle correct solution, and all other solutions are incor-rect. This is clearly a good approach in some applications,e.g., labeling tasks where the items unambiguously eitherdo or do not satisfy some property. In such cases, it is im-portant to aggregate the solutions of a single task to providethe most probable correct answer (Dawid & Skene, 1979;Whitehill et al., 2009; Raykar & Yu, 2012).
However, with some tasks, the situation can be more am-biguous. Consider the following toy example in the con-text of the comparison task given above. We are given a setof objects, each having two attributes: shape (o or x) andcolor (‘red’ or ‘green’). The user is asked to compare itemX = ‘a red o’, with item A = ‘a red x’ and item B = ‘agreen o’. We argue that A and B are both correct answersdepending on the point of view taken by the evaluator. Inthe absence of more precise instructions, the decision can

Multiview Triplet Embedding
GNMDS
(a)
t-STE
(b)
MVTE: First Map
(c)
MVTE: Second Map
(d)
Figure 1. Maps produced by GNMDS, t-STE and MVTE (pro-posed in this paper) given a toy data with objects having two at-tributes (shape, color).
be made based on either of the two attributes. If the evalu-ator uses color as a deciding factor, A is the correct choice,while if the evaluator uses shape, B is an appropriate an-swer.
In general, our input thus contains a mixture of tripletswhere the workers may have used different attributes of theitems when making their comparisons. Figure 1 shows em-beddings produced by the GNMDS and t-STE methods1,as well as the MVTE method that we propose, given suchtriplets from the simple ‘xo’ toy data described above. GN-MDS and t-STE collapse all items into a single map, andconsequently may fail to identify the original attributes.For instance, the t-STE method appropriately divides theobjects into four subclusters, but neither of the dimensionsof the embedding corresponds to shape or color. However,MVTE successfully separates the underlying attributes us-ing two different maps. Distances in the first map are basedon color, while distances in the second map reflect theshape.
In this paper, we take thus the position that inconsistentanswers to individual tasks should not necessarily be ag-gregated into a single consensus solution. Instead, we con-sider all solutions as potentially correct. Rather than tryingto learn a single low-dimensional map for the items, wepropose to simultaneously learn a number of maps that all
1We only consider GNMDS and t-STE because other ap-proaches are similar to one of these two techniques.
aim to represent one possible attribute of the input space,as shown in Figure 1. A similar problem was considered by(Changpinyo et al., 2013) in the context of metric learningusing pairwise similarity comparisons. Observe that thisproblem, in general, cannot be solved simply by increas-ing the dimensionality of the output space. In the exampleabove, no matter what dimensionality we use, one of thesolutions (A vs. B) would always be unsatisfied in termsof any distance metric.
Our contributions: We propose the Multiview TripletEmbedding (MVTE) algorithm for learning multiple mapsfrom a given set of triplets. We propose a number of ap-plications of the algorithm, and conduct experiments thatshow how the method can be used to identify tasks anditems that are confusing to the workers, as well as to iden-tify the attribute each worker mainly uses when comparingthe items.
2. Multiview Triplet EmbeddingIn this section, we define the problem of finding multipleembeddings2 given a set of triplets that originate from anumber of different views, as well as describe the MVTEalgorithm.
2.1. Problem Formulation
We define a query as the triad (i| j, k) of items where i iscalled the probe item and j and k are called the test items.The query is a question of the form: “Is i more similar to jor k?”. An answer to the query is called a triplet. We de-note a triplet by the ordered tuple (i, j, k), meaning that “iis closer to j than k”. Let T = {(i, j, k)} denote the set oftriplets provided for a set of N different items in M differ-ent views V = {Vm}Mm=1. Let Xm = {xm
1 ,xm2 , . . . ,x
mN}
denote the representation of the items in the mth view.Each view Vm represents a particular attribute (or aspect)of the data, e.g., shape, orientation, color, semantics, etc.and Xm denotes the placements of the items with respectto that attribute. Each triplet (i, j, k) specifies the relativedistances of the query items in (at least) one of the viewsVm ∈ V . That is, the inequality
dm(xmi ,x
mj ) < dm(xm
i ,xmk ) (1)
is satisfied with respect to the distance function dm forsome m ∈ {1, 2, . . . ,M}. However, the same triplet mayalso be satisfied in some of the other spaces, as there mightexist some correlation among different attributes of the ob-jects. Therefore, a particular triplet might happen to be sat-isfied in more than one, only one, or none of the providedmetric spaces (if there is noise).
2Please note that we use the words embedding and map inter-changeably throughout this paper.

Multiview Triplet Embedding
MNIST: Sharp TripletsMNIST: Strong Triplets
(a)
MNIST: Mixed TripletsMNIST: Mixed Triplets
(b)
MNIST: Weighted Triplets
0123456789
MNIST: Weighted Triplets
(c)
Figure 2. Embedding results of the MNIST dataset using different sets of triplets: results of the t-STE method using (a) sharp tripletsonly, (b) sharp triplets mixed with weak triplets, and (c) the MVTE method (M = 1) using the same set of mixed triplets weighted bythe satisfiability ratios.
Problem: Given the set of triplets T , our goal isto find M different embeddings of the items Ym ={ym
1 ,ym2 . . . ,ym
N} such that for each triplet (i, j, k), thedistance constraint is satisfied with respect to the Euclideannorm in the corresponding map3. In other words,
dm(xmi ,x
mj ) < dm(xm
i ,xmk )
m‖ym
i − ymj ‖ < ‖ym
i − ymk ‖
(2)
for all (i, j, k) ∈ T .
2.2. The MVTE algorithm
To overcome the problem of having triplets from differ-ent views, we consider a mixture of maps as follows. Foreach triplet (i, j, k), we define pmijk as the probability thatit is satisfied in map m. We adopt the formulation similarto (van der Maaten & Weinberger, 2012), that is
pmijk =exp(−‖ymi − ymj ‖2)
exp(−‖ymi − ymj ‖2) + exp(−‖ymi − ymk ‖2).
(3)We denote by zijk the binary indicator vector of length Mfor the triplet (i, j, k) having all values equal to zero exceptone, specifying the corresponding view that it originatesfrom. Thus, the probability that the triplet (i, j, k) is satis-fied in the corresponding view can be written as
pijk =
M∏m=1
(pmijk)zmijk , (4)
where zmijk is the mth component of the binary vector zijk.Now, our objective becomes to maximize the sum of the
3Note that in general, the correspondence between the mapsand the views might be randomly permuted since the comparisonsare provided as a set of unlabeled triplets. However, we use iden-tical indices for notational simplicity.
log-probabilities over all triplets, that is
maxY
∑(i,j,k)∈T
log pijk = maxY
∑(i,j,k)∈T
M∑m=1
zmijk log pmijk.
(5)The objective function can be optimized using a standarditerative gradient ascent algorithm on the map points ymi .
Now, there still remains the problem of estimating the la-tent indicator variables zijk in (5). The naıve approach tomaximize (5) w.r.t. Z = {zijk} would be to set each zijkas the indicator of the probability pmijk which has the largestvalue among all the maps. However, as we stated earlier,each triplet may be satisfied in more than one view. There-fore, restraining the indicator variable to a single map pre-vents using the triplet information when forming the mapsthat correspond to other views. We consider a triplet to bemore informative for Vm if it is strongly satisfied in Vm,and it is only weakly satisfied or entirely unsatisfied in theother views. Therefore, it must be given more emphasiswhen finding the map for view Vm. To formulate the im-portance of a triplet, we define the satisfiability ratio fortriplet (i, j, k) in view Vm as
Γmijk =
dm(xmi ,x
mk )
dm(xmi ,x
mj )
. (6)
A value of Γmijk > 1 (Γm
ijk ≤ 1) indicates that the triplet issatisfied (unsatisfied) in view Vm. We similarly define
γmijk =‖ym
i − ymk ‖
‖ymi − ym
j ‖(7)
as the satisfiability ratio in the corresponding map.
We consider a simple example that illustrates how the sat-isfiability ratio can be used to assess the importance of atriplet. We use a subset of 2000 datapoints from the MNIST

Multiview Triplet Embedding
Confusion Matrix
v1 v2 v3
m1
m2
m3
0.65
0.7
0.75
0.8
0.85
0.9
(a)Number of Dimensions/Maps
1 2 3 4 5 6 7 8 9 10G
ener
aliz
atio
n E
rror
0
0.05
0.1
0.15
0.2
0.25
0.3
0.35Pima Dataset
(b)Number of Dimensions/Maps
1 2 3 4 5 6 7 8 9 10
Gen
eral
izat
ion
Err
or
0
0.05
0.1
0.15
0.2
0.25
0.3
0.35
0.4
0.45
0.5Vogue Dataset
(c)Number of Dimensions/Maps
1 2 3 4 5 6 7 8 9 10
Gen
eral
izat
ion
Err
or
0
0.05
0.1
0.15
0.2
0.25Food Dataset
(d)Number of Dimensions/Maps
1 2 3 4 5 6 7 8 9 10
Gen
eral
izat
ion
Err
or
0
0.05
0.1
0.15
0.2
0.25
0.3
0.35
0.4
0.45
0.5Music Dataset
GNMDSCKLSTEt-STEMVTEt-MVTE
(e)
Figure 3. Triplet satisfiability results: (a) confusion matrix for Pima dataset using MVTE with M = 3, and the generalization error ofdifferent algorithms on (b) Pima, (c) Vogue, (d) Food, and (e) Music datasets.
Algorithm 1 Multiview Triplet Embedding (MVTE)Input: set of triplets T , number of views MOutput: embeddings of datapoints Y = {Ym}Mm=1, in-dicator variables of the triplets ZInitialize Y and Z .repeat
1) Update (5) w.r.t Y with Z fixed2) Update Z using (9)
until (5) does not change significantly
dataset (LeCun & Cortes, 1999). We first build a map us-ing the t-STE algorithm by considering a set of 20,000strongly satisfied synthetic triplets (see Figure 2(a)). Thequality of the same map reduces significantly when we ap-pend another set of 20,000 weakly satisfied triplets andre-compute the embedding (Figure 2(b)). To increase theeffect of strong triplets, we calculate the satisfiability ra-tios of the triplets in map (b), and reconstruct the map byweighting the triplets by the estimated satisfiability ratios(using the MVTE algorithm). As can be seen, the result isimproved by assigning a higher weight to the strongly sat-isfied triplets (Figure 2(c)). The satisfiability ratio is thus areasonable way to assign weights to the triplets. This resultalso suggests that the satisfiability ratios in the learned mapmay provide an appropriate estimate of the true satisfiabil-ity ratios in the original view.
We make use of these findings when estimating the indica-tor variables for the triplets in different views as follows.First, we define the biased satisfiability ratio for triplet(i, j, k) as
γmijk =
γmijk if γmijk > 1
0 otherwise. (8)
The biased ratio assigns no importance to the unsatisfiedtriplets while it preserves the satisfiability ratio if the tripletis satisfied. We define the indicator variable zmijk so that itreflects the extent to which the triplet (i, j, k) is satisfied in
the mth map. In particular, we let
zmijk =γmijk
max(∑M
l=1 γlijk, 1
) . (9)
In this way, we assign higher weights to the informa-tive triplets while neglecting the unimportant (and possi-bly unsatisfied) ones. Therefore, the triplets are distributedamong the maps with different weights, where the totalweights for each sum up to one. The algorithm for findingthe maps proceeds by alternatively maximizing (5) w.r.t. Yand then, updating the indicator variables using (9). Thepseudocode for the algorithm is shown in Algorithm 1. Werefer to our proposed method as Multiview Triplet Em-bedding (MVTE). The algorithm can be extended to dis-tributions having heavier tail than Gaussian, e.g., Studentt-distribution which leads to the t-distributed MVTE algo-rithm, or t-MVTE, in short.
3. ApplicationsNext, we describe a number of novel applications where wecan use the MVTE algorithm. We assume that the methodis applied in a crowdsourcing context where the triplets areelicited from a number of workers.
Number of attributes: As the first result, our method canbe used to estimate the true number of attributes in a set oftriplets. We want to point out that this is not the same asthe dimensionality of a single input space, as each attributeinduces an independent view of the items. The effect ofhaving several attributes can be investigated by increasingthe dimensionality of a single map and comparing the re-sults with those obtained from multiple maps that each havea fixed number of dimensions. As we will see in the nextsection, the limiting factor for satisfying the triplets in mostcases is the assumption of a single view (or distance func-tion) for the items rather than the number of dimensions ofthe resulting map.

Multiview Triplet Embedding
GNMDS
(a)
t-STE
(b)
MVTE: First Map
(c)
MVTE: Second Map
(d)
Figure 4. Results of the different algorithms on the subset of objects images dataset.
Query difficulty: Using multiple different maps we canestimate the difficulty of a query (i|j, k); a property whichmight not be possible to measure using the methods pro-ducing a single map only. By difficulty, we mean the possi-bility of having different interpretations for a given query.As outlined in the Introduction, in certain situations, givena probe i and the test items j and k, both answers may beequally correct. Therefore, the workers might face difficul-ties when answering these queries. This property can beroughly formulated as follows. The query (i| j, k) is con-sidered easy if it is strongly satisfied in a consistent wayin all the views, i.e, if the solution (i, j, k) is the correctanswer no matter what attribute is considered. However,a query becomes hard if the solution (i, j, k) is stronglysatisfied in at least one view while the (opposite) solution(i, k, j) it is strongly satisfied in the other view(s). Finally,a query is ambiguous if it is only (un)satisfied weakly inmost of the views, making the answers only marginally dif-ferent by any sense.
Item ambiguity: The availability of different views en-ables us to roughly estimate the ambiguity of the items, i.e.,the level of different interpretations that each item mighthave in distinct spaces. We perform this by consideringthe neighborhood of each item in different maps. An itemshould be considered highly ambiguous if it has entirelydissimilar neighboring items in the maps. (See also (Cooket al., 2007).) In order to measure this quality, we calculatethe mean average precision (MAP) (Manning et al., 2008)of each item with respect to the pairs of different views.MAP is calculated by first averaging the precision over dif-ferent neighborhood sizes in a pair of maps, that is,
avePrec =
∑Nk=1 prec(k)
N, (10)
and then, finding the mean average precision of all pairs ofmaps. Here, prec(k) denotes the precision by consideringonly the first k-nearest neighbors of the item in each map.A large MAP amounts to similar neighborhood structure indifferent maps and therefore, a less ambiguous item whilea small MAP indicates a highly ambiguous item.
Multiview Triplet Embedding
MVTE: First Map MVTE: Second Map
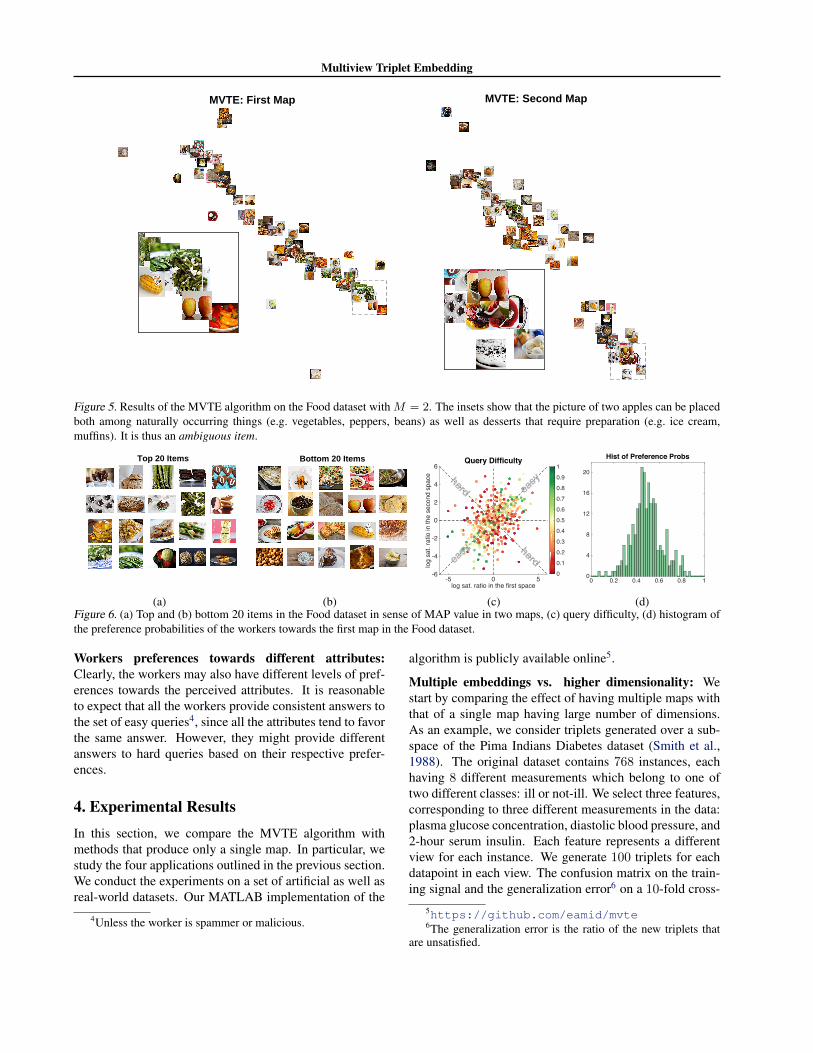
Figure 5. Results of the MVTE algorithm on the Food dataset with M = 2. The insets show that the picture of two apples can be placedboth among naturally occurring things (e.g. vegetables, peppers, beans) as well as desserts that require preparation (e.g. ice cream,muffins). It is thus an ambiguous item.
Top 20 Items
(a)
Bottom 20 Items
(b)log sat. ratio in the first space
-5 0 5
log
sat.
ratio
in th
e se
cond
spa
ce
-6
-4
-2
0
2
4
6Query Difficulty
easy
easy
hard
hard0
0.1
0.2
0.3
0.4
0.5
0.6
0.7
0.8
0.9
1
(c)
0 0.2 0.4 0.6 0.8 10
4
8
12
16
20
Hist of Preference Probs
(d)Figure 6. (a) Top and (b) bottom 20 items in the Food dataset in sense of MAP value in two maps, (c) query difficulty, (d) histogram ofthe preference probabilities of the workers towards the first map in the Food dataset.
Workers preferences towards different attributes:Clearly, the workers may also have different levels of pref-erences towards the perceived attributes. It is reasonableto expect that all the workers provide consistent answers tothe set of easy queries4, since all the attributes tend to favorthe same answer. However, they might provide differentanswers to hard queries based on their respective prefer-ences.
4. Experimental ResultsIn this section, we compare the MVTE algorithm withmethods that produce only a single map. In particular, westudy the four applications outlined in the previous section.We conduct the experiments on a set of artificial as well asreal-world datasets. Our MATLAB implementation of the
4Unless the worker is spammer or malicious.
algorithm is publicly available online5.
Multiple embeddings vs. higher dimensionality: Westart by comparing the effect of having multiple maps withthat of a single map having large number of dimensions.As an example, we consider triplets generated over a sub-space of the Pima Indians Diabetes dataset (Smith et al.,1988). The original dataset contains 768 instances, eachhaving 8 different measurements which belong to one oftwo different classes: ill or not-ill. We select three features,corresponding to three different measurements in the data:plasma glucose concentration, diastolic blood pressure, and2-hour serum insulin. Each feature represents a differentview for each instance. We generate 100 triplets for eachdatapoint in each view. The confusion matrix on the train-ing signal and the generalization error6 on a 10-fold cross-
5https://github.com/eamid/mvte6The generalization error is the ratio of the new triplets that
are unsatisfied.

Multiview Triplet Embedding
validation are shown in Figure 3(a) and Figure 3(b), respec-tively. The MVTE algorithm successfully divides the train-ing triplets among three different maps, each correspond-ing to one of the views. Note that because of correlationbetween the views, each map also satisfies a portion of thetriplets that originate from other views. Additionally, over98% of the held-out triplets are satisfied using t-MVTE al-gorithm in at least one of the three maps (vs. 92% in asingle map solution).
We perform similar experiments on three real-worlddatasets, namely Vogue Magazine Covers (Heikinheimo &Ukkonen, 2013), Food Images (Wilber et al., 2014), andMusic Artists (Ellis et al., 2002), for all of which, the truenumbers of views are unknown. For all the datasets, wedo not make any assumptions about the provided tripletsand thus, consider all of them as potentially correct. Theresults, illustrated in Figure 3(c) to 3(e), indicate that us-ing multiple maps results in a lower generalisation error.Furthermore, the generalization error provides clues aboutthe true number of views in each dataset. For instance, inthe Vogue dataset, almost all the triplets are satisfied us-ing three maps while the Music dataset requires a largernumber of maps to obtain similar accuracy. This suggeststhat the users indeed considered a large number of differ-ent, subjective attributes when comparing the artists (Elliset al., 2002).
Separating attributes from a mixture of triplets: Next,we consider the visualization results on two datasets. Wefirst perform a visualization using a set of synthetic triplets,generated on a dataset of objects images (Konkle et al.,2010). The dataset contains 3400 images of objects from200 different categories on a white background. We con-sider a subset of 156 objects out of 12 object categories.We form M = 2 spaces, corresponding to shapes and col-ors of the objects. We use Fourier descriptors (Gonzalez &Woods, 2006) for shape representation. For the color space,we concatenate the color histograms in the RGB channels(each with 16 bins in each channel) to form the color fea-ture vectors. The results are shown in Figure 4. It canbe seen that our method successfully projects the objectsinto two different maps corresponding to shape and color,while the other methods at best mix both attributes into asingle map. The ‘red toy-gun’ is an example of an objectwith different neighborhood structures in two maps; in thefirst map, it appears among other toy-guns having differ-ent colors while in the second map, it is located among redobjects, irrespective of their shape.
Finding ambiguous items: We continue by describing anexperiment to find items that may have different interpre-tations. The Food dataset (Wilber et al., 2014) contains250,320 triplets, queried on 100 images of different dishesof food. Figure 5 shows the results of the MVTE method
with M = 2. The first map represents ‘types’ of the dishesin which the neighborhood structure mainly corresponds tothe attributes such as vegetable vs. non-vegetable, natu-ral vs. processed, etc. On the other hand, the second mapseems to be based on the ‘taste’, rather than type of thefood. For instance, whether a food is sweet or not. The im-age of two apples is a good example of an item with verydifferent neighborhood structures in the two maps. (See theinsets in Figure 5.)
Figures 6(a) and 6(b) show the items having the top andbottom 20 MAP values in the Food dataset, respectively.The items having large values of MAP are those, such asgreen beans, muffins, pancakes, etc., which have a uniquestructural and semantic interpretations. However, the itemsat the bottom, e.g., apples, sweet corn, berries, etc., canbe easily grouped in different categories, depending on theproperty considered.
Are queries with ambiguous items difficult? The levelof ambiguity of items in a query also affects the difficultyof the query for workers. A query containing ambiguousitems leads to several different interpretations, making ithard for the workers to decide on the answer. We showthis by roughly estimating the difficulty of the queries byconsidering the minimum of the MAP values of the items ineach query as the level of difficulty. Figure 6(c) illustratesthe distribution of a number of 500 different triplets in theFood dataset, based on their respective satisfiability ratiosin two different maps7. The color, on the other hand, indi-cates the minimum of the MAP values of the items in thequery. Clearly, the difficulty level of the items, estimatedusing MAP values, is highly correlated with the difficultyof the queries, found by considering the satisfiability ratiosin different maps. In other words, triplets having ambigu-ous items tend to appear mainly in regions which are ex-pected to comprise hard triplets. Similar results hold forthe easy queries having unambiguous items.
Do some workers prefer one attribute over another?To asses the performance of our approach for estimatingthe preferences of the workers, we conduct the follow-ing experiment. We first generate 10,000 queries on thexo-objects dataset (see Section 1) in each view (20,000queries in total). To filter out the easy queries, we firstcompute the satisfiability ratios in the original spaces foreach query. We mark the query (i| j, k) as hard if: 1) thetriplet (i, j, k) has a high satisfiability ratio in one view,the triplet (i, k, j) as a high satisfiability ratio in the otherview, and 2) the difference between the satisfiability ra-tios in two views is comparatively small. The rest of thequeries are marked as easy. Next, we generate a set of
7The triplets are plotted by reversing the order of the test itemsin a randomly selected subset. Please note that this procedurewould not affect the difficulty of the query.

Multiview Triplet Embedding
Table 1. Workers preferences probabilities in the synthetic exam-ple.
ID 1 2 3 4 5p 0.004 0.274 0.471 0.483 0.490p 0.038 0.318 0.500 0.472 0.545
ID 6 7 8 9 10p 0.551 0.580 0.585 0.945 0.981p 0.538 0.604 0.631 0.926 0.981
98
(a)
22
(b)
40
(c)
Figure 7. An example of a hard query (a| b, c) which has beenanswered differently by the workers having opposite preferences.
10 random workers, each having a different probability toprefer the shape space, {pi}10i=1 (therefore, {(1 − pi)}10i=1
for the color). That is, the ith worker provides her answerwith reference to the shape space with probability pi. Foreach query, 5 workers are chosen randomly to answer thetask. All the easy queries are answered consistently by ev-ery worker. The hard queries are answered according to thepreference probabilities.
We then run the MVTE with M = 2 on the set of tripletsgenerated by the above workers. We repeat the same pro-cedure to filter out the easy triplets by finding the satisfia-bility ratios in the maps. Finally, for each worker, we esti-mate the preference probabilities by finding the number oftriplets satisfied in each view and normalizing the counts.Table 1 shows the true probabilities {pi}10i=1 along with theestimated probabilities {pi}10i=1 using our method. The es-timated probabilities are very close to the true probabilities.
As a real-world example, we consider the workers of theFood dataset. We repeat the procedure for finding the hardtriplets using the satisfiability ratios in the embeddings, asabove and then, calculate the preference probabilities of theworkers for each map. The histogram of the estimated pref-erence probabilities of the workers towards the first map isshown in Figure 6(d). Most workers are neutral, havingpreference probabilities around 0.5, as expected. Figure 7illustrates an example of a conflicting query, provided bythe workers having highly different preferences. The firstworker (#463 with p = 0.64), who is inclined towards thefirst map (types of items), selected the beans (b) as moresimilar to the apples, while the other worker (#188 withp = 0.34), who prefers the second view (taste), has chosenthe ice cream (c). Note that the probe item (apples) appearsamong the ambiguous items in Figure 6(b), while the testitems are relatively less ambiguous.
5. ConclusionsIn this paper, we introduced a method to uncover multiplehidden attributes that can be used independently for mak-ing relative distance comparisons. We propose the MVTEmethod that successfully represents these attributes by find-ing a number of maps that correspond to the underlyingattributes. The method provides a framework to estimatethe true number of attributes, and to evaluate the difficultyof distance comparison tasks as well as the ambiguity ofan object. Finally, it enables estimating the preferences ofeach worker towards different attributes based on the solu-tions provided by that worker. In general, the method canbe seen as a means to learn a number of independent dis-tance functions from a set of relative distance judgements.This may have applications beyond the crowdsourcing ex-ample considered in this paper.
ReferencesAgarwal, Sameer, Wills, Josh, Cayton, Lawrence, Lanck-
riet, Gert, Kriegman, David, and Belongie, Serge. Gen-eralized non-metric multidimensional scaling. In AIS-TATS, San Juan, Puerto Rico, 2007.
Belkin, Mikhail and Niyogi, Partha. Laplacian eigen-maps for dimensionality reduction and data representa-tion. Neural computation, 15(6):1373–1396, 2003.
Changpinyo, Soravit, Liu, Kuan, and Sha, Fei. Similaritycomponent analysis. In Advances in Neural InformationProcessing Systems 26, pp. 1511–1519. 2013.
Cook, James, Sutskever, Ilya, Mnih, Andriy, and Hinton,Geoffrey E. Visualizing similarity data with a mixture ofmaps. In International Conference on Artificial Intelli-gence and Statistics, pp. 67–74, 2007.
Dawid, Alexander Philip and Skene, Allan M. Maximumlikelihood estimation of observer error-rates using theem algorithm. Applied statistics, pp. 20–28, 1979.
Ellis, Daniel P. W., Whitman, Brian, Berenzweig, Adam,and Lawrence, Steve. The Quest for Ground Truth inMusical Artist Similarity. In Proceedings of the 3rd In-ternational Conference on Music Information Retrieval(ISMIR ’02), pp. 170–177, Paris, France, October 2002.
Gomes, Ryan G, Welinder, Peter, Krause, Andreas, andPerona, Pietro. Crowdclustering. In Advances in Neu-ral Information Processing Systems, pp. 558–566, 2011.
Gonzalez, Rafael C. and Woods, Richard E. Digital Im-age Processing (3rd Edition). Prentice-Hall, Inc., UpperSaddle River, NJ, USA, 2006. ISBN 013168728X.

Multiview Triplet Embedding
Heikinheimo, Hannes and Ukkonen, Antti. The crowd-median algorithm. In Conference on Human Computa-tion and Crowdsourcing. AAAI, 2013.
Konkle, Talia, Brady, Timothy F., Alvarez, George A.,Oliva, Aude, Konkle, Talia, Brady, Timothy F., Oliva,Aude, and Brain, Department Of. Conceptual distinc-tiveness supports detailed visual long-term memory forrealworld objects. JEP:G, pp. 149, 2010.
Kruskal, Joseph B. Multidimensional scaling by optimiz-ing goodness of fit to a nonmetric hypothesis. Psychome-trika, 29(1):1–27, 1964.
LeCun, Yann and Cortes, Corinna. The MNIST databaseof handwritten digits. 1999. URL http://yann.lecun.com/exdb/mnist/.
Manning, Christopher D., Raghavan, Prabhakar, andSchutze, Hinrich. Introduction to Information Retrieval.Cambridge University Press, New York, NY, USA, 2008.ISBN 0521865719, 9780521865715.
Raykar, Vikas C. and Yu, Shipeng. Eliminating spammersand ranking annotators for crowdsourced labeling tasks.J. Mach. Learn. Res., 13(1):491–518, February 2012.ISSN 1532-4435.
Saul, Lawrence K and Roweis, Sam T. Think globally, fitlocally: unsupervised learning of low dimensional man-ifolds. The Journal of Machine Learning Research, 4:119–155, 2003.
Smith, J W, Everhart, J E, Dickson, W C, Knowler, W C,and Johannes, R S. Using the adap learning algorithmto forecast the onset of diabetes mellitus. Johns HopkinsAPL Technical Digest, 10:262–266, 1988.
Tamuz, Omer, Liu, Ce, Belongie, Serge, Shamir, Ohad, andKalai, Adam T. Adaptively Learning the Crowd Kernel.In ICML, 2011.
Tenenbaum, Joshua B, De Silva, Vin, and Langford,John C. A global geometric framework for nonlinear di-mensionality reduction. Science, 290(5500):2319–2323,2000.
van der Maaten, L. and Weinberger, K. Stochastic tripletembedding. In Machine Learning for Signal Processing(MLSP), 2012 IEEE International Workshop on, pp. 1–6,Sept 2012.
Whitehill, Jacob, Ruvolo, Paul, Wu, Tingfan, Bergsma, Ja-cob, and Movellan, Javier R. Whose vote should countmore: Optimal integration of labels from labelers of un-known expertise. In Advances in Neural InformationProcessing Systems 22, pp. 2035–2043, 2009.
Wilber, Michael, Kwak, Sam, and Belongie, Serge. Cost-effective hits for relative similarity comparisons. In Hu-man Computation and Crowdsourcing (HCOMP), Pitts-burgh, November 2014.