MULTIVARIATE SURVIVAL ANALYSIS - theorem.ca
25
A Legal Representation Model Craig A. Sloss, PhD, FCAS, ACIA Senior Technical Specialist – Economical Insurance MULTIVARIATE SURVIVAL ANALYSIS
Transcript of MULTIVARIATE SURVIVAL ANALYSIS - theorem.ca

A Legal Representation ModelCraig A. Sloss, PhD, FCAS, ACIA
Senior Technical Specialist – Economical Insurance
MULTIVARIATE SURVIVAL ANALYSIS

Based on joint work between Craig Sloss
and Sunny Xu
Agenda for the Session:
• Background on the business problem
• Construction of multivariate survival models
• Model validation using censored data
SESSION OVERVIEW

Background on the business problem
ACCIDENT BENEFITSCOVERAGE

Overview of the Coverage
• First party no-fault auto
injury insurance
• Medical and income
replacement benefits with
standard application forms
• Injuries classified as minor,
non-minor, or catastrophic
• Regulatory limits on medical
payments for each class
ONTARIO ACCIDENT BENEFITS
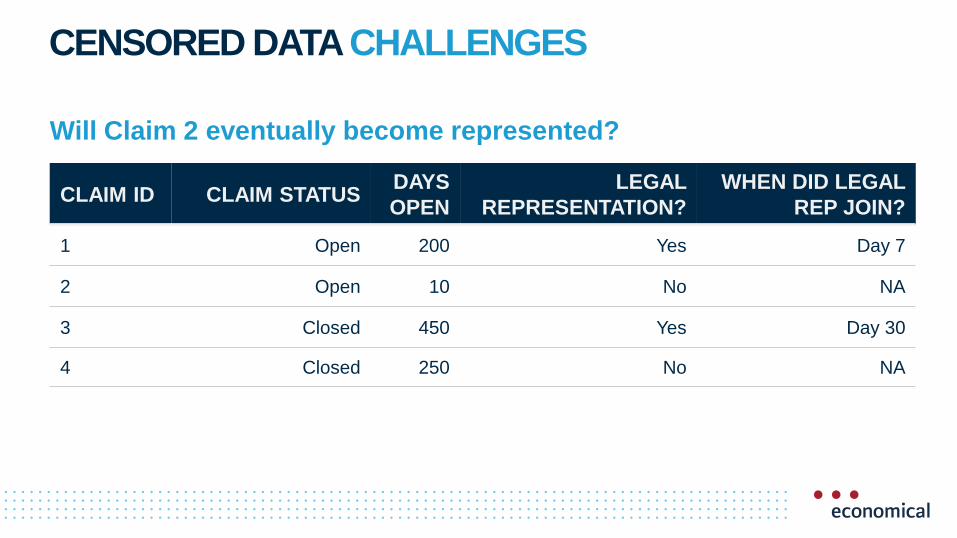
CLAIM ID CLAIM STATUSDAYS
OPEN
LEGAL
REPRESENTATION?
WHEN DID LEGAL
REP JOIN?
1 Open 200 Yes Day 7
2 Open 10 No NA
3 Closed 450 Yes Day 30
4 Closed 250 No NA
Will Claim 2 eventually become represented?
CENSORED DATA CHALLENGES

You are assembling lists of eligible predictors for
two models by considering ASOP 12 criteria.
One model will be used for pricing, and one will
be used to support claims operations.
Which characteristic will be the biggest driver of
differences between the two lists?
POLLING QUESTION
a. Relationship between risk characteristics
and expected outcomes
b. Objectivity
c. Practicality
d. Industry / business practices

The Cox proportional hazards method
MULTIVARIATESURVIVAL MODELS
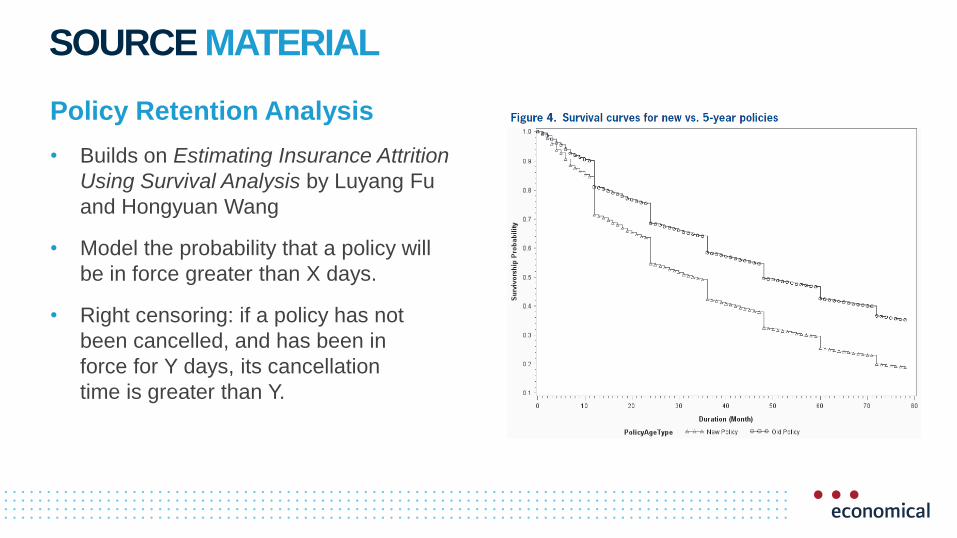
Policy Retention Analysis
• Builds on Estimating Insurance Attrition
Using Survival Analysis by Luyang Fu
and Hongyuan Wang
• Model the probability that a policy will
be in force greater than X days.
• Right censoring: if a policy has not
been cancelled, and has been in
force for Y days, its cancellation
time is greater than Y.
SOURCE MATERIAL

PROPORTIONAL HAZARDS
Approach due to Cox (1972)
• Survival function: 𝑆 𝑡 = 𝑃(𝑇 ≥ 𝑡)
• Hazard rate: ℎ 𝑡 = −𝑆′(𝑡)
𝑆(𝑡)
• 𝑆 𝑡 = exp(−0𝑡ℎ 𝑡 𝑑𝑡)
• Cox: ℎ 𝑡 = ℎ0 𝑡 exp(𝜷𝒙)
Think: Kaplan-Meier Think: GLM

• Producing S(t) provides flexibility
in how we define “prediction”
• More responsive to recent data
• Similar to familiar
actuarial techniques
ADVANTAGES OF COX MODELS
• R “survival” package
(+ “survminer” for plots)
• Python “lifelines” package
• SAS “PHREG” procedure
• SPSS
IMPLEMENTATION OPTIONS

𝒉 𝒕 = 𝒉𝟎 𝒕 exp(𝜷𝒙)
1. Select 𝑥 and 𝛽 using “the usual”
linear modelling approaches
2. Test proportionality assumption
3. If not proportional: fit a strata
(different ℎ0(𝑡) for each level of
the variable)
MODEL CONSTRUCTION RECIPE

The quick check
• Produce a survival curve for
each level of a variable
• Look for qualitative differences
in the shape of the curve
(e.g. crossing) which indicate
non-proportionality
PROPORTIONALITY CHECK

The rigorous check
• Schoenfeld Residuals Test
• Plot residuals vs. time
• Patterns in the residuals
indicate non-proportionality
PROPORTIONALITY CHECK

For censored data
MODEL VALIDATIONTECHNIQUES

CLAIM
ID
CLAIM
STATUS
DAYS
OPEN
LEGAL
REP?
MODEL
PREDICITION
FLAGGED BY
MODEL?
1 Open 200 Yes 0.75 Yes
2 Open 10 No 0.65 Yes
3 Closed 450 Yes 0.3 No
4 Closed 250 No 0.2 No
How would you validate the model on holdout data?
VALIDATION CHALLENGES

Which of the following holdout
testing methods will need to
change to reflect censored data?
a. False positive / false negative rates
b. Gini coefficient
c. Quantile plots
POLLING QUESTION
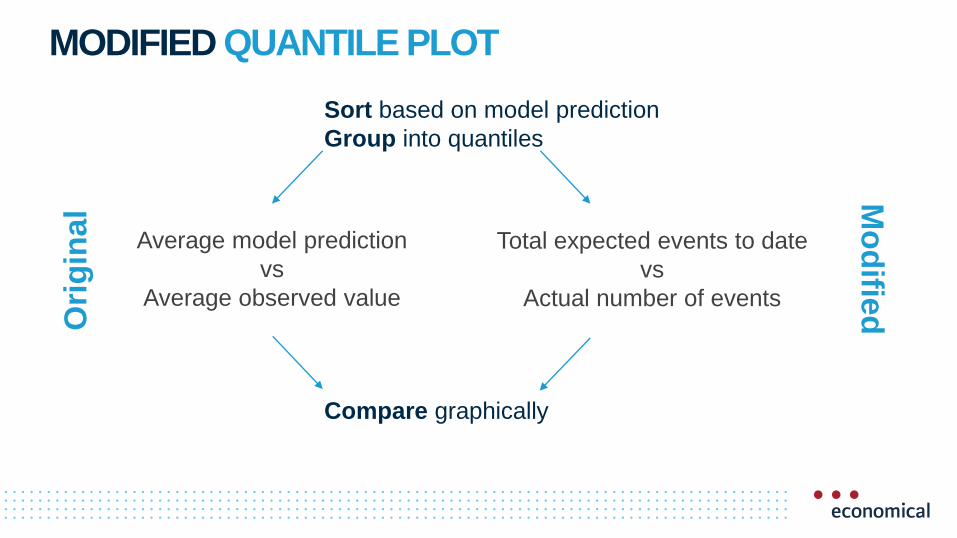
Average model prediction
vs
Average observed value
MODIFIED QUANTILE PLOT
Total expected events to date
vs
Actual number of events
Sort based on model prediction
Group into quantiles
Compare graphically
Ori
gin
al
Mo
difie
d

Calculated on holdout data
• Good segmentation of high vs. low
risk of legal representation
• Underestimates the absolute
probability of legal representation
• Appropriate for use cases involving
flagging the top risks
MODIFIED QUANTILE PLOT
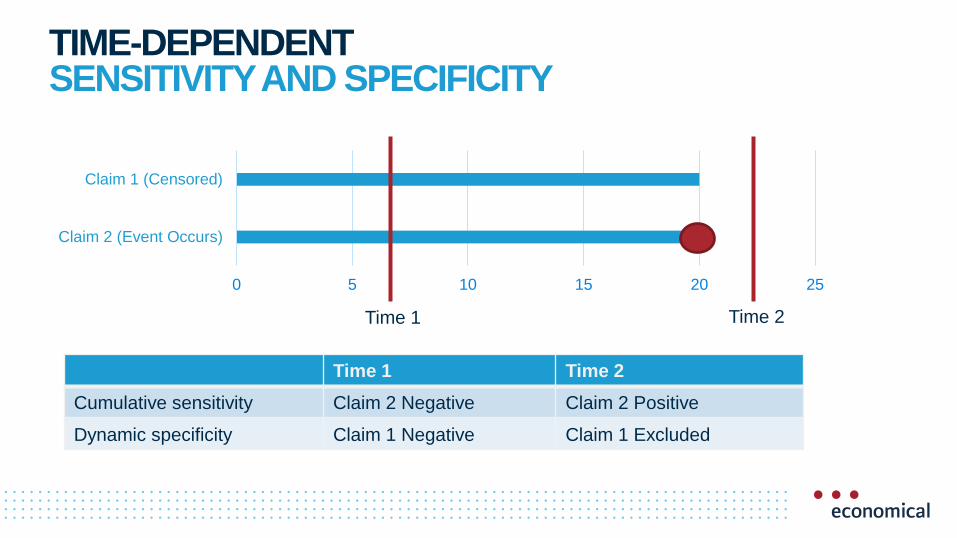
TIME-DEPENDENT SENSITIVITY AND SPECIFICITY
0 5 10 15 20 25
Claim 2 (Event Occurs)
Claim 1 (Censored)
Time 1 Time 2
Time 1 Time 2
Cumulative sensitivity Claim 2 Negative Claim 2 Positive
Dynamic specificity Claim 1 Negative Claim 1 Excluded

• Fix a time t
• Apply the CS / DS Rules
• Calculate Gini / AUROC
• Repeat for each t
TIME-DEPENDENT GINI / AUROC

BIAS AND FAIRNESS AUDIT
Source: https://dsapp.uchicago.edu/projects/aequitas/

Our modifications
• Census averages
• Scatterplot should not
show an increasing trend
• Used predicted false
negative rate
BIAS AND FAIRNESS AUDIT

Thank you

Economical Insurance includes the following companies: Economical Mutual Insurance Company, Family Insurance Solutions Inc., Sonnet Insurance Company, Petline
Insurance Company. ©2019 Economical Insurance. Economical and Economical Insurance are registered trademarks of Economical Mutual Insurance Company. All
Economical intellectual property belongs to Economical Mutual Insurance Company. All other intellectual property is the property of their respective owners.