Multivariate Frequency Analysis of Extreme Rainfall Events ...kaos/sharefiles/200810Seminar.pdf ·...
24
Multivariate Frequency Analysis of Extreme Rainfall Events using Copulas Shih-Chieh Kao, Ph.D. Post-doctoral Research Associate School of Civil Engineering Purdue University email: [email protected] web: http://web.ics.purdue.edu/~kao
Transcript of Multivariate Frequency Analysis of Extreme Rainfall Events ...kaos/sharefiles/200810Seminar.pdf ·...

Multivariate Frequency Analysis of Extreme Rainfall Events using Copulas
Shih-Chieh Kao, Ph.D.
Post-doctoral Research AssociateSchool of Civil Engineering
Purdue Universityemail: [email protected]
web: http://web.ics.purdue.edu/~kao

Extreme Events
Feb. 5, 2008Delphi, IndianaFlooding of Tippecanoe River
(AP Photo/Journal & Courier, Michael Heinz) (Barry Gillis, http://www.drought.unl.edu/ gallery/ 2007/Georgia/Sparks1.htm)
Sept., 2007George H. Sparks ReservoirLithia Springs, Georgia
Outline• Background and motivation
– Limitations in univariate approach
• Introduction to copulas
• Research objectives– Topic 1: Probabilistic structure of surface runoff– Topic 2: Extreme rainfall frequency analysis– Topic 3: Drought frequency analysis
• Summary and concluding remarks
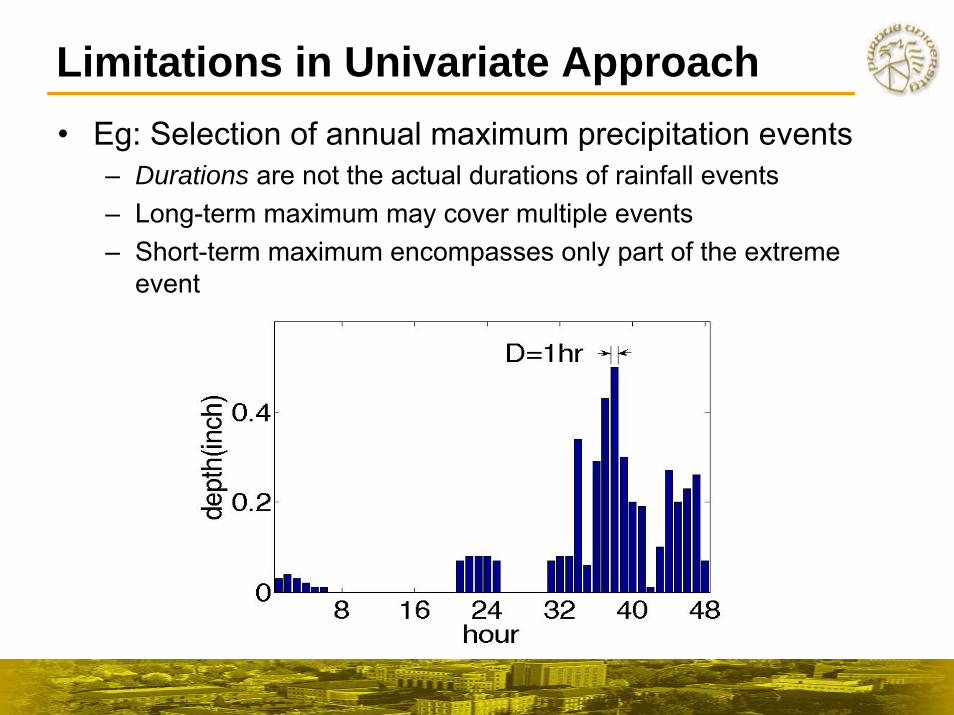
• Eg: Selection of annual maximum precipitation events– Durations are not the actual durations of rainfall events– Long-term maximum may cover multiple events– Short-term maximum encompasses only part of the extreme
event
Limitations in Univariate Approach

Bivariate Distribution Example
( )yxhXY ,Joint density
( ) ( )∫∞
∞−= dyyxhxf XYX ,Marginals ( )
( )∫∞
∞−
=
dxyxh
yf
XY
Y
,
ρ = 0.8
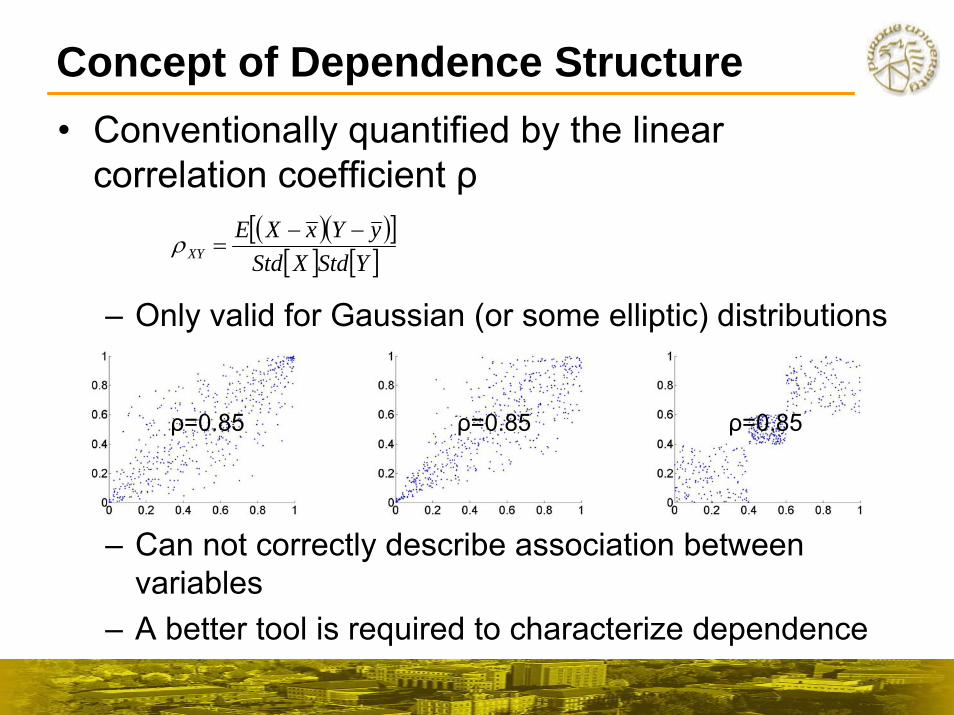
Concept of Dependence Structure• Conventionally quantified by the linear
correlation coefficient ρ
– Only valid for Gaussian (or some elliptic) distributions
– Can not correctly describe association between variables
– A better tool is required to characterize dependence
ρ=0.85 ρ=0.85 ρ=0.85
( )( )[ ][ ] [ ]YStdXStd
yYxXEXY
−−=ρ

Copulas• Transformation of joint
cumulative distribution– HXY(x,y) = CUV(u,v)
marginals: u = FX(x), v = FY(y)– Sklar (1959) proved that the
transformation is unique for continuous r.v.s
• Use copulas to construct joint distributions– Marginal distributions =>
selecting suitable PDFs– Dependence structure =>
selecting suitable copulas– Together they form the joint
distribution
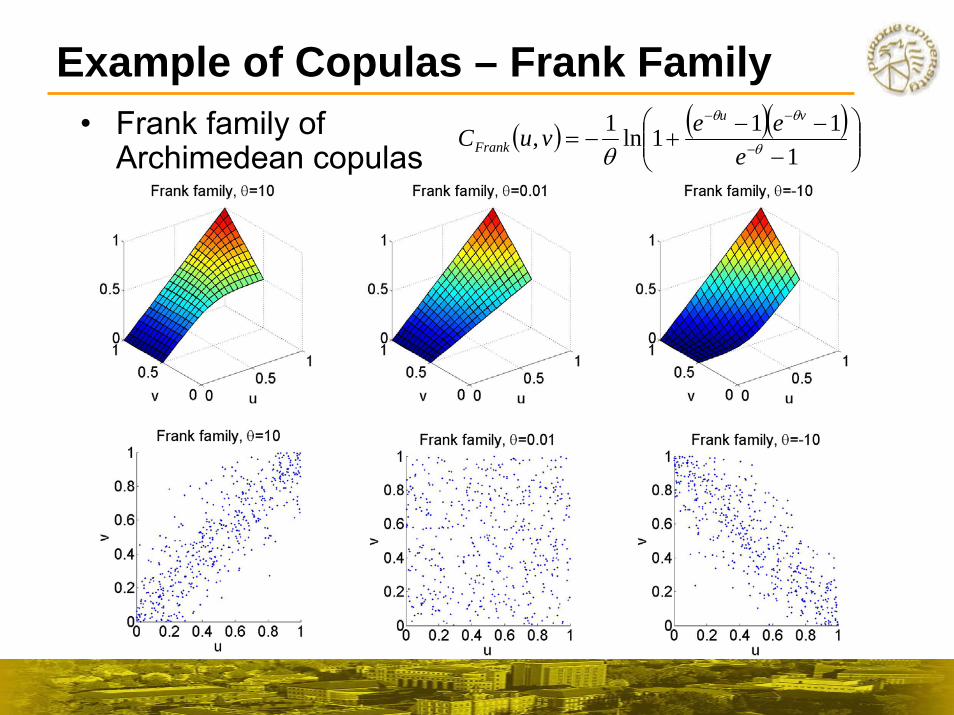
Example of Copulas – Frank Family• Frank family of
Archimedean copulas( ) ( )( )
⎟⎟⎠
⎞⎜⎜⎝
⎛−
−−+−= −
−−
1111ln1, θ
θθ
θ eeevuC
vu
Frank
Use of Copulas in Hydrology• Since 2003, over 20 research articles have been
published in water resources related journals– Rainfall and flood frequency analysis, groundwater parameters
estimation, sea storms analysis, rainfall IDF curves, and etc.– Full potential of copulas is yet to be realized (Genest and Favre,
2007)
• For copulas in rainfall frequency analysis:– How dependence affects rainfall depth and surface runoff?– The definition of extreme events was not clear– Few stations were examined
• For copulas in drought frequency analysis:– What’s the dependence between various drought indices?

Data Sources & Study Area• Precipitation
– NCDC hourly precipitation dataset
• 53 stations with record length greater than 50 years
– NCDC daily precipitation dataset
• 73 stations with record length greater than 80 years
• Streamflow– USGS unregulated daily
mean flow• 36 stations with record length
greater than 50 years

Topic 1Probabilistic Structure of Surface Runoff• SCS CN method for excess rainfall depth Pe
– A function of both average intensity I and rainfall duration D– How does the dependence between I & D affect Pe?– GIS maps of P[Pe=0], E[Pe], and Std[Pe] for Indiana
)8.0()2.0( 2
SDISDIPe +⋅
−⋅=

• Definitions of Extreme Rainfall Events– Hydrologic designs are usually governed by depth (volume) or
peak intensity– Annual maximum volume (AMV) events
• Longer duration– Annual maximum peak intensity (AMI) events
• Shorter duration– Annual maximum cumulative probability (AMP) events
• The use of empirical copulas between volume and peak intensity• Wide range of durations
Topic 2Extreme Rainfall Frequency Analysis (I)

Topic 2Extreme Rainfall Frequency Analysis (II)• Bivariate distribution HPD, HDI, HPI
– Marginal: Extreme Value Type I (EV1), Log Normal (LN)
– Dependence: Frank Family
• Applications– Estimate of depth for known duration
– Estimate of peak intensity for known duration
– Estimate of peak intensity for known depth
( ) TdDdpF TP 111 −=≤<−
( ) TdDdiF TI 111 −=≤<−
[ ]pPIE >|

Estimate of depth for known duration
• The estimates of depth are similar for durations larger than 10 hours• AMP definition seems to be an appropriate indicator for defining extreme events
T-year depth pT given duration d

Estimate of peak intensity for known duration
• Conventional approach fails to capture the peak intensity
T-year peak intensity iT given duration d

Rainfall Peak Attributes• Given depth (P) and duration (D), compute the conditional expectation
of peak intensity (I) and percentage time to peak (Tp)
Expectation of peak intensity given P & D
Expectation of time to peak (%) given P & D
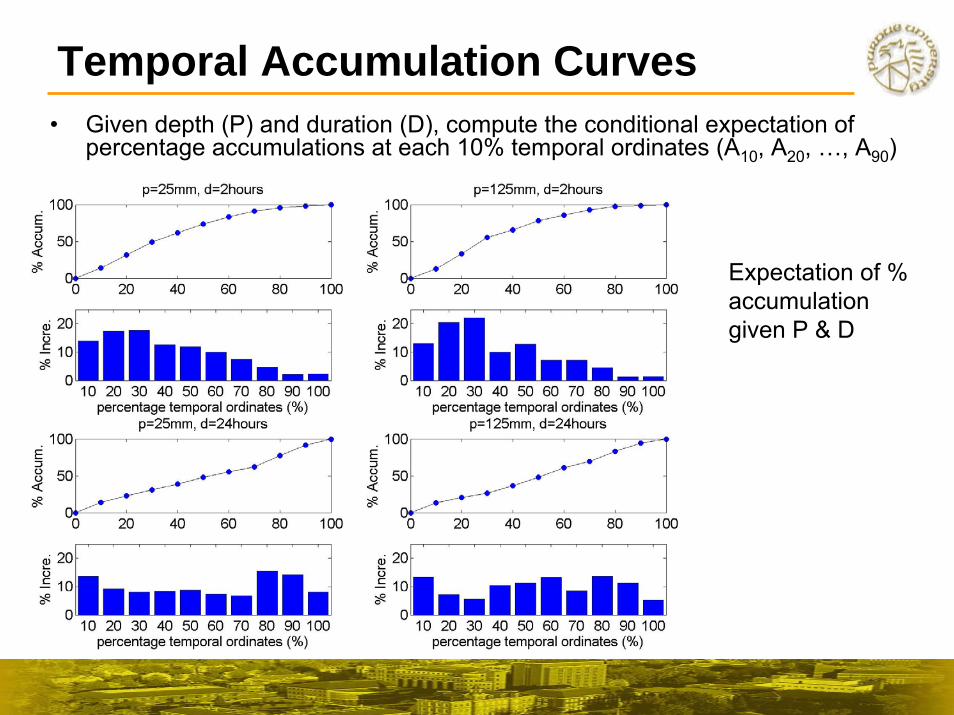
Temporal Accumulation Curves
Expectation of % accumulation given P & D
• Given depth (P) and duration (D), compute the conditional expectation of percentage accumulations at each 10% temporal ordinates (A10, A20, …, A90)

Topic 3Drought Frequency Analysis• Challenges in characterizing droughts
– No clear (scientific) definition: deficit of water for prolonged time– Phenomenon dependent in time, space, and between various
variables such as precipitation, streamflow, and soil moisture
• Classification of droughts– Meteorological drought: precipitation deficit– Hydrologic drought: streamflow deficit– Agricultural drought: soil moisture deficit
• Various drought indices– Palmer Drought Severity Index (PDSI), Crop Moisture Index
(CMI), Surface Water Supply Index (SWSI), Vegetation Condition Index (VCI), CPC Soil Moisture, Standardized precipitation index (SPI)

http://drought.unl.edu/dm/monitor.html
US Drought Monitor• Overall drought status
(D0 ~ D4) determined based on various indices together (Svobada et al., 2002)– PDSI– CPC Soil moisture– USGS weekly– Percentage of normal– SPI– VCI
• Linear combination of selected indices (OBDI, objective blend ofdrought indicator) was adopted as the preliminary overall drought status
• The decision of final drought status relies on subjective judgment• Copulas can be adopted to compute the joint distribution of drought
indices, and then used to compute the joint deficit index (JDI)

Precipitation and Streamflow JDIs
r = 0.73

• Required precipitation for reaching joint normal status (cumulative probability to be 0.5) in the future
• Probability of drought recovery
Potential of Future Droughts
• Copulas are found to be flexible for constructing joint distributions (no specific marginals are required).
• The dependence structure can be faithfully preserved
• Copula-based multivariate algorithm is potential for general statistic-related engineering problems
• Caution when using copulas– Need sufficient historic records– Intrinsic assumption of stationary– Difficulties arise in higher dimensions
• Mathematical complexity• Hard to preserve all lower level mutual dependencies• Compatibility problem
Summary and Concluding Remarks
• Deepest gratitude to my advisor, Dr. Rao S. Govindaraju
• Thank all of my committee members– Dr. Dennis A. Lyn– Dr. Devdutta S. Niyogi– Dr. Venkatesh M. Merwade– Dr. Bo Tao
• Special thanks to– Dr. A. Ramachandra Rao– Dr. Jacques W. Delleur
• Thank my family and friends
Acknowledgements

Thank youQuestions?