Multispectral optical tweezers for molecular … optical tweezers for molecular diagnostics of...
7
Multispectral optical tweezers for molecular diagnostics of single biological cells Author(s): Corey Butler, Shima Fardad, Alex Sincore, Marie Vangheluwe, Matthieu Baudelet * , Martin Richardson, Townes Laser Institute, CREOL – The College of Optics and Photonics, Univ. of Central Florida (United States) ABSTRACT Optical trapping of single biological cells has become an established technique for controlling and studying fundamental behavior of single cells with their environment without having "many-body" interference. The development of such an instrument for optical diagnostics (including Raman and fluorescence for molecular diagnostics) via laser spectroscopy with either the "trapping" beam or secondary beams is still in progress. This paper shows the development of modular multi-spectral imaging optical tweezers combining Raman and Fluorescence diagnostics of biological cells. Keywords: Optical trapping, Optical tweezers, Raman spectroscopy, fluorescence, single-cell spectroscopy 1. INTRODUCTION While optical trapping was originally demonstrated nearly a quarter century ago 1 , there continues to be innovation in the subject, particularly when combining trapping with other laser-based applications like spectroscopy. The physics of optical traps has been extensively characterized 2 and can be simplified into the balance of two opposing forces. A scattering force induced by the incident light is opposed by a gradient force, induced by refraction of light through objects whose index of refraction is greater than the surrounding medium 3 . These counteracting forces cause micrometer- and sub-micron-sized objects to reach an equilibrium position near the beam waist, where they remain “trapped.” A principal issue in laser spectroscopy of single cells is the ability to keep the cell spatially confined over the duration of signal acquisition. Cellular samples are in constant motion due to inherent Brownian motion and suspension in aqueous solution. Since most spectroscopic techniques require integration times on the order of seconds, being able to keep the cell still without damage is crucial. Optical trapping has proven to be very useful in this effort 4 – by using a tightly focused laser beam, cells can not only be prevented from drifting in their surrounding medium, but they can even be manipulated and sorted 5 , hence the common name “optical tweezers.” Although biological cells are typically much larger than micrometers and composed mostly of water, various organelles within the cells are small enough to be trapped, thereby allowing the entire cell to be stabilized. It has been shown that eukaryotic cells are most easily trapped by their densest internal structure, the nucleus 6 , however it is possible to trap other organelles as well, such as mitochondria, which range in size from 0.5μm to 5μm 7 . Once the cell has been stabilized in the optical trap, various diagnostics can be performed with a higher signal-to- noise ratio (SNR). One such diagnostic technique is Raman spectroscopy, which lends itself particularly well to in situ biological applications 8 . Raman spectroscopy is well suited for use with optical tweezers systems because both techniques require a very tightly focused beam for optimal performance 9 . While the trapping beam of optical tweezers is typically used to excite the vibrational levels measured in Raman spectroscopy, it is also possible to utilize a secondary excitation beam, allowing for shorter acquisition time of the Raman signal. Acquiring a Raman signal from biological media is a non-trivial endeavor for two main reasons: these samples are suspended in an aqueous solution and therefore are in constant motion, and the traditional Raman signal is inherently weak compared to the Rayleigh scattered signal, thus necessitating long acquisition times to accurately see the spectrum. The need for long acquisition times is obviated by stabilizing the suspended particles with optical tweezers 10 . Raman optical tweezers have been extensively studied 8 , with some promising applications including tumor identification 11,12 and cell surgery for organelle extraction 13 . Xie et al. * [email protected] Invited Paper Imaging, Manipulation, and Analysis of Biomolecules, Cells, and Tissues X, edited by Daniel L. Farkas, Dan V. Nicolau, Robert C. Leif, Proc. of SPIE Vol. 8225, 82250C · © 2012 SPIE · CCC code: 1605-7422/12/$18 · doi: 10.1117/12.909666 Proc. of SPIE Vol. 8225 82250C-1 Downloaded from SPIE Digital Library on 14 Feb 2012 to 132.170.69.213. Terms of Use: http://spiedl.org/terms
Transcript of Multispectral optical tweezers for molecular … optical tweezers for molecular diagnostics of...
Multispectral optical tweezers for molecular diagnostics of single biological cells
Author(s): Corey Butler, Shima Fardad, Alex Sincore, Marie Vangheluwe, Matthieu Baudelet*, Martin Richardson,
Townes Laser Institute, CREOL – The College of Optics and Photonics, Univ. of Central Florida (United States)
ABSTRACT
Optical trapping of single biological cells has become an established technique for controlling and studying fundamental behavior of single cells with their environment without having "many-body" interference. The development of such an instrument for optical diagnostics (including Raman and fluorescence for molecular diagnostics) via laser spectroscopy with either the "trapping" beam or secondary beams is still in progress. This paper shows the development of modular multi-spectral imaging optical tweezers combining Raman and Fluorescence diagnostics of biological cells. Keywords: Optical trapping, Optical tweezers, Raman spectroscopy, fluorescence, single-cell spectroscopy
1. INTRODUCTION While optical trapping was originally demonstrated nearly a quarter century ago1, there continues to be innovation in
the subject, particularly when combining trapping with other laser-based applications like spectroscopy. The physics of optical traps has been extensively characterized2 and can be simplified into the balance of two opposing forces. A scattering force induced by the incident light is opposed by a gradient force, induced by refraction of light through objects whose index of refraction is greater than the surrounding medium3. These counteracting forces cause micrometer- and sub-micron-sized objects to reach an equilibrium position near the beam waist, where they remain “trapped.”
A principal issue in laser spectroscopy of single cells is the ability to keep the cell spatially confined over the duration of signal acquisition. Cellular samples are in constant motion due to inherent Brownian motion and suspension in aqueous solution. Since most spectroscopic techniques require integration times on the order of seconds, being able to keep the cell still without damage is crucial. Optical trapping has proven to be very useful in this effort4 – by using a tightly focused laser beam, cells can not only be prevented from drifting in their surrounding medium, but they can even be manipulated and sorted5, hence the common name “optical tweezers.” Although biological cells are typically much larger than micrometers and composed mostly of water, various organelles within the cells are small enough to be trapped, thereby allowing the entire cell to be stabilized. It has been shown that eukaryotic cells are most easily trapped by their densest internal structure, the nucleus6, however it is possible to trap other organelles as well, such as mitochondria, which range in size from 0.5µm to 5µm7.
Once the cell has been stabilized in the optical trap, various diagnostics can be performed with a higher signal-to-noise ratio (SNR). One such diagnostic technique is Raman spectroscopy, which lends itself particularly well to in situ biological applications8. Raman spectroscopy is well suited for use with optical tweezers systems because both techniques require a very tightly focused beam for optimal performance9. While the trapping beam of optical tweezers is typically used to excite the vibrational levels measured in Raman spectroscopy, it is also possible to utilize a secondary excitation beam, allowing for shorter acquisition time of the Raman signal. Acquiring a Raman signal from biological media is a non-trivial endeavor for two main reasons: these samples are suspended in an aqueous solution and therefore are in constant motion, and the traditional Raman signal is inherently weak compared to the Rayleigh scattered signal, thus necessitating long acquisition times to accurately see the spectrum. The need for long acquisition times is obviated by stabilizing the suspended particles with optical tweezers10. Raman optical tweezers have been extensively studied8, with some promising applications including tumor identification11,12 and cell surgery for organelle extraction13. Xie et al.
Invited Paper
Imaging, Manipulation, and Analysis of Biomolecules, Cells, and Tissues X, edited by Daniel L. Farkas, Dan V. Nicolau,Robert C. Leif, Proc. of SPIE Vol. 8225, 82250C · © 2012 SPIE · CCC code: 1605-7422/12/$18 · doi: 10.1117/12.909666
Proc. of SPIE Vol. 8225 82250C-1
Downloaded from SPIE Digital Library on 14 Feb 2012 to 132.170.69.213. Terms of Use: http://spiedl.org/terms
demonstrated the advantages of a Raman spectroscopy optical tweezers system in detecting signature differences between living and dead yeast cells that traditional imaging techniques cannot discern14.
In the study of biological samples, special care must be taken not to damage the sample during trapping or diagnostics. It is therefore critically important to use an appropriate incident beam wavelength and intensity, such that the molecules are sufficiently excited, but not damaged in the process. By using low power continuous wave (CW) sources and an excitation wavelength far from resonance frequencies, cell damage due to absorption can be reduced9. For this reason, it is common4,8 to use near-IR excitation wavelengths with milliWatts of power in biological Raman laser tweezers.
The concept of multispectral optical tweezers presented here combines Raman spectroscopy with traditional fluorescence imaging into the same optical trapping setup. Using a 532nm laser as both the excitation and the trapping beam, it is possible to trap the cell while acquiring the Raman signature as well as fluorescence emission spectrum and simultaneously imaging the cell15. We first demonstrate the use of the system on polystyrene beads, before expanding the investigation to biological samples by providing a multispectral analysis of live yeast cells.
2. EXPERIMENTAL SETUP Our experimental setup (Figure 1) combines a traditional optical tweezers setup (OTKB, Thorlabs), an imaging
system, and a Raman signal acquisition element. Trapping and Raman excitation were stimulated by a CW, 532nm single mode beam, with power varying from 5mW to 30mW (Laserglow Aries-20). 2.1 Optical Tweezers Setup
The trapping beam was expanded using a 3.5:1 telescoping lens system, and a 50/50 dichroic beamsplitter was used to allow the beam to propagate to the sample stage as well as the imaging and signal acquisition components. By forming a conjugate plane between a beam steering mirror and the sample plane, the trap position could be controlled without degrading trap performance. This conjugation was achieved by placing the beam steering mirror at the focal point of the first lens in the telescope (L1) and the microscope objective at the focal point of the second lens (L2). A 100x microscope objective with a high numerical aperture (NA=1.25) was used to tightly focus the trapping beam. Maximum focus was achieved by expanding the beam to slightly overfill the back aperture of this objective. The theoretical spot diameter for this objective at a wavelength of 532nm can be calculated to be 0.519µm. The samples (Sigma Aldrich LB30-1ML 3µm polystyrene beads, Spherotech SPHERO 1.09µm polystyrene particles PP-10-10 Lot #Z01, Sigma Aldrich L3030-1ML 2µm dyed fluorescent polystyrene beads, and live yeast cells stained with Rhodamine B, hexyl ester, suspended in a 10mM Hepes buffer with 5% glucose) were placed on thin glass coverslips and situated on a precise XYZ translation stage to provide 3-dimensional range of motion. Immersion oil was used to match the refractive index between the microscope objective and the glass coverslip. 2.2 Image Acquisition
A 10x microscope objective was placed above the sample, condensing a white light source that provided illumination for the CCD (Thorlabs USB 2.0 Digital Camera DCU224C-BG), which was placed on the back-reflected side of the dichroic mirror. Images were stored as 1280x1024 pixel JPEG files with a resolution of 98nm/pixel. 2.3 Raman and Fluorescence Spectrum Acquisition
A flipping mirror was used to allow the white light and backscattered light from the sample to be directed either to the CCD or to the spectrometer. The signal (either Raman or fluorescence emission) was collected after a 532nm long pass edge filter (Semrock LP03-532RS-25), and focused into a fiber leading to an Ocean Optics HR4000 Spectrometer.
Proc. of SPIE Vol. 8225 82250C-2
Downloaded from SPIE Digital Library on 14 Feb 2012 to 132.170.69.213. Terms of Use: http://spiedl.org/terms

Figure 1. Experimental setup for multispectral optical tweezers.
3. RESULTS AND DISCUSSION 3.1 Raman and fluorescence spectroscopy from trapped polystyrene beads
The range of motion of the optical trap was measured by varying the rotation of the beam steering mirror in both the x- and y-directions without moving the 3D-translation stage. Figure 2 demonstrates the motion of a 1µm polystyrene bead as it is translated sequentially from point (a) to point (e). The total range of motion in the x-direction was 26µm, and the range of motion in the y-direction was 37µm, demonstrating stable trap control over a total 45µm displacement.
Figure 2. Demonstration of the range of motion of a trapped 1µm polystyrene bead. The bead was moved sequentially from point (a) to point (e) by varying the rotation of the beam steering mirror. Stable trap control was demonstrated over a displacement of 45µm.
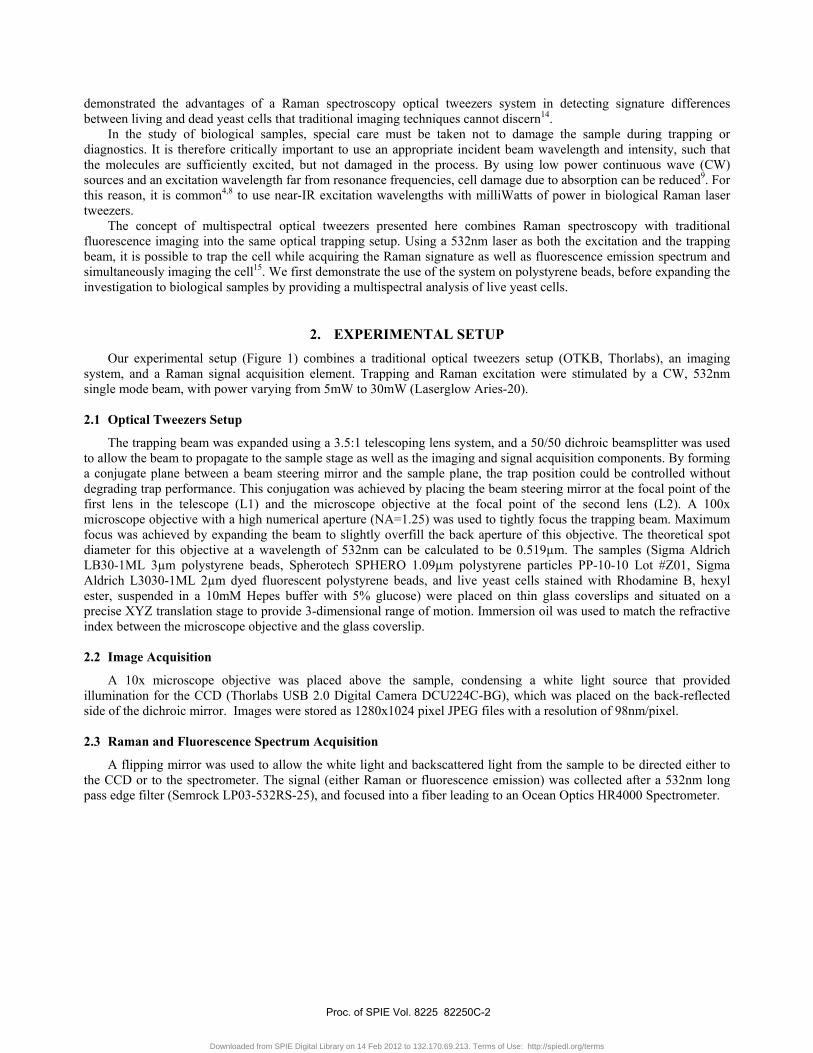
Using a 532nm excitation source, calibration of the multispectral optical tweezers system in the Raman mode was initially performed using a silicon wafer to confirm a strong known Raman shift at 522cm-1. Since the Raman spectrum of a trapped object is known to differ from that of the same object untrapped10, 3µm polystyrene beads were used to ensure trap stability as well as Raman spectrum accuracy. As expected, the Raman spectrum (Figure 3) shows a strong shift at 1001cm-1 from the breathing of the phenyl group in the polystyrene beads, confirming proper calibration.
Proc. of SPIE Vol. 8225 82250C-3
Downloaded from SPIE Digital Library on 14 Feb 2012 to 132.170.69.213. Terms of Use: http://spiedl.org/terms
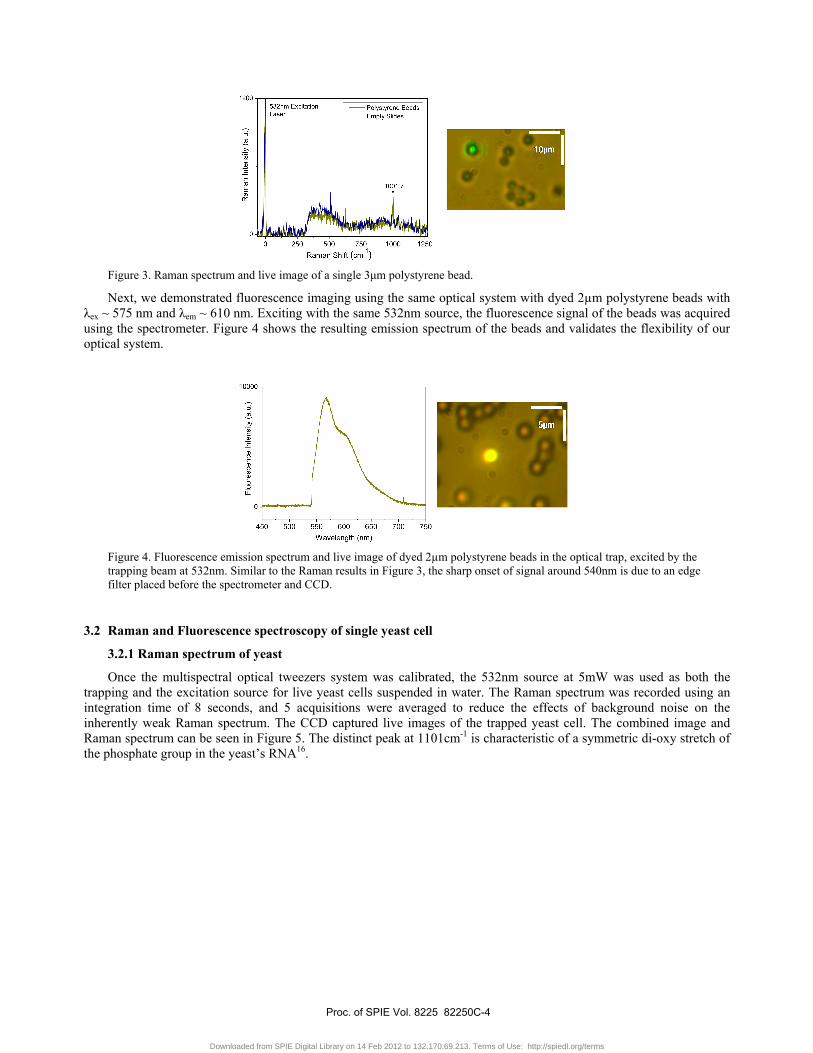
Figure 3. Raman spectrum and live image of a single 3μm polystyrene bead.
Next, we demonstrated fluorescence imaging using the same optical system with dyed 2µm polystyrene beads with λex ~ 575 nm and λem ~ 610 nm. Exciting with the same 532nm source, the fluorescence signal of the beads was acquired using the spectrometer. Figure 4 shows the resulting emission spectrum of the beads and validates the flexibility of our optical system.
Figure 4. Fluorescence emission spectrum and live image of dyed 2µm polystyrene beads in the optical trap, excited by the trapping beam at 532nm. Similar to the Raman results in Figure 3, the sharp onset of signal around 540nm is due to an edge filter placed before the spectrometer and CCD.
3.2 Raman and Fluorescence spectroscopy of single yeast cell
3.2.1 Raman spectrum of yeast
Once the multispectral optical tweezers system was calibrated, the 532nm source at 5mW was used as both the trapping and the excitation source for live yeast cells suspended in water. The Raman spectrum was recorded using an integration time of 8 seconds, and 5 acquisitions were averaged to reduce the effects of background noise on the inherently weak Raman spectrum. The CCD captured live images of the trapped yeast cell. The combined image and Raman spectrum can be seen in Figure 5. The distinct peak at 1101cm-1 is characteristic of a symmetric di-oxy stretch of the phosphate group in the yeast’s RNA16.
Proc. of SPIE Vol. 8225 82250C-4
Downloaded from SPIE Digital Library on 14 Feb 2012 to 132.170.69.213. Terms of Use: http://spiedl.org/terms
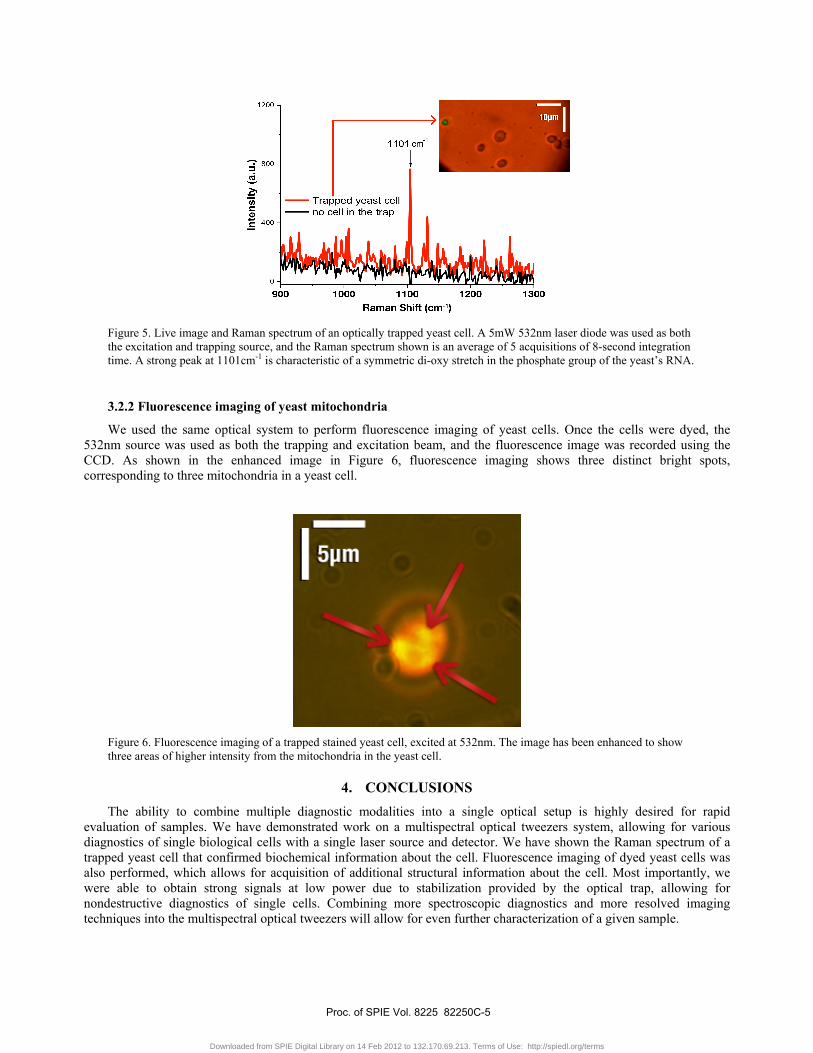
Figure 5. Live image and Raman spectrum of an optically trapped yeast cell. A 5mW 532nm laser diode was used as both the excitation and trapping source, and the Raman spectrum shown is an average of 5 acquisitions of 8-second integration time. A strong peak at 1101cm-1 is characteristic of a symmetric di-oxy stretch in the phosphate group of the yeast’s RNA.
3.2.2 Fluorescence imaging of yeast mitochondria
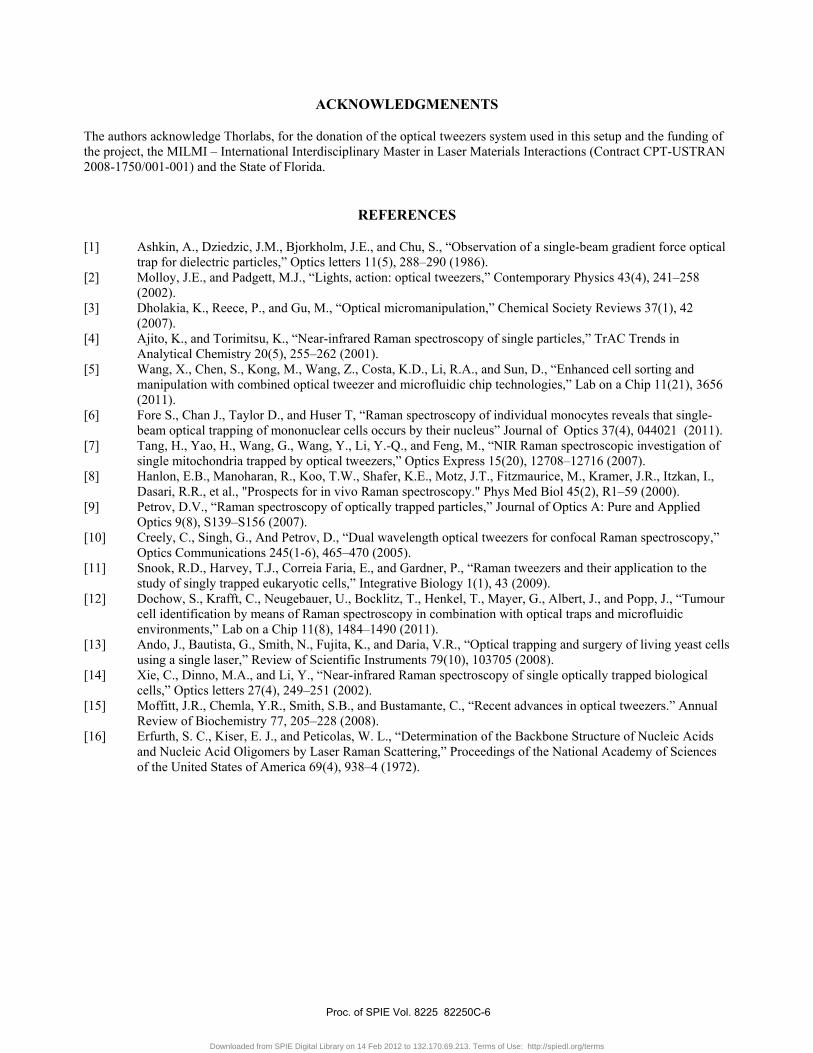
We used the same optical system to perform fluorescence imaging of yeast cells. Once the cells were dyed, the 532nm source was used as both the trapping and excitation beam, and the fluorescence image was recorded using the CCD. As shown in the enhanced image in Figure 6, fluorescence imaging shows three distinct bright spots, corresponding to three mitochondria in a yeast cell.
Figure 6. Fluorescence imaging of a trapped stained yeast cell, excited at 532nm. The image has been enhanced to show three areas of higher intensity from the mitochondria in the yeast cell.
4. CONCLUSIONS The ability to combine multiple diagnostic modalities into a single optical setup is highly desired for rapid
evaluation of samples. We have demonstrated work on a multispectral optical tweezers system, allowing for various diagnostics of single biological cells with a single laser source and detector. We have shown the Raman spectrum of a trapped yeast cell that confirmed biochemical information about the cell. Fluorescence imaging of dyed yeast cells was also performed, which allows for acquisition of additional structural information about the cell. Most importantly, we were able to obtain strong signals at low power due to stabilization provided by the optical trap, allowing for nondestructive diagnostics of single cells. Combining more spectroscopic diagnostics and more resolved imaging techniques into the multispectral optical tweezers will allow for even further characterization of a given sample.
Proc. of SPIE Vol. 8225 82250C-5
Downloaded from SPIE Digital Library on 14 Feb 2012 to 132.170.69.213. Terms of Use: http://spiedl.org/terms
ACKNOWLEDGMENENTS
The authors acknowledge Thorlabs, for the donation of the optical tweezers system used in this setup and the funding of the project, the MILMI – International Interdisciplinary Master in Laser Materials Interactions (Contract CPT-USTRAN 2008-1750/001-001) and the State of Florida.
REFERENCES
[1] Ashkin, A., Dziedzic, J.M., Bjorkholm, J.E., and Chu, S., “Observation of a single-beam gradient force optical trap for dielectric particles,” Optics letters 11(5), 288–290 (1986).
[2] Molloy, J.E., and Padgett, M.J., “Lights, action: optical tweezers,” Contemporary Physics 43(4), 241–258 (2002).
[3] Dholakia, K., Reece, P., and Gu, M., “Optical micromanipulation,” Chemical Society Reviews 37(1), 42 (2007).
[4] Ajito, K., and Torimitsu, K., “Near-infrared Raman spectroscopy of single particles,” TrAC Trends in Analytical Chemistry 20(5), 255–262 (2001).
[5] Wang, X., Chen, S., Kong, M., Wang, Z., Costa, K.D., Li, R.A., and Sun, D., “Enhanced cell sorting and manipulation with combined optical tweezer and microfluidic chip technologies,” Lab on a Chip 11(21), 3656 (2011).
[6] Fore S., Chan J., Taylor D., and Huser T, “Raman spectroscopy of individual monocytes reveals that single-beam optical trapping of mononuclear cells occurs by their nucleus” Journal of Optics 37(4), 044021 (2011).
[7] Tang, H., Yao, H., Wang, G., Wang, Y., Li, Y.-Q., and Feng, M., “NIR Raman spectroscopic investigation of single mitochondria trapped by optical tweezers,” Optics Express 15(20), 12708–12716 (2007).
[8] Hanlon, E.B., Manoharan, R., Koo, T.W., Shafer, K.E., Motz, J.T., Fitzmaurice, M., Kramer, J.R., Itzkan, I., Dasari, R.R., et al., "Prospects for in vivo Raman spectroscopy." Phys Med Biol 45(2), R1–59 (2000).
[9] Petrov, D.V., “Raman spectroscopy of optically trapped particles,” Journal of Optics A: Pure and Applied Optics 9(8), S139–S156 (2007).
[10] Creely, C., Singh, G., And Petrov, D., “Dual wavelength optical tweezers for confocal Raman spectroscopy,” Optics Communications 245(1-6), 465–470 (2005).
[11] Snook, R.D., Harvey, T.J., Correia Faria, E., and Gardner, P., “Raman tweezers and their application to the study of singly trapped eukaryotic cells,” Integrative Biology 1(1), 43 (2009).
[12] Dochow, S., Krafft, C., Neugebauer, U., Bocklitz, T., Henkel, T., Mayer, G., Albert, J., and Popp, J., “Tumour cell identification by means of Raman spectroscopy in combination with optical traps and microfluidic environments,” Lab on a Chip 11(8), 1484–1490 (2011).
[13] Ando, J., Bautista, G., Smith, N., Fujita, K., and Daria, V.R., “Optical trapping and surgery of living yeast cells using a single laser,” Review of Scientific Instruments 79(10), 103705 (2008).
[14] Xie, C., Dinno, M.A., and Li, Y., “Near-infrared Raman spectroscopy of single optically trapped biological cells,” Optics letters 27(4), 249–251 (2002).
[15] Moffitt, J.R., Chemla, Y.R., Smith, S.B., and Bustamante, C., “Recent advances in optical tweezers.” Annual Review of Biochemistry 77, 205–228 (2008).
[16] Erfurth, S. C., Kiser, E. J., and Peticolas, W. L., “Determination of the Backbone Structure of Nucleic Acids and Nucleic Acid Oligomers by Laser Raman Scattering,” Proceedings of the National Academy of Sciences of the United States of America 69(4), 938–4 (1972).
Proc. of SPIE Vol. 8225 82250C-6
Downloaded from SPIE Digital Library on 14 Feb 2012 to 132.170.69.213. Terms of Use: http://spiedl.org/terms

Copyright 2012 Society of Photo-Optical Instrumentation Engineers. One print or electronic copy may be made for personal use only.
Systematic electronic or print reproduction and distribution, duplication of any material in this paper for a fee or for commercial purposes, or
modification of the content of the paper are prohibited.