Multispectral images of Mercury from the first … images of Mercury from the first MESSENGER...
11
Multispectral images of Mercury from the first MESSENGER flyby: Analysis of global and regional color trends David T. Blewett a, ⁎, Mark S. Robinson b , Brett W. Denevi b , Jeffrey J. Gillis-Davis c , James W. Head d , Sean C. Solomon e , Gregory M. Holsclaw f , William E. McClintock f a Johns Hopkins University Applied Physics Laboratory, MS MP3-E169,11100 Johns Hopkins Rd., Laurel, MD 20723, USA b School of Earth and Space Exploration, Arizona State University, Tempe, AZ 85287, USA c Hawaii Institute of Geophysics and Planetology, University of Hawaii, Honolulu, HI 96822, USA d Department of Geological Sciences, Brown University, Providence, RI 02912, USA e Department of Terrestrial Magnetism, Carnegie Institution of Washington, Washington, DC 20015, USA f Laboratory for Atmospheric and Space Physics, University of Colorado, Boulder, CO 80303, USA abstract article info Article history: Accepted 13 February 2009 Available online 7 April 2009 Keywords: Mercury (planet) MESSENGER reflectance spectroscopy multispectral imaging surface composition We have analyzed MESSENGER multispectral images of Mercury in order to gain information on the nature of materials present on the planet's surface. The quantitative analysis tools of Lucey, which are built on the Hapke conceptual framework for the reflectance of a silicate regolith, allow us to derive spectral parameter images that are sensitive to the abundance of ferrous iron in silicates, the abundance of opaque phases, and the state of maturity of the surface. Consistent with previous estimates, we conclude that the silicate portion of Mercury's surface is low in ferrous iron, with a small range of variation. The spectral changes that accompany regolith maturation on Mercury are consistent with lunar-style space weathering via the accumulation of nanophase iron. The spectral character of Mercury's major surface units (high-reflectance plains, intermediate terrain, and low-reflectance material) can be attributed to variations in the abundance of an opaque phase(s). A class of minor color unit, the red spots, occurs in at least three morphological varieties, two of which are associated with deposits interpreted to be of pyroclastic origin. The bright crater floor deposits, a second type of minor unit, have extremely shallow (“blue”) spectral slopes that are unrelated to the presence of immature material. © 2009 Elsevier B.V. All rights reserved. 1. Introduction Reflectance spectroscopy is an important technique for probing the composition and physical state of planetary surfaces (e.g., Pieters and Englert, 1993; Hapke, 1993). For the planet Mercury, data collected with Earth-based telescopes established that the disc-integrated spectrum has a positively sloped continuum, i.e., reflectance increases with increasing wavelength (e.g., Irvine et al., 1968; McCord and Adams, 1972; McCord and Clark, 1979). Spectra of the Moon and some asteroids exhibit an absorption band in the near infrared (NIR) at ~1000 nm caused by ferrous iron in silicates, and there was controversy over the presence of this feature in spectra of Mercury (e.g., review by Vilas, 1988). The Mariner 10 spacecraft made close-up observations of Mercury in 1974–75, although images were collected through only a few color filters in the ultraviolet (UV) and visible (e.g., Murray et al., 1974; Hapke et al., 1975b). In the time since Mariner 10, increasingly sophisticated Earth-based efforts have obtained disc-resolved imaging and spectroscopy despite the challenges of observing a target with small angular separation from the Sun (e.g., Warell, 2002, 2003, 2004; Warell and Blewett, 2004; Warell et al., 2006). These observations confirmed the featureless, positively sloping nature of the spectrum, though a weak ferrous band may have been found in spectra from two locations (Warell et al., 2006). The MErcury Surface, Space ENvironment, GEochemistry, and Ranging (MESSENGER) spacecraft's first Mercury flyby on 14 January 2008 (Solomon et al., 2008) returned the first high-spatial-resolution images of the planet since Mariner 10. MESSENGER is equipped with a monochrome narrow-angle camera (NAC) and a multispectral wide- angle camera (WAC); the NAC and WAC are parts of the Mercury Dual Imaging System (MDIS, Hawkins et al., 2007). During the encounter, the NAC and WAC imaged Mercury's surface, including portions that had not been previously viewed by Mariner 10 (Solomon et al., 2008). WAC multispectral images were acquired through 11 filters in the visible and NIR and offer higher sensitivity, better radiometric performance, and greater wavelength coverage than the Mariner 10 two-color vidicon images. Robinson et al. (2008) presented an initial analysis of the first flyby multispectral data. The goals of this paper are to describe further interpretation of MESSENGER multispectral images from the first flyby. We investigate spectral trends related to ferrous-iron abundance, the abundance of Earth and Planetary Science Letters 285 (2009) 272–282 ⁎ Corresponding author. Tel.: +1 443 778 9678; fax: +1 443 778 8939. E-mail address: [email protected] (D.T. Blewett). 0012-821X/$ – see front matter © 2009 Elsevier B.V. All rights reserved. doi:10.1016/j.epsl.2009.02.021 Contents lists available at ScienceDirect Earth and Planetary Science Letters journal homepage: www.elsevier.com/locate/epsl
-
Upload
truonghanh -
Category
Documents
-
view
214 -
download
2
Transcript of Multispectral images of Mercury from the first … images of Mercury from the first MESSENGER...

Earth and Planetary Science Letters 285 (2009) 272–282
Contents lists available at ScienceDirect
Earth and Planetary Science Letters
j ourna l homepage: www.e lsev ie r.com/ locate /eps l
Multispectral images of Mercury from the first MESSENGER flyby: Analysis of globaland regional color trends
David T. Blewett a,⁎, Mark S. Robinson b, Brett W. Denevi b, Jeffrey J. Gillis-Davis c, James W. Head d,Sean C. Solomon e, Gregory M. Holsclaw f, William E. McClintock f
a Johns Hopkins University Applied Physics Laboratory, MS MP3-E169, 11100 Johns Hopkins Rd., Laurel, MD 20723, USAb School of Earth and Space Exploration, Arizona State University, Tempe, AZ 85287, USAc Hawaii Institute of Geophysics and Planetology, University of Hawaii, Honolulu, HI 96822, USAd Department of Geological Sciences, Brown University, Providence, RI 02912, USAe Department of Terrestrial Magnetism, Carnegie Institution of Washington, Washington, DC 20015, USAf Laboratory for Atmospheric and Space Physics, University of Colorado, Boulder, CO 80303, USA
⁎ Corresponding author. Tel.: +1 443 778 9678; fax:E-mail address: [email protected] (D.T. Blew
0012-821X/$ – see front matter © 2009 Elsevier B.V. Adoi:10.1016/j.epsl.2009.02.021
a b s t r a c t
a r t i c l e i n f oArticle history:Accepted 13 February 2009Available online 7 April 2009
Keywords:Mercury (planet)MESSENGERreflectance spectroscopymultispectral imagingsurface composition
We have analyzed MESSENGER multispectral images of Mercury in order to gain information on the nature ofmaterials present on the planet's surface. The quantitative analysis tools of Lucey, which are built on theHapke conceptual framework for the reflectance of a silicate regolith, allow us to derive spectral parameterimages that are sensitive to the abundance of ferrous iron in silicates, the abundance of opaque phases, andthe state of maturity of the surface. Consistent with previous estimates, we conclude that the silicate portionof Mercury's surface is low in ferrous iron, with a small range of variation. The spectral changes thataccompany regolith maturation on Mercury are consistent with lunar-style space weathering via theaccumulation of nanophase iron. The spectral character of Mercury's major surface units (high-reflectanceplains, intermediate terrain, and low-reflectance material) can be attributed to variations in the abundance ofan opaque phase(s). A class of minor color unit, the red spots, occurs in at least three morphological varieties,two of which are associated with deposits interpreted to be of pyroclastic origin. The bright crater floordeposits, a second type of minor unit, have extremely shallow (“blue”) spectral slopes that are unrelated tothe presence of immature material.
© 2009 Elsevier B.V. All rights reserved.
1. Introduction
Reflectance spectroscopy is an important technique for probing thecomposition and physical state of planetary surfaces (e.g., Pieters andEnglert, 1993; Hapke,1993). For the planet Mercury, data collected withEarth-based telescopes established that the disc-integrated spectrumhas a positively sloped continuum, i.e., reflectance increases withincreasingwavelength (e.g., Irvineet al.,1968;McCord andAdams,1972;McCord and Clark, 1979). Spectra of the Moon and some asteroidsexhibit an absorption band in the near infrared (NIR) at ~1000 nmcaused by ferrous iron in silicates, and there was controversy over thepresence of this feature in spectra of Mercury (e.g., review by Vilas,1988). The Mariner 10 spacecraft made close-up observations ofMercury in 1974–75, although images were collected through only afew color filters in the ultraviolet (UV) and visible (e.g., Murray et al.,1974; Hapke et al., 1975b). In the time since Mariner 10, increasinglysophisticated Earth-based efforts have obtained disc-resolved imagingand spectroscopy despite the challenges of observing a targetwith small
+1 443 778 8939.ett).
ll rights reserved.
angular separation from the Sun (e.g., Warell, 2002, 2003, 2004;Warelland Blewett, 2004; Warell et al., 2006). These observations confirmedthe featureless, positively slopingnature of the spectrum, though aweakferrous bandmayhave been found in spectra fromtwo locations (Warellet al., 2006).
The MErcury Surface, Space ENvironment, GEochemistry, andRanging (MESSENGER) spacecraft's first Mercury flyby on 14 January2008 (Solomon et al., 2008) returned the first high-spatial-resolutionimages of the planet since Mariner 10. MESSENGER is equipped with amonochrome narrow-angle camera (NAC) and a multispectral wide-angle camera (WAC); the NAC and WAC are parts of the Mercury DualImaging System (MDIS, Hawkins et al., 2007). During the encounter, theNACandWAC imagedMercury's surface, includingportions that had notbeen previously viewed by Mariner 10 (Solomon et al., 2008). WACmultispectral images were acquired through 11 filters in the visible andNIR and offer higher sensitivity, better radiometric performance, andgreater wavelength coverage than the Mariner 10 two-color vidiconimages. Robinson et al. (2008) presented an initial analysis of the firstflyby multispectral data.
The goals of this paper are to describe further interpretation ofMESSENGER multispectral images from the first flyby. We investigatespectral trends related to ferrous-iron abundance, the abundance of
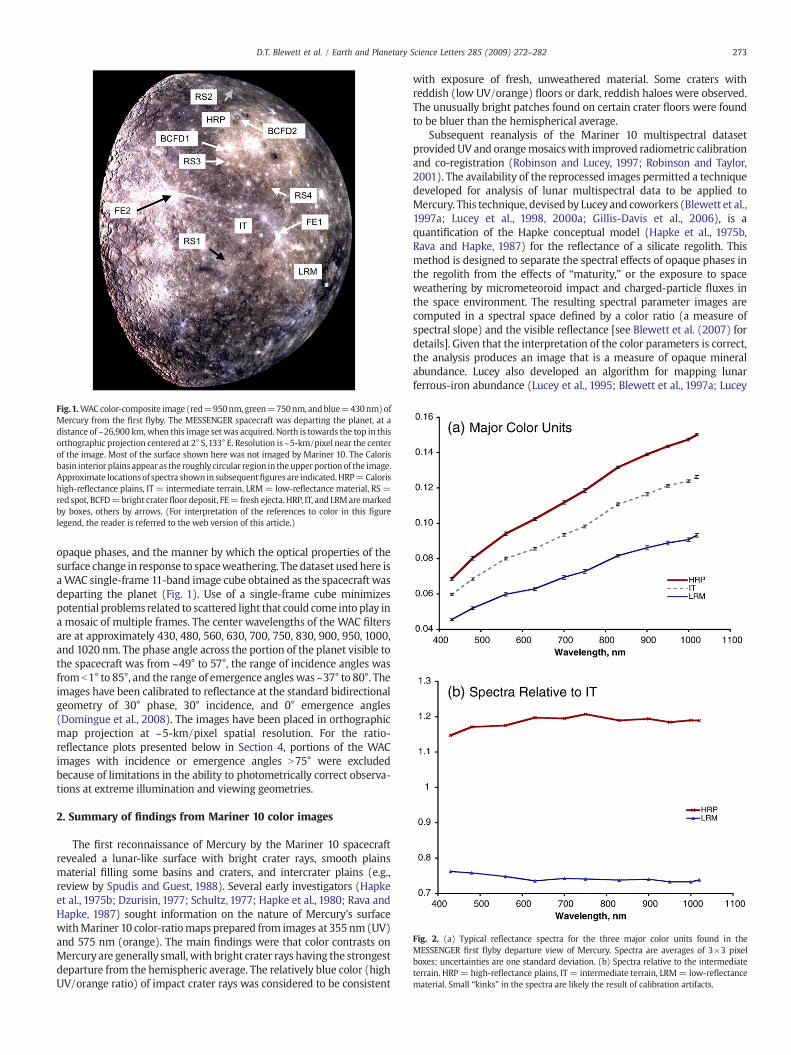
Fig.1.WACcolor-composite image (red=950nm, green=750nm, andblue=430nm)ofMercury from the first flyby. The MESSENGER spacecraft was departing the planet, at adistance of ~26,900 km,when this image set was acquired. North is towards the top in thisorthographic projection centered at 2° S,133° E. Resolution is ~5-km/pixel near the centerof the image. Most of the surface shown here was not imaged by Mariner 10. The Calorisbasin interior plains appearas the roughly circular region in theupper portion of the image.Approximate locationsof spectra shown in subsequentfigures are indicated.HRP=Calorishigh-reflectance plains, IT = intermediate terrain, LRM= low-reflectance material, RS =red spot, BCFD=bright craterfloor deposit, FE= fresh ejecta. HRP, IT, and LRMaremarkedby boxes, others by arrows. (For interpretation of the references to color in this figurelegend, the reader is referred to the web version of this article.)
Fig. 2. (a) Typical reflectance spectra for the three major color units found in theMESSENGER first flyby departure view of Mercury. Spectra are averages of 3×3 pixelboxes; uncertainties are one standard deviation. (b) Spectra relative to the intermediateterrain. HRP= high-reflectance plains, IT= intermediate terrain, LRM= low-reflectancematerial. Small “kinks” in the spectra are likely the result of calibration artifacts.
273D.T. Blewett et al. / Earth and Planetary Science Letters 285 (2009) 272–282
opaque phases, and the manner by which the optical properties of thesurface change in response to spaceweathering. The dataset used here isaWAC single-frame 11-band image cube obtained as the spacecraft wasdeparting the planet (Fig. 1). Use of a single-frame cube minimizespotential problems related to scattered light that could come into play ina mosaic of multiple frames. The center wavelengths of the WAC filtersare at approximately 430, 480, 560, 630, 700, 750, 830, 900, 950, 1000,and 1020 nm. The phase angle across the portion of the planet visible tothe spacecraft was from ~49° to 57°, the range of incidence angles wasfrom b1° to 85°, and the range of emergence angleswas ~37° to 80°. Theimages have been calibrated to reflectance at the standard bidirectionalgeometry of 30° phase, 30° incidence, and 0° emergence angles(Domingue et al., 2008). The images have been placed in orthographicmap projection at ~5-km/pixel spatial resolution. For the ratio-reflectance plots presented below in Section 4, portions of the WACimages with incidence or emergence angles N75° were excludedbecause of limitations in the ability to photometrically correct observa-tions at extreme illumination and viewing geometries.
2. Summary of findings from Mariner 10 color images
The first reconnaissance of Mercury by the Mariner 10 spacecraftrevealed a lunar-like surface with bright crater rays, smooth plainsmaterial filling some basins and craters, and intercrater plains (e.g.,review by Spudis and Guest, 1988). Several early investigators (Hapkeet al., 1975b; Dzurisin, 1977; Schultz, 1977; Hapke et al., 1980; Rava andHapke, 1987) sought information on the nature of Mercury's surfacewithMariner 10 color-ratiomaps prepared from images at 355 nm(UV)and 575 nm (orange). The main findings were that color contrasts onMercury are generally small, with bright crater rays having the strongestdeparture from the hemispheric average. The relatively blue color (highUV/orange ratio) of impact crater rays was considered to be consistent
with exposure of fresh, unweathered material. Some craters withreddish (low UV/orange) floors or dark, reddish haloes were observed.The unusually bright patches found on certain crater floors were foundto be bluer than the hemispherical average.
Subsequent reanalysis of the Mariner 10 multispectral datasetprovided UV and orangemosaicswith improved radiometric calibrationand co-registration (Robinson and Lucey, 1997; Robinson and Taylor,2001). The availability of the reprocessed images permitted a techniquedeveloped for analysis of lunar multispectral data to be applied toMercury. This technique, devised by Lucey and coworkers (Blewett et al.,1997a; Lucey et al., 1998, 2000a; Gillis-Davis et al., 2006), is aquantification of the Hapke conceptual model (Hapke et al., 1975b,Rava and Hapke, 1987) for the reflectance of a silicate regolith. Thismethod is designed to separate the spectral effects of opaque phases inthe regolith from the effects of “maturity,” or the exposure to spaceweathering by micrometeoroid impact and charged-particle fluxes inthe space environment. The resulting spectral parameter images arecomputed in a spectral space defined by a color ratio (a measure ofspectral slope) and the visible reflectance [see Blewett et al. (2007) fordetails]. Given that the interpretation of the color parameters is correct,the analysis produces an image that is a measure of opaque mineralabundance. Lucey also developed an algorithm for mapping lunarferrous-iron abundance (Lucey et al., 1995; Blewett et al., 1997a; Lucey

274 D.T. Blewett et al. / Earth and Planetary Science Letters 285 (2009) 272–282
et al.,1998, 2000a;Wilcox et al., 2005) and opticalmaturity (Lucey et al.,2000b; Grier et al., 2001) that employs a spectral ratio that is sensitive tovariations in the ferrous-iron 1000-nm absorption band. However,because thewavelength coverage of theMariner 10 vidicon cameras didnot extend into the NIR, this type of analysis could not be carried out forMercury.
The reprocessed Mariner 10 first-encounter images (3 km/pixel)demonstrated that color boundaries commonly correspond to geomor-phologic units (Robinson and Lucey, 1997; Robinson and Taylor, 2001),which was not certain in the initial color-ratio maps (e.g., Rava andHapke, 1987). Opaque-parameter images revealed that smooth plainsdeposits near the crater Rudaki andwithin the Tolstoj basin are lower inopaque content than the underlying material. This color contrast withthe surroundings, along with embayment relations, was cited asevidence that these smooth plains were emplaced as lava flows andnot basin ejecta (Robinson and Lucey,1997; Robinson and Taylor, 2001).Theseworkers also noted low-reflectancematerialwith relatively bluishcolor (and hence higher values of the opaque parameter) andmorphological expression suggestive of pyroclastic deposition. Craterssuch as Kuiper andMurasaki were found to have exposedmaterial withlower opaque content compared with the surroundings. Kuiper's raysappear bright mostly because they are immature, though the low-opaque content of the ejecta also contributes to their high albedo(Robinson and Lucey, 1997; Blewett et al., 2007). Lermontov and some
Fig. 3. Comparison of spectra for selected red spots with the spectrum of the high-reflectance plains. (a) Reflectance spectra are averages of 3×3 pixel boxes; uncertaintiesare one standard deviation. (b) Spectra relative to the intermediate terrain. Red Spots 1and 2 are within the craters Moody and Navoi, respectively. Small “kinks” in the spectraare likely the result of calibration artifacts.
Fig. 4. Comparison of spectra for bright crater floor deposits (BCFDs) with spectra offresh ejecta. (a) Reflectance spectra. (b) Spectra relative to the intermediate terrain.BCDF 1 is found in the crater Kertséz; BCFD 2 is in the crater Sander. Fresh ejecta 1 and 2sample the rays of craters Qi Baishi and Xiao Zhao, respectively. Fresh ejecta andintermediate terrain spectra are averages of 3×3 pixel boxes; BCFD1 and BCFD2 areaverages of 6 and 8 (respectively) individually selected pixels. Error bars in (a) are onestandard deviation. BCDFs have larger uncertainties than the other units shown hereand in Figs. 2 and 3 because of the relatively small spatial extent of BCFDs in relation tothe image pixel resolution, resulting in some mixed pixels that contain non-BCFDmaterial. Small “kinks” in the spectra are likely the result of calibration artifacts.
other older craters, which have lost their rays, have bright floors that arelower in opaque phases than the surroundings, again suggesting thatlow-opaque material resides at depth beneath a moderate-opaquesurface in this region of the planet.
Recently a 1-km/pixel mosaic of Mariner 10 first and secondencounter images in the 490-nm (“clear”) filter has been constructedand calibrated to absolute reflectance (Denevi and Robinson, 2008).Comparison of the reflectance contrast in the new reflectance mosaicbetween immature and mature material on Mercury with that on theMoon is consistent with a more intense space-weathering environ-ment at Mercury, as predicted, e.g., by Cintala (1992). Further, thereflectance of immature mercurian materials (~0.13–0.18 at 490 nmand30° phase) is lower than that of immature lunarhighlandmaterials(~0.20–0.26) (Denevi and Robinson, 2008). This observation stronglyimplies the presence of a low-reflectance component in Mercury'scrust. Plausible phases that can produce low reflectance includeferrous iron in silicates, opaque phases such as ilmenite or coarse-grained metal (Rava and Hapke, 1987), and perhaps carbon.

275D.T. Blewett et al. / Earth and Planetary Science Letters 285 (2009) 272–282
3. Color units and general spectral character from MESSENGERobservations
Threemajor color unitswere found to dominate the surface imaged bythe WAC during MESSENGER's first flyby (Robinson et al., 2008; Fig. 1);these units differ primarily in reflectance, with only slight differences inspectral slope. All known mercurian surfaces exhibit an overall positive“red” spectral slope in the visible to near-infrared wavelength range (e.g.,Vilas, 1988; Warell, 2003; Warell and Valegård, 2006; McClintock et al.,2008; Robinson et al., 2008).Materials onMercury described as “blue” areblue in a relative sense: they actually have positive spectral slopes, but theslopes are less steep than averagematerial. High-reflectance plains (HRP)are foundmost prominentlywithin the Caloris basin and also filling someother large craters. The HRP exhibit a spectral slope slightly steeper(redder) than the hemispheric average. Low-reflectance material (LRM)has a relatively shallow (bluer) spectral slope. LRM occurs as crateredterrain in the southern portion of the MESSENGER first flyby departurehemisphere, as dark rims of some large craters inside Caloris, as anannulus surrounding the Tolstoj basin, and as streaks or tongues of darkmaterial excavated by Mozart and other craters. The intermediate terrain(IT) has reflectance and spectral slope between that of the HRP and LRMand occurs in the equatorial region south of Caloris. Fresh impact cratermaterials (i.e., rays and fresh crater interiors) constitute an additionalspectral class with distinct color properties. Other minor color units,including some seen in Mariner 10 color-ratio images (Dzurisin, 1977;Schultz; 1977; Rava and Hapke, 1987), are recognized from theirprominence in MESSENGER color-composite images (Robinson et al.,2008; Murchie et al., 2008). These include “red spots” and bright craterfloor deposits (BCFDs). Red spots are small areas with moderatereflectance and a relatively red spectrum. Some red spots are associatedwith volcanic centers (Murchie et al., 2008;Head et al., 2008; Kerber et al.,2009-this issue; Head et al., 2009-this issue). BCFDs are enigmaticmaterials found on the floors of craters such as Sander and Kertész, andalso on central peaks and peak-ringmountains of some craters and basins,including Eminescu and Raditladi (Robinson et al., 2008; Prockter et al.,2009). The BCFDs have very high reflectances and blue spectral slopes yetdo not appear to be associated with the presence of fresh ejecta material.
The major color units recognized by Robinson et al. (2008) areapparent in a red–green–blue color-composite image of three spectralbands (Fig. 1). Representative spectra for the major and minor colorunits are plotted in Figs. 2–4. Table 1 presents typical reflectance andspectral ratio values. The visible color ratio (430-nm/750-nm) andnear-infrared color ratio (950-nm/750-nm) are measures of the spectralslope. “Redder” spectra have lower visible color ratios and higher near-infrared ratios; “bluer” spectra are characterized by higher visible colorratios and lower near-infrared ratios. The major color unit spectra differchiefly in overall reflectance,with only small variations in spectral slope.The HRP are brighter and slightly redder than the IT, while the LRM aredarker and slightly bluer.
Conspicuouslyabsent fromthese spectra is evidence for an absorptionnear 1000nm that could be attributed to ferrous iron in silicates. This lackof a 1000-nm band includes spectra for fresh crater materials extractedfrom the WAC image cube (discussed further below). During MESSEN-GER's 14 January2008flyby, theVisible and InfraRedSpectrograph(VIRS)
Table 1Typical spectral characteristics of Mercury surface units shown in Figs. 2–4.
Reflectance Vis ratio NIR ratio
750-nm 430-nm/750-nm 950-nm/750-nm
HRP 0.12 0.58 1.21IT 0.10 0.61 1.23LRM 0.07 0.63 1.22FE 0.16 0.66 1.16RS 0.12 0.57 1.23BCFD 0.16 0.71 1.08
These values are based on preliminary spectral and photometric calibration.
portion of the Mercury Atmospheric and Surface Composition Spectro-meter (MASCS, McClintock and Lankton, 2007), which measures pointspectra in the interval ~325–1300 nm in approximately 400 wavelengthchannels, collected data along a traverse near the equator in theilluminated portion of the planet that was imaged by MDIS. The absenceof the 1000-nm ferrous-iron feature was corroborated by VIRS observa-tions of fresh and mature surfaces (McClintock et al., 2008). Thus theferrous-iron band must be very weak if present at all, becauseunweathered crystalline material exposed in fresh crater depositswould likely exhibit a detectable band. This result implies a very low-FeO content in the silicate portion of surface rocks on Mercury. Forcomparison, a laboratory spectrum of Apollo 16 mature highland soil62231 (~5 wt.% FeO) has a band centered at ~900 nmwith a band depthof ~3% (Blewett and Hawke, 2001). Earth-based and Clementine spectrafor terranes on the Moon with even lower iron content (nearly pureanorthosite, ~2–3wt.% FeO)donotdisplaya1000-nmband(Hawkeet al.,2003; see alsoTompkins and Pieters,1999). However, Clementine spectraof these low-FeO lunar materials do show an inflection near 750 nm thatmay represent the shoulder of aweak1000-nmabsorption (Blewett et al.,2002; Warell and Blewett, 2004). This inflection is not present in theMercury spectra studied here, suggesting that the mercurian surface haseven lower FeO in silicates than lunar pure anorthosites. Thus the lack of a1000-nm ferrous band in MASCS and MDIS spectra is in agreement withmost interpretations of Earth-based spectra of Mercury [see Vilas (1988)for a review, also Warell (2002, 2003) and Warell and Blewett (2004)],althoughWarell et al. (2006) detected a shallow ferrous band attributedto Fe2+ in Ca-rich pyroxene at two locations on Mercury.
Representative spectra for minor color units are presented in Figs. 3and4,with typical reflectance and color-ratiovalues listed inTable 1. Redspots in the circum-Caloris massifs and in areas south and north of thebasin are revealed to be generally similar to the HRP in spectral shape(Fig. 3). This similarity suggests that some red spots may be smalldeposits of HRP material. Their WAC spectra also lack any evidence forthe 1000-nm ferrous-iron absorption band. Fig. 4 illustrates the unusualspectral character of the BCFDs. The two examples shown in the figurehave high overall reflectances (~0.16 at 750 nm, Table 1) and havespectral slopes that are quite blue relative to mature IT (430-nm/750-nm ratios of ~0.71, vs. 0.61 for the IT). The BCFDs are also bluer than thetwo examples of fresh crater ray material shown in Fig. 4 (see alsoTable 1). It is therefore likely that BCFDs are bright and blue because ofinherent compositional reasons and are not related to ordinary freshcrater material. Several workers had noticed anomalous patches ofbright bluish material within some craters in Mariner 10 data (Dzurisin,1977; Schultz, 1977; Rava and Hapke, 1987). Examples include thecraters Theophanes, Tyagaraja, and Zeami. The crater Lermontov has areddish floor (Blewett et al., 2007) containing bright bluish patchesdescribed by Dzurisin (1977). Dzurisin (1977) hypothesized that thebright blue patches were the product of endogenic alteration orrepresented exposure of material with composition differing from thatof the majority of the surface.
The term “red spots” is also applied to a class of spectral anomaly onthe Moon (e.g., Malin, 1974; Head and McCord, 1978; Bruno et al., 1991;Chevrel et al., 1999; Wilson and Head, 2003; Hagerty et al., 2006). Thesesmall areas within the highlands were classically identified on lunarcolor-difference images (Whitaker,1972). The lunar red spots, sometimesfound in clusters, occur as domes, smooth plains units, and roughpatchesof highlands. Many are associated with the Imbrium basin. The lunar redspots may represent an early phase of highland volcanism, thoughspectral, and thus compositional, differences suggest that theremay havebeen multiple origins (Bruno et al., 1991; Hagerty et al., 2006). Themineralogy of the lunar red spots has not been definitively determined.
4. Ratio-reflectance plots for Mercury
Plots of a color ratio against reflectance have proven to be very usefulin understanding the relationships between color, composition and

Fig. 5. Two-dimensional histogram of MESSENGER NIR ratio and reflectance for theMercuryWAC image cube shown in Fig.1. Locations of individual spectral types discussedin the text are marked; error bars are one standard deviation. The general space-weathering trend is from lower right to upper left. (a) Global plot. The plot is color codedto represent the density of points. Each color corresponds to an equal interval in therelative number density of pixels. BCFD = bright crater floor deposit, FE = fresh ejecta,RS = red spot. The relatively large uncertainties for the minor color units are mostly aresult of the small spatial size of the units in relation to the image pixel resolution. (b)Global color-coded data cloud with individual grey-scale histograms for the LRM andCaloris HRP superimposed. Fig. S1 illustrates the portions of the Fig. 1 image that wereincluded in the individual LRM and HRP histograms. (see also Supplementary Fig. S1).
Fig. 6. Ratio-reflectance plots for the nearside of the Moon, constructed fromobservations made by the Galileo spacecraft. The plots are color coded to representthe density of points. (a) Near-IR. The white arrows indicate the major spectral trends,one caused by increasing ferrous iron in silicates, and the other related to reddening anddarkening associated with increasing space weathering (maturity). (b) Visible. Themajor spectral trends are indicated: one in the highlands that is predominantly causedby variations in maturity or ferrous iron in silicates, and the other in the maria,associated with variation in opaque mineral (ilmenite) abundance.
276 D.T. Blewett et al. / Earth and Planetary Science Letters 285 (2009) 272–282
space weathering on the Moon (e.g., Lucey et al., 1998; Shkuratov et al.,1999; Staid and Pieters, 2000), Mercury (Robinson and Lucey, 1997;Blewett et al., 1997b; Warell and Valegård, 2006; Blewett et al., 2007)and asteroids (Murchie et al., 2002). In this section we presentinterpretations of ratio-reflectance plots constructed from MESSENGERWAC images and comparisons with similar plots for the Moon. Theseinterpretations rest on the assumption that the three primary con-trollers of reflectance are ferrous iron in silicates, nanophase ironproduced by space weathering, and opaque phases. Silicate glassescontaining iron and titanium ions exhibit charge-transfer absorptions(e.g., Wells and Hapke, 1977) that could also be expected to affect thespectral characteristics of a regolith at UV to NIRwavelengths. However,as described in the Supplementary data, we do not believe that thatcharge-transfer bands are substantially influencing the observedspectral trends, and therefore we argue that our interpretations basedon the three primary factors are sound.
4.1. Near infrared
MESSENGER provided the first spacecraft spectral data for Mercuryin the NIR. WithWACmultispectral images, it is possible to perform the
Lucey FeO-maturity analysis, mentioned in Section 2, for Mercury. FortheMoon, a plot of the 950-nm/750-nmratio vs. the 750-nmreflectancecharts trends related to ferrous-iron abundance and maturity. The ratiois a measure of both spectral slope and the strength of the 1000-nmferrous silicate band. Increasing FeO abundance will cause a regolith todarken (reducing the 750-nm reflectance) and will also decrease the950-nm/750-nm ratio because of the deeper 1000-nm band. As aregolith is exposed on the surface of an airless body and subjected tomicrometeoroid and charged-particle fluxes, nanophase iron (npFe0) isproduced through reduction and vapor-deposition processes (Hapkeet al., 1975a; Pieters et al., 2000; Hapke, 2001; Noble and Pieters, 2003;Noble et al., 2001). The accumulation of npFe0 as a space-weatheredsurfacematures results in anoverall decrease in reflectance, an increase inthe continuum slope (“reddening”), and muted absorption bands (e.g.,Fischer and Pieters, 1994; Hapke, 2001; Noble et al., 2007; Lucey andNoble, 2008). Thus, maturation reduces the 750-nm reflectance butincreases the 950-nm/750-nm ratio. Despite the fact that Mercuryapparently has exceptionally low ferrous iron in silicates and essentiallyno1000-nmband, it is instructive toexamine theWACdata in this spectralspace so that inferences can be drawn by comparison with the Moon.
Fig. 5a shows a two-dimensional histogram of MESSENGER NIRratio and reflectance for the first flyby departure image cube. The

277D.T. Blewett et al. / Earth and Planetary Science Letters 285 (2009) 272–282
global trend is from fresh, bright material with lower ratio (in thelower right portion of the diagram) to darker, redder mature surfacesin the upper left. This is the type of space-weathering trend seen onthe Moon (e.g., Lucey et al., 1995) and is what would be expected forthe accumulation of npFe0 as regolith is exposed to the space environ-ment over time. The Caloris HRP and the LRM follow individual trendsin the same sense as the global trend (Fig. 5b). Fig. 6a presents ananalogous plot for the nearside of the Moon, constructed fromcalibrated Galileo mosaics obtained during the 1992 Earth–Moonflyby (Belton et al., 1994; data available at http://astrogeology.usgs.gov/Projects/LunarConsortium/). The similar wavelengths of thelunar and mercurian observations allow a semi-quantitative compar-ison. The plot for the Moon (Fig. 6a) is bi-modal because of the largedifference in ferrous-iron content between the maria and the high-lands. Mercury's major color units, on the other hand, form a singlemode, attesting to the very restricted range of FeO content in thesilicate phases within the planet's regolith. The plots also suggest thaton average Mercury has lower reflectance than the average lunarhighlands at ~750 nm, consistent with the findings of Denevi andRobinson (2008) for their Mariner 10 mosaic at 490 nm (see alsoWarell, 2004).
Fig. 7. Two-dimensional histogram of MESSENGER visible ratio and reflectance for theMercuryWAC image cube shown in Fig. 1. Locations of individual spectral types discussedin the text are marked; errors bars are one standard deviation. (a) Global plot. The plot iscolor coded to represent the density of points. Each color corresponds to an equal intervalin the relative number density of pixels. BCFD = bright crater floor deposit, FE = freshejecta, RS= red spot. The relatively large uncertainties for theminor color units aremostlya result of the small spatial size of the units in relation to the image pixel resolution.(b) Global color-coded data cloud with individual grey-scale histograms for the LRM andCaloris HRP superimposed. Fig. S1 illustrates the portions of the Fig. 1 image that wasincluded in the individual LRM and HRP histograms. (see also Supplementary Fig. S1).
The NIR ratio-reflectance plot for Mercury and comparisonwith theMoon highlight the curious situation with regard to iron on the planet.From its high density, it is known that bulk Mercurymust be composedof ~65% iron by mass (e.g., Solomon et al., 2001), concentrated in thecore. Yet avariety of evidence points to low iron in the crust. Earth-basedreflectance spectroscopy (e.g., Vilas, 1988; Warell et al., 2006),interpretation of Mariner 10 images (Hapke, 1977; Rava and Hapke,1987), and results of MESSENGER multispectral imaging and spectro-scopy (Robinson et al., 2008;McClintock et al., 2008) indicate a very lowabundance of ferrous iron in the silicateminerals at the surface (~2wt.%or less). Microwave sensing of the dielectric loss tangent has beeninterpreted to indicate the FeO+TiO2 content of Mercury's surface isless than ~6 wt.% (Mitchell and de Pater, 1994; Jeanloz et al., 1995). Bycontrast, the composition of returned lunar mare soils is ~15–20 wt.%FeO with ~1–10 wt.% TiO2, and that of highland soils from Apollo 16 is~4–6 wt.% FeO with ~0.5 wt.% TiO2 (e.g., Table 1 of Lucey et al., 2000a).
Despite the apparently low iron content of themercurian surface, thespectral trends evident in Fig. 5 are consistent with the accumulation ofnanophase iron in the regolith in response to exposure to the spaceenvironment. It has been suggested that meteoroid infall could supplytheneeded iron (Noble andPieters, 2003). Alternatively, thenpFe0 couldbe derived from Mercury surface materials. Hapke (1977) performedlaboratory vaporization of silicate glasses to simulate the processoccurring duringmicrometeoroid impact and found that an FeO contentof N2% in the starting silicatewas required to produce sufficient npFe0 toaffect the optical properties of the vapor-deposited material. He thusconcluded that the mercurian regolith must contain at least 2–3 wt.%FeO, in order for the observed optical effects of spaceweathering to takeplace. The lack of a 1000-nm absorption band indicates that ferrous ironin silicates is low, though the ultraviolet spectrum implies the presenceof some Fe+2 or Ti+4 (McClintock et al., 2008). Because Mercury onaverage has lower reflectance than the lunar highlands, Denevi andRobinson (2008) deduced that a darkening agent must be present inmercurian material (cf. Figs. 5 and 6a) and that if the absence of the1000-nmband ruled out abundant ferrous iron in silicateminerals orglasses, then opaque phases are the most probable low-reflectancecomponent. Most cosmochemically plausible opaque phases containiron [e.g., meteoritic metal (Fe,Ni), ilmenite (FeTiO3), ulvospinel(Fe2TiO4), and troilite (FeS); see Rava and Hapke (1987), Deneviet al. (2009), and Riner et al. (2009)], and thus could serve as thesource of npFe0 for space weathering. Analysis of spectral trendsassociatedwith variations in opaque-phase abundance is the subjectof Section 4.2.
The nature of minor color units on Mercury's surface may be exam-ined through their location in the ratio-reflectance plots. Fig. 5 includesthe minor color units. As suggested by their overall spectral shape (Fig. 3and Section 3 above), there appears to be a strong affinity between somered spots andHRPmaterial. Spectra for bright craterfloor depositswithinSanderandKertész craters are also shown in Fig. 5. They fall in aportionofthe plot far outside the region defined by themajority of the hemisphereshown in Fig.1. The 750-nm reflectance of these deposits is similar to thatof some fresh crater ejecta (Table 1), but the BCFD are distinctive becauseof their low 950-nm/750-nm ratio values, a result of the relatively flatspectral slope.
4.2. Visible
Examinationof opaquemineral abundance onMercuryusingMariner10 ratio-reflectance analysis in the visible has been reported by Robinsonand Lucey (1997), Robinson and Taylor (2001), and Blewett et al. (2007),and is summarized above in Section 2. MESSENGER data from the firstflyby allow similar studies to be performedwith images of higher quality(in terms of signal-to-noise ratio) compared with Mariner 10.
Fig. 7 shows a two-dimensional histogram constructed from WACimages recorded through the 430- and 750-nm filters. The location ofthe individual histograms for the LRM and Caloris HRPwithin the global

Fig. 8. NIR spectral parameter images for Mercury, constructed from theWAC image cube.(a) Optical maturity parameter OMAT, computed from Eq. (1). Regional color and albedovariations have been largely suppressed, leaving variations related to maturity. Brightertones correspond to fresher (lessmature)material. (b) Parameter θFe, computedby Eq. (2).Maturity variations such as bright crater rays have been minimized, leaving “intrinsic”color and albedo differences. On the Moon, higher values (brighter tones) of the θFeparameter correlate with higher contents of FeO in silicates in the surface. Refer todiscussion in the text.
278 D.T. Blewett et al. / Earth and Planetary Science Letters 285 (2009) 272–282
data cloud reflects the general characteristics of these two units. Themajority of the HRP is higher in 750-nm reflectance than are the LRM.The HRP are also redder (lower 430-nm/750-nm ratio) than the LRM.Both units follow maturity trends that move from higher reflectance,higher ratio to lower reflectance, lower ratio. The “darkening andreddening” behavior tracks that found in the near-IR (Fig. 5) and isconsistent with the optical effects of accumulating npFe0.
Opaque minerals typically exhibit low reflectance and have flat,featureless spectra. Therefore an increase in the abundance of opaquesin amixturewill tend to reduce the overall reflectancewhile decreasingthe spectral slope, making it “bluer” (increasing the 430-nm/750-nmratio). Material with a high opaque mineral content would be foundtoward the upper left portion of the visible ratio-reflectanceplot (Fig. 7).The relative positions of the HRP and LRM in Fig. 7 suggest that theprimary spectral difference between the two units is the opaquecontent.
In the 430-nm/750-nm vs. 750-nm reflectance spectral space, theeffects of nanophase iron are essentially the same as that of ferrousiron in silicates: an increase in the abundance of either would lead tooverall darkening and spectral reddening (i.e., a decrease in the 430-nm/750-nm ratio). Hence maturity cannot be decoupled fromferrous-iron composition in the visible-wavelength analysis. However,as described in the previous section, there is strong evidence thatferrous-iron content in Mercury's surface silicates is low, with littlevariation.
The Moon's characteristics in visible ratio-reflectance space areillustrated with Galileo data in Fig. 6b. The strong mare-highlanddichotomy seen in the figure is present because the maria are higherin opaque mineral content (ilmenite) than the highlands. Mercury'sunimodal data cloud (Fig. 7) falls roughly between the lunar highlandsand maria, suggesting that the range of variation in the abundance ofopaque phases is less on Mercury than on the Moon and that onaverage Mercury may have a greater abundance of opaque mineralsthan the lunar highlands.
Mercury's red spots plot near the HRP in the visible color space(Fig. 7). The spectral properties of the red spots are consistent with arelatively low content of opaque phases, similar to that of the HRP. Thetwo examples of fresh ejecta shown in Fig. 7 are located at the positionexpected for immature HRP or IT material, and similarly for theirlocation in Fig. 5. The BCFD spectra occupy a unique portion of theratio-reflectance diagrams. A high 430-nm/750-nm ratio is character-istic of the LRM, so immature LRMmaterial would be expected to havehigher 750-nm reflectance and an even higher ratio. However, theBCFDs do not appear to represent an immature end-member in theLRM weathering trend, being both too bright and too blue. The ratio-reflectance diagrams emphasize the anomalous nature of the BCFDs inrelation to the other spectral units observed by MESSENGER.
5. Development of spectral parameter images for Mercury
5.1. NIR: ferrous iron and optical maturity
The compositional and maturity trends displayed in NIR ratio-reflectance plots for returned lunar samples led Lucey (Lucey et al.,1995; Blewett et al., 1997a; Lucey et al., 1998, 2000a,b) to devise spectralparameters for ferrous-iron content and optical maturity that can bemapped using multispectral imagery. A similar procedure can bedeveloped for MESSENGER images of Mercury by inspection of thetrends discernible in Figs. 5 and 6a.
Motivated by the trends observed for returned lunar samples andremotely sensed data, the Lucey analysis is based on the assumptionthat the maturity trajectories for silicates of various FeO contents tendto converge on a hypothetical super-mature end-member located inthe upper left portion of the diagram (cf. Staid and Pieters, 2000;Wilcox et al., 2005). This convergence can be seen in the lunar NIRratio-reflectance plot of Fig. 6a, where both the highland and mare
data clouds extend from lower right to upper left. Similarly forMercury in Fig. 5, the maturity trend is toward the upper left. On theother hand, the effect of ferrous iron in silicates defines a nearlyperpendicular trend, with spectra in Fig. 6a moving toward the lowerleft with increasing FeO content. The MESSENGER plot for Mercurylacks the FeO-related trend seen in the Galileo data for the Moon.
The optical maturity parameter (OMAT) is defined by the distanceof a point in ratio-reflectance space from an origin at the location ofthe hypothetical highly mature end-member (Lucey et al., 2000b;

Fig. 9. Visible spectral parameter images for Mercury, constructed from the WAC imagecube. (a) Optical maturity parameter OMATOP, computed from Eq. (4). Regional colorand albedo variations have been largely suppressed, leaving variations related tomaturity. Brighter tones correspond to fresher (less mature) material. (b) Opaque-phase abundance parameter θOP, computed by Eq. (3). Maturity variations such asbright crater rays have been minimized, leaving “intrinsic” differences related tovariations in the abundance of opaque phases. Brighter tones correspond to a higherabundance of opaque phases.
279D.T. Blewett et al. / Earth and Planetary Science Letters 285 (2009) 272–282
Grier et al., 2001). That is, if (xoFe, yoFe) are the coordinates of theorigin, then
OMAT = R750−xoFeð Þ2 + R950 =R750ð Þ−yoFeð Þ2h i0:5
; ð1Þ
where R750 is the 750-nm reflectance and R950 is the reflectance at950 nm. The ferrous-iron parameter, θFe, is defined as the anglesubtended at the hypermature end-member between a horizontal lineat R950/R750=yoFe and a line connecting the hypermature end-member and the location of a point in the plot,
θFe = − arctan R950 = R750ð Þ− yoFe½ �= R750 − xoFe½ �f g: ð2Þ
The location of the origin for the lunar analysis was chosen byoptimizing the correlation between θFe for Apollo and Luna samplingstations observed by Clementine and the FeO content of returnedsamples from those stations (Blewett et al., 1997a; Lucey et al., 1998,2000a). For Mercury, a trial-and-error process of roughly extrapolatingthe HRP and LRM trends in Fig. 5 to their convergence point, andassessing the extent towhich compositional variations are suppressed inan image of OMAT, was used to select the location of the hypermatureend-member. The origin chosen for the WAC image cube is xoFe=0.05,yoFe=1.37. Future adjustments to the WAC spectral and photometriccalibration are likely to require revision of these values.
The NIR-based spectral parameter images forMercury, θFe and OMAT,are shown in Fig. 8a and b, respectively. In the OMAT image (Fig. 8a),regional color and albedo differences have been mostly suppressed, andthe major brightness differences are associated with immature cratermaterial. The θFe image (Fig. 8b) primarily displays regional color/albedounits (HRP, LRM, IT), and fresh crater rays have been largely erased. TheLRM appears brighter than the HRP in the θFe parameter image,consistent with the relative locations of these two units in the NIR ratio-reflectance scatter plot (Fig. 5). On the Moon such a relationship wouldbe straightforward, and we would conclude that the LRM has a higherabundance of FeO in silicates than the HRP. However, the lack ofdetection of a 1000-nm ferrous band suggests that that the smalldifferences in NIR spectral ratio and 750-nm reflectance between theseunits are not caused by variations in the strength of the 1000-nm band.Rather, it is likely that at the very low levels of FeO in silicates observedso far onMercury, the θFe parameter is primarily influenced by variationsin opaque mineral abundance. The NIR spectral effects of opaque phasescan mimic those of ferrous iron in silicates, because a higher content ofeither will drive material toward the lower left in the NIR ratio-reflectance diagram (and hence to higher values of θFe). Mappingopaque phases on Mercury is discussed further in Section 5.2.
5.2. Visible: abundance of opaque phases
The compositional and maturity trends evident in a visible ratio-reflectance plot (Fig. 7) may be parameterized in a manner similar tothat described in Section 5.1 for theNIR. This type of analysiswas carriedout with Mariner 10 images of Mercury by Robinson and Lucey (1997),Robinson andTaylor (2001), andBlewett et al. (2007) to produce imagesof a parameter sensitive to the abundance of opaque phases and asecond parameter that measures the combined effects of ferrous iron insilicates and maturity (npFe0 abundance). The parameterizationalgorithm used here and by Blewett et al. (2007) follows that of Luceyet al. (1998, 2000a) for lunar opaque-phase mapping.
Thematurity trends for theHRP and LRM seen in Fig. 7 can be roughlyextrapolated to a convergence point at the location of a hypothetical low-reflectance (750-nm), reddish (low 430-nm/750-nm ratio), highlymature end-member. The location of the origin for the lunar analysiswas chosen by optimizing the correlation between the opaque-sensitiveparameter forApollo andLuna sampling stations observedbyClementineand the TiO2 content of returned samples from those stations (Blewettet al., 1997a; Lucey et al., 1998, 2000a; see also Gillis et al., 2003). Absent
samples fromMercury, a trial-and-error process of extrapolating theHRPand LRM maturity trends in Fig. 7 to a convergence point, and assessingthe extent towhich compositional variations are suppressed in an imageof OMATOP (defined below), was used to select the location of the origin.This convergence point, estimated here as located at 750-nmreflectance=xoOP=0.08, 430-nm/750-nm ratio=yoOP=0.53, can beused as basis for an angular parameter that measures the spectral effectsof opaquemineral abundance. The parameter sensitive to opaque phases,θOP, is defined as the angle between a horizontal line at 430-nm/750-nm

280 D.T. Blewett et al. / Earth and Planetary Science Letters 285 (2009) 272–282
ratio=yoOP and a line connecting the (xoOP, yoOP) origin to a point in theplot representing a remotely observed surface:
θOP = arctan R430 = R750ð Þ− yoOP½ �= R750 − xoOP½ �f g; ð3Þ
whereR430 is the reflectance at 430 nm. Larger values of θOP correspond toincreased opaque-phase content. The complementary spectral parameter,that of maturity, is measured by the distance from the mature origin:
OMATOP = R750−xoOPð Þ2 + R430 =R750ð Þ−yoOPð Þ2h i0:5
: ð4Þ
In addition to maturity, the parameter OMATOP is also sensitive tovariations in silicate ferrous-iron content, as described above inSection 4.2. However on Mercury these variations are so restrictedthat OMATOP is essentially measuring maturity alone.
Images of the visible spectral parameters for Mercury computed byEqs. (3) and (4) are presented in Fig. 9. The images verify that theseparation of composition from maturity has largely been successful,consistent with the results of Robinson and Lucey (1997), Robinson andTaylor (2001),and Blewett et al. (2007) for Mariner 10 images. TheOMATOP imageappears todisplaybright cratermaterials against amaturebackground lacking differences correlated to the major color units. TheθOP image reveals themajor color units, withmaturity effects suppressed.
6. Discussion
We have constructed two spectral parameter images intended tomeasure intrinsic compositional differences on Mercury, θFe and θOP.Close inspection of the images reveals that the image θOP has greatercontrast than θFe. For example, if the contrast of an image is defined as(maximum−minimum)/mean, then the contrast of the θOP image is0.80 and that of θFe is 0.20. This difference is consistent with thefinding of Warell and Valegård (2006), who noted that their Earth-based images of Mercury exhibited more intensity range variation inthe UV and visible than in the NIR. Other than contrast, our twoimages appear similar to each other. On the Moon, opaque-parameterand ferrous-iron parameter images have a very different appearancefrom one another (cf., those appearing in Lucey et al., 1998). Thisobservation attests to the minimal role that the silicate ferrous-iron1000-nm band plays in controlling Mercury's spectral reflectanceproperties. In the absence of a ferrous-iron absorption feature, thespectral effects of opaque phases dominate variations in theNIR, leadingto a θFe image that is primarily (and perhaps entirely) measuringopaque-phase abundance. Similarly, the Mercury parameter imagessensitive to optical maturity effects (OMAT and OMATOP) are highlycorrelated, despite the fact that silicate ferrous-iron content should havesome influence on the OMATOP parameter. The Moon and Mercuryrepresent end-members that illustrate the characteristics of an airlessbody regolith in which ferrous iron in silicates respectively does anddoes not have a major effect on the spectrum.
Robinson et al. (2008) performed principal component analysis(PCA) on aWAC image cube and found that some principal component(PC) images could discriminate composition and maturity, similar tothe spectral parameter images presented here. However, because theresults of PCA depend on the particular dataset to which it is applied,the outcome is not entirely predictable. For example, if PCA isperformed on two different scenes, is not guaranteed that the secondPC will capture the same color variations in both cases. The analysispresented hereprovides a physical basis for understanding the spectralfactors that are captured by the PCA and offers a repeatablemethod forcomputing the parameter images.
Future studies can use simple linearmixingmodels applied to an 11-bandWAC cube or to the θOP image to gauge the extent towhich, e.g., theintermediate terrain may be modeled as a mixture of the HRP and LRMend-members. The spectral parameter images developed here will alsobe useful for study of stratigraphy exposed by impact craters, ejecta
mixing, classification of crater rays as immaturity or compositional rays(Hawkeet al., 2004; Blewett et al., 2007),mapping the extent of volcanicdeposits, and so forth. Ultimately, radiative transfer modeling studieswill be important for constraining the mineralogical composition of themajor and minor color units on Mercury because we do not havereturned samples to use as ground truth.
MESSENGER's elemental composition sensors [gamma ray spectro-meter, neutron spectrometer, andX-ray spectrometer; see Boynton et al.(2007), Solomon et al. (2007), and references therein] will makemeasurements of iron abundance during the orbital phase of themission. Thesedata, thoughof lowspatial resolution (typicallyhundredsof kilometers), may offer a means to produce iron maps at the highspatial resolution of the WAC. This would be done as follows. The WACθOP image provides a map of opaque mineral abundance, and it is likelythat the opaque phases are iron-bearing. Therefore, areas in the θOPparameter imagewith uniformity at the large pixel size of the elementalironmaps could beused to study the correlationbetweenelemental ironvalues and θOP, and hence may allow an “absolute” iron calibration forthe WAC spectral parameter image to be developed.
The red spots generally stand out in the spectral parameter images.For example, in OMATOP (Fig. 9b), dark areas are found around themarginsof Caloris, includingRedSpot 3 (~22.6°N,146.0°E) andRedSpot4 (~13.9° N,162.0° E) (see Fig.1 for locations). These dark areas aremoresubdued in the OMAT image (Fig. 9b), indicating that their color is moreanomalous in the visible portion of the spectrum (as measured by the430-nm/750-nmratio) than in theNIR (i.e., 950-nm/750-nmratio). RedSpot 3 corresponds to a high-reflectance deposit found around a rimlesskidney-shaped depression, which is likely of pyroclastic origin (Headet al., 2008; Murchie et al., 2008; Kerber et al., 2009-this issue; Headet al., 2009-this issue). Red Spot 4 is also associated with an irregularrimless depression, but this material is more diffuse and has a lowerreflectance. Itmayalso beof pyroclastic origin (Murchie et al., 2008), butits differing morphology and spectral characteristics suggest that itrepresents material of differing composition or physical state than thatof Red Spot 3, or perhaps it is simply a more diffuse deposit of thematerial found at Red Spot 3. Red Spot 1, located in the ITwithin the 80-kmdiameter craterMoodyat 13.1° S,144.6° E, plots directly in theCalorisHRPfield in Fig. 5. Red Spot 2, north of Caloris, is also foundwithin a largecrater (Navoi, ~59.1° N, 160.2° E) and is spectrally similar to the HRP.
Thus, there appear to be at least three classes of red spots. First arethe red spots found in areas away from Caloris. This red material isspectrally very similar to the HRP and likely represents isolateddeposits of HRP that were emplaced in the floors of some craters asvolcanic flows of the kind that produced the smooth plains within theCaloris basin (Head et al., 2008; Murchie et al., 2008; Head et al.,2009-this issue). Second are the circum-Caloris red spots that appearvery dark in the OMATOP image (e.g., Red Spot 4). These particularoccurrences are associated with rimless volcanic depressions (Headet al., 2008) that do not have unusually high reflectance. A third typeof red spot is exemplified by a high-reflectance halo of material, likelyof pyroclastic origin, also surrounding a rimless depression (e.g., RedSpot 3, Head et al., 2008; Murchie et al., 2008; Kerber et al., 2009-thisissue; Head et al., 2009-this issue).
7. Summary and conclusions
Multispectral images in the visible to NIR wavelength range collectedby MESSENGER during its first Mercury flyby provide a wealth of newdata for understanding the composition and physical state of the planet'ssurface. We have analyzed the images within the Hapke conceptualframework for a silicate regolith, using the quantitative methodsdeveloped by Lucey, including the first application of Lucey's NIR analysisto images of Mercury obtained by a spacecraft. The interrelationships ofMercury's color units revealed by visible and NIR ratio-reflectance plotsand spectral parameter images confirm and extend previouswork on thenature of Mercury's surface.

281D.T. Blewett et al. / Earth and Planetary Science Letters 285 (2009) 272–282
1. On the NIR ratio-reflectance plot, Mercury's surface forms a singlemode. This result suggests a very small range of variation in theferrous content of silicates on Mercury, in contrast to the bimodalmare/highland structure and wide variation in silicate FeO abun-dance seen on the Moon.
2. None of theWAC spectra examined here exhibit a definite absorptionfeature near 1000 nm that could be caused by ferrous iron in silicateminerals or glasses. The spectral parameter images θFe (NIR-based)and θOP (visible-based) have a similar appearance. This is consistentwith the absence of a 1000-nm silicate absorption band. Lacking aferrous absorption,NIR spectral variations onMercury are dominatedby the effects of opaque phases.
3. The visible ratio-reflectance plot for Mercury suggests that themajor color units can be explained by variations in the abundanceof a relatively low-reflectance, low-slope component. Such char-acteristics are typical of opaque phases. The HRP within Caloris andfilling some other large craters are lower in opaque mineralabundance than the LRM found surrounding the Tolstoj basin andat other locations. The IT has an abundance of opaque phasesbetween those of the LRM and the HRP.
4. Color trends on Mercury, both globally and within major color units,demonstrate that surface materials undergo optical maturationwithincreased exposure to the space environment. These spectral changesare consistent with accumulation of nanophase metallic iron. Thesource of this iron could be the opaque phase.
5. The presence of twominor color units onMercury, the red spots andBCFDs, provides evidence of further compositional and spectraldiversity. Red spots are distinctive because of a spectral slope that isrelatively steep (red). We describe three varieties of red spot, eachassociated with a particular morphological expression. Type oneappears to represent small deposits of HRP material within cratersin the IT. Type-two and type-three red spots are related to rimlessvolcanic depressions along the margins of the Caloris basin. Type-two red spots are not unusually high in reflectance, whereas type-three red spots occur as high-albedo deposits.
6. The BCFDs are distinguished by their high albedo and relatively flat(blue) spectral slope. Unlike another “bluish” unit on Mercury, theLRM, the relativelyflat spectral slope of the BCFD cannot be caused byahighabundance of opaquephases. The BCFDs appear to beunrelatedto ordinary immature crater materials, and a special composition isindicated.
Acknowledgements
This work made use of the Integrated Software for Imagers andSpectrometers (ISIS), developed andmaintained by the U.S. GeologicalSurvey's Astrogeology Team. Jenna Hartin assisted with data proces-sing and figure preparation. The authors are grateful for support fromNASA, including the MESSENGER Participating Scientist Program andPlanetary Geology and Geophysics Program. Helpful reviews of thispaper were received from Bruce Hapke and Jeffrey R. Johnson. This isHIGP publication number 1708 and SOEST contribution 7632.
Appendix A. Supplementary data
Supplementary data associated with this article can be found, inthe online version, at doi:10.1016/j.epsl.2009.02.021.
References
Belton, M.J.S., Greeley, R., Greenberg, R., McEwen, A., Klaasen, K.P., Head II, J.W., Pieters,C., Neukum, G., Chapman, C.R., Geissler, P., Heffernan, C., Breneman, H., Anger, C.,Carr,M.H., Davies,M.E., Fanale, F.P., Gierasch, P.J., Ingersoll, A.P., Johnson, T.V., Pilcher,C.B., Thompson, W.R., Veverka, J., Sagan, C., 1994. Galileo multispectral imaging ofthe north polar and eastern limb regions of the Moon. Science 264, 1112–1115.
Blewett, D.T., Hawke, B.R., 2001. Remote sensing and geological studies of the Hadley–Apennine region of the Moon. Meteorit. Planet. Sci. 36, 701–730.
Blewett, D.T., Lucey, P.G., Hawke, B.R., Jolliff, B.L., 1997a. Clementine images of the lunarsample-return stations: refinement of FeO and TiO2 mapping techniques. J. Geophys.Res. 102, 16319–16325.
Blewett, D.T., Lucey, P.G., Hawke, B.R., Ling, G.G., Robinson, M.S., 1997b. A comparison ofmercurian reflectance and spectral quantities with those of the Moon. Icarus 129,217–231.
Blewett, D.T., Lucey, P.G., Hawke, B.R., 2002. Lunar pure anorthosite as a spectral analogfor Mercury, Meteorit. Planet. Sci. 37, 1245–1254.
Blewett, D.T., Hawke, B.R., Lucey, P.G., Robinson, M.S., 2007. A Mariner 10 color study ofmercurian craters. J. Geophys. Res. 112, E02005. doi:10.1029/2006JE002713.
Boynton, W.V., Sprague, A.L., Solomon, S.C., Starr, R.D., Evans, L.G., Feldman, W.C.,Trombka, J.I., Rhodes, E.A., 2007. MESSENGER and the chemistry of Mercury'ssurface. Space Sci. Rev. 131, 85–104.
Bruno, B.C., Lucey, P.G., Hawke, B.R., 1991. High resolution UV–visible spectroscopy oflunar red spots. Proc. Lunar Planet. Sci. 21, 405–415.
Chevrel, S.D., Pinet, P.C., Head, J.W., 1999. Gruithuisen domes region: a candidate for anextended non-mare volcanism unit on the Moon. J. Geophys. Res. 104, 16,515–16,529.
Cintala, M.J., 1992. Impact-induced thermal effects in the lunar andmercurian regoliths.J. Geophys. Res. 97, 947–973.
Denevi, B.W., Robinson, M.S., 2008. Mercury's albedo fromMariner 10: evidence for thepresence of ferrous iron. Icarus 197, 239–246.
Denevi, B.W., Robinson, M.S., Blewett, D.T., Domingue, D.L., Head III, J.W., McCoy, T.J.,McNutt Jr., R.L., Murchie, S.L., Solomon, S.C., 2009. MESSENGER global colorobservations: implications for the composition and evolution of Mercury's crust.Lunar Planet. Sci. LX, 2247 (abstract).
Domingue, D.L., Denevi, B.W., Holsclaw, G.M., Izenberg, N.R., Kang, H.K., Laslo, N.R.,McClintock, W.E., Murchie, S.L., Prockter, L.M., Robinson, M.S., Vaughan, R.M., 2008.Color photometry of Mercury's surface based on MESSENGER's first Mercuryencounter. Lunar Planet. Sci. XXXIX, 1298 (abstract).
Dzurisin, D., 1977. Mercurian bright patches: evidence for physio-chemical alteration ofsurface material? Geophys. Res. Lett. 4, 383–386.
Fischer, E.M., Pieters, C.M., 1994. Remote determination of exposure degree and ironconcentration of lunar soil using VIS–NIR spectroscopicmethods. Icarus 111, 475–488.
Gillis, J.J., Jolliff, B.L., Elphic, R.C., 2003. A revised algorithm for calculating TiO2 fromClementine UV–vis data: a synthesis of rock, soil, and remotely sensed TiO2
concentrations. J. Geophys. Res. 108 (E2), 5009. doi:10.1029/2001JE001515.Gillis-Davis, J.J., Lucey, P.G., Hawke, B.R., 2006. Testing the relation betweenUV–vis color
and TiO2 content of the lunar maria. Geochim. Cosmochim. Acta 70, 6079–6102.Grier, J.A., McEwen, A.S., Lucey, P.G., Milazzo, M., Strom, R.G., 2001. The optical maturity
of ejecta from large rayed lunar craters. J. Geophys. Res. 106, 32847–32862.Hagerty, J.J., Lawrence, D.J., Hawke, B.R., Vaniman, D.T., Elphic, R.C., Feldman,W.C., 2006.
Refined thorium abundances for lunar red spots: implications for evolved, nonmarevolcanism on the Moon. J. Geophys. Res. 111, E06002. doi:10.1029/2005JE002592.
Hapke, B., 1977. Interpretations of optical observations of Mercury and the Moon. Phys.Earth Planet. Inter. 15, 264–274.
Hapke, B., 1993. Theory of Reflectance and Emittance Spectroscopy. Cambridge Univ.Press, New York.
Hapke, B., 2001. Space weathering from Mercury to the asteroid belt. J. Geophys. Res.106, 10,039–10,073.
Hapke, B., Cassidy, W., Wells, E., 1975a. Effects of vapor-phase deposition processes onthe optical, chemical, and magnetic properties of the lunar regolith. Moon 13,339–353.
Hapke, B., Danielson Jr., G.E., Klaasen, K., Wilson, L., 1975b. Photometric observations ofMercury from Mariner 10. J. Geophys. Res. 80, 2431–2443.
Hapke, B., Christman, C., Rava, B., Mosher, J., 1980. A color-ratio map of Mercury. Proc.Lunar Planet. Sci. Conf. 11th, pp. 817–821.
Hawke, B.R., Peterson, C.A., Blewett, D.T., Bussey, D.B.J., Lucey, P.G., Taylor, G.J., Spudis, P.D.,2003. Distribution and modes of occurrence of lunar anorthosite. J. Geophys. Res.108 (E6), 5050. doi:10.1029/2002JE001890.
Hawke, B.R., Blewett, D.T., Lucey, P.G., Smith, G.A., Bell, James, F., Campbell, B.A.,Robinson, M.S., 2004. The origin of lunar crater rays. Icarus 170, 1–16.
Hawkins III, S.E., Boldt, J.D., Darlington, E.H., Espiritu, R., Gold, R.E., Gotwols, B., Grey,M.P.,Hash, C.D., Hayes, J.R., Jaskulek, S.E., Kardian Jr., C.J., Keller, M.R., Malaret, E.R.,Murchie, S.L., Murphy, P.K., Peacock, K., Prockter, L.M., Reiter, R.A., Robinson, M.S.,Schaefer, E.D., Shelton, R.G., Sterner II, R.E., Taylor, H.W., Watters, T.R., Williams, B.D.,2007. The Mercury Dual Imaging System on the MESSENGER spacecraft. Space Sci.Rev. 131, 247–338.
Head, J.W., McCord, T.B., 1978. Imbrian-age highland volcanism on the Moon: theGruithuisen and Mairan domes. Science 199, 1433–1436.
Head, J.W., Murchie, S.L., Prockter, L.M., Robinson, M.S., Solomon, S.C., Strom, R.G.,Chapman, C.R., Watters, T.R., McClintock, W.E., Blewett, D.T., Gillis-Davis, J.J., 2008.Volcanism onMercury: evidence from thefirstMESSENGER flyby. Science 321, 69–72.
Head, J.W.,Murchie, S.L., Prockter, L.M., Solomon, S.C., Chapman, C.R., Strom,R.G.,Watters, T.R.,Blewett, D.T., Gillis-Davis, J.J., Fassett, C.I., Dickson, J.L., Morgan, G.A., Kerber, L., 2009.Volcanism on Mercury: evidence from the first MESSENGER flyby for extrusive andexplosive activity and the volcanic origin of plains. Earth Planet. Sci. Lett. 285,, 227–242(this issue).
Irvine, W.M., Simon, T., Menzel, D.H., Pikoos, C., Young, A.T., 1968. Multicolor photoelectricphotometryof the brighter planets. III. Observations fromBoydenObservatory. Astron.J. 73, 807–828.
Jeanloz, R., Mitchell, D.L., Sprague, A.L., de Pater, I., 1995. Evidence for a basalt-freesurface on Mercury and implications for internal heat. Science 268, 1455–1457.
Kerber, L., Head, J.W., Solomon, S.C., Murchie, S.L., Blewett, D.T., Wilson, L., 2009.Explosive volcanic eruptions on Mercury: eruption conditions, magma volatilecontent, and implications for mantle volatile abundances. Earth Planet. Sci. Lett.285, 263–271 (this issue).

282 D.T. Blewett et al. / Earth and Planetary Science Letters 285 (2009) 272–282
Lucey, P.G., Noble, S.K., 2008. Experimental test of a radiative transfer model of theoptical effects of space weathering. Icarus 197, 348–353.
Lucey, P.G., Taylor, G.J., Malaret, E., 1995. Abundance and distribution of iron on theMoon. Science 268, 1150–1153.
Lucey, P.G., Blewett, D.T., Hawke, B.R., 1998. Mapping the FeO and TiO2 content of thelunar surface with multispectral imaging. J. Geophys. Res. 103, 3679–3699.
Lucey, P.G., Blewett, D.T., Jolliff, B.L., 2000a. Lunar iron and titanium abundancealgorithms based on final processing of Clementine UVVIS data. J. Geophys. Res.105,20297–20306.
Lucey, P.G., Blewett, D.T., Taylor, G.J., Hawke, B.R., 2000b. Imaging of lunar surfacematurity. J. Geophys. Res. 105, 20377–20386.
Malin, M.C., 1974. Lunar red spots: possible pre-mare materials. Earth Planet. Sci. Lett.21, 331–341.
McClintock,W.E., Lankton,M.R., 2007. TheMercury Atmospheric and Surface CompositionSpectrometer for the MESSENGER mission. Space Sci. Rev. 131, 481–521.
McClintock,W.E., Izenberg,N.R., Holsclaw,G.M., Blewett,D.T., Domingue,D.L., Head III, J.W.,Helbert, J., McCoy, T.J., Murchie, S.L., Robinson, M.S., Solomon, S.C., Sprague, A.L., Vilas,F., 2008. Spectroscopic observations of Mercury's surface reflectance duringMESSENGER's first Mercury flyby. Science 321, 62–65.
McCord, T.B., Adams, J.B., 1972. Mercury: surface composition from the reflectionspectrum. Science 178, 745–747.
McCord, T.B., Clark, R.N., 1979. The Mercury soil: presence of Fe2+. J. Geophys. Res. 84,7664–7668.
Mitchell, D.L., de Pater, I., 1994. Microwave imaging of Mercury's thermal emission atwavelengths from 0.3 to 20.5 cm. Icarus 110, 2–32.
Murchie, S., Robinson, M., Clark, B., Li, H., Thomas, P., Joseph, J., Bussey, B., Domingue, D.,Veverka, J., Izenberg, R., Chapman, C., 2002. Color variations on Eros from NEARmultispectral imaging. Icarus 155, 145–168.
Murchie, S.L., Watters, T.R., Robinson, M.S., Head, J.W., Strom, R.G., Chapman, C.R.,Solomon, S.C., McClintock, W.E., Prockter, L.M., Domingue, D.L., Blewett, D.T., 2008.Geology of the Caloris basin, Mercury: a view fromMESSENGER. Science 321, 73–76.
Murray, B.C., Belton, M.J.S., Danielson, G.E., Davies, M.E., Gault, D.E., Hapke, B., O'Leary,B., Strom, R.G., Suomi, V., Trask, N., 1974. Mercury's surface: preliminary descriptionand interpretation from Mariner 10 pictures. Science 185, 169–179.
Noble, S.K., Pieters, C.M., 2003. Space weathering on Mercury: implications for remotesensing. Astron. Vestn. 37, 34–39 (English version in Solar System Res. 37, 31–35).
Noble, S.K., Pieters, C.M., Taylor, L.A., Morris, R.V., Allen, C.C., McKay, D.S., Keller, L.P.,2001. The optical properties of the finest fraction of lunar soil: implications forspace weathering. Meteorit. Planet. Sci. 36, 31–42.
Noble, S.K., Pieters, C.M., Keller, L.P., 2007. An experimental approach to understandingthe optical effects of space weathering. Icarus 192, 629–642.
Pieters, C.M., Englert, P.A.J. (Eds.), 1993. Remote Geochemical Analysis: Elemental andMineralogical Composition. Cambridge University Press, New York.
Pieters, C.M., Taylor, L.A., Noble, S.K., Keller, L.P., Hapke, B., Morris, R.V., Allen, C.C.,McKay, D.S., Wentworth, S., 2000. Space weathering on airless bodies: resolving amystery with lunar samples. Meteorit. Planet. Sci. 35, 1101–1107.
Prockter, L.M.,Watters, T.R., Chapman, C.R., Denevi, B.W.,Head III, J.W., Solomon, S.C.,Murchie,S.L., Barnouin-Jha, O.S., Robinson, M.S., Blewett, D.T., Gillis-Davis, J., Gaskell, R.W., 2009.The curious case of Raditladi basin. Lunar Planet. Sci. XL, 1758 (abstract).
Rava, B., Hapke, B., 1987. An analysis of theMariner 10 color ratiomap of Mercury. Icarus71, 397–429.
Riner, M.A., Lucey, P.G., Desch, S.J., McCubbin, F.M., 2009. Nature of opaque componentsonMercury: insights into amercurianmagma ocean. Geophys. Res. Lett. 36, L02201.doi:10.1029/2008GL036128.
Robinson, M.S., Lucey, P.G.,1997. RecalibratedMariner 10 color mosaics: implications formercurian volcanism. Science 275, 197–200.
Robinson, M.S., Taylor, G.J., 2001. Ferrous oxide in Mercury's crust and mantle. Meteorit.Planet. Sci. 36, 841–847.
Robinson, M.S., Murchie, S.L., Blewett, D.T., Domingue, D.L., Hawkins III, S.E., Head, J.W.,Holsclaw, G.M., McClintock, W.E., McCoy, T.J., McNutt Jr., R.L., Prockter, L.M.,Solomon, S.C., Watters, T.R., 2008. Reflectance and color variations on Mercury:regolith processes and compositional heterogeneity. Science 321, 66–69.
Schultz, P.H., 1977. Endogenic modification of impact craters on Mercury. Phys. EarthPlanet. Inter. 15, 202–219.
Shkuratov, Y.G., Kaydash, V.G., Opanasenko, N.V., 1999. Iron and titanium abundanceand maturity degree distribution on the lunar nearside. Icarus 137, 222–234.
Solomon, S.C., McNutt Jr., R.L., Gold, R.E., Acuña, M.H., Baker, D.N., Boynton, W.V.,Chapman, C.R., Cheng, A.F., Gloeckler, G., Head III, J.W., Krimigis, S.M., McClintock,W.E., Murchie, S.L., Peale, S.J., Phillips, R.J., Robinson, M.S., Slavin, J.A., Smith, D.E.,Strom, R.G., Trombka, J.I., Zuber, M.T., 2001. The MESSENGER mission to Mercury:scientific objectives and implementation. Planet. Space Sci. 49, 1445–1465.
Solomon, S.C., McNutt Jr., R.L., Gold, R.E., Domingue, D.L., 2007. MESSENGER missionoverview. Space Sci. Rev. 131, 3–39.
Solomon, S.C., McNutt Jr., R.L., Watters, T.R., Lawrence, D.J., Feldman, W.C., Head, J.W.,Krimigis, S.M., Murchie, S.L., Phillips, R.J., Slavin, J.A., Zuber, M.T., 2008. Return toMercury: a global perspective onMESSENGER'sfirstMercuryflyby. Science 321, 59–62.
Spudis, P.D., Guest, J.E., 1988. Stratigraphy and geologic history of Mercury. In: Vilas, F.,Chapman, C.R., Matthews, M.S. (Eds.), Mercury. University of Arizona Press, Tucson,Ariz., pp. 118–164.
Staid, M.I., Pieters, C.M., 2000. Integrated spectral analysis of mare soils and craters:applications to eastern nearside basalts. Icarus 145, 122–139.
Tompkins, S., Pieters, C.M., 1999. Mineralogy of the lunar crust: results from Clementine.Meteorit. Planet. Sci. 34, 25–41.
Vilas, F., 1988. Surface composition of Mercury from reflectance spectrophotometry. In:Vilas, F., Chapman, C.R., Matthews, M.S. (Eds.), Mercury. University of Arizona Press,Tucson, Ariz., pp. 59–76.
Warell, J., 2002. Properties of the hermean regolith II. disk-resolvedmulticolor photometryand color variations of the “unknown” hemisphere. Icarus 156, 303–317.
Warell, J., 2003. Properties of the hermean regolith: III. disk-resolved vis–NIR reflectancespectra and implications for the abundance of iron. Icarus 161, 199–222.
Warell, J., 2004. Properties of the hermean regolith: IV. photometric parameters ofMercury and the Moon contrasted with Hapke modeling. Icarus 167, 271–286.
Warell, J., Blewett, D.T., 2004. Properties of thehermean regolith:V. newoptical reflectancespectra, comparisonwith lunar anorthosites, and mineralogical modeling. Icarus 168,257–276.
Warell, J., Valegård, P.-G., 2006. Albedo-color distribution on Mercury: a photometricstudy of the poorly known hemisphere. Astron. Astrophys. 460, 625–633.
Warell, J., Sprague, A.L., Emery, J.P., Kozlowski, R.W.H., Long, A., 2006. The 0.7–5.3 µmspectra of Mercury and the Moon: evidence for high-Ca pyroxene on Mercury. Icarus180, 281–291.
Wells, E., Hapke, B., 1977. Lunar soil: iron and titanium bands in the glass fraction.Science 195, 977–979.
Whitaker, E.A., 1972. Lunar color boundaries and their relationship to topographicfeatures. Moon 4, 348–355.
Wilcox, B.B., Lucey, P.G., Gillis, J.J., 2005. Mapping iron in the lunar mare: an improvedapproach. J. Geophys. Res. 110, E11001. doi:10.1029/2005JE002512.
Wilson, L., Head, J.W., 2003. Lunar Gruithuisen and Mairan domes: rheology and modeof emplacement. J. Geophys. Res. 108 (E2), 5012. doi:10.1029/2002JE001909.