Multisensory Integration Curve Fittingajyu/Teaching/Cogs202_sp14/Slides/lect3.pdfMotivation Finding...
63
Using Probability Theory Curve Fitting & Multisensory Integration Hannah Chen, Rebecca Roseman and Adam Rule | COGS 202 | 4.14.2014
Transcript of Multisensory Integration Curve Fittingajyu/Teaching/Cogs202_sp14/Slides/lect3.pdfMotivation Finding...
Using Probability Theory
Curve Fitting &Multisensory Integration
Hannah Chen, Rebecca Roseman and Adam Rule | COGS 202 | 4.14.2014

Overheard at Porters
“You’re optimizing for the wrong thing!”

What would you say?
What makes for a good model?
Best performance?Fewest assumptions?Most elegant?Coolest name?
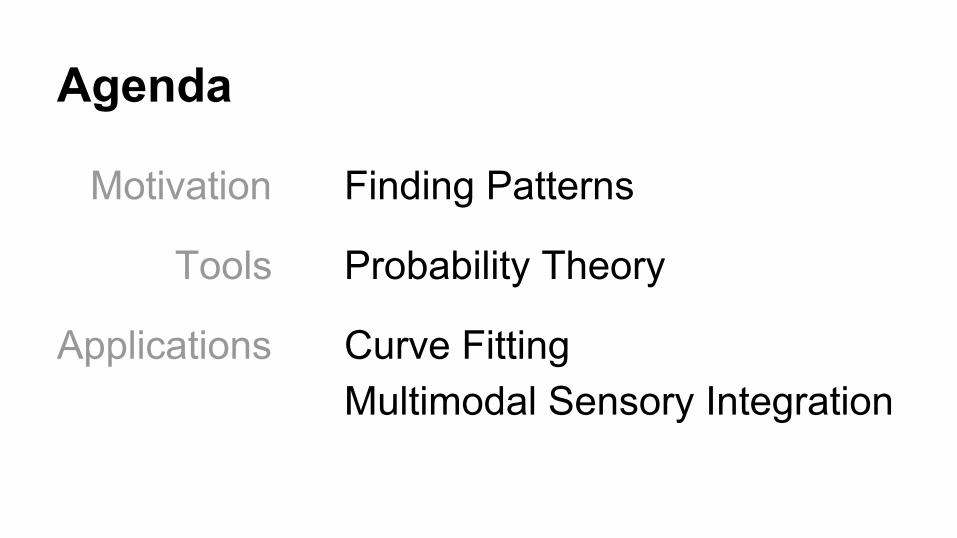
Motivation Finding Patterns
Tools Probability Theory
Applications Curve FittingMultimodal Sensory Integration
Agenda

FINDING PATTERNSThe Motivation
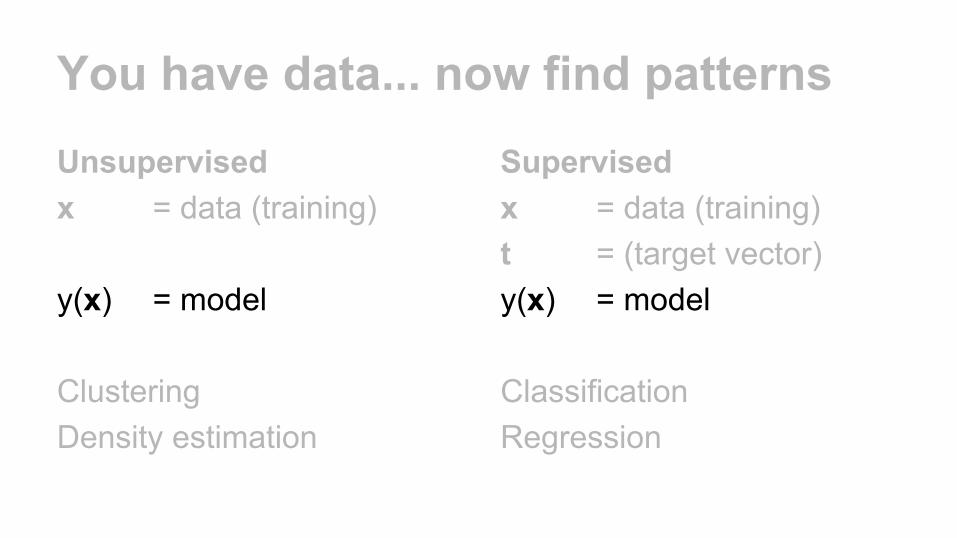
You have data... now find patterns
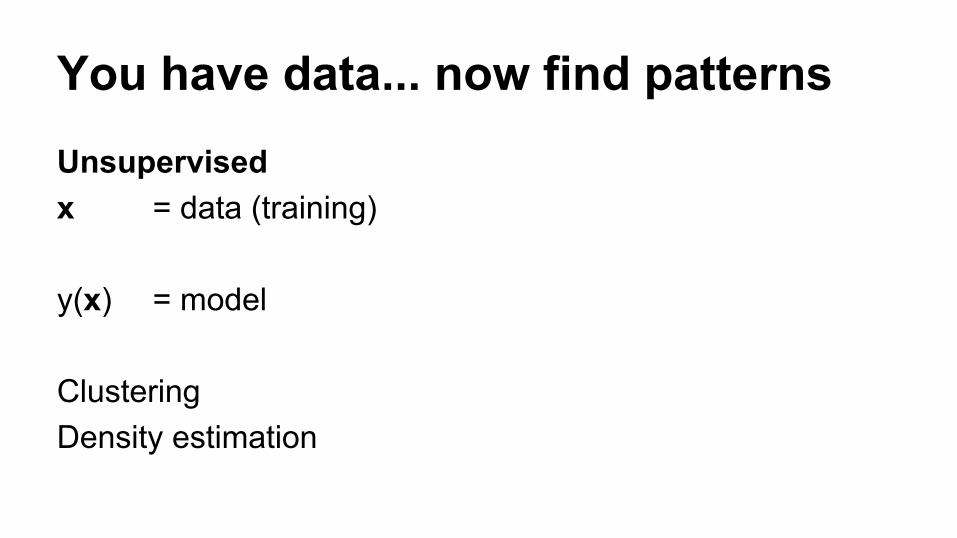
You have data... now find patternsUnsupervisedx = data (training)
y(x) = model
ClusteringDensity estimation

You have data... now find patternsUnsupervisedx = data (training)
y(x) = model
ClusteringDensity estimation
Supervisedx = data (training)t = (target vector)y(x) = model
Classification Regression
You have data... now find patternsUnsupervisedx = data (training)
y(x) = model
ClusteringDensity estimation
Supervisedx = data (training)t = (target vector)y(x) = model
Classification Regression

Important Questions
What kind of model is appropriate?What makes a model accurate? Can a model be too accurate? What are our prior beliefs about the model?
PROBABILITY THEORYThe Tools

Properties of a distribution
x = event p(x) = prob. of event
1. 2.
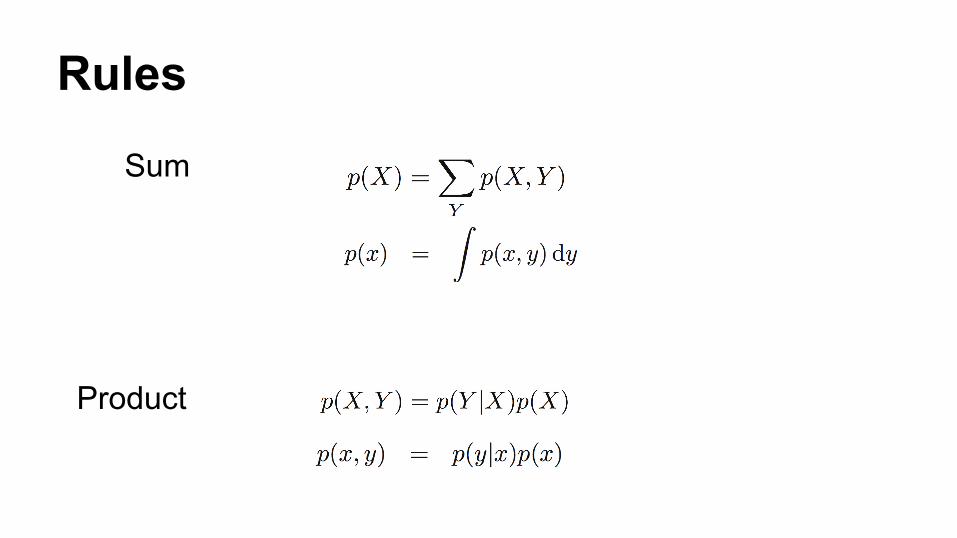
Rules
Sum
Product

Example (Discrete)

Bayes Rule (review)
prior
evidence
likelihoodposterior
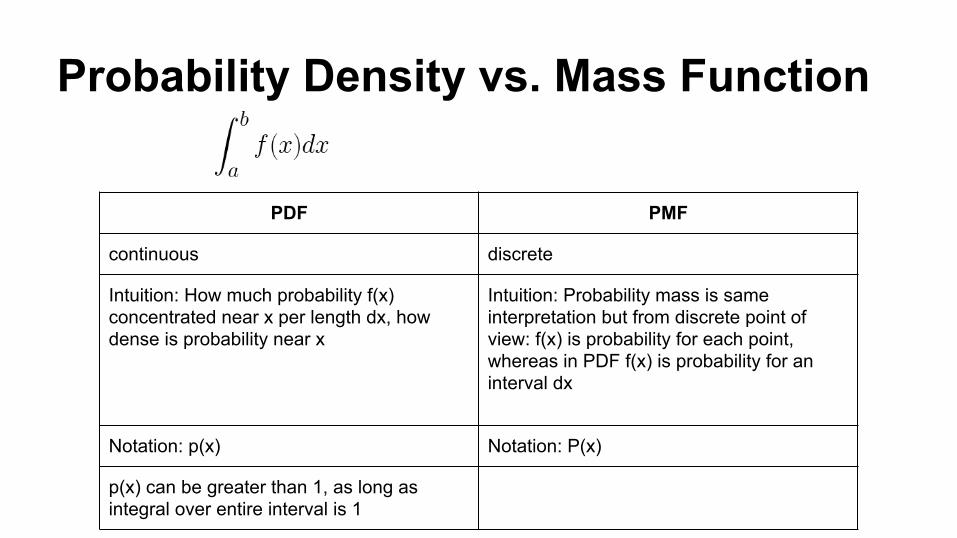
Probability Density vs. Mass Function
PDF PMF
continuous discrete
Intuition: How much probability f(x) concentrated near x per length dx, how dense is probability near x
Intuition: Probability mass is same interpretation but from discrete point of view: f(x) is probability for each point, whereas in PDF f(x) is probability for an interval dx
Notation: p(x) Notation: P(x)
p(x) can be greater than 1, as long as integral over entire interval is 1

Expectation & Covariance
CURVE FITTINGApplication
Observed Data: Given n points (x,y)
Curve Fitting
Observed Data: Given n points (x,t)Textbook Example): generate x uniformly from range [0,1] and calculate target data t with sin(2πx) function + noise with Gaussian distribution
Why?
Curve Fitting
Observed Data: Given n points (x,t)Textbook Example): generate x uniformly from range [0,1] and calculate target d ata t with sin(2πx) function + noise with Gaussian distribution
Why?Real data sets typically have underlying regularity that we are trying to learn.
Curve Fitting
Observed Data: Given n points (x,y)
Goal: use observed data to predict new target values t’ for new values of x’
Curve Fitting

Curve Fitting
Observed Data: Given n points (x,y)Can we fit a polynomial function with this data?
What values for w and M fits this data well?
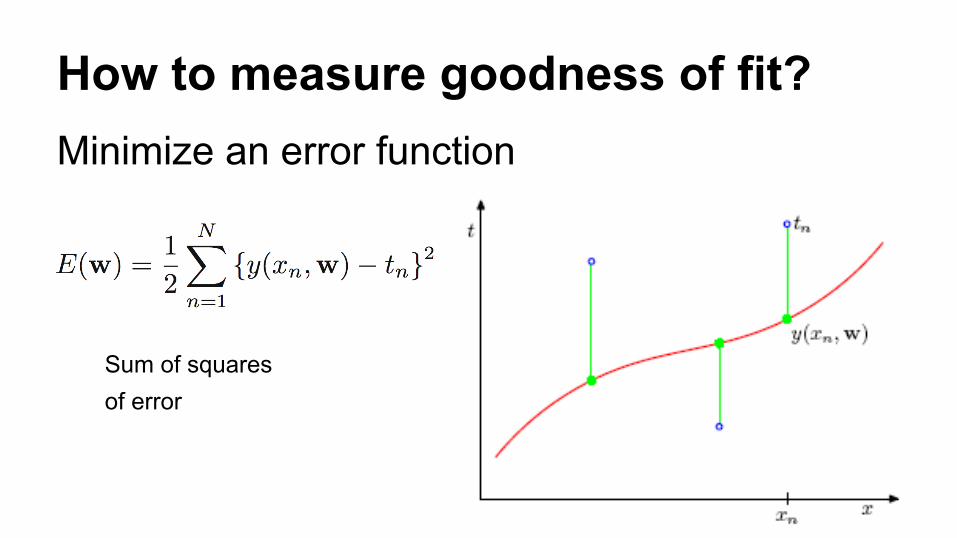
How to measure goodness of fit?Minimize an error function
Sum of squares of error

Overfitting

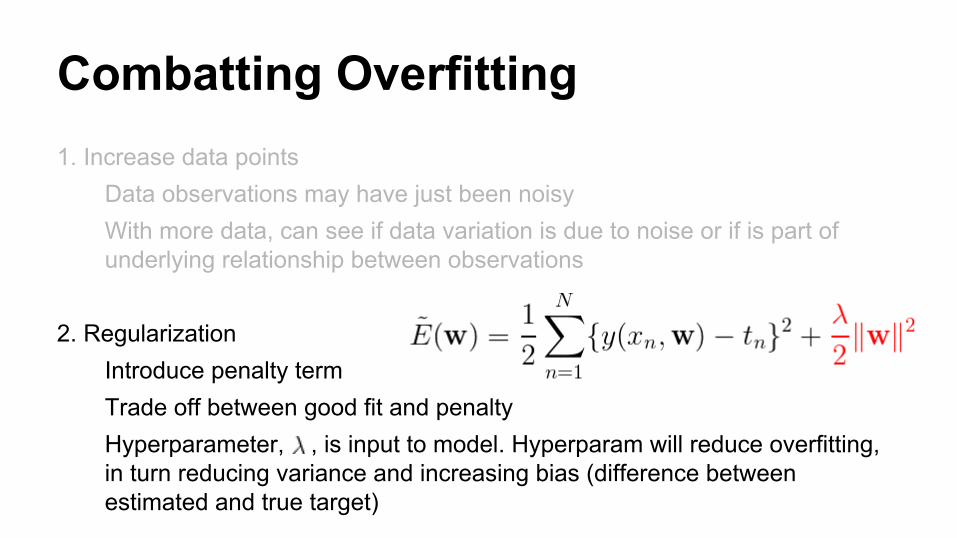
Combatting Overfitting1. Increase data points
Combatting Overfitting1. Increase data points
Data observations may have just been noisyWith more data, can see if data variation is due to noise or if is part of underlying relationship between observations
Combatting Overfitting1. Increase data points
Data observations may have just been noisyWith more data, can see if data variation is due to noise or if is part of underlying relationship between observations
2. RegularizationIntroduce penalty termTrade off between good fit and penaltyHyperparameter, , is input to model. Hyperparam will reduce overfitting, in turn reducing variance and increasing bias (difference between estimated and true target)

How to check for overfitting?
Training and validation subsetheuristic: data points > (multiple)(# parameters)
Training vs Testingdon’t touch test set until you are actually evaluating experiment!!

Cross-validation
1. Use portion, (S-1)/S, fortraining (white)
2. Assess performance (red)3. Repeat for each run4. Average performance scores
4-fold cross-validation (S=4)

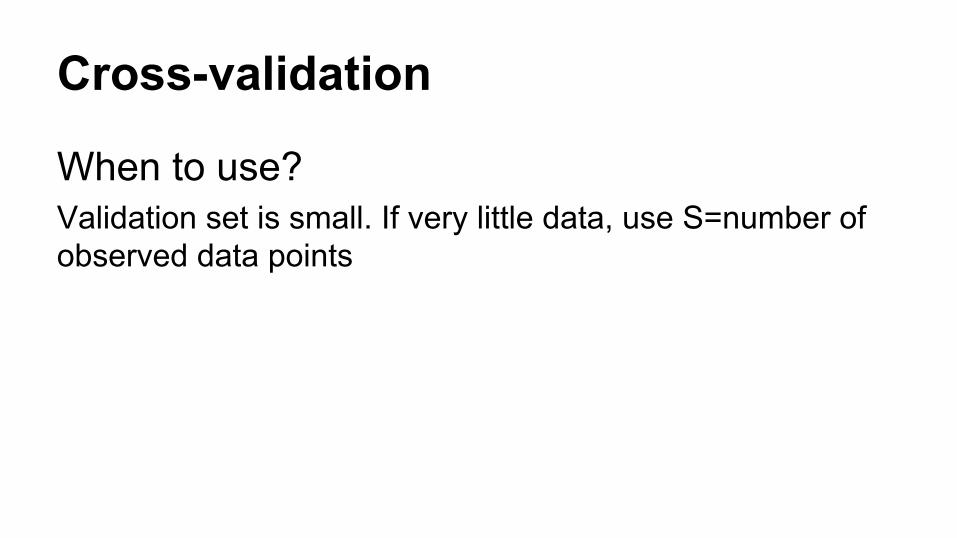
Cross-validation
When to use?
Cross-validation
When to use? Validation set is small. If very little data, use S=number of observed data points
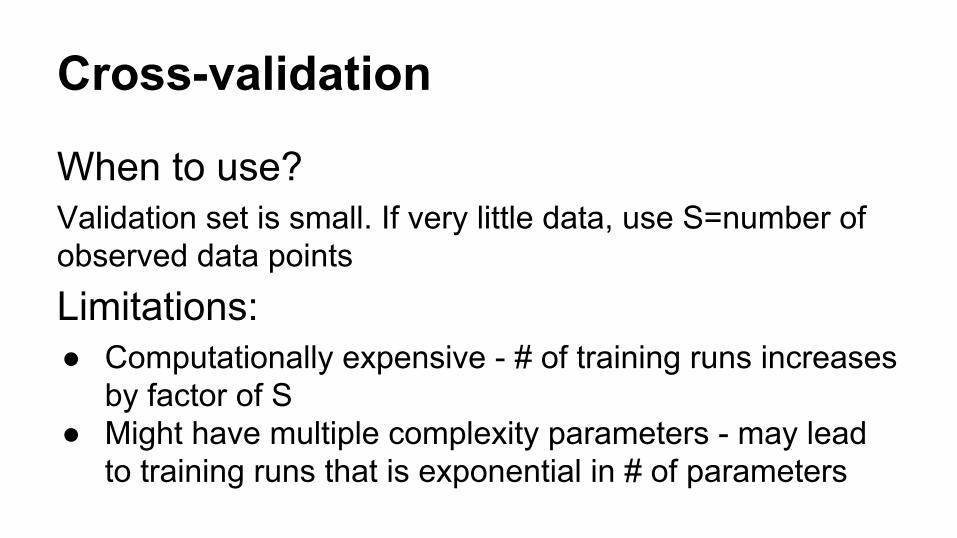
Cross-validation
When to use? Validation set is small. If very little data, use S=number of observed data points
Limitations:● Computationally expensive - # of training runs increases
by factor of S● Might have multiple complexity parameters - may lead
to training runs that is exponential in # of parameters

Alternative Approach:
Want an approach that depends only on size of training data rather than # of training runs
e.g.) Akaike information criterion (AIC), Bayesian information criterion (BIC, Sec 4.4)

Akaike Information Criterion (AIC)
Choose model with largest value for
best-fit log likelihood
# of adjustable model parameters

Gaussian Distribution
This satisfies the two properties for a probability density! (what are they?)

Likelihood Function for GaussianAssumption: data points x drawn independently from same Gaussian distribution defined by unknown mean and variance parameters,i.e. independently and identically distributed (i.i.d)
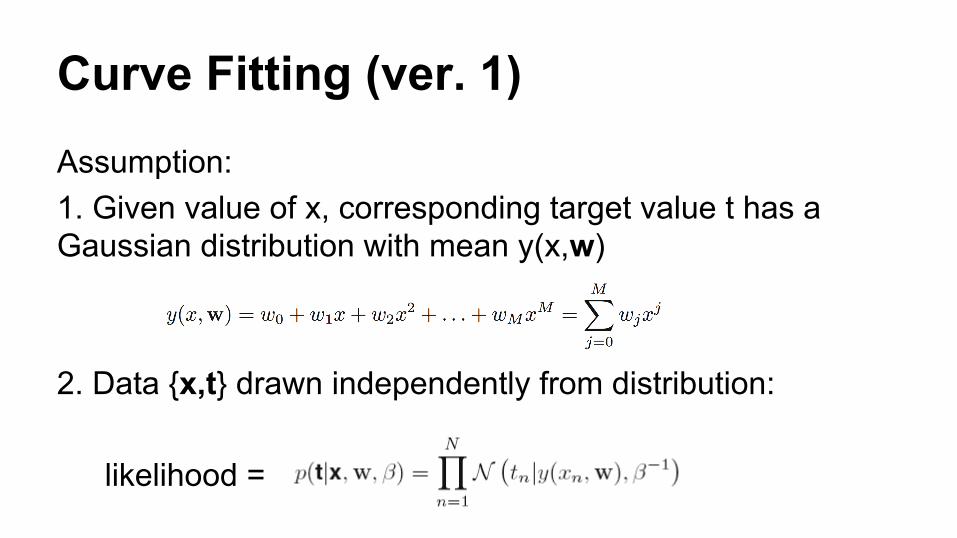
Curve Fitting (ver. 1)Assumption:1. Given value of x, corresponding target value t has a Gaussian distribution with mean y(x,w)
2. Data {x,t} drawn independently from distribution:
likelihood =
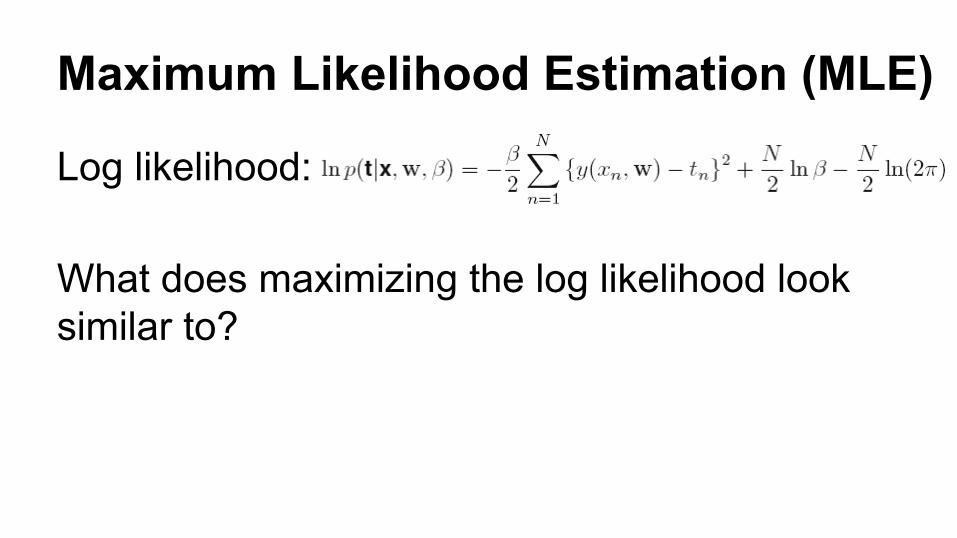
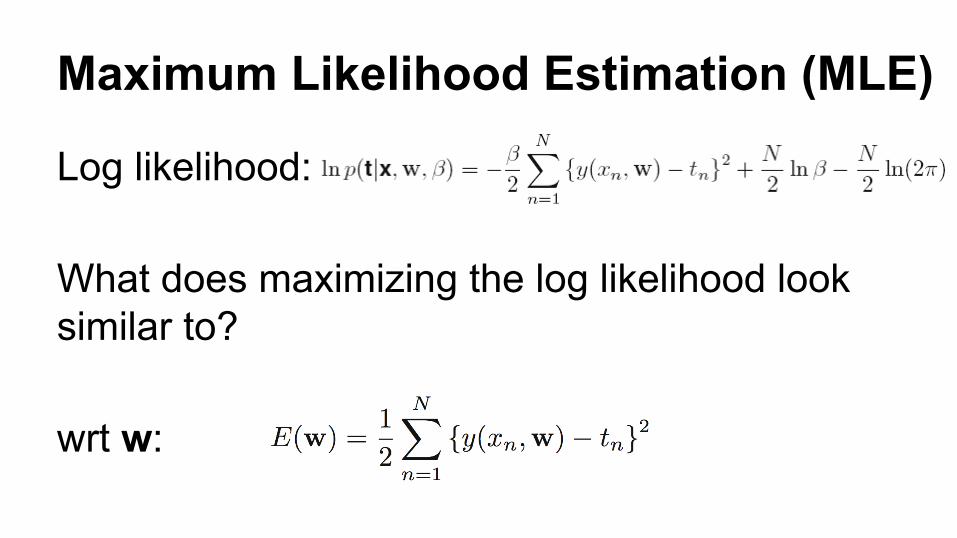
Maximum Likelihood Estimation (MLE)
Log likelihood:
What does maximizing the log likelihood look similar to?
Log likelihood:
What does maximizing the log likelihood look similar to?
wrt w:
Maximum Likelihood Estimation (MLE)

Simpler example: use Gaussian of form
With Bayes’ can calculate posterior:
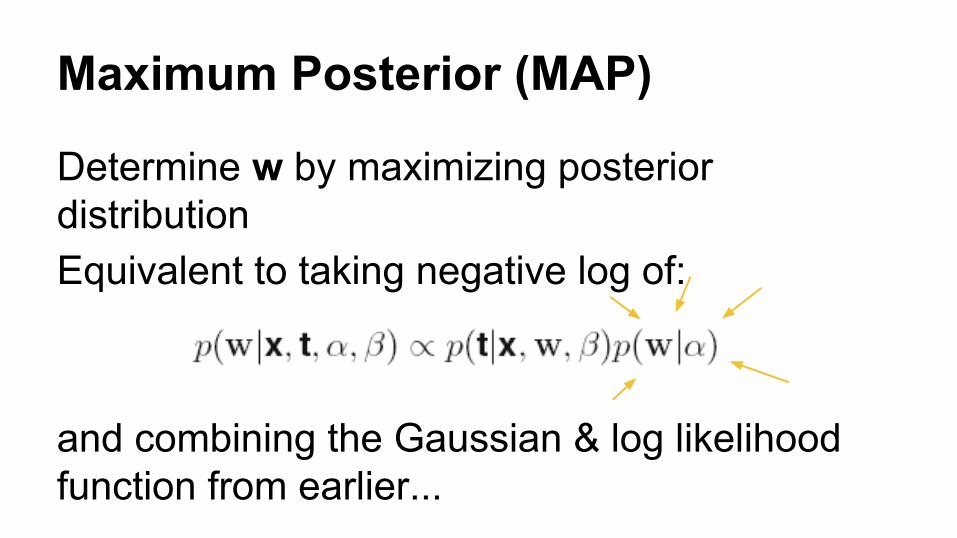
Maximum Posterior (MAP)
Maximum Posterior (MAP)
Determine w by maximizing posterior distributionEquivalent to taking negative log of:
and combining the Gaussian & log likelihood function from earlier...
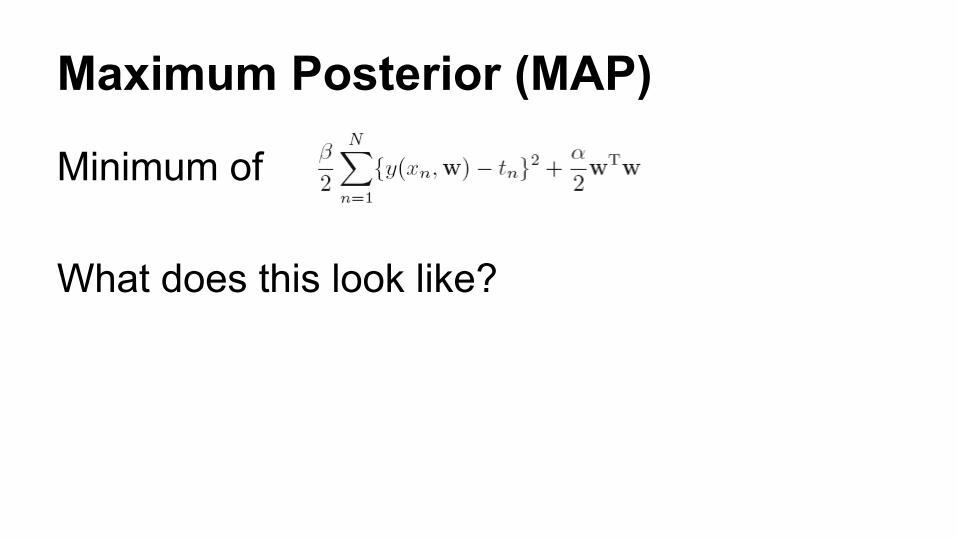
Maximum Posterior (MAP)
Minimum of
What does this look like?

Maximum Posterior (MAP)
Minimum of
What does this look like?
What is regularization parameter?
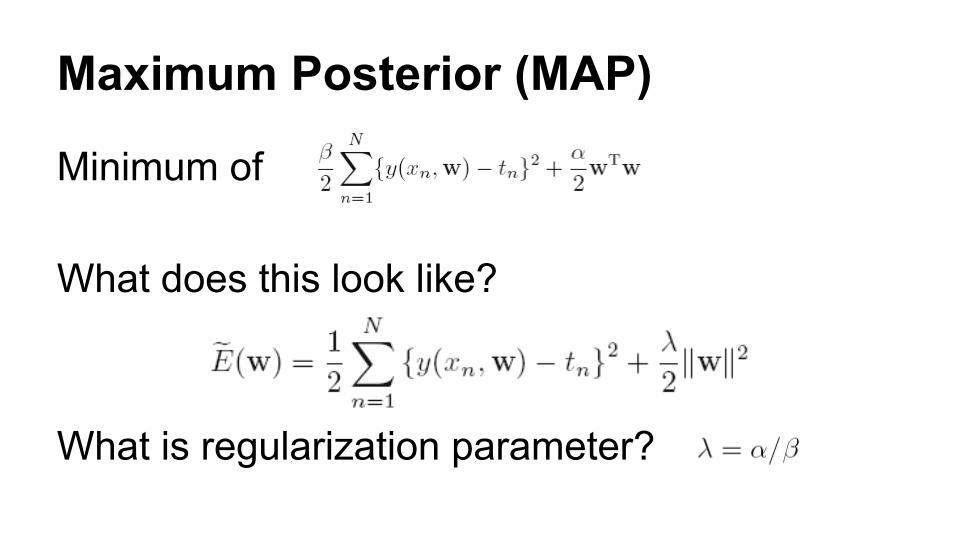
Maximum Posterior (MAP)
Minimum of
What does this look like?
What is regularization parameter?
Bayesian Curve Fitting
However…
MLE and MAP are not fully Bayesian because they involve using point estimates for w
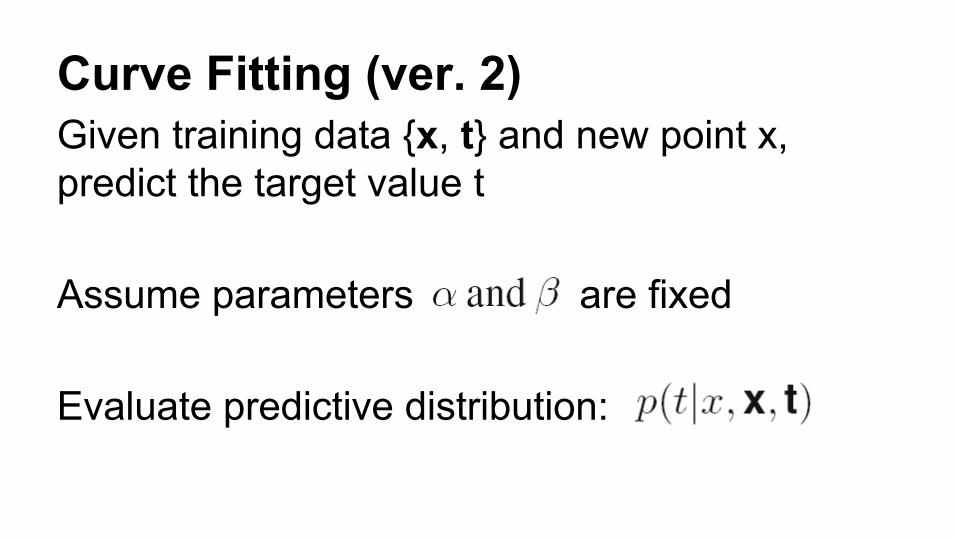
Curve Fitting (ver. 2)Given training data {x, t} and new point x, predict the target value t
Assume parameters are fixed
Evaluate predictive distribution:

Bayesian Curve Fitting
Fully Bayesian approach requires integrating over all values of w, by applying sum and product rules of probability

Bayesian Curve Fittingmarginalization
posterior
This posterior is Gaussian and can be evaluated analytically (Sec 3.3)

Bayesian Curve Fitting
Predictive is Gaussian of form
with mean and variance and matrix
Bayesian Curve Fitting
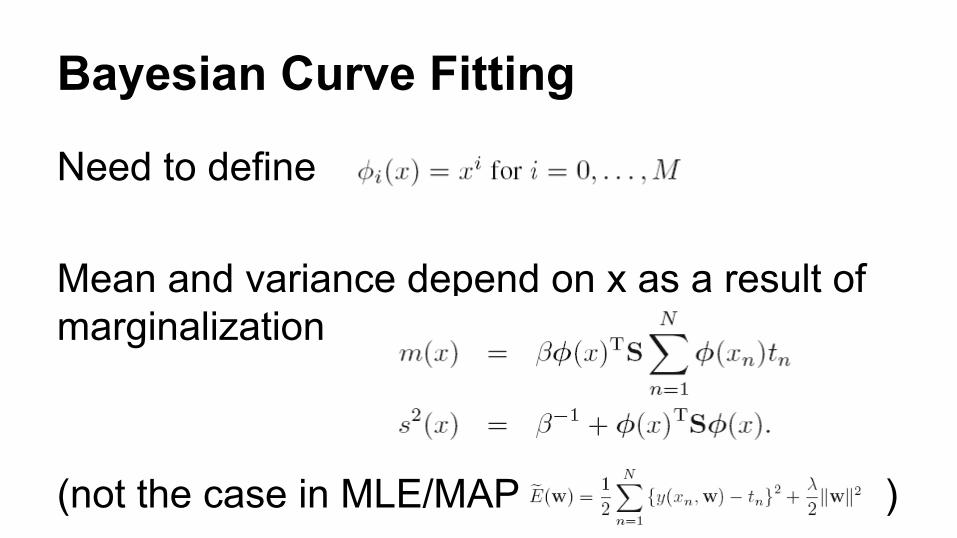
Need to define
Mean and variance depend on x as a result of marginalization
(not the case in MLE/MAP )
MULTIMODAL SENSORY INTEGRATION
Application

Two ModelsVisual Capture
prob
abili
ty
location
v
a
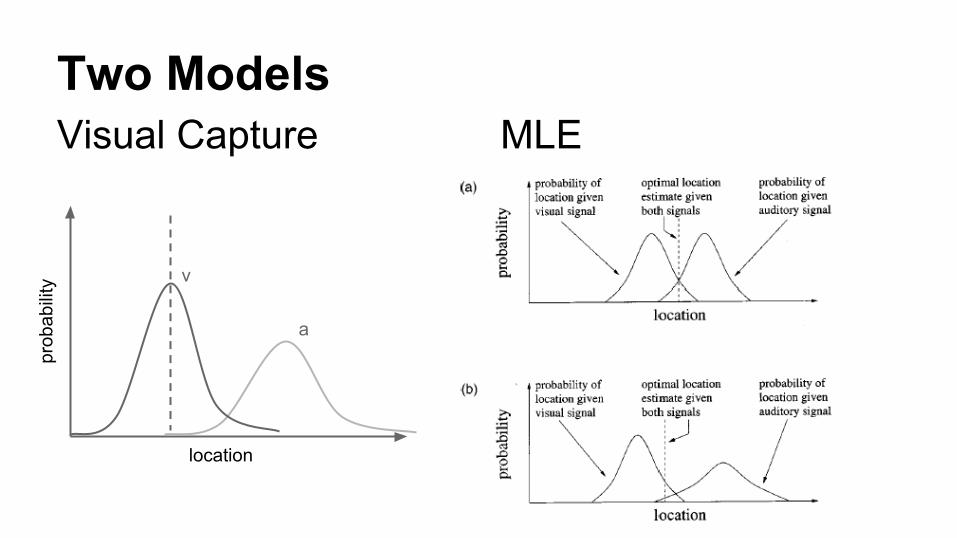
Two ModelsVisual Capture MLE
location
prob
abili
ty v
a

Procedure

Final Result
location
prob
abili
ty v
a
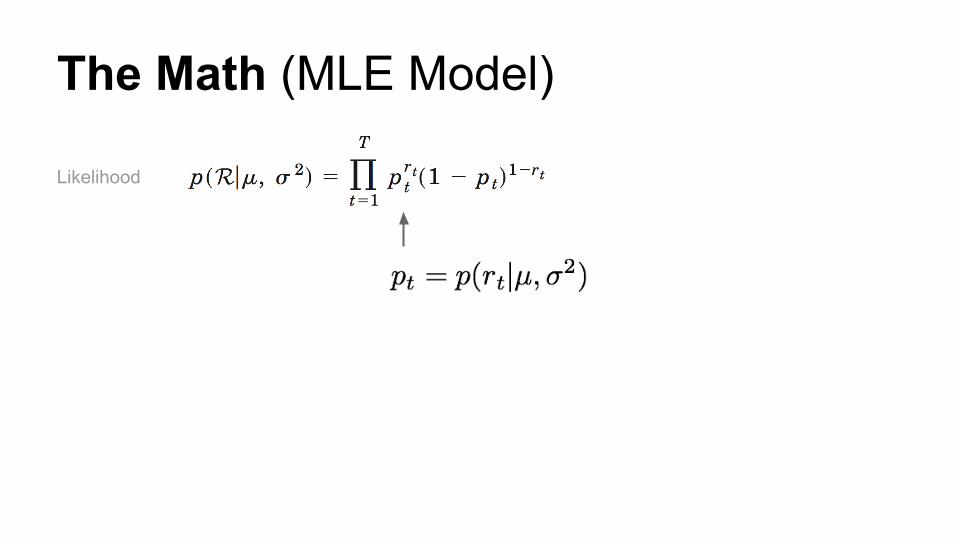
The Math (MLE Model)
Likelihood

The Math (MLE Model)
Likelihood
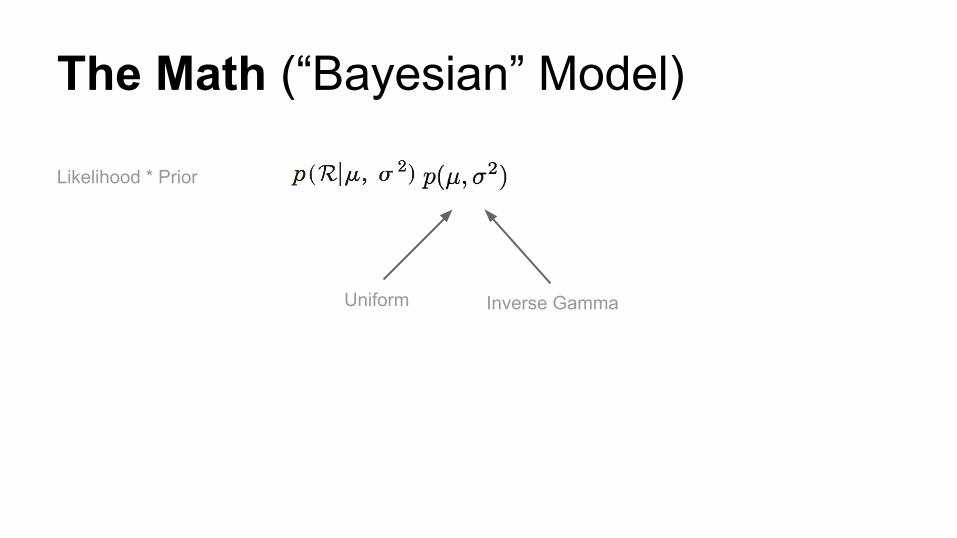
The Math (“Bayesian” Model)
Likelihood * Prior
Uniform Inverse Gamma
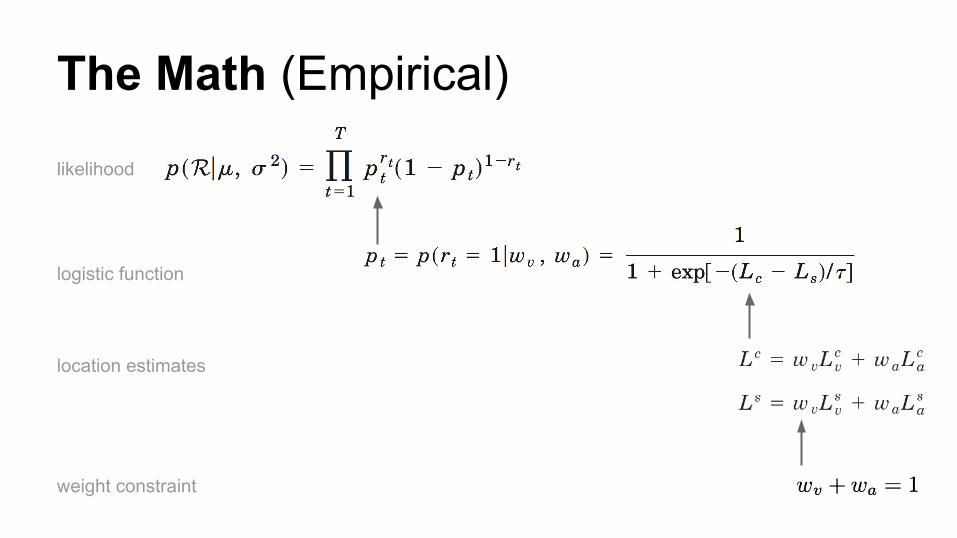
The Math (Empirical)
logistic function
likelihood
location estimates
weight constraint

Final Result

QUESTIONS?
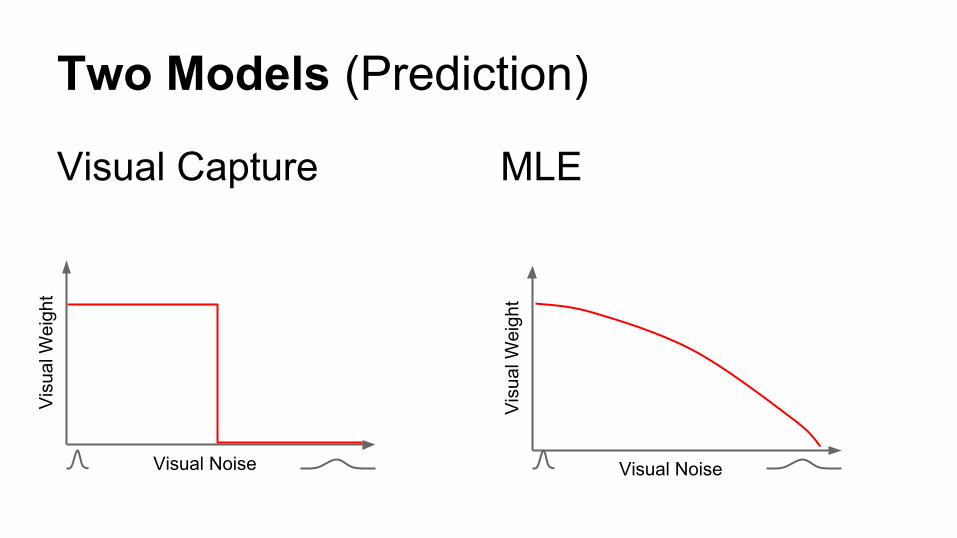
Two Models (Prediction)
Visual Capture MLE
Visual Noise
Vis
ual W
eigh
t
Visual Noise
Vis
ual W
eigh
t