Multiscale characterisation of...
56
THESIS FOR THE DEGREE OF DOCTOR OF PHILOSOPHY Multi-scale characterisation of pasta Effects of raw materials on water absorption, water distribution, and microstructure THOMAS STEGLICH Department of Chemistry and Chemical Engineering CHALMERS UNIVERSITY OF TECHNOLOGY Gothenburg, Sweden 2015
Transcript of Multiscale characterisation of...

THESIS FOR THE DEGREE OF DOCTOR OF PHILOSOPHY
Multi-scale characterisation of pasta
Effects of raw materials on water absorption, water distribution, and microstructure
THOMAS STEGLICH
Department of Chemistry and Chemical Engineering
CHALMERS UNIVERSITY OF TECHNOLOGY
Gothenburg, Sweden 2015

Multi-scale characterisation of pasta Effects of raw materials on water absorption, water distribution, and microstructure THOMAS STEGLICH ISBN 978-91-7597-152-0 ©THOMAS STEGLICH. 2015 Doktorsavhandlingar vid Chalmers tekniska högskola. Ny serie Nr 3833 ISSN 0346-718X Department of Chemistry and Chemical Engineering Chalmers University of Technology SE-412 96 Gothenburg Sweden Telephone + 46 (0)31-772 1000 Cover: Cross section of cooked spaghetti visualised by Magnetic Resonance Imaging and Light Microscopy. The figure illustrates radial changes in water-macromolecule interactions as well as in microstructure. Dixa AB Gothenburg, Sweden 2015

iii
Multi-scale characterisation of pasta Effects of raw materials on water absorption, water distribution, and microstructure
THOMAS STEGLICH
Department of Chemistry and Chemical Engineering
Chalmers University of Technology
ABSTRACT
Pasta is a product with a long history, but is also still being developed today. Producers
want to use new raw materials to make pasta more nutritious, less allergenic, and less depend-ent on durum wheat. All have in common that new raw materials shall not compromise the de-
sired texture properties of cooked pasta such as the “al dente” feeling.
To facilitate the development of new pasta products, understanding the microstructure of pasta can be a tool. Water transforms and interacts with the microstructure during cooking and
the outcome determines the texture. The main objective of this work was to analyse the inter-
play of microstructure and water, and how this is affected by the choice of raw materials.
We combined light microscopy and Magnetic resonance imaging (MRI) to study the mi-crostructure and water distribution of pasta. We improved the resolution of MRI to yield data
in 3D and were able to link MRI data to microstructure components such as fibre particles and
the extent of starch gelatinisation.
Monitoring microstructure transformations during cooking and warm-holding of pasta re-vealed that some transformations are not dependent on the raw materials used. Water ingress
towards the core is regulated by starch gelatinisation, which holds true both during cooking
and warm-holding. The extent of the continuous starch and protein transformation from core to surface in cooked pasta is mainly governed by the product geometry. Also, texture changes
during warm-holding depended mainly on the amount of available water within and around the
pasta after cooking.
Nevertheless, raw materials are of importance: A higher protein content limited the degree of starch swelling within the gelatinised region in cooked pasta. Fibre particles can hinder wa-
ter migration locally due to their perpendicular alignment against the direction of water in-
gress. Bran particles in particular do not absorb water during cooking, but redistribute it around
the particles and create a strong variation in the degree of starch swelling. The severity of this effect correlated with bran particle size.
This thesis provides a comprehensive overview over how local microstructure and raw
material choice affect water distribution at different scales in the cooked product.
Keywords: pasta, light microscopy, magnetic resonance imaging, microstructure, water distribution, texture properties, starch, gluten, bran, dietary fibre


v
List of Publications
This thesis is based on the work contained in the following papers, referred to by Roman nu-
merals in the text:
I Microstructure and water distribution of commercial pasta studied by
microscopy and 3D magnetic resonance imaging
T. Steglich, D. Bernin, M. Röding, M. Nydén, A. Moldin, D. Topgaard, M. Langton
Food Research International, 62, 2014, pp 644–652.
II Multi-scale characterization of pasta during cooking using microscopy
and real-time magnetic resonance imaging
D. Bernin1, T. Steglich1, M. Röding, A. Moldin, D. Topgaard, M. Langton 1 Authors contributed equally
Food Research International, 66, 2014, pp 132–139.
III Bran particle size influence on pasta microstructure, water distribution,
and sensory properties
T. Steglich, D. Bernin, A. Moldin, D. Topgaard, M. Langton
Submitted to Cereal Chemistry
IV Texture of pasta during warm-holding
T. Steglich, A. Moldin, M. Langton
Manuscript, intended for publication in Journal of Texture Studies
Contribution report*
I Planned, performed and evaluated the experiments (except for MRI parameter es-
timation), primarily responsible for writing and revising the manuscript
II Planned, performed and evaluated the experiments, primarily responsible for
writing and revising the manuscript
III Planned, performed and evaluated the experiments, and wrote major parts of the manuscript
IV Planned, performed and evaluated the experiments, and wrote the manuscript
* MRI experiments in paper I-III were planned, developed, performed and
evaluated in close collaboration with Diana Bernin.
All other types of experiments were performed by the author

vi
List of abbreviations
BFLM Bright-field light microscopy
MRI Magnetic Resonance Imaging
OCT Optimal cooking time
PLM Polarized light microscopy
List of sample abbreviations
Industrial-scale spaghetti
DS Durum semolina
DS+FB Durum semolina and wheat fibre
DS+WG Durum semolina and durum whole-wheat flour
DS+SW Durum semolina and soft wheat flour
Laboratory-scale spaghetti
S40D60 40% starch powder, 60% durum wheat flour
D100 100% durum wheat flour
G20D80 20% gluten powder, 80% durum wheat flour
G40D60 40% gluten powder, 60% durum wheat flour
WW0 0% durum whole-wheat flour, 100% durum wheat flour
WW50 50% durum whole-wheat flour, 50% durum wheat flour
WW100 100% durum whole-wheat flour, 0% durum wheat flour
S440 10% bran fraction (median particle size 440 µm), 90% durum wheat flour
S370 10% bran fraction (median particle size 370 µm), 90% durum wheat flour
S160 10% bran fraction (median particle size 160 µm), 90% durum wheat flour
S90 10% bran fraction (median particle size 090 µm), 90% durum wheat flour
D100 and WW0 were produced with different batches of the same flour type

vii
Table of Contents
Introduction .................................................................................................................................. 1
Objectives ..................................................................................................................................... 3
Background................................................................................................................................... 4
Durum wheat components ................................................................................................. 4
Starch ........................................................................................................................ 4
Protein/Gluten ........................................................................................................... 6
Bran/non-starch polysaccharides .............................................................................. 7
Pasta processing ................................................................................................................. 7
Durum wheat pre-processing .................................................................................... 7
Mixing ....................................................................................................................... 7
Extrusion ................................................................................................................... 8
Drying ....................................................................................................................... 8
Transformations during cooking ......................................................................................... 9
Water transport models .................................................................................................... 10
Influence of starch and gluten properties on pasta quality .............................................. 11
Influence of bran on pasta quality ................................................................................... 12
Transformations after cooking: Storing pasta.................................................................. 12
Materials and Methods ............................................................................................................... 13
Spaghetti preparation ....................................................................................................... 13
Cooking and Warm-holding ............................................................................................ 14
Water absorption.............................................................................................................. 14
Light microscopy ............................................................................................................. 14
Magnetic resonance imaging ........................................................................................... 15
Cooking quality ............................................................................................................... 15
Statistical analysis............................................................................................................ 15
Magnetic resonance imaging of pasta: Challenges and method development ........................... 16
Basic principles of MRI ................................................................................................... 16
Challenges in MRI for pasta research .............................................................................. 17
MRI in this work.............................................................................................................. 17
MRI of cooked pasta ............................................................................................... 17
Real-time MRI during cooking of pasta ................................................................. 18
Combining MRI and light microscopy ................................................................... 19
Results and Discussions ............................................................................................................. 21
General structural transformations .................................................................................. 21
Cooking: Water absorption and structure transformations ..................................... 21
Microstructure of cooked spaghetti ........................................................................ 23
Post-cooking: Warm-holding .................................................................................. 24
Post-cooking: Storing at ambient temperatures ...................................................... 26
Effects of raw materials on texture, microstructure, and water distribution in pasta ...... 27
Starch and protein content ...................................................................................... 27
Bran addition and bran particle size ....................................................................... 32
Conclusions ................................................................................................................................ 39
Future research ........................................................................................................................... 40
Acknowledgements .................................................................................................................... 41
References .................................................................................................................................. 42


Introduction
1
Introduction
Pasta is a universal food mainly made from wheat, but also from rice and other cereals. It
has a century-old history with roots in China and Italy. However, the industrial production did
not start before the 1950s (De Vita, 2009). Even in Italy the consumption of pasta rose first
after this time, from being limited to feast days to everyday use. Today, Italians consume about
25 kg per capita and year. For comparison: Swedes consume 9 kg per capita and year
(International Pasta Organisation, 2012).
Pasta and noodles are offered in manifold forms and ways - as fresh pasta, instant pasta and, most importantly, dried pasta. However, it is still not completely understood how the tex-
tural properties of cooked pasta are formed and influenced by every step of the production
chain - starting from the choice of raw materials over production itself to end with how to keep the product warm after cooking.
A better understanding of these processes can aid to develop and improve pasta products.
The challenges are plenty: nowadays, cooked pasta is often stored before consumption; e.g. by
holding it warm in a canteen kitchen or keeping it cold in ready-to-eat meals and salads. Other pasta products are produced with high amounts of dietary fibre to improve their nutritional pro-
file, but this affects texture properties.
Studying pasta microstructure and its interactions with water can be one tool to improve
the understanding of the material. Already more than 30 years ago, Resmini and Pagani (1983) noted:
“Pasta proves to be an interesting limited water-starch-protein system where
starch/ protein competition for water, conformational changes and mutual in-teractions take place during processing and cooking. The understanding of
these phenomena, which may parallel that of other cereal products, can be en-
hanced by the study of pasta fine structure”.
The focus of the current research was to combine microstructure analysis with a spatially resolved analysis of water distribution in pasta and relate the findings to texture properties.


Objectives
3
Objectives
The goal of this work was to better understand how raw materials affect in cooked pasta
texture properties such as firmness and stickiness. The main objective was therefore to charac-
terise the interplay of water and microstructure during and after cooking of pasta. A schematic overview shows the focus of the individual papers (Figure 1).
The specific aims were:
- Improve the spatial resolution of MRI to determine water distribution in pasta
after cooking in detail (I, III)
- Improve the temporal resolution of MRI to monitor water migration in pasta
during cooking (II)
- Determine the interplay of water and microstructure of pasta
- During cooking (II)
- After cooking (I, III)
- After warm-holding (IV)
- Elucidate the effects of raw materials (determined by their variation in protein, starch
and fibre/bran content) on water absorption, water distribution, and microstructure as
well as texture properties (I-IV) - Determine in detail the effects of bran particle size (III)
- Define the factors causing texture changes in warm-held pasta (IV)
Figure 1 Overview of main analytical focus of each respective study

Durum wheat components
4
Background
The term pasta describes generally sheeted or extruded wheat dough products. They are
often categorised into (Asian) noodles and pasta (Marchylo et al., 2004). While noodles are
based on common wheat flour and are sheeted, pasta is mainly based on durum wheat flour and is extruded.
The ultimate goal for every pasta manufacturer is to produce pasta with the best texture
properties possible. What defines the best cooking quality might be subjective and consumer preference can vary from country to country, but cooking quality is often linked to being high
firmness, low stickiness as well as overcooking tolerance (Marti et al., 2014).
Recently, much research has been directed to changing the raw materials used while main-
taining the cooking properties by adapting the production process. The research efforts can be grouped into three trends (references refer to reviews):
- Substitute durum wheat with cheaper and local crops (Fuad and Prabhasankar, 2010),
- Increase nutritional value such as content of dietary fibre (Rawat and Indrani, 2014;
Sissons and Fellows, 2014), and
- Decrease allergenicity (in particular replace gluten) (Hager et al., 2012; Marti et al.,
2014; Petitot et al., 2009).
Durum wheat semolina is seen as the most suitable raw material for pasta production. As a starting point for any raw material modulation, it is useful to understand how the major durum
wheat components starch and protein form the structure for desired texture properties during
cooking. Texture properties are related to microstructural changes during cooking, which in turn are affected by water and temperature.
Durum wheat components
For pasta production, generally only parts of the wheat grain are used, while whole-wheat
pasta requires using the whole grain (Manthey and Schorno, 2002). The main parts of a grain
are the endosperm, bran and germ (Figure 2). The endosperm consists primarily of starch granules and protein bodies, which are grouped in a cellular structure surrounded by thin cell
walls (Kill and Turnbull, 2001). The bran comprises several protective cell layers while germ
is the embryo of the grain and thus is rich in vitamins, minerals, antioxidants and dietary fibre
(Manthey and Schorno, 2002). To achieve homogeneous flours, only the endosperm is used and thus bran and germ are
often removed during milling. The remaining endosperm is milled to flour and for common
and durum wheat these flours are called farina and semolina, respectively. The texture affect-ing wheat components starch, protein and bran will be described in the following section.
Starch
Starch is composed of the two polysaccharides amylose and amylopectin, which both are
based on glucose residues. Amylose consists of a linear chain with α-1,4 linkages, while amy-lopectin is highly branched through additional α-1,6 linkages. The ratio between amylose and
amylopectin can vary, but is generally one to three in wheat (Delcour et al., 2010). Amylose
and amylopectin are synthesized in granular form with alternating amorphous and semi-crystalline growth rings. The semi-crystallinity makes starch granules birefringent and visible
in polarised light (Delcour et al., 2010).

Background
5
Figure 2 Illustration of a (soft) wheat kernel highlighting the main parts endosperm, bran and
germ. Reproduced with permission from Slavin et al. (2000)
Starch granules are formed during biological synthesis together with non-starch molecules
such as phosphates and lipids (Conde-Petit, 2003; Tang et al., 2006). In wheat they show a bi-
modal distribution, with larger oval type-A-granules and smaller round type-B-granules (Soh et al., 2006).
In the research of this work, also soft wheat flour has been used. Therefore, durum and soft
wheat starch are briefly compared. Durum wheat starch has a higher water binding capacity, slightly higher amylose content and lower gelatinisation temperature than common wheat
starch (Delcour et al., 2010; Vansteelandt and Delcour, 1999). Zweifel (2001) concluded that
this suggests a less compact starch granule structure in durum wheat. However, durum wheat
lacks the protein puroindoline which induces a stronger interaction of proteins with the starch granule surface and makes the kernels very hard (Delcour et al., 2010). This may be the reason
that during milling starch damage is higher in durum than in common wheat. Compared to
common wheat, especially the type-A-granules of durum wheat are smaller (13-16 µm com-
pared to 22-36 µm) and the volume share of them is higher (Pérez and Bertoft, 2010; Soh et al., 2006; Wilson et al., 2006). Finally, according to Vansteelandt and Delcour (1999), durum
wheat starch and common wheat starch show about the same protein content, but differ in lipid
content.
When sufficient moisture is available, native starch gelatinises when heated above the ge-latinisation temperature, losing its crystallinity and structural organization (Copeland et al.,
2009). At the same time there is a significant increase in molecular water mobility (Cuq et al.,
2003). Water is absorbed first to the amorphous zones and, if there are channels, water first

Durum wheat components
6
reaches the inside and then diffuses outward (Copeland et al., 2009; Fannon et al., 2004; Langton and Hermansson, 1989). This hydration process can be quite fast, with a half time of
7s (Lemke et al., 2004). The loosely bound amylose molecules start to leach out of the granule.
Starch molecules can swell to a certain amount before they are disrupted by the induced stress.
Observing the melting process of starch using differential scanning calorimetry (DSC) meas-urements, an additional peak appears at higher temperatures than the peak corresponding to
starch gelatinisation. This is attributed to the melting of amylose-lipid complexes (Conde-Petit,
2003).
Protein/Gluten
The heterogeneous wheat protein is classified according to extractability into four frac-
tions: water soluble albumins, globulin (soluble in salt solution), gliadins (soluble in ethanol)
and glutenins (soluble in dilute acids, Troccoli et al., 2000). Albumins and globulins represent the minor part (15-20 %) and have emulsifying properties. The major part of wheat proteins
consists of gliadin and glutenin which form the composite gluten. Gluten is an important factor
in determining pasta quality as it can form a viscoelastic network (Delcour et al., 2012).
Glutenin is further separated into high and low molecular weight subunits. Both subunits are bound together by intermolecular disulphide bonds and form the huge polymer glutenin in
a helical structure (Sissons, 2008; Zweifel, 2001).
In the dry grain the gluten is accumulated in protein bodies which are unevenly distributed
in the kernel, both quantitatively and qualitatively (Gil-Humanes et al., 2011; Tosi et al., 2011). Protein concentration is higher close to the bran layer and lower in the central starchy
endosperm cells. Some protein bodies can even form a continuous matrix enclosing starch
granules (Tosi et al., 2011). Through the addition of water, gluten bodies transform from the crystalline, glassy state to
become rubbery, elastic and form a network through inter-molecular bonds (Kill and Turnbull,
2001). Already at a water content of 15 %, the glass transition occurs below room temperature
and hence gluten is in the rubber state at the conditions used for pasta dough preparation. At temperatures above 60 °C, again as a function of moisture, hydrated gluten forms three-
dimensional aggregates through the establishment of covalent bonds (protein-protein cross
links; Sissons, 2008). This thermosetting is irreversible (Cuq et al., 2003). Gluten bond for-
mation both during processing and cooking is described in more detail elsewhere (Bock and Seetharaman, 2012; Wagner et al., 2011).
Kontogiorgos (2011) suggests a new hierarchical model for the structure of the hydrated
gluten. At molecular level individual glutenins and gliadins are interacting via various physical and covalent bonds. At the nanoscale a continuous phase is created where gluten polymers
form sheets. These resulting sheets can be seen as the building block of the gluten network.
The side-by-side arrangement of the sheets gives a nanoporous structure with “confined” water
entrapped into the sheets and interacting strongly with the gluten matrix and “bulk” water sur-rounding it. Between the sheets nanocapillaries are formed. Depending on the packing of the
sheets, a three-dimensional network is formed at the microscale. Finally, the gluten network on
the macroscale can show various morphologies.
Regarding its rheological properties, glutenin is responsible for elastic properties in a dough, while gliadin acts as a plasticizer, being responsible for viscous properties such as
dough extensibility (Sissons et al., 2007). The term gluten strength is a measure for the balance
between the two gluten subfractions, i.e. between viscosity and elasticity (Sissons, 2008). Glu-ten strength can be measured with the gluten index method and a higher gluten index indicates
stronger gluten network.

Background
7
Bran/non-starch polysaccharides
Bran is built up of several layers – from the outermost pericarp, to intermediate layers of
testa, nucellar and hyaline layer to the protein-rich aleurone layer closest to the endosperm
(Figure 2). The structure of each layer has been shown in detail by Surget and Barron (2005).
Wheat bran is both rich in dietary fibre as well as protein, as it is composed of about 48% die-tary fibre, 16% starch, 18% proteins, 5% fat, 5% sugars and 6% ash (Meuser, 2008).
Other non-starch polysaccharides can be found in the in the germ and in the cell walls of
the endosperm (Sissons, 2008). The cell walls consist of cellulose, lignin, β-glucan and hemi-
cellulose, where arabinoxylans are a major component within hemicellulose (BeMiller, 2010). Generally, non-starch polysaccharides are often classified as dietary fibres and sorted into
soluble and insoluble fibres (BeMiller, 2010). Bran is mostly insoluble while other added fi-
bres such as inulin and guar gum are soluble (Rakhesh et al., 2015).
Pasta processing
After the necessary pre-processing of wheat, and milling to semolina or flour, pasta is pro-
duced by three main steps: Semolina is polymerised during mixing, the material is compacted
and formed by means of sheeting or extruding and this structure is stabilised by drying
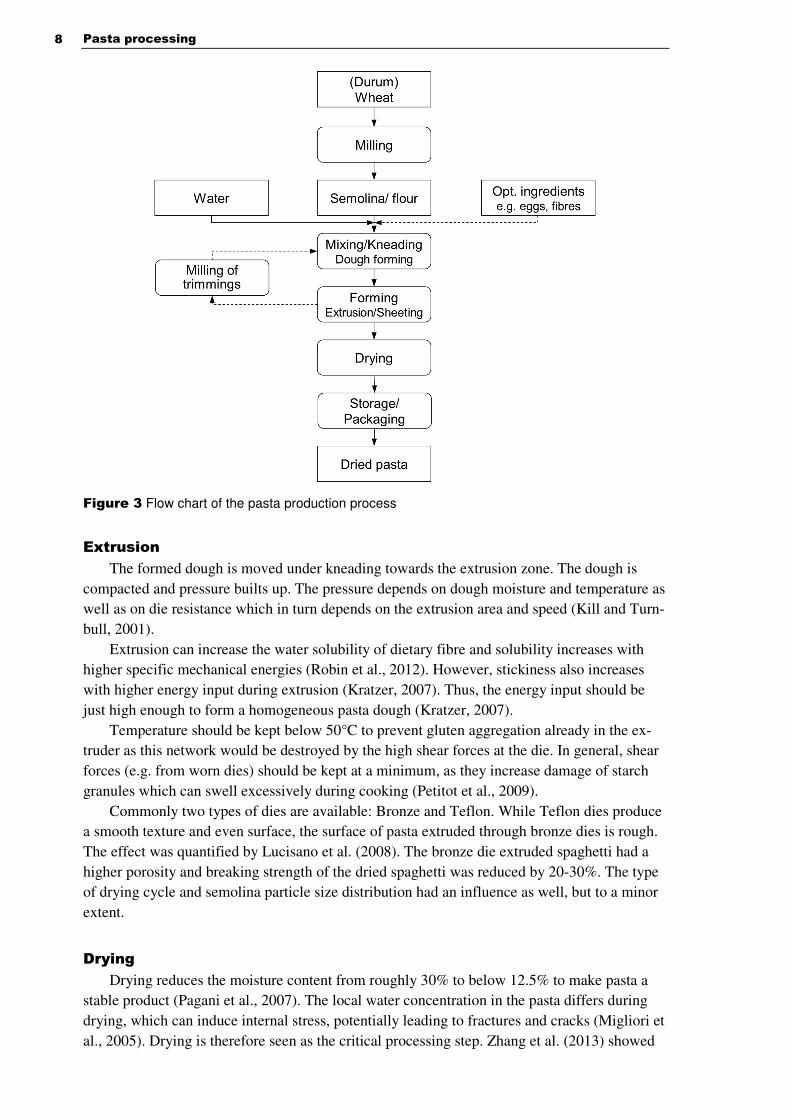
(Kratzer, 2007) (Figure 3).
Durum wheat pre-processing
The aim of the milling process is to separate the endosperm from the germ and the bran of
the wheat kernel to get a maximum of semolina at the best quality (Kill and Turnbull, 2001). Milling comprises therefore the following steps: Cleaning of the wheat, tempering (or debran-
ning) to loosen the bran layers as well as milling, and purifying to achieve semolina of the
right particle size.
The milling process is a combination of grinding, sifting, and blending to reduce milling passages. To grind pre-processed kernels, they are led over several rolls which are categorised
according to their roughness into breakers, reduction rolls, steel screens and purifiers (Cubadda
et al., 2009). The breakers open the kernels and separate the carbohydrate-rich endosperm from
bran and germ. The reduction rolls are mainly used to adjust the particle size whereas a larger number of purifiers is used to remove remaining bran particles (Delcour et al., 2010).
Mixing
Commonly, semolina particles and water are pre-mixed at high-speed to ensure a homoge-neous particle wetting (Kill and Turnbull, 2001). Afterwards the mixture is kneaded for some
minutes at lower speed to form a dough and especially to form the gluten network. A narrow
particle size distribution ensures a homogeneous dough and reduces the risk of the formation
of non-wetted particles (white spots) (Kill and Turnbull, 2001). A smaller particle size is pre-ferred to reduce the mixing time. Semolina with a particle size below 250 µm can be mixed in
5 min compared to the coarse semolina which needs 15 min to mix (Rubin, 2007). An alterna-
tive, integrated mixing system was introduced some years ago which uses co-rotating twin-
screws, leading to intensified mixing and kneading. Thereby, mixing time was reduced to 20 sec (Kill and Turnbull, 2001).
Vacuum in the mixing zone prevents oxidation of semolina natural pigments and the intru-
sion of air bubbles, which gives a better shine of the pasta product (Pagani et al., 2007). Addi-tionally, temperature should be controlled during dough preparation with an optimum
temperature between 35 and 40°C (Kill and Turnbull, 2001).
Pasta processing
8
Figure 3 Flow chart of the pasta production process
Extrusion
The formed dough is moved under kneading towards the extrusion zone. The dough is
compacted and pressure builts up. The pressure depends on dough moisture and temperature as well as on die resistance which in turn depends on the extrusion area and speed (Kill and Turn-
bull, 2001).
Extrusion can increase the water solubility of dietary fibre and solubility increases with higher specific mechanical energies (Robin et al., 2012). However, stickiness also increases
with higher energy input during extrusion (Kratzer, 2007). Thus, the energy input should be
just high enough to form a homogeneous pasta dough (Kratzer, 2007).
Temperature should be kept below 50°C to prevent gluten aggregation already in the ex-truder as this network would be destroyed by the high shear forces at the die. In general, shear
forces (e.g. from worn dies) should be kept at a minimum, as they increase damage of starch
granules which can swell excessively during cooking (Petitot et al., 2009).
Commonly two types of dies are available: Bronze and Teflon. While Teflon dies produce a smooth texture and even surface, the surface of pasta extruded through bronze dies is rough.
The effect was quantified by Lucisano et al. (2008). The bronze die extruded spaghetti had a
higher porosity and breaking strength of the dried spaghetti was reduced by 20-30%. The type of drying cycle and semolina particle size distribution had an influence as well, but to a minor
extent.
Drying
Drying reduces the moisture content from roughly 30% to below 12.5% to make pasta a stable product (Pagani et al., 2007). The local water concentration in the pasta differs during
drying, which can induce internal stress, potentially leading to fractures and cracks (Migliori et
al., 2005). Drying is therefore seen as the critical processing step. Zhang et al. (2013) showed

Background
9
that spaghetti shrank faster in radial than in axial direction during drying in an experimental drying chamber. Additionally, the spaghetti shrank torsional, non-central directed in the begin-
ning and linear, central directed later. These findings may explain the arising of internal stress
and cracks.
High temperature drying can improve product quality and compensate the use of raw ma-terials of inferior quality to some extent(Petitot et al., 2009; Zweifel et al., 2003). In addition,
high temperature drying can reduce overall drying time (Petitot et al., 2009). Zweifel et al.
(2003) analysed various drying profiles and concluded that drying at high temperature at a late
stage gave the best product quality (compared to low-temperature- and early high-temperature drying). The protein network was preserved through promoting protein denaturation to a dense
and continuous network encapsulating starch granules and thus swelling of starch granules was
reduced. Compared to early high-temperature drying, late high-temperature drying stabilised
the protein network to such an extent that the network was still visible even in the external zone of overcooked pasta.
High temperature drying can make up for inferior protein composition (Del Nobile et al.,
2003b). However, if the temperature is too high and the polymerisation reaches a point where the proteins get too rigid to expand, it will result in inferior pasta as well (Delcour et al., 2010).
High temperature drying also increases the risk for heat damages of the dried pasta - mainly
off-colours and off-flavours and reduced nutritional value of the proteins with the breakdown
of lysine due to the formation of Maillard reaction products (de Noni and Pagani, 2010; Peressini, 2011). It may also affect the allergenicity of the proteins (Petitot et al., 2009).
Raw material choice can also affect drying behaviour. Bran inclusion modifies the drying
kinetics and the equilibrium moisture is different in bran-rich than in bran-free semolina during
drying (Villeneuve and Gelinas, 2007).
Transformations during cooking
In their native state and at room temperature, both starch and gluten are in a glassy state
and are organised in crystalline structure. They are very limited in their water uptake, with a
decreasing solubility for the starch components from amylopectin, to amylose and amylose-lipid complexes (Conde-Petit, 2003). Depending on temperature and water content, starch and
gluten can change from a glassy state to a rubbery state reversibly via a so-called glass transi-
tion. A second, irreversible transformation occurs at higher temperatures: Starch gelatinisation
and protein denaturation. During pasta cooking, starch granules absorb water and swell. This increases the volume
and pressure on the protein network (Delcour et al., 2010). With increasing temperature, two
endothermic transitions take place. First, starch gelatinises, and at a higher temperature amyl-
ose-lipid complexes dissociate (Petitot and Micard, 2010). Starch gelatinisation and gluten polymerisation occur at the same time and are competitive in regard to the absorbed water as
well as controlled by the water penetration inside the pasta (Petitot et al., 2009).
It is interesting to note that while starch becomes soluble during gelatinisation, gluten be-comes insoluble during the network formation (Pagani et al., 2007). Therefore, the kinetics of
these processes determines the extent of starch swelling.
Depending on the amount of starch swelling, amylose can leach out of the granules and the
starch granules disintegrate. This can induce excessive cooking loss (loss of material into the cooking water) and increased stickiness (Delcour et al., 2010). The final product quality de-
pends on how the protein structure withstands the swelling of the starch (Delcour et al., 2000a,
2000b). When protein polymerisation during cooking does not make up for insufficient
polymerisation during drying, excessive cooking losses occur. In contrast, the proteins in pasta

Water transport models
10
dried at very high temperatures may well have polymerised to such an extent that they are too rigid to expand and retain the gelatinised starch during cooking, resulting in inferior quality
pasta (Bruneel et al., 2010; Delcour and Hoseney, 2009). The latter depends on the protein
network, with a strong network preventing the leakage and dissolving of starch granules
(Zweifel et al., 2003; Bruneel et al., 2010). Honeycomb-like structure at the surface of partly and fully cooked spaghetti could be detected (Heneen and Brismar, 2003; Sung and Stone,
2005). In any case, the cooking generates a concentrical change from the core to the surface in
the microstructure (Cunin et al., 1997). This gradient in the change of microstructure and mois-
ture content with a firm core is often referred to as 'al dente'. Delcour et al. (2010) summarised the cooking process by arguing that the transformation of starch is a hydration-driven gelatini-
sation process in the outer layer while it is a heat-induced crystallite melting in the centre of
the pasta.
Water transport models
Water is a major part of most foods and its distribution steers food properties. In the con-text of pasta products, especially the water absorption and desorption processes are of interest.
During the life-time of a pasta product, water migration occurs during mixing of the dough,
drying and cooking of the pasta, and finally during storage of the cooked pasta. A lot of re-search has been carried out to model these sorption processes. The modelling is complicated by
the fact that the sorption is happening at the same time as swelling/shrinking and physical
modifications of the structural elements, i.e. gelatinisation of starch and denaturation of gluten
(Del Nobile et al., 2003). To ease the mathematical description of these phenomena, water mi-gration is most often described in one dimension only. That is also why spaghetti and lasagne
plates are used so abundantly, as the radial profile of the spaghetti and the large surface com-
pared to the thickness of lasagne, respectively, leads to a water migration in predominantly just
one dimension. Numerous models have been reported that tried to explain the water absorption process
with models based on stationery as well as non-stationary Fickian diffusion and it is further
disputed whether dried pasta can be seen as porous medium or not. To mention just one rather new study: Zhu et al. (2011) developed a finite element analysis taking into account the simul-
taneous effects of water absorption and viscoelastic deformation. They describe pasta as an
unsaturated food system from the beginning. The moisture transport during the hydration pro-
cess is the sum of diffusion and viscoelastic effects and thus, the water transport is dominated by non-Fickian diffusion.
The most complete model may have been proposed by Del Nobile et al. (2003b). Accord-
ing to them, the hydration process occurring during cooking and overcooking depends on four
main phenomena: 1. melting kinetics of the crystalline starch domain, 2. water diffusion, 3. relaxation of the macromolecular matrix (swelling), and 4. residual deformation release. Water
diffusion is controlling water uptake at the beginning of the rehydration process. The diffusion
occurs through two phenomena at the same time: A. Molecular diffusion (related to Brownian movement), driven by the concentration gradient of water (low in the core of the pasta and
high at the surface). B. Macromolecular matrix relaxation, driven by the disequilibrium of the
local system. The second effect means that when water hits the macromolecular matrix (that is
starch and protein), the matrix does not take up all the water needed to reach its equilibrium immediately. The matrix swells over time and the kinetics of the swelling is dependent on the
level of disequilibrium. Melting of starch crystals requires a minimum temperature, but is then
a fast process compared to the processes mentioned before. The fourth phenomenon (release of
residual deformation) takes into account that, during drying, the continuous protein phase is
Background
11
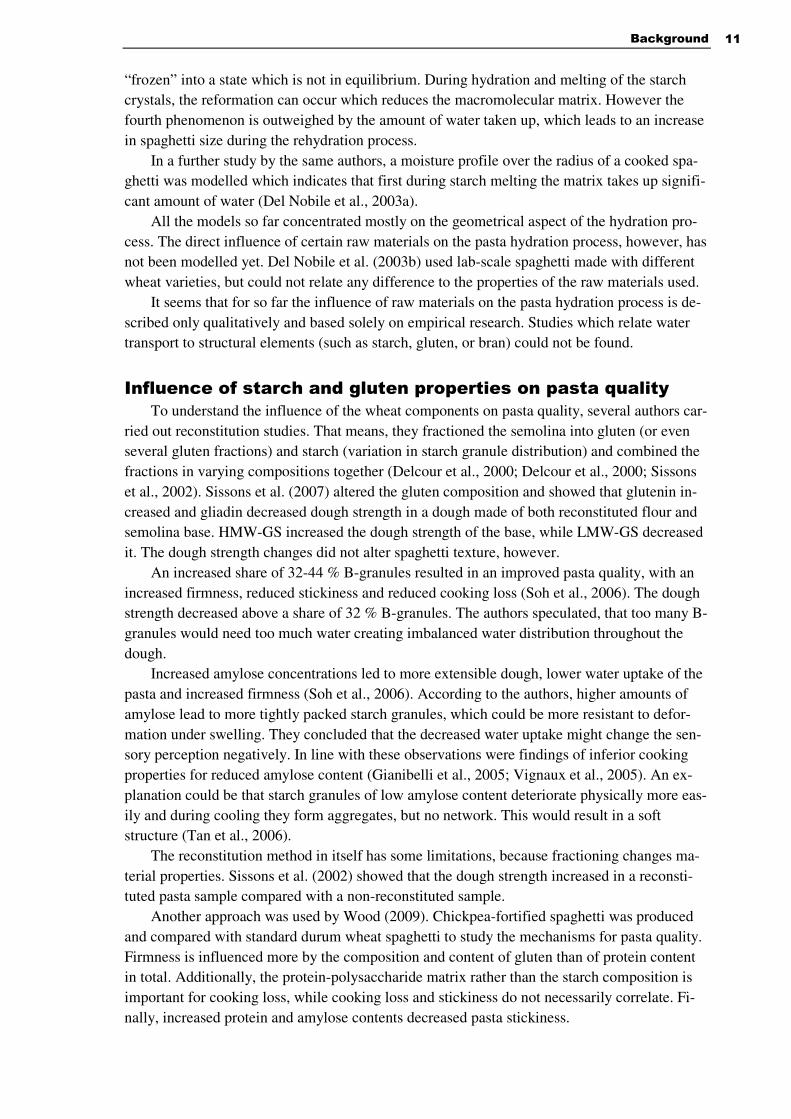
“frozen” into a state which is not in equilibrium. During hydration and melting of the starch crystals, the reformation can occur which reduces the macromolecular matrix. However the
fourth phenomenon is outweighed by the amount of water taken up, which leads to an increase
in spaghetti size during the rehydration process.
In a further study by the same authors, a moisture profile over the radius of a cooked spa-ghetti was modelled which indicates that first during starch melting the matrix takes up signifi-
cant amount of water (Del Nobile et al., 2003a).
All the models so far concentrated mostly on the geometrical aspect of the hydration pro-
cess. The direct influence of certain raw materials on the pasta hydration process, however, has not been modelled yet. Del Nobile et al. (2003b) used lab-scale spaghetti made with different
wheat varieties, but could not relate any difference to the properties of the raw materials used.
It seems that for so far the influence of raw materials on the pasta hydration process is de-
scribed only qualitatively and based solely on empirical research. Studies which relate water transport to structural elements (such as starch, gluten, or bran) could not be found.
Influence of starch and gluten properties on pasta quality
To understand the influence of the wheat components on pasta quality, several authors car-
ried out reconstitution studies. That means, they fractioned the semolina into gluten (or even several gluten fractions) and starch (variation in starch granule distribution) and combined the
fractions in varying compositions together (Delcour et al., 2000; Delcour et al., 2000; Sissons
et al., 2002). Sissons et al. (2007) altered the gluten composition and showed that glutenin in-
creased and gliadin decreased dough strength in a dough made of both reconstituted flour and semolina base. HMW-GS increased the dough strength of the base, while LMW-GS decreased
it. The dough strength changes did not alter spaghetti texture, however.
An increased share of 32-44 % B-granules resulted in an improved pasta quality, with an
increased firmness, reduced stickiness and reduced cooking loss (Soh et al., 2006). The dough strength decreased above a share of 32 % B-granules. The authors speculated, that too many B-
granules would need too much water creating imbalanced water distribution throughout the
dough. Increased amylose concentrations led to more extensible dough, lower water uptake of the
pasta and increased firmness (Soh et al., 2006). According to the authors, higher amounts of
amylose lead to more tightly packed starch granules, which could be more resistant to defor-
mation under swelling. They concluded that the decreased water uptake might change the sen-sory perception negatively. In line with these observations were findings of inferior cooking
properties for reduced amylose content (Gianibelli et al., 2005; Vignaux et al., 2005). An ex-
planation could be that starch granules of low amylose content deteriorate physically more eas-
ily and during cooling they form aggregates, but no network. This would result in a soft structure (Tan et al., 2006).
The reconstitution method in itself has some limitations, because fractioning changes ma-
terial properties. Sissons et al. (2002) showed that the dough strength increased in a reconsti-tuted pasta sample compared with a non-reconstituted sample.
Another approach was used by Wood (2009). Chickpea-fortified spaghetti was produced
and compared with standard durum wheat spaghetti to study the mechanisms for pasta quality.
Firmness is influenced more by the composition and content of gluten than of protein content in total. Additionally, the protein-polysaccharide matrix rather than the starch composition is
important for cooking loss, while cooking loss and stickiness do not necessarily correlate. Fi-
nally, increased protein and amylose contents decreased pasta stickiness.

Influence of bran on pasta quality
12
Influence of bran on pasta quality
Due to its nutritional profile, there is a great interest to learn more about how wheat bran and other fibre sources affect pasta properties. Only recently, several groups studied bran and
bran fractions being incorporated into pasta/noodles ((Aravind et al., 2012; Chen et al., 2011;
Chillo et al., 2008; Kaur et al., 2012; Shiau et al., 2012; West et al., 2013). Bran often induces
strong aromas in pasta (due to phenolic acids) and changes texture with increased cooking loss and decreased firmness (West, 2012). What induces these texture changes is not fully under-
stood. Tudorica et al. (2002) argue for fresh pasta that soluble fibres are included into the pro-
tein network of the pasta, while insoluble fibres such as bran are disrupting the network. In the
case of dried pasta, SEM images showed that the bran particles where not in contact with the protein matrix and thus disrupted the network (Manthey and Schorno, 2002). Others argue that
it might depend on the amount and type of fibre (germ particles affected the protein network to
a larger extent than bran particles; Aravind et al. 2012) and on the process conditions (Ville-
neuve and Gelinas, 2007). One recent study rejects the theory of gluten network destruction for the case of bread (Noort et al., 2010). Instead, the authors argue that the fibres interact physi-
cally or chemically with the gluten and thus hinder gluten aggregation.
Several approaches have been reported to counteract the deteriorating effect of bran inclu-sion. Heat treated bran (Sudha et al., 2011), and pasta dried at high temperatures (West et al.,
2013) helped to remain the desired texture.
Transformations after cooking: Storing pasta
Storing cooked pasta deteriorates its sensorial properties over time (McCarthy et al., 2002;
Olivera and Salvadori, 2011; Wood, 2009). Internal moisture migration has been pointed out as factor for pasta stored at ambient conditions. Moisture redistributes from the outer to the inner
zone during storage and reduces both moisture gradient as well as firmness of pasta (Gonzalez
et al., 2000). While the moisture content becomes more homogeneous throughout the gelati-
nised region, the area of the ungelatinised core will remain the same during storage in ambient temperatures (Horigane et al., 2006; Sekiyama et al., 2012).
The deterioration effect can be controlled by the storage process. Irie et al. (2004) treated
cooked spaghetti samples differently after production: samples were dried, frozen, or stored at ambient or chilled conditions. Dried and frozen spaghetti showed a clear moisture gradient
from surface to core with a low moisture content in the core. Fresh and chilled spaghetti showed
a gentle moisture gradient whereas one week stored spaghetti did barely show any gradient. Me-
chanical properties followed the tendencies in the moisture gradient, with higher forces needed to break dried and frozen spaghetti and lower forces for the chilled spaghetti. Faster product freez-
ing can remain better initial quality during frozen storage (Olivera and Salvadori, 2011).
The choice of raw materials can also influence the properties after storage. Chickpea-
fortified spaghetti remained firmer than semolina spaghetti when stored (Wood, 2009). Fur-thermore, spaghetti maintained firmer after cooking when seasoned with sodium chloride or
monosodium glutamate as those salts temporarily absorbed excess water at the surface of the
spaghetti (Horigane et al., 2009). Warm-holding pasta is, compared to cold-storing, even more challenging for foodservices
with pasta becoming softer and less chewy (Al-Obaidy et al., 1984). Texture deteriorates faster
in warm-held starch-rich foods compared to cold-storing as starch gelatinisation is continuing
(Briffaz et al., 2014a). Trends in texture changes are similar for warm-held and overcooked pasta (Willbrandt et al., 1989). Others found also larger differences in cooking quality as cook-
ing time was increased over optimal cooking time and attributed it more to gluten strength than
protein content (Dexter et al., 1981; Grzybowski and Donnelly, 1979).

Materials and Methods
13
Materials and Methods
The spaghetti form was chosen for its simple dimensions resulting in one-dimensional, ra-
dial water ingress. Analysed were both spaghetti produced on industrial-scale (paper I, IV) as
well as laboratory-scale (paper II, III). The industrial-scale spaghetti were based mainly on fine durum semolina (Triticum durum, DS), but differed in protein content and quality as the flour
of various batches and durum wheat varieties was used (paper I and IV). The product DS+SW
contained also soft wheat flour (Triticum aestivum). Samples in paper I and IV were produced in different years. The spaghetti in paper I differed furthermore in fibre content and type of fi-
bre. Lab-scale spaghetti of greatly varied protein and starch contents were achieved by mixing
durum semolina with either starch or gluten powder (paper II). The effect of bran particle size
was studied by milling coarse bran to median particle sizes between 90 and 440 µm and mix-ing it with durum wheat flour. Additionally, durum wheat flour was mixed with durum whole-
wheat flour to vary the whole-wheat content in spaghetti from 0 to 100% (paper III).
The samples studied are listed with an approximated protein content of the respective
flours used (Table 1). More compositional data is given in the respective papers.
Table 1 List of spaghetti samples studied. Protein refers to calculated protein content of the flour
mixes (14% wet base).
Industrial-scale Protein Lab-scale Protein
Paper I Paper II
DS Durum wheat flour 13.6 S40D60 Starch-to-gluten ratio D Durum wheat flour, S starch, G gluten Number indicate share
7.2
DS+FB D. + wheat fiber 12.7 D100 11.9
DS+WG D. + whole-wheat flour 13.3 G20D80 24.8
DS+SW D. + soft wheat flour 12.0 G40D60 37.9 Paper IV Paper III
DS+SW D. + soft wheat flour 14.2 S440 Bran added to durum wheat flour Number indicates median particle size
13.6
DS1 Durum wheat flour 14.2 S370 13.6
DS2 Durum wheat flour 13.7 S160 13.6
DS3 Durum wheat flour 13.6 S90 13.6
DS+FB* D. + wheat fiber 13.8 WW0 Varied whole-wheat content Number indicates share
13.0
DS+WG* D. + whole-wheat flour 15.1 WW50 13.7
WW100 14.4
* Samples were analysed, but not included in paper IV
Spaghetti preparation
All industrial-scale spaghetti were manufactured with the same process and supplied by
Lantmännen Cerealia (Järna, Sweden). The lab-scale process was supposed to mimic the in-dustrial process. Due to equipment restriction, lab-scale spaghetti production differed from in-
dustrial-scale: Mixing and extrusion was carried out in a small pasta machine (Edelweiss
TR/75C, Italy) without vacuum. Spaghetti were extruded at a lower pressure compared to an
industrial process and rested outside the oven at ambient temperature for a short term. Finally, lab-scale spaghetti was dried in a combi steamer oven (CCM, Rational, Germany) with limited
temperature and humidity control. Diameters of the uncooked spaghetti were 1.65-1.70 mm
(paper I and IV), 1.50-1.75 mm (paper II) and 1.55 mm (paper III).

Cooking and Warm-holding
14
Cooking and Warm-holding
In general, when spaghetti should be analysed in its cooked state, spaghetti was cooked in boiling, distilled water and cooled directly afterwards in ice water. For sensory analysis and
warm-holding, however, spaghetti was cooked in salted tap water (0.7% w/w NaCl) and spa-
ghetti in paper II was also cooked in salted distilled water (0.7% w/w NaCl) corresponding to a
salt level recommended for sensory evaluation (Delcour et al., 2000b). The following procedure was established for warm-holding (paper IV). 1 kg spaghetti was
batch cooked for 7 or 10 min in 10 L water, drained and transferred in a suitable solid steel
pan. The pan was covered and placed in a combi-steam oven set at 80°C and 30% relative hu-
midity to ensure that the spaghetti did not dry during warm-holding. Samples were removed from the centre of the pan after 15 min as well as 90 min of warm-holding. Additionally after
90 min, spaghetti strands were taken from the bottom of the pan (referred to as 90 min bottom).
The phrase optimal cooking time (OCT) will be used in the results sections. This refers to
a standardised method (AACC, 2000) and defines the cooking time as the time when the non-gelatinised core disappears.
Water absorption
Determining the weight increase over cooking time is an easy measure for the water distri-
bution at the macroscale. Individual spaghetti strands (25 mm) were cooked and removed in intervals from the water. Directly after cooling in ice water, they were blotted and weighed.
The weight increase was determined as the mass ratio between the cooked and the dry sample
([W-W0]×W0-1). Whenever possible, the diameter of each dry spaghetti strand was measured
before cooking. Thereby the water absorption data could be normalized with the initial surface area which is determined by the dry diameter. The normalisation followed Ogawa et al. (2011).
Light microscopy
Light microscopy is one of the oldest analytical methods as its working principle is rather simple. A light beam is sent through a set of lenses and the sample to receive an enlarged im-age of the sample structure on a detector. The image is formed by several sources of contrast such as absorption, scattering and reflection of the illumination. Diffraction limits the image resolution theoretically at about the half of the wave length of the incident light beam - using visible light this gives a limit of about 200 nm. This limit is in practice in the magnitude of µm due to sample preparation and properties. Thus, light microscopy enables to analyse food products from the micro- to the macroscale (Autio and Salmenkallio-Marttila, 2001). The main reason to use light microscopy was its ability to map all important components starch, gluten and bran/fibre in one image.
After cooking, pasta samples were prepared for sectioning either by plastic embedding (paper I) or freezing (paper II-IV). The former allows thinner sections of 1 µm (improving the resolution), but involves long embedding procedures which may affect the microstructure. Fur-thermore, in undercooked pasta the plastic embedding medium did not diffuse into the ungelat-inised core which made it impossible to slice whole cross-sections.
Freezing is much faster and easier to produce longitudinal sections with, at the cost of having thicker sections of 5-10 µm. Additionally, slices do not attach on the specimen holder as well as plastic sections. This might have introduced artefacts during staining especially in bran-rich pasta.
Sections were analysed both in polarized light (paper I-IV) as well as bright-field light (paper I-III). Only structures that show birefringence are visible in polarised light. This in-cludes ungelatinised starch as well as fibre structures which makes polarised light useful to distinguish the cooking front as well as bran and cell-wall material within the starch-gluten matrix.

Materials and Methods
15
In bright-field light microscopy, contrast is enhanced by staining agents. Light Green stains proteins while Iodine stains starch. In the resulting images, proteins are stained in green,
starch granules in blue/violet, amylose in blue and amylopectin in brown. Fibre structures are
generally not stained (but appeared often greenish in micrographs of bran-rich spaghetti which
was likely due to remaining staining agent light green). Thus, in the stained light micrographs, all important components within pasta could be visualised in the same image. The structures
can be seen in the magnified light micrographs in Figure 5. In the core region, starch appeared
as dark blue granules (small and large granules) surrounded by gluten network in green. In the
intermediate region, swollen starch granules appeared more violet while amylose in dark blue accumulated in the core and surfaces of starch granules. In the surface region, starch phase
separated into amylose enrichments (blue) and random, brownish structures of amylopectin.
The image of the intermediate region includes an aleurone cell rich in protein (green), fat
(brown) and is surrounded by cell walls (cellulose, unstained).
Magnetic resonance imaging
Magnetic resonance imaging can be used to map the water content and water-macromolecule
interactions within pasta. Some studies reported using MRI in pasta research, but we still need-
ed to adapt the technique to fulfil our demands. The basic principles and challenges of MRI are therefore discussed in a separate chapter,
together with how we addressed these challenges and how we finally used MRI in this work.
Cooking quality
Cooking quality include properties defining pasta in its cooked, eatable state, such as ap-
pearance, texture and flavour. In this work some texture properties were determined instrumen-tally as well as sensorially.
Breaking strength of uncooked and firmness as well as stickiness of cooked and warm-
held spaghetti were determined instrumentally (Instron Universal Testing Machine Model No.
5542, 500 N load cell; Instron, High Wycombe, UK) following reported routines (AACC, 2000; Fiorda et al., 2013; Shiau et al., 2012; Sissons et al., 2008). Samples were cooked in ex-
cess of water for 10 min (paper I and IV) or 8 min (paper III) and cooled for 1 min in ice water
for firmness measurement, while they were only drained for stickiness measurement. Firmness was determined as maximum compression force and stickiness as maximum retraction force;
both determined in N.
For sensory analysis (paper III), bran-rich spaghetti was cooked for 10 min instead of
8 min as pre-test showed that 8 min cooked spaghetti were experienced as undercooked. Firm-ness, stickiness, elasticity, surface roughness and whole-wheat flavour were evaluated by 8
semi-trained panellists in a difference from control test following Bustos et al. (2011a). The
panel assessed each sample twice by determining how much more or less intense a certain at-
tribute was compared to the reference WW50. Attributes were assessed on a linear scale (-5 to +5 with the reference placed in the centre at 0). Additionally, the panel was asked to rate each
spaghetti for overall liking (0 to 10 without a reference).
Statistical analysis
Texture and sensory analysis data were subjected to one-way analysis of variance (ANO-VA, General linear model). Grouping information was obtained using the Tukey Method with
a 95.0% confidence interval. P-values less than 0.05 were considered significant. Analyses
were performed using Minitab 16 Statistical Software (Minitab Inc., USA).

Basic principles of MRI
16
Magnetic resonance imaging of pasta: Challenges and method development
Cooked pasta contains roughly about 60% water and it is thus of interest how water affects
and interacts with other components such as starch, gluten and fibre. 1H magnetic resonance
imaging (MRI) is a non-invasive method to visualise interactions of water with its surroundings and its distribution in pasta (Lai and Hwang, 2004). In this chapter, the technique will be brief-
ly explained as well as how MRI has been applied to pasta research. Furthermore, for pasta,
MRI caused some measurement challenges and it will be described how we addressed these challenges. The chapter is concluded by describing how we combined MRI and light micros-
copy.
Basic principles of MRI
MRI can be used to measure concentration of compounds, structural elements, temperature
or diffusivity in various materials (Mariette et al., 2009). MRI uses the magnetic moment of nuclei – in this work the hydrogen proton (which is abundant in water and organic com-
pounds). The protons in a strong magnetic field will align with the field (Schmidt, 2007). A
combination of radio frequency (r.f.) pulses, which are part of a pulse sequence, is then used to
excite the protons. The signal is acquired before the spins relax back to the thermal equilibrium (alignment with the field). Multidimensional images e.g. 3D can be obtained by using magnet-
ic field gradients which are orthogonal to each other (Cabrer et al., 2005).
The signal intensity in each voxel depends on the physiochemical environment and is a product of the proton density I0 and the corresponding attenuation factors e.g. relaxation times
T1 and T2 (Cabrer et al., 2005). The longitudinal relaxation time T1 is driven by thermal relaxa-
tion. The influence of T1 on the signal intensity can be minimised by adjusting two MRI pa-
rameters: long repetition times (the time lapse between acquiring and re-exciting the signal should be at least five times T1) and small flip angles of the excitation pulse (Cabrer et al.,
2005; Schmidt, 2007).
If T1 –weighting can be neglected, the equation for signal intensity S(TE) as a function of
the echo time (TE) can be shortened to
= exp − ,
where I0 represents the initial intensity or proton density and T2 represents the transverse relaxation time. By running a series of echo times, T2 and I0 can be estimated for each voxel
based on a regression of the signal intensities on the aforementioned equation.
I0 can be used as a proxy for water content as mainly water protons are measured. Ex-
changeable protons and mobile protons from the macromolecules are measured as well, but their share is rather low (see detailed discussion in paper I). T2 is the weighted average of all
proton pools (water, starch, gluten, fibre). We interpret therefore T2 as describing the water-
macromolecule interactions, which is mainly chemical exchange. Several factors determine the resolution of an image where some factors are defined by the
MRI magnet itself while others can be chosen by the operator. Generally, stronger magnetic
field gradients and smaller radiofrequency coils (smaller coil diameter and thus smaller field-
of-view) will improve the spatial resolution of a Fourier-transformed image. Furthermore, the shorter the echo time can be, the higher the signal intensity will be. Factors such as the number
of voxels and field-of-view as well as number of signal accumulations are a tradeoff between
spatial and temporal resolution and the signal-to-noise ratio. I.e. a smaller voxel size results in
a decreased signal-to-noise ratio and thus a noisier image.

Magnetic resonance imaging of pasta: Challenges and method development
17
Challenges in MRI for pasta research
In the last fifteen years, only few research groups have used MRI to study the water distri-bution and interaction in pasta and noodles. Texture properties were linked to the water distribution
in cooked lasagna (Gonzalez et al., 2000; McCarthy et al., 2002), while Bonomi et al. (2012)
correlated sensory perception and protein network changes in spaghetti. Lai and Hwang, (2004)
studied changes in water interaction during storage at ambient temperatures. Most of the re-search, however, was carried out in Japan studying both noodles and spaghetti (Horigane et al.,
2009, 2006; Irie et al., 2004; Kojima et al., 2004, 2001; Maeda et al., 2009; Sekiyama et al., 2012).
In most studies two-dimensional images (slices) were acquired to achieve a high temporal res-
olution. This approach allows a high in-plane spatial 2D resolution (Bonomi et al. (2012) reported 35×35µm2), but averages the signal from a slice at least 1 mm in thickness. Thus the signal cannot
be connected to any of the structural elements starch, gluten and fibre individually. Valuable in-
formation has been extracted from these measurements, but the level of detail remains limited.
Most of the aforementioned studies report only T2 based data, except for Gonzalez et al. (2000) and McCarthy et al. (2002) who presented signal intensity images. Some studies sug-
gested that the moisture content can be determined by T2 with the help of a calibration curve
(Horigane et al., 2006; Irie et al., 2004; Maeda et al., 2009). Pulverised durum semolina was mixed with known amounts of water and cooked until full starch gelatinisation. Then the T2
value of the gelatinised sample was measured and correlated with the known moisture content.
This approach neglects, however, that starch in cooked pasta exists in various degrees of gelatinisa-
tion depending on the position within the pasta (Heneen and Brismar, 2003), which should influ-ence T2 (Ritota et al., 2008). Additionally, also gluten changes its confirmation during cooking
which should influence T2 as well. At least egg protein decreased T2 during its denaturation at con-
stant moisture between 40 and 80°C before increasing during further heating (Mariette, 2009).
Thus, the challenges for this work were to find a suitable setup to acquire MRI signal in 3D at high spatial resolution and to find a more comprehensive interpretation of I0 and T2* in
the pasta context.
MRI in this work
In paper I-III, we extracted both I0 as well as T2 parameter maps from the measured signal. We studied cooked pasta (paper I and III) as well as pasta during cooking (paper II). The for-
mer allowed having a high spatial resolution and a low temporal resolution, while the latter
required a high temporal resolution, which reduced the spatial resolution of the MRI measurement.
MRI of cooked pasta
One aim of this work was to improve the spatial resolution of the MRI measurement of
cooked spaghetti to be better able to relate the MRI data to structural components within pasta
such as fibre particles (paper I and III). The resolution was set to 78×78×78µm3 and was measured over the whole spaghetti volume enabling us to visualise the MRI data in several di-
rections (Figure 5). Due to the high resolution and low moisture content, special care was taken
to treat the noise (detailed description in paper I).
The chosen resolution resulted in a comparatively long measurement time of 92 min. Such a long time was deemed unsuitable by others as water diffusion and homogenization will take place
during the measurement (Maeda et al., 2009). The homogenization effect has been shown by sev-
eral studies, but despite of changes in absolute values for I0 and T2, the relative differences re-
mained (Horigane et al., 2006; Lai and Hwang, 2004; McCarthy et al., 2002; Sekiyama et al., 2012). The presented I0 and T2 parameter maps may not show the situation directly after cooking,
but are still sufficient for comparing various pasta samples being measured with the same protocol.

MRI in this work
18
To minimise the measurement time, we applied a gradient-echo pulse sequence. The gra-dient-echo uses a 30° excitation pulse, which reduces the repetition time, but also yields the
parameter T2* (paper I and III). A true T2 can only be determined when a spin echo (90° r.f.
pulse and a train of 180° r.f. pulses) is used, such as in the RARE (Rapid Acquisition Relaxa-
tion Enhancement) pulse sequence (paper II). T2* will not refocus the inhomogeneity of the applied r.f. pulses in contrast to T2.
Measurement time was further reduced from 92 min to 16 min in paper III. We adjusted
the field-of-view to acquire the signal only from a representative slab in the centre of the spa-
ghetti instead of the whole volume (Figure 4 A). This could be done because cooked spaghetti shows an isotropic water distribution throughout the cross section (Horigane et al., 2006).
A note concerning the resolution: The ultimate goal would be to achieve a resolution simi-
lar to light microscopy. Currently, this would give a very low signal-to-noise ratio or very long
measurement times and would require many repetitions. Still, resolution improvements are likely possible. We tested an about ten times higher resolution with a measurement time of
112 min instead of 16 min (Figure 4 B). At this resolution, a quantitative analysis was not pos-
sible because the noise became prevalent. However, the exemplary image revealed more de-tails as areas of low or no signal were easier to distinguish from the rest of the pasta matrix.
Still, this illustrates potential for higher resolution.
Figure 4 T2 parameter maps showing sketches of varied MRI parameters: measured volume (A)
and resolution (B). Slices in (B) were obtained from the same sample (S160).
Real-time MRI during cooking of pasta
We adapted the MRI method of Mohorič et al. (2004) who studied the cooking process of
rice kernels. While rice kernels cook in about 30 min, the cooking process of spaghetti to optimal
cooking takes place within 10 min. Hence, real-time MRI during pasta cooking requires the
highest temporal resolution possible. A test showed that 3D real-time MRI was possible in prin-ciple (resolution 156×156×156 µm3), but resulted in a measurement time of 60s per image. For
the data presented in paper II, we chose instead a 2D real-time MRI set-up (156×156×1000 µm3)
and one image was recorded in 31s. This greatly reduced moisture migration during the time lapse of an experiment.
Another challenge was to acquire the signal from the spaghetti only and not from the sur-
rounding cooking water. By using a repetition time of 0.9s, the cooking water was heavily T1-
weighted and resulted in strongly decreased signal intensity. However, a T1 analysis at the end of the cooking process showed that the signal within the spaghetti was also slightly T1-
weighted and thus the uncorrected I0 parameter maps reflected not the true water concentration.

Magnetic resonance imaging of pasta: Challenges and method development
19
As T1-weighting of the signal varied between the samples, a comparison of I0 between the samples was not possible. Still, the T1-weighted I0 parameter maps showed the temporal
changes of the water distribution throughout the cooking series in a qualitative manner.
Combining MRI and light microscopy
Acquiring MRI data in 3D allows visualising the water distribution not only in higher resolution, but allows plotting 2D slices in various directions (Figure 5). This is especially
helpful when analysing components creating an anisotropic pasta structure such as fibre. Even
though MRI data can be plotted in 3D, data will be presented in the results chapter as 2D slic-
es. We experienced that interpreting the data is easier in 2D compared to 3D. MRI acquires the signal from the whole voxel volume which had a side length of 78 µm.
To illustrate the size of the base area of a voxel, three light micrographs are shown in Figure 5.
The images show the voxel volume comprises more starch granules in the core region than in the intermediate or surface region. Bran particles will often be positioned in adjacent voxels as
exemplary shown with part of an aleurone cell in the image of the intermediate region.
Spaghetti sections can be cut similarly to the MRI 2D plots in axial, longitudinal and tan-
gential direction and thereby light microscopy analysis can be correlated to MRI data. The symbols for the three directions shown in Figure 5 will be used throughout this work.
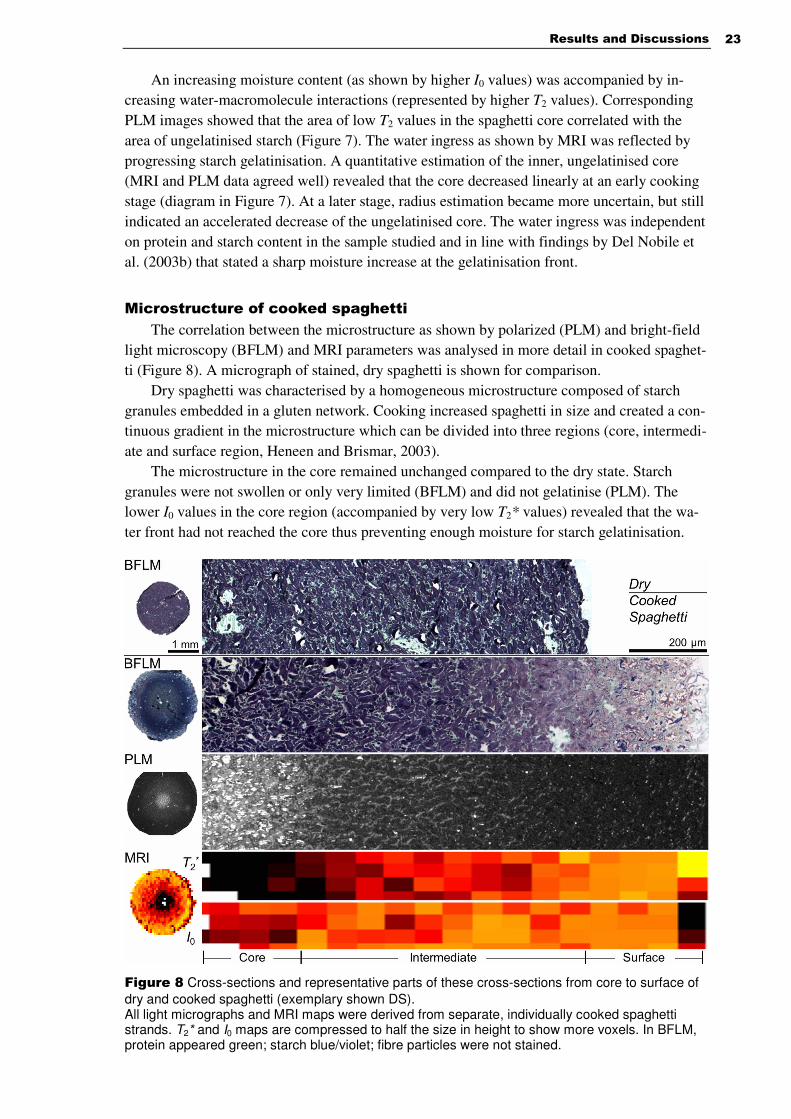
Figure 5 2D T2* parameter maps selected out of a full 3D MRI data set are shown surrounded by
a spaghetti surface rendering. 2D plots show three different directions. To illustrate the voxel size of the MRI data, light micrographs are shown in the size of the base area of one voxel. For comparison, thin sections corresponding to the MRI plots are shown in light microscopy (BFLM and PLM). Very dark areas in light micrographs are folded sections. The images show as an ex-ample bran-rich spaghetti (DS+WG and S370). Symbols indicate viewing direction.


Results and Discussions
21
Results and Discussions
Cooking softens the structure of initially dry pasta and is normally stopped once a desired
texture is reached. If the pasta is not consumed directly, texture continues to change.
Analysing water absorption, water distribution and microstructure during and after cook-ing revealed that structural, texture-affecting transformations happen independent of the raw
materials used. These general transformations during cooking and post-cooking are described
first and how they can be monitored combining MRI and light microscopy. Texture changes were analysed in particular during warm-holding of pasta.
Next, the effects of raw materials on these transformations are discussed. They will be dis-
cussed separately for the parameters starch and protein content as well as bran addition and
bran particle size.
General structural transformations
Cooking: Water absorption and structure transformations
The cooking process is characterised at the macroscale by steady water absorption as
shown by weight increase measurement. Water absorption was measured both for industrial-scale and lab-scale spaghetti (data of paper I-III). When cooking time was normalised for the
dry spaghetti diameter, water absorption was rather similar for all samples (Figure 6). Compar-
ing the data within a study, differences were even smaller. Water absorption values were rec-
orded at different time points for the various studies, but generally both during early cooking and overcooking stage which started roughly at 4 min×mm-2 (based on determination of opti-
mal cooking times). Lab-scale spaghetti samples varying in protein and starch content (paper
II) showed the highest water absorption values at all time points. The higher values might be
due to producing reconstituted spaghetti samples by mixing semolina with pure starch or glu-ten powder. Others have shown that reconstituting starch and gluten to the same amounts as in
semolina still alters the pasta structure and results in higher water absorption (Delcour et al.,
2000b).
Figure 6 (A) Relative water absorption over cooking time. Time normalized with initial diameter2.
Vertical line roughly indicates begin of overcooking stage. Symbols indicate samples from same study. Error bars show 95% confidence interval. Curve serves only as a visual guide. (B) Corresponding time series of T1-weighted I0 (a relative measure for water content) and T2 (showing water-macromolecule interactions) maps showing water ingress in lab-scale spaghetti D100.

Cooking: Water absorption and structure transformations
22
In accordance with these findings, D100 – being produced with unreconstituted durum wheat flour – showed the lowest absorption values within the series of paper II.
Except for the spaghetti with the strongly decreased protein content S40D60 showing
higher absorption values at all time points, water absorption varied first at the overcooking
stage. The existence of a “master curve” implies that the water absorption process during the early cooking stage is foremost governed by the geometry (form and diameter) of the dry pasta
product and only to a lesser extent by the raw material. These results are in line with previous
research although not all studies linked their results to the diameter (Cafieri et al., 2010; Del
Nobile et al., 2005, 2003b; Ogawa et al., 2011; Sekiyama et al., 2012). However, others report-ed that water uptake differed depending on raw materials (Martinez et al., 2007; Sozer and
Dalgic, 2007). Comparing the presented data is complicated as the dry diameter is often not
mentioned and only one water absorption value is measured at optimal cooking time. Never-
theless, Rakhesh et al. (2015) showed in controlled studies that soluble fibres such as inulin increase the amount of absorbed water and decrease OCT. The water absorption might also be
influenced by process parameters such as drying temperature. Conflicting results have been
reported on whether or not water absorption differs with increasing drying temperature (Aimoto et al., 2013; Ogawa and Adachi, 2014).
In a final test, the density of dry spaghetti was estimated (density defined as weight divid-
ed by volume based on estimated dry diameter). D100 had a density of about 1.4 g×cm-3, while
S40D60, G20D80 and G40D60 had a density of about 1.3 g×cm-3. For comparison, the density for the DS-series was estimated to 1.5 g×cm-3. Thus, density might be another factor for water
absorption as lower density of dry spaghetti correlated with higher water absorption values.
To summarise: The raw materials studied in this work did not affect water absorption, but
raw materials with highly different hydration properties might do. The water absorption during cooking is accompanied and likely driven by a steady starch
gelatinisation. In fact, Ogawa and Adachi (2013) argue that starch gelatinisation regulates the
water ingress into the ungelatinised regions of pasta during cooking. This hypothesis was sup-ported by real-time MRI maps showing that water progressed over time steadily and radially
from the surface to the core. A complete time series of the MRI measurement is shown in Fig-
ure 6B, and images for selected time points in Figure 7.
Figure 7 T2 maps (MRI) and micrographs (PLM) illustrating the progressing water ingress and
subsequent starch gelatinisation during cooking and warm-holding. Chart illustrates decrease of ungelatinised, inner core over cooking time as a measure for the water ingress rate. Numbers within the images indicate cooking and warm-holding time, respectively. Images and chart for cooking are from paper II, images for warm-holding from paper I and IV.
Results and Discussions
23
An increasing moisture content (as shown by higher I0 values) was accompanied by in-creasing water-macromolecule interactions (represented by higher T2 values). Corresponding
PLM images showed that the area of low T2 values in the spaghetti core correlated with the
area of ungelatinised starch (Figure 7). The water ingress as shown by MRI was reflected by
progressing starch gelatinisation. A quantitative estimation of the inner, ungelatinised core (MRI and PLM data agreed well) revealed that the core decreased linearly at an early cooking
stage (diagram in Figure 7). At a later stage, radius estimation became more uncertain, but still
indicated an accelerated decrease of the ungelatinised core. The water ingress was independent
on protein and starch content in the sample studied and in line with findings by Del Nobile et al. (2003b) that stated a sharp moisture increase at the gelatinisation front..
Microstructure of cooked spaghetti
The correlation between the microstructure as shown by polarized (PLM) and bright-field light microscopy (BFLM) and MRI parameters was analysed in more detail in cooked spaghet-
ti (Figure 8). A micrograph of stained, dry spaghetti is shown for comparison.
Dry spaghetti was characterised by a homogeneous microstructure composed of starch
granules embedded in a gluten network. Cooking increased spaghetti in size and created a con-tinuous gradient in the microstructure which can be divided into three regions (core, intermedi-
ate and surface region, Heneen and Brismar, 2003).
The microstructure in the core remained unchanged compared to the dry state. Starch
granules were not swollen or only very limited (BFLM) and did not gelatinise (PLM). The lower I0 values in the core region (accompanied by very low T2* values) revealed that the wa-
ter front had not reached the core thus preventing enough moisture for starch gelatinisation.
Figure 8 Cross-sections and representative parts of these cross-sections from core to surface of
dry and cooked spaghetti (exemplary shown DS). All light micrographs and MRI maps were derived from separate, individually cooked spaghetti strands. T2* and I0 maps are compressed to half the size in height to show more voxels. In BFLM, protein appeared green; starch blue/violet; fibre particles were not stained.
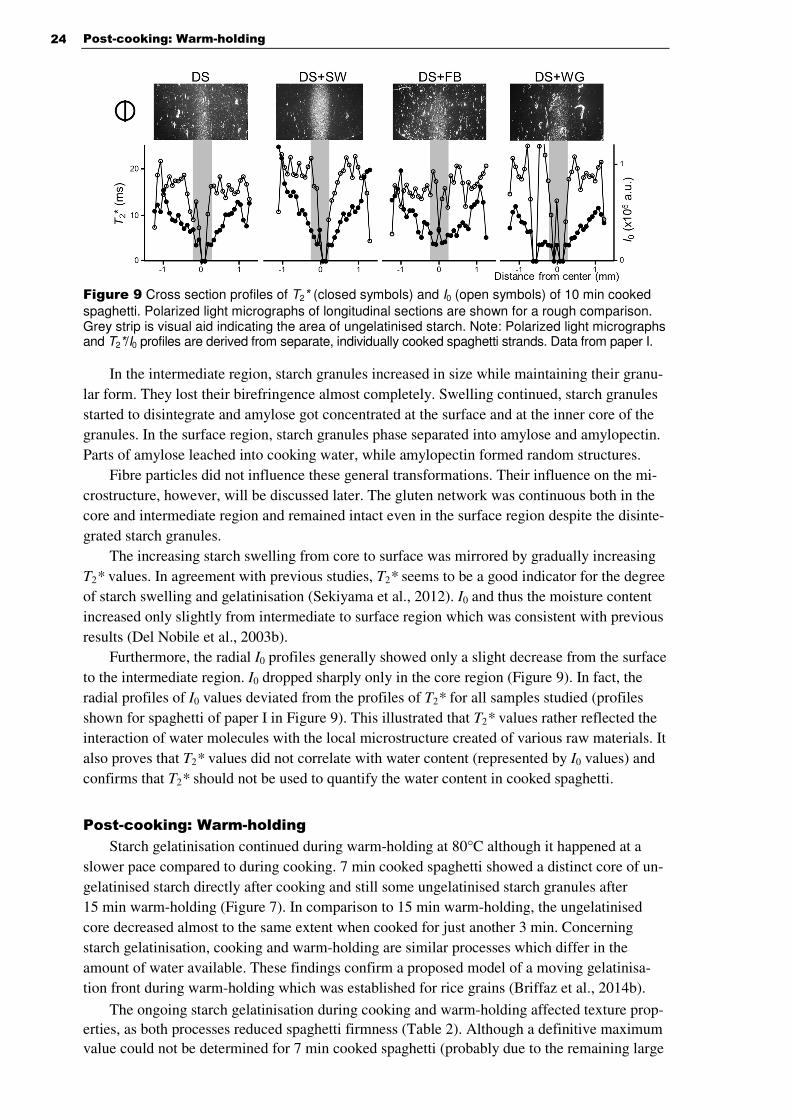
Post-cooking: Warm-holding
24
Figure 9 Cross section profiles of T2* (closed symbols) and I0 (open symbols) of 10 min cooked
spaghetti. Polarized light micrographs of longitudinal sections are shown for a rough comparison. Grey strip is visual aid indicating the area of ungelatinised starch. Note: Polarized light micrographs and T2*/I0 profiles are derived from separate, individually cooked spaghetti strands. Data from paper I.
In the intermediate region, starch granules increased in size while maintaining their granu-
lar form. They lost their birefringence almost completely. Swelling continued, starch granules
started to disintegrate and amylose got concentrated at the surface and at the inner core of the granules. In the surface region, starch granules phase separated into amylose and amylopectin.
Parts of amylose leached into cooking water, while amylopectin formed random structures.
Fibre particles did not influence these general transformations. Their influence on the mi-
crostructure, however, will be discussed later. The gluten network was continuous both in the core and intermediate region and remained intact even in the surface region despite the disinte-
grated starch granules.
The increasing starch swelling from core to surface was mirrored by gradually increasing
T2* values. In agreement with previous studies, T2* seems to be a good indicator for the degree of starch swelling and gelatinisation (Sekiyama et al., 2012). I0 and thus the moisture content
increased only slightly from intermediate to surface region which was consistent with previous
results (Del Nobile et al., 2003b). Furthermore, the radial I0 profiles generally showed only a slight decrease from the surface
to the intermediate region. I0 dropped sharply only in the core region (Figure 9). In fact, the
radial profiles of I0 values deviated from the profiles of T2* for all samples studied (profiles
shown for spaghetti of paper I in Figure 9). This illustrated that T2* values rather reflected the interaction of water molecules with the local microstructure created of various raw materials. It
also proves that T2* values did not correlate with water content (represented by I0 values) and
confirms that T2* should not be used to quantify the water content in cooked spaghetti.
Post-cooking: Warm-holding
Starch gelatinisation continued during warm-holding at 80°C although it happened at a
slower pace compared to during cooking. 7 min cooked spaghetti showed a distinct core of un-
gelatinised starch directly after cooking and still some ungelatinised starch granules after 15 min warm-holding (Figure 7). In comparison to 15 min warm-holding, the ungelatinised
core decreased almost to the same extent when cooked for just another 3 min. Concerning
starch gelatinisation, cooking and warm-holding are similar processes which differ in the
amount of water available. These findings confirm a proposed model of a moving gelatinisa-tion front during warm-holding which was established for rice grains (Briffaz et al., 2014b).
The ongoing starch gelatinisation during cooking and warm-holding affected texture prop-erties, as both processes reduced spaghetti firmness (Table 2). Although a definitive maximum value could not be determined for 7 min cooked spaghetti (probably due to the remaining large

Results and Discussions
25
Figure 10 Force-distance curves to determine firmness (defined as peak force) of warm-held
spaghetti (examplary shown for DS3). Times indicate warm-holding durations. Asterisk (*) marks the imcomplete, randomly formed force-top of 7 min cooked spaghetti measured directly after cooking.
ungelatinised core), the initial slope of the force-distance-curve was higher for spaghetti cooked for 7 min compared to 10 min (Figure 10). Independent of cooking time and product, firmness was lower for warm-held spaghetti, but did not differ between 15 min and 90 min holding time (Table 2). Spaghetti at the bottom of the pan had the lowest firmness as it ab-sorbed the surplus water accumulating at the pan bottom (as evidenced by a spaghetti diameter increase), which prolonged the starch gelatinisation resulting in softer spaghetti.
As a side note: The acquired data allowed comparing firmness of 10 min cooked spaghetti that was cooled directly in ice water and spaghetti that was drained for 1 min before cooling (due to the handling of about 2 kg cooked spaghetti). Firmness values decreased with at least 10% within the 1 min (Table 2). The decrease was partly caused by a slightly increased cook-ing time as it was impossible to empty the cooking pot in a second. It still illustrates that warm-holding of pasta affected texture even in the short term. Operation practices in food services might therefore be more important than the choice of raw material.
Warm-held spaghetti was not only softer, but also stickier than spaghetti directly after cooking (Table 3). While the products differed in stickiness directly after cooking, they did not differ during warm-holding. Again, this could be attributed to the changing water distribution. Stickiness increases as the spaghetti surface gets drier (Dexter et al., 1983a; Guan and Seib, 1994; Horigane et al., 2006). At ambient temperatures stickiness increased with time for at about 60 min (Guan and Seib, 1994), but as water redistributed much faster during warm-holding a plateau in stickiness was probably reached within the first 15min.
Table 2 Firmness at various warm-holding stages (paper IV, measured in N)1
7 min cooked 10 min cooked
Time DS+SW DS1 DS2 DS3 DS+SW DS3
0 min2 * * * * 12.1±0.5 13.2±0.5
1 min2 * * * * 11.1±0.5cA 11.3±0.2cA
15 min 8.5±0.7bB 8.5±0.5bB 9.0±0.8bAB 9.4±0.5bA 6.1±0.1bC 6.9±0.3bC
90 min 8.3±0.6bBC 8.6±0.5bB 8.8±0.7bB 9.7±0.5bA 6.5±0.7bD 7.5±0.3bCD
90 min bottom
4.7±0.2aCD 4.8±0.5aBC 5.5±0.5aA 5.4±0.5aAB 3.9±0.1aD 4.8±0.4aBC
1 Values followed by same small letter (in same column) or capital letter (in same row) are not significantly different (P < 0.05); Asterisk (*) marks non-determinable values 2 0 min; Spaghetti cooled in water directly after end of cooking; 1 min: Spaghetti drained for 1 min then cooled in water

Post-cooking: Storing at ambient temperatures
26
Table 3 Stickiness at various warm-holding stages
(paper IV, measured in N)1
7 min cooked
Time DS+SW DS1 DS2 DS3
1 min 2.6±0.3aA 2.2±0.3aB 1.9±0.1aC 1.6±0.1aC
15 min 4.8±0.8bA 4.4±0.2bA 4.3±0.5bA 4.2±0.4bA
90 min 4.2±0.1bB 4.5±0.4bB 5.1±0.5cA 4.3±0.1bB
90 min bottom
2.4±0.2aA 2.5±0.2aA 2.5±0.1aA 1.6±0.2aB
1 Values followed by same small letter (in same column) or capital letter (in same row) are not significantly different (P < 0.05);
The softer texture of the spaghetti at the pan bottom and the wetted surface of the spaghetti (due to the surplus water) could explain the lower stickiness values compared to spaghetti
warm-held in the centre of the pan. The two factors have previously been linked to reduced
stickiness (Dexter et al., 1983a; Guan and Seib, 1994). In summary, access to internal or external moisture regulates the ongoing starch gelatinisa-
tion during warm-holding. Ongoing starch gelatinisation and accordingly the decrease of the
hard, ungelatinised core is the main factor for the firmness decrease. Optimisation of moisture
access can maximise the period of peak texture.
Post-cooking: Storing at ambient temperatures
The results for warm-holding showed that, directly after cooking, moisture distribution
was not in equilibrium and moisture redistributed during warm-holding. Moisture redistributes at ambient temperatures as well, but only in the already gelatinised region of the pasta
(Horigane et al., 2006). We were able to verify the moisture homogenisation in bran-rich spa-
ghetti by comparing I0 histograms of data acquired over short and long measurement times.
The I0 distributions as a measure for the water distribution were narrower (decreasing both high and low intensities of I0 with an unchanged peak maximum) when measured over 92 min
(Figure 14E) compared to 16 min (Figure 14D). Also at ambient temperature, moisture ho-
mogenisation reduces firmness during storage (Gonzalez et al., 2000). Compared to warm-
holding, however, the relative decline was less (comparing results in Table 2 with results by Gonzalez et al., 2000).

Results and Discussions
27
Effects of raw materials on texture, microstructure, and water distribution in pasta
The most complete multi-scale analysis has been carried out on four industrial-scale spa-
ghetti samples (2011, paper I). The following analyses have been carried out: Macroscopic wa-
ter absorption was recorded during cooking and overcooking (Figure 6). Texture parameters
(breaking strength and firmness) were determined of dry and cooked spaghetti, respectively. Furthermore, the microstructure was analysed of dry (Figure 11) and cooked spaghetti (Figure
12A-C). The results were linked to MRI. Segments of the acquired 3D MRI data sets are pre-
sented as 2D T2* maps visualising the water-macromolecule interactions in axial, longitudinal
and tangential direction (Figure 12D). Finally, MRI data is also presented in histograms show-ing the distribution of T2* and I0 values of the whole measured 3D volume (Figure 14B). Each
figure will be described in more detail in the sections to follow.
The industrial-scale samples were produced with the same manufacturing process. The samples showed some common patterns such as a homogeneous microstructure in uncooked
state. During cooking, this resulted in a similar water absorption rates and after cooking in a
similar change in microstructure and water distribution from core to surface region. Still, raw
materials affected the microstructure and water distribution on the micro-scale and these varia-tions were sufficient to affect firmness of the cooked spaghetti.
The four industrial-scale spaghetti were based on the same durum wheat flour, but varied
due to further ingredients in composition (starch and protein content, fibre content, type of fi-
bre). To study those three parameter in more detail, lab-scale spaghetti were produced with varied starch and protein content, bran content as well as bran particle size. First, the effects of
starch and protein content and thereafter the effects of bran addition and bran particle size on
pasta properties will be discussed.
Starch and protein content
Texture properties Out of the four analysed industrial-scale spaghetti, DS and DS+SW
were made of different flour blends that varied mainly in starch and protein content. DS was
produced solely with durum wheat flour while DS+SW was produced with a blend of durum and soft wheat flour. Soft wheat pasta has been associated with inferior texture properties, be-
ing less firm and more sticky than durum wheat pasta (Dexter et al., 1983b, 1981). This has
been attributed to an often lower protein content and weaker gluten properties in soft wheat (Cubadda et al., 2007; Dexter et al., 1981; Marchylo et al., 2004).
In fact, the soft wheat supplemented 2011 DS+SW sample had a lower protein content
compared to DS. Subsequently and in agreement with previous studies, the 2011 DS+SW
showed, compared to 2011 DS, both a lower breaking strength in dry spaghetti as well as a lower firmness in cooked spaghetti (Table 4). However, the 2014 samples DS+SW and DS did
not differ in firmness. This could be explained by DS+SW having higher protein and gluten
content as well as higher falling number, indicating improved gluten and starch properties.
Firmness and stickiness were also determined during warm-holding. The 2014 DS+SW spaghetti showed firmness values similar to DS1 at all warm-holding times, whereas the two
other durum wheat spaghetti DS2 and DS3 had higher firmness values throughout warm-
holding (Table 2). Thus, spaghetti partly made of soft wheat flour did not necessarily have to
show inferior cooking quality compared to durum wheat spaghetti. Still, while firmness was comparable, stickiness was higher directly after cooking for DS+SW than for any of the durum
wheat spaghetti DS1-3 (Table 3).

Effects of: Starch and protein content
28
Table 4 Breaking strength of dry and firmness of cooked, industrial-scale spaghetti (measured in
N). Paper I: all spaghetti were made of the same batch of DS; paper IV: all spaghetti except DS+SW were made of the same batch of DS. Batches of DS differed between paper I and IV, years indicate time of spaghetti production
Paper I - 2011 Paper IV - 2014
Breaking strength
Firmness Firmness
DS 5.3±0.3 13.0±0.7 11.8±0.2
DS+FB 4.9±0.2 13.2±0.3 10.2±0.4
DS+WG 4.1±0.4 11.3±0.2 10.0±0.2
DS+SW 4.5±0.3 10.7±0.4 12.1±0.5
Firmness is generally controlled by cohesiveness of the protein network, stickiness by the
composition of the surface region (Cunin et al., 1997). An analysis of microstructure and water
distribution can therefore give further explanations for the observed texture differences.
Microstructure Micrographs of dry, uncooked spaghetti are shown in Figure 11. The micro-
structure in all samples was built up of large, oval type-A and small, round type-B starch gran-
ules being embedded in a continuous gluten network. Type-A starch granules appeared to be
larger in DS+SW than in DS which is plausible as starch granules are on average larger in soft wheat starch compared to durum wheat starch (Pérez and Bertoft, 2010; Soh et al., 2006).
DS+SW had a lower protein content than DS, which was also visible as a lower share of the
protein phase within the images. The denser gluten network of DS thus might explain the high-
er breaking strength of DS compared to DS+SW (Table 4). After cooking, DS and DS+SW showed an overall similar, continuous change in micro-
structure from core to surface (Figure 12A+B). In both samples starch granules were embed-
ded in continuous gluten network and did not gelatinise in the core. Furthermore, starch granules swelled first in the intermediate region and got disintegrated in the surface region.
While the area of ungelatinised starch granules was the same, the depth of the surface region of
strongly disintegrated starch granules seemed to be larger in DS+SW (Figure 12C). The pro-
tein network seemed to be continuous even in the surface region both for DS and DS+SW, but retained its structure slightly better in DS. Micrographs at higher magnification showed that in
DS+SW starch granules were particularly swollen to a larger extent in the intermediate region
(Figure 3A in paper I). This might be a result of the lower protein content of DS+SW. Alterna-
tively, it just appeared as stronger starch swelling as the soft-wheat rich DS+SW contained more and on average larger starch granules already in the uncooked state.
Figure 11 Light micrographs of dried, uncooked, industrial-scale spaghetti.

Results and Discussions
29
Whether or not it only appeared as stronger swelling, both cases could explain the lower firmness. Heneen and Brismar (2003) reported that starch granules in soft wheat pasta showed
stronger swelling and occupied larger areas in cooked spaghetti. In conjunction with an ob-
served fusion of starch granules in the outer region, the protein network was reported to be less
continuous which in turn is often associated with lower firmness (Sissons, 2008). In contrary, a higher share of small granules (achieved through added type-B granules) resulted in higher
firmness (Soh et al., 2006).
The lab-scale spaghetti varying in starch and protein content could support the above men-
tioned results. Common to all cooked samples was again a continuous change in microstruc-ture that progressed with increasing cooking time (Figure 13). At 7.6 min, the starch swelling
in the outermost region was rather similar between the samples, but starch swelling decreased
towards the core to different extents. Granules were swollen throughout the whole cross-
section in the starch-rich S40D60, while the other samples showed a more heterogeneous swelling pattern.
Figure 12 Microstructure of 10 min cooked industrial-scale spaghetti by BFLM (A), PLM (B)
and T2* parameter maps (D). Magnifications show surface region (C). Data from paper I.

Effects of: Starch and protein content
30
Figure 13 Light micrographs of representative parts of spaghetti cross-sections cooked for 7.6min
and 13.1 min. Samples are listed top-down with increasing protein content. Data from paper II.
At 13.1 min starch gelatinisation and starch swelling progressed in all samples, but again
to different extents. Especially S40D60 showed strongly disintegrated starch granules and are-
as of amylose enrichments close to the surface. The sample D100 lay in between S40D60 and the gluten-rich samples G20D80 and G40D60, where granule disintegration was less visible
and leached amylose remained very close to individual starch granules. The latter samples fur-
thermore showed a continuous protein matrix in the surface region. Hence, the starch and pro-tein content clearly affected the microstructure. A higher protein content created a denser
protein network that limited starch swelling.
MRI data Common to all spaghetti was a radial gradient in T2* values with low T2* in the
core region (dark areas in axial and longitudinal view, Figure 12D). T2* increased gradually from the core to the surface and the highest T2* values were especially visible in tangential T2*
maps. As previously discussed, T2* maps agree well with the observed microstructure changes
and T2* can be seen as an indicator for the degree of starch gelatinisation and swelling.
Both DS and DS+SW showed homogeneous tangential T2* maps, but DS+SW exhibited higher T2* values than DS which supports the stronger starch swelling in DS+SW observed by
light microscopy.
Lab-scale spaghetti varying in starch and protein content were analysed by MRI as well.
These samples can be compared more easily in histograms presenting the distribution of the T2* values of each voxel in the T2* maps (Figure 14A; histogram is based on cooking time of 7.6 min;
time series of histograms can be found in Figure 5 in paper II). The T2 distributions of the lab-scale
spaghetti can further be compared to the data of the industrial-scale spaghetti (Figure 14B). It should be noted that the temperature during MRI measurement was at 99°C for lab-scale
spaghetti and at 25°C for industrial-scale spaghetti. The higher temperature shifted the T2 distri-
bution towards longer T2 values. Relative differences of T2 distributions were not affected, thus a
comparison of the lab-scale with the industrial-scale spaghetti DS+SW and DS is still possible. The low protein, starch-rich S40D60 showed the longest T2 values and the broadest distri-
bution (Figure 14A). Increasing protein content shortened T2 and narrowed the distribution.
Such a behaviour has been reported previously (Kojima et al., 2004). Also DS+SW – having a
lower protein content than DS – exhibited the highest T2* values and a broader distribution than DS (Figure 14B).

Results and Discussions
31
Figure 14 Histograms showing the distribution of T2* and I0 values of spaghetti cooked close to
respective OCT. Duration and temperature of the MRI measurement are indicated together with the image of the acquired data. In (A) I0 values were T1-weighted, disallowing a quantitative compari-son between samples and therefore no I0 histogram is presented in (A). Data from paper I-III.
Furthermore, T2* values were on average shifted towards higher values in DS+SW. Based
on the previously established assumption that T2* values correlate with the degree of starch gelatinisation, the T2* histograms serve as further evidence that lower protein content in pasta
results in stronger starch gelatinisation.
Distributions of I0 as a measure of the local water content were generally less affected by
raw material variations, which was plausible as the absolute amount of absorbed water did not differ between the respective samples (as evidenced by water absorption measurements, Figure
6). Still, DS+SW showed a broader distribution compared to DS (Figure 14B). Higher I0 values
and thus increased local water contents were found at the surface region. This might partly ex-
plain the higher stickiness of DS+SW in comparison to DS. Del Nobile et al. (2005) attributed higher stickiness of low protein spaghetti to higher water concentration at the spaghetti surface.
Effects of: Bran addition and bran particle size
32
Summary Spaghetti samples that were processed equally absorbed the same amount of water during early cooking stage – independent of starch and protein content. Also the water
transport towards the core and initial starch gelatinisation were not affected. Still, higher pro-
tein contents limited starch swelling within the gelatinised region. Lower protein content re-
sulted accordingly in stronger starch swelling that induced lower firmness and higher stickiness. The texture properties of cooked spaghetti are therefore governed by the structural
transformations in the already gelatinised region.
Bran addition and bran particle size
Texture properties DS+FB and DS+WG contained twice as much dietary fibre as the du-rum wheat flour based DS. The fibre fraction of DS+FB consisted of particles of elongated
shape that were on average smaller than 100 µm, while whole-wheat spaghetti DS+WG in-
cluded bran particles with a flat shape several hundred µm in diameter. Bran-rich pasta has often been reported to have an inferior cooking quality compared to
semolina-based pasta (Sissons and Fellows, 2014). A softer texture has been explained with a
disrupting effect of the bran particles on the gluten matrix (Manthey and Schorno, 2002). In
line with this observation is a lower breaking strength of dried, uncooked whole-wheat spa-ghetti DS+WG compared to DS (Table 4). Accordingly, the cooked DS+WG showed lower
firmness than DS both for the 2011 and 2014 samples. The fibre-rich DS+FB behaved differ-
ently: The breaking strength of DS+FB was similar to DS and firmness was reduced in the
2014 sample, but not in 2011. Similar results have been shown for dried noodles enriched with wheat bran or wheat fibre (Shiau et al., 2012). Thus, the addition of fibre particles does not
necessarily reduce firmness, but might depend on particle size and shape.
To test this hypothesis, spaghetti were produced at lab-scale that included increasing amounts of whole-wheat flour of 0%, 50% and 100% (WW0, WW50 and WW100). Further-
more, spaghetti were produced including bran particles of varying sizes. Based on the particle
size distributions, the spaghetti samples could be grouped as having larger particles (median
particle size 440 and 370 µm) and having smaller particles (median particle size 160 and 90 µm). Before discussing the results of texture analysis, it should be noted that studying the effect
of processing was not a focus of this thesis, but it was obvious that processing had an influence
on texture properties. WW0 and WW50 had similar flour compositions to DS and DS+WG,
but were produced on lab- instead of industrial-scale. An extra test showed reduced breaking strengths of about 2 N for the WW-samples compared to 5 and 4 N of DS and DS+WG. Simi-
larly, firmness was greatly reduced (results not shown). The lab-scale extrusion created a less
dense structure and the lab-scale drying did likely stabilise the protein network to a lesser ex-tent compared to an industrial-scale dryer. Hence, the weakened gluten-starch matrix might
hide possible differences caused by bran particle size.
Still, texture analysis revealed that smaller bran particles were associated with a higher break-
ing strength in dried spaghetti (Table 5). Firmness was also slightly higher for smaller bran particles while stickiness was not affected. Shiau et al. (2012) observed higher breaking
strength and firmness for fine bran in noodles compared to coarse bran and attributed it to
smaller particles having less adverse effect on gluten network formation. Although studying
only a small particle size range, Niu et al. (2014) found increasing hardness with decreasing bran particle size in cooked noodles.

Results and Discussions
33
Table 5 Breaking strength of dry, firmness and stickiness of
8 min cooked bran-rich spaghetti varying in bran particle size (paper III, measured in N)
Breaking strength
Firmness Stickiness
S440 1.5±0.1 6.3±0.4 0.61±0.04
S370 1.8±0.2 6.6±0.2 0.63±0.05
S160 2.2±0.2 7.0±0.3 0.63±0.06
S90 2.2±0.2 6.9±0.3 0.60±0.02
A subsequent sensory analysis found almost no effect of bran particle size on elasticity, firmness and stickiness (Table 6). The slight differences in firmness as determined by texture
analysis were not large enough to be detected by the panel. Others reported similarly higher
firmness with smaller bran particle sizes during texture analysis while sensory analysis did not
show significant differences (Chen et al., 2011). Sensorial observed firmness might not be affected by bran particle size, but overall liking
was. The samples S90 and S160 showed higher overall liking, which correlated with lower
values for observed surface roughness as well as whole-wheat aroma. Again, these findings agreed with Chen et al. (2011) reporting that smaller particles produced a smoother surface and
improved appearance and taste in noodles.
Table 6 Sensory properties of 10 min cooked bran-rich spaghetti varying in bran particle size (pa-
per III); sensory attributes determined as difference from control (scale -5 to +5, control WW50: 0);
overall liking without reference (0 to 10)1
Sample Elasticity Firmness Stickiness Surface Roughness
Whole-wheat aroma
Overall liking
S440 -1.5a -1.0a -0.3a 1.3a 1.1a 3.2a
S370 -1.1ab -0.7a -0.7a 0.8a 0.8ab 4.6ab
S160 -0.1b -0.1a -0.9a -1.0b -0.6c 5.4b
S90 -1.6a -1.0a -0.5a -0.8b -0.3bc 5.7b 1
Values followed by same letter in a column are not statistically significant different
Microstructure Generally, bran and fibre particles are visible both in bright-field and polar-
ised light microscopy. The higher dietary fibre content of DS+FB and DS+WG compared to DS and DS+SW was reflected by more visible particles in dried, uncooked spaghetti (Figure
11) and was also observed in cooked spaghetti (Figure 12 A+B). Wheat flour contains minor
amounts of bran as well as cell wall material from the endosperm and thus some fibre particles
were visible in DS and DS+SW as well. The correlation between the amount of fibre and amount of visible fibre particles was easily observed in the micrographs of the lab-scale spa-
ghetti of varying whole-wheat content (Figure 15A).
Figure 15 Polarised micrographs (A) and T2* maps (B) of cooked spaghetti varying in whole-
wheat content (0, 50 and 100% whole-wheat flour).

Effects of: Bran addition and bran particle size
34
Generally, fibre particles got aligned with the extrusion direction due to high shear forces during extrusion. The alignment can be seen in the longitudinal sections as the fibre particles
were mostly aligned parallel to each other (Figure 12 A+B). Furthermore, the flat-shaped bran
particles appeared in cross sections as bent and folded structures. As the folding happens dur-
ing extrusion, folded bran particles were visible already in the uncooked spaghetti (large parti-cle to the top right in DS+WG image in Figure 11).
Manthey and Schorno (2002) based their argument of the disrupting effect of bran on pasta
matrix on the observation of a gap between a bran particle and the surrounding gluten-starch ma-
trix. In the micrographs of dried, uncooked spaghetti no such gaps were observed, independent whether fibre particles were small or large. The particles were well embedded in the protein-
starch matrix (Figure 11). In lab-scale spaghetti, however, some large bran particles detached
from the surrounding matrix during cryostat sectioning, while small particles did not. If gaps occur
between bran and the protein-starch matrix might therefore depend on the production process. Maybe “disruption” is a too strong word, but fibre particles affected the gluten network as
fibre particles occupied potential spaces for protein in the gluten network (Pavlovich-Abril et
al., 2012). This effect is also referred to as diluting the gluten network (Shiau et al., 2012). Larger bran particles were distinctly distributed and created a heterogeneous microstruc-
ture (Figure 11), which might explain the lower breaking strength. DS+FB showed an un-
changed breaking strength compared to DS. The small particles of DS+FB were
homogeneously distributed throughout the entire pasta matrix. The size of the fibre particles in the cross section was in the same magnitude as large starch granules, and presumably the glu-
ten network was diluted to lesser extent.
In cooked spaghetti, the overall radial change in microstructure was not affected by the
presence of fibre particles. The area of ungelatinised starch was the same for DS+WG, DS+FB and DS (Figure 12B), and also starch granules swelled and disintegrated to the same extent in
the surface region (Figure 12C). Still, due to the alignment of the fibre particles, the particles
were often orientated perpendicular to the direction of the water ingress. Especially large bran particles exhibited a barrier effect as the degree of starch swelling differed in front and behind
the bran particle. This behaviour will be described in detail for the lab-scale spaghetti varying
in bran particle size.
The lab-scale spaghetti varying in bran-particle size (smaller bran particles S90 and S160, larger bran particles S370 and S440) were analysed in their cooked state (Figure 16). Polarized
light micrographs confirmed the correlation between smaller particles and more homogeneous
distribution of bran particles throughout the pasta matrix (Figure 16A). Again, mainly large
bran particles appeared folded and bent, while smaller particles formed rather straight strings. Similar to the industrial-scale whole-wheat spaghetti, bran particle size did not affect the
commonly observed change in microstructure from core to surface (Figure 16B). Bran particles
of all sizes were orientated along the extrusion direction (see longitudinal and tangential sections). Some of the large bran particles were further orientated perpendicular to the radius and were
especially visible in the tangential view where the particles formed large surfaces (Figure 16B).
To visualise the orientation of bran particles in detail as well as the orientation effect on local
degree of starch swelling, selected magnifications of large bran particles are shown in all three directions (Figure 17). Three bran particles are shown in cross-section (Figure 17a-c). Common
to all shown bran particles was that starch granules close to the bran particle and facing towards
the spaghetti surface were swollen to a much larger extent than granules facing towards the core
(arrows are shown for comparison). The bran particles hindered the water transport towards the core and therefore limited the degree of starch swelling.

Results and Discussions
35
Figure 16 PLM (A), BFLM (B) and T2* maps (C) of 8 min cooked spaghetti of varying bran particle
size. Tangential micrographs (B) and T2* maps (C) 200-300 µm away from the spaghetti surface. Asterisks (*) in (B) show hole artefacts from sample preparation and dark areas are folded sections. Images in (A, B, C) were derived from individually prepared spaghetti strands. Data from paper III.

Effects of: Bran addition and bran particle size
36
For comparison: The continuously increasing starch swelling towards the core was ob-served atop and beneath the bran particles in Figure 17B and C, whereas at the level of the par-
ticles the degree of starch swelling changed more abruptly. The local barrier effect on starch
swelling was mostly observed near the spaghetti surface, but was also visible further towards the
core (see magnifications in Figure 17 A). Another example for the barrier effect of bran is shown in a longitudinal section (Figure
17I). Median bran particle size of S440 was 440 µm, but some particles were much longer as
illustrated in Figure 17K. The bran particle in Figure 17J is shown to illustrate that not all particles
were orientated perpendicular towards the radius of the spaghetti. This particle was instead orien-tated parallel to the radius and affected the water transport only to a very limited degree.
Finally, perpendicular orientated bran particles were easily observed in tangential sections
(Figure 17E-H). Also in tangential sections, the barrier effect was evident. The slice shown in
Figure 17H1 was located about 30 µm further towards the spaghetti core than slice shown in H2. The beginnings of the large bran particle in H1 can already be seen in H2. The starch
granules atop the bran particle were swollen to a larger extent than starch granules alongside
the particle (see arrows for comparison). The particles were often even larger than visualised by the images as a 5 µm thick slice
cannot reproduce the true 3D structure of a particle. The bran particles in the centre and in the
lower left corner of Figure 17G were in fact belonging to the very same particle, which formed
a surface of at least 0.5mm×1mm. The planar shape of the particles as well as the thin micros-copy slices allowed to show single bran layers such as likely tube cells (Figure 17D), cells be-
longing to the pericarp (Figure 17F) as well as aleurone layer combined with nucellar layer (Figure
17G). The layers were attributed according to Slavin et al. (2000) and Surget and Barron (2005).
Previous research did not focus on the orientation of bran particles, but at least one study also showed aleurone cells (similar to Figure 17G) at the pasta surface (Manthey and Schorno, 2002).
Figure 17 Bran particles in cooked spaghetti in cross section (a-c), tangential (e-h) and longitudi-
nal sections (i-k). a2 and a3 show magnified areas of a1. Slices in h1 and h2 are about 30 µm apart. Arrows indicate different degree of starch swelling. Data from paper I and III.

Results and Discussions
37
MRI data All samples, both industrial-scale and lab-scale spaghetti, showed T2* maps where T2* values increased from the core to the surface (Figure 12D, Figure 15B, Figure 16C).
This reflects that bran addition did not affect the overall changes in microstructure in cooked
spaghetti.
The heterogeneous microstructure of the whole-wheat spaghetti DS+WG, containing large bran particles, was reflected in the T2* maps (Figure 12D). DS+WG showed overall lowered
T2* values in all directions compared to DS and also DS+FB, but the heterogeneity became
most evident in the tangential view. Large areas of low T2* values were surround by areas of
higher T2* values. As these dark areas were also elongated and orientated along the extrusion direction, we assumed that these areas represented the bran particles. The reduced T2* could be
due to faster exchange of water protons with exchangeable fibre protons or due to the less
swelled starch granules/low water content close to the fibre particles or a mix of both reasons.
Interestingly, T2* maps of DS and DS+FB were similar, although DS+FB contained twice as much fibre as DS. This could indicate that the small fibre particles of DS+FB interacted less
with water protons compared to starch and gluten and they did not affect starch swelling local-
ly. Alternatively, small fibre particles are distributed so homogeneously throughout the pasta matrix that their effect on T2* could not be captured with the voxel size of 78µm3 of the MRI
measurement. The T2* value in each voxel is an average of all components such as starch, glu-
ten and fibre within the voxel volume. In the case of DS+FB, there might be too few fibre par-
ticles in each voxel volume to affect T2*. The overall reduced T2* values can be explained by the addition of bran particles. T2* val-
ues shifted towards shorter values over the whole radial profile in the T2* maps shown for in-
creasing whole-wheat content (Figure 15B).
Heterogeneity in T2* maps can be connected to bran particle size. Similar to DS+WG, the large bran particles containing S440 and S370 showed more heterogeneous T2* maps than
S160 and S90. Again, the largest bran particle size resulted in the most heterogeneous tangen-
tial T2* map. Industrial-scale spaghetti and lab-scale spaghetti also showed same trends when analysing
the distributions of T2* and I0 (Figure 14B-D). Increasing whole-wheat content (WW0, WW50,
WW100) shifted the T2* distribution towards shorter T2* values and decreased especially the
amount of high T2* values (Figure 14C). The bran-rich DS+WG similarly showed a T2* distri-bution shifted towards lower T2* values compared to DS and DS+FB, which exhibited a simi-
lar pattern of T2* values (Figure 14B).
Comparable lowering of T2* values has been reported for increasing whole-wheat contents
in dough systems and has been attributed to a moisture migration from the gluten network to the bran particles (Bock et al., 2013; Li et al., 2014). Accordingly, Chen et al. (2011) speculat-
ed that wheat bran absorbs water during the cooking process of noodles and thereby influences
water transport to starch granules near to bran and hence the swelling behaviour of that starch. However, it is questionable whether bran particles absorb water from the surrounding gluten-
starch matrix during cooking. I0 distributions were broadened for increasing whole-wheat con-
tent (Figure 14C). I0 being a measure for the local water content, this meant that water was dis-
tributed more heterogeneously in spaghetti with high bran content. Our interpretation is that bran particles did not absorb water during cooking or at least not to the same extent as the sur-
rounding gluten-starch matrix. Instead, large bran particles redistributed the water around the
particles.
Bran particle size did not affect T2* maximum peak in lab-scale spaghetti, though larger bran particles broadened the T2* distribution (Figure 14D). A broader T2* distribution indicates
a more heterogeneous microstructure and might also be related to a more uneven degree of
starch gelatinisation. Again, a similar behaviour was observed when comparing DS, DS+FB

Effects of: Bran addition and bran particle size
38
and DS+WG. The bran-rich DS+WG had the broadest T2* distribution, while DS+FB (en-riched with smaller fibre particles) had a slightly broader distribution than the control DS
(Figure 14B). I0 distributions were affected less by bran particle size, but larger bran particles
in lab-scale and industrial-scale spaghetti still showed slightly broadened I0 distributions
(Figure 14B+C). This supports the results of increasing whole-wheat content, such as that large bran particles redistributed water to a stronger degree than smaller bran particles due to their size.
Summary Texture and sensory properties of whole-wheat spaghetti can be modulated by
bran particle size. Microscopy and MRI gave insights to explain the observed variations in tex-
ture. The macrostructure of cooked spaghetti was not affected by bran particle sizes, but larger bran particles induced a more heterogeneous microstructure. During cooking, bran particles
absorbed water to a lesser extent than the surrounding starch-gluten matrix. Large particles ex-
hibited further a barrier effect for water migration and thereby locally limited the degree of
starch gelatinisation.

Conclusions
39
Conclusions
The main objective of this work was to characterise the interplay of water and microstruc-
ture in pasta as affected by choice of raw materials.
To do so, magnetic resonance imaging was adapted to map the water distribution in 3D at high resolution. Moreover, MRI and light microscopy complemented each other. Thereby, var-
iations in water distribution were linked to structural components such as starch, gluten and
fibre. Analysing the microstructure from different perspectives was demonstrated to be essen-tial in visualising the orientation of anisotropic structures such as fibre particles. A further
adapted MRI method allowed monitoring the cooking process of pasta in real-time.
The cooking process was characterised by steady water absorption and the water ingress
towards the ungelatinised core was regulated by starch gelatinisation. It was shown that macro-scopic water absorption as well as water ingress was governed by pasta geometry and depend-
ed only to a limited degree on raw materials. However, the gelatinised region was affected by
raw material composition as an increased protein content limited starch swelling.
The influence of fibre particles was characterized by studying bran particles of varying particle size. Bran particles get aligned during extrusion, which often results in a perpendicular
orientation compared to the direction of the water ingress. Thereby, bran particles can create
barriers for the water ingress and redistributes the water around the particles. Connected to the redistribution is the local effect of restricting starch swelling. The severity of the barrier effect
increases with particle size. Larger bran particles alter the microstructure already in dry pasta.
Both factors can partly explain why, in sensory analysis, smaller bran particles where preferred
as they alter the microstructure to a lesser extent. After cooking, water distribution was not in equilibrium within pasta. Instead, the present
internal moisture was sufficient to continue starch gelatinisation during warm-holding. This
resulted in a fast decrease in firmness and increase in stickiness. When the moisture distribu-
tion reached its equilibrium, texture properties did not change with longer warm-holding times. These findings show that cooking and warm-holding are similar processes that only differ in
the amount of water available.

40
Future research
Working with complex food structures such as pasta allows for various research approach-
es. The research in this work touched different areas and it is therefore of interest both to focus
on further method development as well as a more detailed analysis of raw materials and their processing.
The described interplay of water and microstructure was based on correlations as the tech-
niques were applied to different spaghetti strands of the same batch. It would be interesting to carry out both MRI and light microscopy on the very same spaghetti strand. This has not been
tested in practical terms, but it is theoretically imaginable to freeze the spaghetti strand imme-
diately after the MRI measurement. The spaghetti strand could then be cryo-sectioned
throughout the sample, which could serve as a base for a 3D reconstruction based on light mi-croscopy. Comparing 3D data obtained by MRI and light microscopy from the very same spa-
ghetti strand could give more complete understanding of the interdependence of water
distribution and microstructure.
We were able to study water migration during cooking by MRI in real-time and the same method can in principle be applied to study the water migration during warm-holding as well.
However, there are some practical challenges to overcome.
Another approach could be to combine MRI and light microscopy with further spatially re-solved methods such as fluorescence fingerprint imaging (Kokawa et al., 2014), microtomog-
raphy (Zhang et al., 2013) as well as moisture maps based on photography and image
processing (Ogawa and Adachi, 2013). Confocal laser scanning microscopy is particularly
suitable to visualise the protein network in pasta (Zweifel et al., 2003). It would be interesting to use it with quantum dots as fluorescent probe enabling to study the protein network in more
clarity (Sozer and Kokini, 2014). Even non-spatially resolved methods can give further valua-
ble information such as differential scanning calorimetry that can be used to determine the de-
gree of starch gelatinisation within a pasta sample. The described methods can also be used to study how raw materials affect and are affected
by the production process in more detail. Especially for bran and fibre particles it could be
studied if and how they attract water during mixing and drying.
In keeping with numerous studies, the new raw material – in our case bran – should not in-terfere with the protein network to achieve the best texture. Milling bran to smaller particle size
was only one option to address this challenge. To achieve a pronounced increase in quality of
whole-wheat pasta, solely optimising the milling of bran might not be enough. Instead, a com-bination with other processes should be considered. Several processes have been suggested
recently and it would be interesting to see them applied in a pasta context. These processes in-
cluded microfluidized (Mert et al., 2014), tribocharged (Chen et al., 2014) and cryogenic
ground bran (Hemery et al., 2010), as well as heat treated (Sudha et al., 2011) or fermented bran (Coda et al., 2014). To increase complexity even more: While optimising the processing
of bran for improved pasta texture properties, the potential nutritional benefits of bran may not
be compromised.
Finally, the research on warm-held pasta revealed that the texture deterioration is caused by a surplus of water – both inside and outside of the pasta. Besides finding raw materials that
tolerate warm-holding, it is advisable to adapt the post-cooking handling of pasta so that excess
water is removed as fast as possible.

Acknowledgements
41
Acknowledgements
I would like to thank everyone, both colleagues, friends and family, who have supported me during my time as a PhD student.
First of all, a very special thank you to my supervisor Maud Langton for your encouragement,
support and understanding throughout the years.
Thank you, Annelie Moldin, for taking the time to be a co-supervisor and for all good pasta discussions, for your help and for introducing me to the secrets of pasta making.
Diana Bernin: It is fair to say that, without you, this work would not look the same. How
would the title figure look like without the left part? Thank you for your patience in teaching
me MRI, your sincere interest in pasta research, your curiosity, commitment and endurance. Where do you find all your energy?
I want to thank Lantmännen Research Foundation for initiating this research project. Special
thanks to Carina Bohman, Christian Malmberg, Sofie Villman and Ingmar Börjesson for your
support, your ideas and all the fruitful discussions. I would like to further acknowledge the practical help of the many Lantmännen employees in Malmö, Järna, Stockholm and Uppsala.
A special thanks to my mentor Mats Larsson for interesting discussions and for giving me in-
sights into the wider implications of research for the food industry. I thank SuMo Biomaterials for a stimulating research environment as well as for interesting
meetings and courses within the Centre. Special thanks to Magnus Nydén for introducing me
to Diana and suggesting MRI “might be something to try one day”.
Thank you for good collaboration to Magnus Röding and Daniel Topgaard. It was a pleasure to work with my master thesis student Emmy Sandberg.
I am grateful to Camilla Öhgren and Niklas Lorén for reviewing this work and valuable com-
ments.
Thank you to all kind colleagues at SP Food and Bioscience (formerly known as SIK) and es-pecially to the folks at the Structure and Material design group. You made me always feel at
home and did not forget me even after I partly found another office room in Uppsala at the De-
partment of Food Science, Swedish University of Agricultural Sciences (SLU). My regards go to all colleagues at the department, but especially to the superb Structure and Properties group.
A special thanks to Daniel Johansson, my roommate from coast to coast.
I would like to thank all PhD students at SIK and SLU for good company and enjoyable study
trips, together with the Research Schools LiFT and Food in Focus. Finally, a deep thank you to one more PhD student who supported me the most: Babett, you
are awesome!

42
References
AACC, 2000. AACC Method 66-50.01: Pasta and Noodle Cooking Quality - Firmness. Aimoto, U., Ogawa, T., Adachi, S., 2013. Water Sorption Kinetics of Spaghetti Prepared
under Different Drying Conditions. Food Sci. Technol. Res. 19, 17–22. Al-Obaidy, H.M., Khan, M.A., Klein, B.P., 1984. Comparison Between Sensory Quality of
Freshly Prepared Spaghetti with Meat Sauce Before and After Hot Holding on a Cafeteria Counter. J. Food Sci. 49, 1475–1477.
Aravind, N., Sissons, M.J., Egan, N.E., Fellows, C.M., 2012. Effect of insoluble dietary fibre addition on technological, sensory, and structural properties of durum wheat spaghetti. Food Chem. 130, 299–309.
Autio, K., Salmenkallio-Marttila, M., 2001. Light Microscopic Investigations of Cereal Grains, Doughs and Breads. Leb. und -Technologie 34, 18–22.
BeMiller, J.N., 2010. Carbohydrate Analysis. In: Nielsen, S.S. (Ed.), Food Analysis, Food Science Texts Series. Springer US, Boston, MA, pp. 147–177.
Bock, J.E., Connelly, R.K., Damodaran, S., 2013. Impact of Bran Addition on Water Properties and Gluten Secondary Structure in Wheat Flour Doughs Studied by Attenuated Total Reflectance Fourier Transform Infrared Spectroscopy. Cereal Chem. 90, 377–386.
Bock, J.E., Seetharaman, K., 2012. Unfolding Gluten: An Overview of Research on Gluten. Cereal Foods World 57, 209–214.
Bonomi, F., D’Egidio, M.G., Iametti, S., Marengo, M., Marti, A., Pagani, M.A., Ragg, E.M., 2012. Structure-quality relationship in commercial pasta: a molecular glimpse. Food Chem. 135, 348–355.
Briffaz, A., Bohuon, P., Méot, J.-M., Dornier, M., Mestres, C., 2014a. Modelling of water transport and swelling associated with starch gelatinization during rice cooking. J. Food Eng. 121, 143–151.
Briffaz, A., Bohuon, P., Méot, J.-M., Pons, B., Matencio, F., Dornier, M., Mestres, C., 2014b. Modelling of brown rice and limited-water cooking modes and its potential use for texture prediction. J. Food Eng. 141, 99–106.
Bruneel, C., Pareyt, B., Brijs, K., Delcour, J.A., 2010. The impact of the protein network on the pasting and cooking properties of dry pasta products. Food Chem. 120, 371–378.
Bustos, M.C., Perez, G.T., León, A.E., 2011. Sensory and nutritional attributes of fibre-enriched pasta. LWT - Food Sci. Technol. 44, 1429–1434.
Cabrer, P.R., van Duynhoven, J.P.M., van Dalen, G., Nicolay, K., 2005. Non-biomedical applications of MRI: assessment of water transport in food. Cienc. en la Front. Rev. Cienc. y Tecnol. la UACJ 3, 59–66.
Cafieri, S., Mastromatteo, M., Chillo, S., Del Nobile, M.A., 2010. Modeling the mechanical properties of pasta cooked at different times. J. Food Eng. 100, 336–342.
Chen, J.S., Fei, M.J., Shi, C.L., Tian, J.C., Sun, C.L., Zhang, H., Ma, Z., Dong, H.X., 2011. Effect of particle size and addition level of wheat bran on quality of dry white Chinese noodles. J. Cereal Sci. 53, 217–224.
Chen, Z., Wang, L., Wang, R., Li, Y., Chen, Z., 2014. Triboelectric separation of aleurone cell-cluster from wheat bran fragments in nonuniform electric field. Food Res. Int. 62, 111–120.
Chillo, S., Laverse, J., Falcone, P.M., Protopapa, A., Del Nobile, M.A., 2008. Influence of the addition of buckwheat flour and durum wheat bran on spaghetti quality. J. Cereal Sci. 47, 144–152.
Coda, R., Rizzello, C.G., Curiel, J.A., Poutanen, K.S., Katina, K., 2014. Effect of bioprocessing and particle size on the nutritional properties of wheat bran fractions. Innov. Food Sci. Emerg. Technol. 25, 19–27.

References
43
Conde-Petit, B., 2003. The structure and texture of starch-based foods. In: McKenna, B.M. (Ed.), Texture in Food, Volume 1: Semi-Solid Foods. Woodhead Publishing Limited, Cambridge, pp. 86–108.
Copeland, L., Blazek, J., Salman, H., Tang, M.C., 2009. Form and functionality of starch. Food Hydrocoll. 23, 1527–1534.
Cubadda, F., Aureli, F., Raggi, A., Carcea, M., 2009. Effect of milling, pasta making and cooking on minerals in durum wheat. J. Cereal Sci. 49, 92–97.
Cubadda, R.E., Carcea, M., Marconi, E., Trivisonno, M.C., 2007. Influence of Gluten Proteins and Drying Temperature on the Cooking Quality of Durum Wheat Pasta. Cereal Chem. 84, 48–55.
Cunin, C., Handschin, S., Conde-Petit, B., Escher, F., 1997. Development of microstructure of pasta during processing and cooking. In: Windhab, E.J., Wolf, B. (Eds.), Proceedings of the 1st International Symposium on Food Rheology and Structure. Vincentz Verlag, Hannover, pp. 344–347.
Cunningham, S.E., McMinn, W.A.M., Magee, T.R.A., Richardson, P.S., 2007. Modelling water absorption of pasta during soaking. J. Food Eng. 82, 600–607.
Cuq, B., Abécassis, J., Guilbert, S., 2003. State diagrams to help describe wheat bread processing. Int. J. Food Sci. Technol. 38, 759–766.
De Noni, I., Pagani, M.A., 2010. Cooking properties and heat damage of dried pasta as influenced by raw material characteristics and processing conditions. Crit. Rev. Food Sci. Nutr. 50, 465–472.
De Vita, O.Z., 2009. Encyclopedia of pasta. University of California Press, Berkeley. Del Nobile, M.A., Baiano, A., Conte, A., Mocci, G., 2005. Influence of protein content on
spaghetti cooking quality. J. Cereal Sci. 41, 347–356. Del Nobile, M.A., Buonocore, G.G., Panizza, A., Gambacorta, G., 2003a. Modeling the
Spaghetti Hydration Kinetics During Cooking and Overcooking. J. Food Sci. 68, 1316–1323.
Del Nobile, M.A., Fares, C., Conte, A., Martinez-Navarrete, N., Mocci, G., La Notte, E., 2003b. Influence of Raw Materials and Processing Conditions on Spaghetti Hydration Kinetic During Cooking and Overcooking. Cereal Chem. 80, 601–607.
Delcour, J.A., Bruneel, C., Derde, L.J., Gomand, S. V., Pareyt, B., Putseys, J.A., Wilderjans, E., Lamberts, L., 2010. Fate of Starch in Food Processing: From Raw Materials to Final Food Products. Annu. Rev. Food Sci. Technol. 1, 87–111.
Delcour, J.A., Hoseney, R.C., 2009. Principles of Cereal Science and Technology. AACC International.
Delcour, J.A., Joye, I.J., Pareyt, B., Wilderjans, E., Brijs, K., Lagrain, B., 2012. Wheat Gluten Functionality as a Quality Determinant in Cereal-Based Food Products. Annu. Rev. Food Sci. Technol. 3, 469–492.
Delcour, J.A., Vansteelandt, J., Hythier, M.-C., Abécassis, J., 2000a. Fractionation and reconstitution experiments provide insight into the role of starch gelatinization and pasting properties in pasta quality. J. Agric. Food Chem. 48, 3774–3778.
Delcour, J.A., Vansteelandt, J., Hythier, M.-C., Abécassis, J., Sindic, M., Deroanne, C., 2000b. Fractionation and Reconstitution Experiments Provide Insight into the Role of Gluten and Starch Interactions in Pasta Quality. J. Agric. Food Chem. 48, 3767–3773.
Dexter, J.E., Kilborn, R.H., Morgan, B.C., Matsuo, R.R., 1983a. Grain Research Laboratory Compression Tester: Instrumental Measurement of Cooked Spaghetti Stickiness. Cereal Chem. 60, 139–142.
Dexter, J.E., Matsuo, R.R., Morgan, B.C., 1983b. Spaghetti Stickiness: Some Factors Influencing Stickiness and Relationship to Other Cooking Quality Characteristics. J. Food Sci. 48, 1545–1551.
Dexter, J.E., Matsuo, R.R., Preston, K.R., Kilborn, R.H., 1981. Comparison of Gluten Strength, Mixing Properties, Baking Quality and Spaghetti Quality of Some Canadian Durum and Common Wheats. Can. Inst. Food Sci. Technol. J. 14, 108–111.

44
Fannon, J.E., Gray, J.A., Gunawan, N., Huber, K.C., BeMiller, J.N., 2004. Heterogeneity of starch granules and the effect of granule channelization on starch modification*. Cellulose 11, 247–254.
Fiorda, F.A., Soares, M.S., da Silva, F.A., Grosmann, M.V.E., Souto, L.R.F., 2013. Microstructure, texture and colour of gluten-free pasta made with amaranth flour, cassava starch and cassava bagasse. LWT - Food Sci. Technol. 54, 132–138.
Fuad, T., Prabhasankar, P., 2010. Role of ingredients in pasta product quality: a review on recent developments. Crit. Rev. Food Sci. Nutr. 50, 787–798.
Gianibelli, M.C., Sissons, M.J., Batey, I.L., 2005. Effect of Source and Proportion of Waxy Starches on Pasta Cooking Quality. Cereal Chem. 82, 321–327.
Gil-Humanes, J., Piston, F., Shewry, P.R., Tosi, P., Barro, F., 2011. Suppression of gliadins results in altered protein body morphology in wheat. J. Exp. Bot. 62, 4203–4213.
Gonzalez, J.J., McCarthy, K.L., McCarthy, M.J., 2000. Textural and Structural Changes in Lasagna After Cooking. J. Texture Stud. 31, 93–108.
Grzybowski, R.A., Donnelly, B.J., 1979. Cooking properties of spaghetti: factors affecting cooking quality. J. Agric. Food Chem. 27, 380–384.
Guan, F., Seib, P.A., 1994. Instrumental Probe and Method to Measure Stickiness of Cooked Spaghetti and Noodles. Cereal Chem. 71, 330–337.
Hager, A.-S., Zannini, E., Arendt, E.K., 2012. Gluten-free Pasta - Advances in Research and Commercialization. Cereal Foods World 57, 225–229.
Hemery, Y.M., Mabille, F., Martelli, M.R., Rouau, X., 2010. Influence of water content and negative temperatures on the mechanical properties of wheat bran and its constitutive layers. J. Food Eng. 98, 360–369.
Heneen, W.K., Brismar, K., 2003. Structure of Cooked Spaghetti of Durum and Bread Wheats. Starch/Stärke 55, 546–557.
Horigane, A.K., Kawabuchi, M., Uchijima, S., Yoshida, M., 2009. Effects of seasonings on physical properties and MRI T2 map of cooked spaghetti. Food Res. Int. 42, 41–50.
Horigane, A.K., Naito, S., Kurimoto, M., Irie, K., Yamada, M., Motoi, H., Yoshida, M., 2006. Moisture Distribution and Diffusion in Cooked Spaghetti Studied by NMR Imaging and Diffusion Model. Cereal Chem. 83, 235–242.
International Pasta Organisation, ., 2012. The World Pasta Industry Status Report 2012. Irie, K., Horigane, A.K., Naito, S., Motoi, H., Yoshida, M., 2004. Moisture Distribution
and Texture of Various Types of Cooked Spaghetti. Cereal Chem. 81, 350–355. Kaur, G., Sharma, S., Nagi, H.P.S., Dar, B.N., 2012. Functional properties of pasta
enriched with variable cereal brans. J. Food Sci. Technol. 49, 467–474. Kill, R., Turnbull, K., 2001. Pasta and Semolina Technology, 1st ed, Book. Wiley
Blackwell, London. Kojima, T.I., Horigane, A.K., Nakajima, H., Yoshida, M., Nagasawa, A., 2004. T2 Map,
Moisture Distribution, and Texture of Boiled Japanese Noodles Prepared from Different Types of Flour. Cereal Chem. 81, 746–751.
Kojima, T.I., Horigane, A.K., Yoshida, M., Nagata, T., Nagasawa, A., 2001. Change in the Status of Water in Japanese Noodles During and After Boiling Observed by NMR Micro Imaging. J. Food Sci. 66, 1361–1365.
Kokawa, M., Yokoya, N., Ashida, H., Sugiyama, J., 2014. Visualization of Gluten , Starch , and Butter in Pie Pastry by Fluorescence Fingerprint Imaging. Food Bioprocess Technol. 8, 409–419.
Kontogiorgos, V., 2011. Microstructure of hydrated gluten network. Food Res. Int. 44, 2582–2586.
Kratzer, A.M., 2007. Hydration, dough formation and structure development in durum wheat pasta processing. Dissertation. ETH Zürich.
Lai, H.-M., Hwang, S.-C., 2004. Water status of cooked white salted noodles evaluated by MRI. Food Res. Int. 37, 957–966.
References
45
Langton, M., Hermansson, A.-M., 1989. Microstructural changes in wheat starch dispersions during heating and cooling. Food Microstruct. 8, 29–39.
Lemke, H., Burghammer, M., Flot, D., Rössle, M., Riekel, C., 2004. Structural processes during starch granule hydration by synchrotron radiation microdiffraction. Biomacromolecules 5, 1316–1324.
Li, J., Hou, G.G., Chen, Z., Chung, A., Gehring, K., 2014. Studying the effects of whole-wheat flour on the rheological properties and the quality attributes of whole-wheat saltine cracker using SRC, alveograph, rheometer, and NMR technique. LWT - Food Sci. Technol. 55, 43–50.
Lucisano, M., Pagani, M.A., Mariotti, M., Locatelli, D.P., 2008. Influence of die material on pasta characteristics. Food Res. Int. 41, 646–652.
Maeda, I., Horigane, A.K., Yoshida, M., Aikawa, Y., 2009. Water Diffusion in Buckwheat Noodles and Wheat Noodles during Boiling and Holding as Determined from MRI and Rectangular Cylinder Diffusion Model. Food Sci. Technol. Res. 15, 107–116.
Manthey, F.A., Schorno, A.L., 2002. Physical and Cooking Quality of Spaghetti Made from Whole Wheat Durum. Cereal Chem. 79, 504–510.
Marchylo, B.A., Dexter, J.E., Malcolmson, L.J., 2004. Improving the texture of pasta. In: Kilcast, D. (Ed.), Texture in Food, Volume 2: Solid Foods. CRC Press, Boca Raton, FL, pp. 475–500.
Mariette, F., 2009. Investigations of food colloids by NMR and MRI. Curr. Opin. Colloid Interface Sci. 14, 203–211.
Mariette, F., Collewet, G., Davenel, A., Lucas, T., Musse, M., 2009. Quantitative MRI in Food Science & Food Engineering. In: Harris, R.K., Wasylishen, R.E. (Eds.), Encyclopedia of Magnetic Resonance. John Wiley & Sons, Chichester, pp. 1–8.
Marti, A., Pagani, M.A., Seetharaman, K., 2014. Textural attributes of wheat and gluten free pasta. In: Dar, Y.L., Light, J.M. (Eds.), Food Texture Design and Optimization. pp. 222–244.
Martinez, C.S., Ribotta, P.D., León, A.E., Añón, M.C., 2007. Physical, Sensory and Chemical Evaluation of Cooked Spaghetti. J. Texture Stud. 38, 666–683.
McCarthy, K.L., Gonzalez, J.J., McCarthy, M.J., 2002. Change in Moisture Distribution in Lasagna Pasta Post Cooking. J. Food Sci. 67, 1785–1789.
Mert, B., Tekin, A., Demirkesen, I., Kocak, G., 2014. Production of Microfluidized Wheat Bran Fibers and Evaluation as an Ingredient in Reduced Flour Bakery Product. Food Bioprocess Technol. 7, 2889–2901.
Meuser, F., 2008. Technological aspects of dietary fibre. In: McCleary, B. V., Prosky, L. (Eds.), Advanced Dietary Fibre Technology. Wiley-Blackwell, Hoboken, pp. 248–269.
Migliori, M., Gabriele, D., Decindio, B., Pollini, C.M., 2005. Modelling of high quality pasta drying: quality indices and industrial application. J. Food Eng. 71, 242–251.
Mohorič, A., Vergeldt, F.J., Gerkema, E., de Jager, A., van Duynhoven, J.P.M., van Dalen, G., Van As, H., 2004. Magnetic resonance imaging of single rice kernels during cooking. J. Magn. Reson. 171, 157–162.
Niu, M., Hou, G.G., Lee, B., Chen, Z., 2014. Effects of fine grinding of millfeeds on the quality attributes of reconstituted whole-wheat flour and its raw noodle products. LWT - Food Sci. Technol. 57, 58–64.
Noort, M.W.J., van Haaster, D., Hemery, Y.M., Schols, H.A., Hamer, R.J., 2010. The effect of particle size of wheat bran fractions on bread quality - Evidence for fibre-protein interactions. J. Cereal Sci. 52, 59–64.
Ogawa, T., Adachi, S., 2013. Measurement of Moisture Profiles in Pasta During Rehydration Based on Image Processing. Food Bioprocess Technol. 7, 1465–1471.
Ogawa, T., Adachi, S., 2014. Effects of drying conditions on moisture distribution in rehydrated spaghetti. Biosci. Biotechnol. Biochem. 1–3.

46
Ogawa, T., Kobayashi, T., Adachi, S., 2011. Water sorption kinetics of spaghetti at different temperatures. Food Bioprod. Process. 89, 135–141.
Olivera, D.F., Salvadori, V.O., 2011. Instrumental and sensory evaluation of cooked pasta during frozen storage. Int. J. Food Sci. Technol. 46, 1445–1454.
Pagani, M.A., Lucisano, M., Mariotti, M., 2007. Traditional Italian Products from Wheat and Other Starchy Flours. In: Hui, Y.H. (Ed.), Handbook of Food Products Manufacturing: Principles, Bakery, Beverages, Cereals, Cheese, Confectionary, Fats, Fruits, and Functional Foods. Wiley-Interscience, pp. 327–388.
Pavlovich-Abril, A., Rouzaud-Sández, O., Torres, P., Robles-Sánchez, R.M., 2012. Cereal bran and wholegrain as a source of dietary fibre: technological and health aspects. Int. J. Food Sci. Nutr. 63, 882–92.
Peressini, D., 2011. Maillard reaction in dried pasta. Tec. Molit. Int. 73–81. Pérez, S., Bertoft, E., 2010. The molecular structures of starch components and their
contribution to the architecture of starch granules: A comprehensive review. Starch/Stärke 62, 389–420.
Petitot, M., Abécassis, J., Micard, V., 2009. Structuring of pasta components during processing: impact on starch and protein digestibility and allergenicity. Trends Food Sci. Technol. 20, 521–532.
Petitot, M., Micard, V., 2010. Legume-Fortified Pasta. Impact of Drying and Precooking Treatments on Pasta Structure and Inherent In Vitro Starch Digestibility. Food Biophys. 5, 309–320.
Rakhesh, N., Fellows, C.M., Sissons, M.J., 2015. Evaluation of the technological and sensory properties of durum wheat spaghetti enriched with different dietary fibres. J. Sci. Food Agric. 95, 2–11.
Rawat, N., Indrani, D., 2014. Functional ingredients for wheat based bakery, traditional, pasta and other food products - A review. Food Rev. Int. Online First.
Resmini, P., Pagani, M.A., 1983. Ultrastructure studies of pasta. A review. Food Microstruct. 2, 1–12.
Ritota, M., Gianferri, R., Bucci, R., Brosio, E., 2008. Proton NMR relaxation study of swelling and gelatinisation process in rice starch–water samples. Food Chem. 110, 14–22.
Robin, F., Schuchmann, H.P., Palzer, S., 2012. Dietary fiber in extruded cereals: Limitations and opportunities. Trends Food Sci. Technol. 28, 23–32.
Schmidt, S.J., 2007. Water Mobility in Foods. In: Barbosa-Cánovas, G. V., Schmidt, S., Fontana, A. (Eds.), Water Activity in Foods : Fundamentals and Applications. Blackwell Publishing Ltd, Hoboken, pp. 47–108.
Sekiyama, Y., Horigane, A.K., Ono, H., Irie, K., Maeda, T., Yoshida, M., 2012. T2 distribution of boiled dry spaghetti measured by MRI and its internal structure observed by fluorescence microscopy. Food Res. Int. 48, 374–379.
Shiau, S.-Y., Wu, T.-T., Liu, Y.-L., 2012. Effect of the Amount and Particle Size of Wheat Fiber on Textural and Rheological Properties of Raw, Dried and Cooked Noodles. J. Food Qual. 35, 207–216.
Sissons, M.J., 2008. Role of Durum Wheat Composition on the Quality of Pasta and Bread. Food 2, 75–90.
Sissons, M.J., Fellows, C.M., 2014. Sensory, Technological, and Health Aspects of Adding Fiber to Wheat-Based Pasta. In: Watson, R., Preedy, V., Sherma Zibadi (Eds.), Wheat and Rice in Disease Prevention and Health: Benefits, Risks and Mechanisms of Whole Grains in Health Promotion. Academic Press, pp. 211–226.
Sissons, M.J., Gianibelli, M.C., Batey, I.L., 2002. Small-Scale Reconstitution of Durum Semolina Components. Cereal Chem. 79, 675–680.
Sissons, M.J., Schlichting, L.M., Egan, N.E., Aarts, W.A., Harden, S., Marchylo, B.A., 2008. A Standardized Method for the Instrumental Determination of Cooked Spaghetti Firmness. Cereal Chem. 85, 440–444.

References
47
Sissons, M.J., Soh, H.N., Turner, M.A., 2007. Role of gluten and its components in influencing durum wheat dough properties and spaghetti cooking quality. J. Sci. Food Agric. 87, 1874–1885.
Slavin, J.L., Jacobs, D., Marquart, L., 2000. Grain processing and nutrition. Crit. Rev. Food Sci. Nutr. 40, 309–326.
Soh, C.H.N., Sissons, M.J., Turner, M.A., 2006. Effect of Starch Granule Size Distribution and Elevated Amylose Content on Durum Dough Rheology and Spaghetti Cooking Quality. Cereal Chem. 83, 513–519.
Sozer, N., Dalgic, A.C., 2007. Modelling of rheological characteristics of various spaghetti types. Eur. Food Res. Technol. 225, 183–190.
Sozer, N., Kokini, J.L., 2014. Use of quantum nanodot crystals as imaging probes for cereal proteins. Food Res. Int. 57, 142–151.
Sudha, M.L., Ramasarma, P.R., Venkateswara Rao, G., 2011. Wheat bran stabilization and its use in the preparation of high-fiber pasta. Food Sci. Technol. Int. 17, 47–53.
Sung, W.-C., Stone, M., 2005. Microstructural studies of pasta and starch pasta. J. Mar. Sci. Technol. 13, 83–88.
Surget, A., Barron, C., 2005. Histologie du grain de blé. Ind. des céréales 145, 3–7. Tan, H.-Z., Gu, W.-Y., Zhou, J.-P., Wu, W.-G., Xie, Y.-L., 2006. Comparative Study on
the Starch Noodle Structure of Sweet Potato and Mung Bean. J. Food Sci. 71, C447–C455.
Tang, H., Mitsunaga, T., Kawamura, Y., 2006. Molecular arrangement in blocklets and starch granule architecture. Carbohydr. Polym. 63, 555–560.
Tosi, P., Gritsch, C.S., He, J., Shewry, P.R., 2011. Distribution of gluten proteins in bread wheat (Triticum aestivum) grain. Ann. Bot. 108, 23–35.
Troccoli, A., Borrelli, G.M., De Vita, P., Fares, C., Di Fonzo, N., 2000. Mini Review: Durum Wheat Quality: A Multidisciplinary Concept. J. Cereal Sci. 32, 99–113.
Wagner, M., Morel, M.-H., Bonicel, J., Cuq, B., 2011. Mechanisms of Heat-Mediated Aggregation of Wheat Gluten Protein upon Pasta Processing. J. Agric. Food Chem. 59, 3146–3154.
Vansteelandt, J., Delcour, J.A., 1999. Characterisation of Starch from Durum Wheat (Triticum durum). Starch/Stärke 51, 73–80.
West, R., 2012. Whole Grain Pasta : A Physicochemical and Sensory Study. Dissertation. Guelph.
West, R., Seetharaman, K., Duizer, L.M., 2013. Effect of drying profile and whole grain content on flavour and texture of pasta. J. Cereal Sci. 58, 82–88.
Vignaux, N., Doehlert, D.C., Elias, E.M., McMullen, M.S., Grant, L.A., Kianian, S.F., 2005. Quality of Spaghetti Made from Full and Partial Waxy Durum Wheat. Cereal Chem. 82, 93–100.
Willbrandt, U., Müller, K., Seibel, W., 1989. Ermittlung des Kochpotentials von Teigwaren für die besonderen Bedingungen in Großküchen. Getreide Mehl und Brot 283–286.
Villeneuve, S., Gelinas, P., 2007. Drying kinetics of whole durum wheat pasta according to temperature and relative humidity. LWT - Food Sci. Technol. 40, 465–471.
Wilson, J.D., Bechtel, D.B., Todd, T.C., Seib, P.A., 2006. Measurement of Wheat Starch Granule Size Distribution Using Image Analysis and Laser Diffraction Technology. Cereal Chem. 83, 259–268.
Wood, J.A., 2009. Texture, processing and organoleptic properties of chickpea-fortified spaghetti with insights to the underlying mechanisms of traditional durum pasta quality. J. Cereal Sci. 49, 128–133.
Zhang, L., Nishizu, T., Kishigami, H., Kato, A., Goto, K., 2013. Measurement of internal shrinkage distribution in spaghetti during drying by X-ray µCT. Food Res. Int. 51, 180–187.

48
Zhu, H., Mukherjee, S., Dhall, A., 2011. A Finite Element Analysis of Coupling Between Water Absorption and Swelling of Foodstuffs During Soaking. Transp. Porous Media 88, 399–419.
Zweifel, C., 2001. Influence of High-Temperature Drying on Textural Properties of Durum Wheat Pasta. Dissertation. ETH Zürich.
Zweifel, C., Handschin, S., Escher, F., Conde-Petit, B., 2003. Influence of High-Temperature Drying on Structural and Textural Properties of Durum Wheat Pasta. Cereal Chem. 80, 159–167.