Multiresidue Analysis of Veterinary Drugs in Bovine Liver ... · Multiresidue Analysis of...
18
Multiresidue Analysis of Veterinary Drugs in Bovine Liver by LC/MS/MS Agilent Bond Elut Enhanced Matrix Removal—Lipid Authors Limian Zhao, Derick Lucas Agilent Technologies, Inc. Application Note Food Testing and Agriculture Abstract Agilent Bond Elut Enhanced Matrix Removal—Lipid (EMR—Lipid) is the next generation of sample preparation product, and is available for convenient dispersive solid phase extraction (dSPE). The material is highly selective towards coextracted matrix, especially from fatty samples (fat content > 5%) without negatively impacting analyte recovery. This study demonstrates the application of this novel product for the analysis of 30 representative veterinary drugs in bovine liver. The procedure involves a rapid and efficient protein precipitation extraction by acidified acetonitrile, followed by the use of EMR—Lipid dSPE and a polish kit for further cleanup. The amount of matrix removed by the EMR-Lipid protocol was determined by the weight of coextractives and postcolumn infusion experiments. Compared to other matrix cleanup products, EMR—Lipid dSPE provides more effective matrix removal and better analyte recoveries. The optimized EMR—Lipid method delivers superior cleanliness, and excellent accuracy and precision for all 30 veterinary drug compounds at all levels, providing fast, robust, and effective analysis of high-fat samples.
Transcript of Multiresidue Analysis of Veterinary Drugs in Bovine Liver ... · Multiresidue Analysis of...
Multiresidue Analysis of VeterinaryDrugs in Bovine Liver by LC/MS/MSAgilent Bond Elut Enhanced Matrix Removal—Lipid
Authors
Limian Zhao, Derick Lucas
Agilent Technologies, Inc.
Application Note
Food Testing and Agriculture
Abstract
Agilent Bond Elut Enhanced Matrix Removal—Lipid (EMR—Lipid) is the next
generation of sample preparation product, and is available for convenient dispersive
solid phase extraction (dSPE). The material is highly selective towards coextracted
matrix, especially from fatty samples (fat content > 5%) without negatively
impacting analyte recovery. This study demonstrates the application of this novel
product for the analysis of 30 representative veterinary drugs in bovine liver. The
procedure involves a rapid and efficient protein precipitation extraction by acidified
acetonitrile, followed by the use of EMR—Lipid dSPE and a polish kit for further
cleanup. The amount of matrix removed by the EMR-Lipid protocol was determined
by the weight of coextractives and postcolumn infusion experiments. Compared to
other matrix cleanup products, EMR—Lipid dSPE provides more effective matrix
removal and better analyte recoveries. The optimized EMR—Lipid method delivers
superior cleanliness, and excellent accuracy and precision for all 30 veterinary drug
compounds at all levels, providing fast, robust, and effective analysis of high-fat
samples.
2
Introduction
Veterinary drugs are widely used for animals in the foodproduction industry to prevent diseases, or as growthpromoters. These drugs accumulate in animal tissue, andimproper use can lead to drug residue build-up in edibletissues, which are a known risk to human health. Withincreased attention on food safety, regulations have been putin place in nearly every country to limit the drugs used in foodanimal production [1-4].
Foods from animal origin such as muscle, liver, and eggs areusually chemically complex and, therefore, it is critical toapply an efficient sample preparation method that includesgeneral extraction and efficient cleanup. The establishedsample preparation methods include traditional solventextraction, solid phase extraction (SPE), or a combination ofmultiple techniques. These methods are usuallylabor-intensive, time consuming, only suitable for limitedclasses of compounds, and require additional methoddevelopment.
Multiclass, multiresidue methods are becoming increasinglypopular in regulatory monitoring programs due to theirincreased analytical scope and laboratory efficiency. Thenumber of veterinary drugs being monitored has increased inthe past few years, and now there are more than 100 reported[5-8]. Sample pretreatment usually involves extraction with amixture of acetonitrile:water, followed by C18 cleanup, othercleanup techniques, or both. Sorbents such as C18 onlyprovide limited removal of coextracted lipids, which can result
in precipitation in the final sample on dilution orreconstitution. The generation of precipitate requires samplefiltration before LC/MS/MS injection, and may cause analyteloss. Hexane can be added during the dispersive solid phaseextraction (dSPE) to remove coextracted lipids but isnonselective, time-consuming, and removes hydrophobicanalytes. The use of zirconia sorbent materials for cleanupprovides improved matrix cleanup compared to C18, but alsoresults in more analyte loss, especially for carboxylic acid-and hydroxyl-containing compounds such asfluoroquinolones, tetracyclines, and macrolides [7,8].
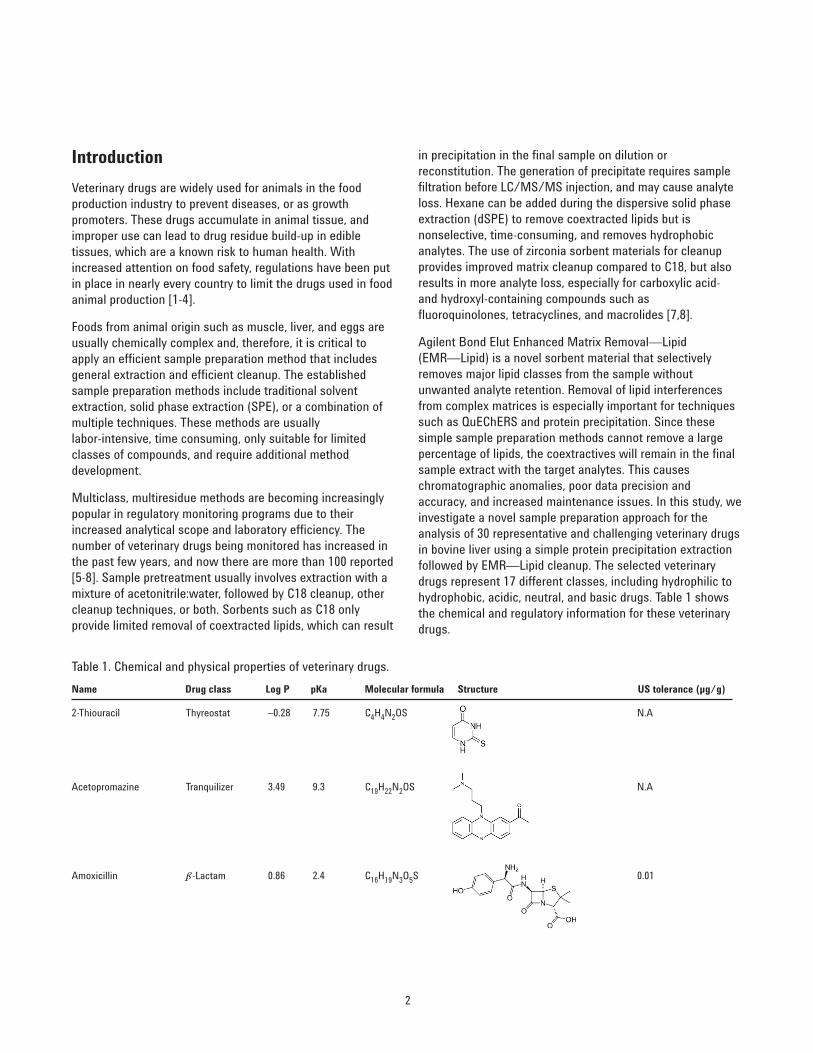
Agilent Bond Elut Enhanced Matrix Removal—Lipid (EMR—Lipid) is a novel sorbent material that selectivelyremoves major lipid classes from the sample withoutunwanted analyte retention. Removal of lipid interferencesfrom complex matrices is especially important for techniquessuch as QuEChERS and protein precipitation. Since thesesimple sample preparation methods cannot remove a largepercentage of lipids, the coextractives will remain in the finalsample extract with the target analytes. This causeschromatographic anomalies, poor data precision andaccuracy, and increased maintenance issues. In this study, weinvestigate a novel sample preparation approach for theanalysis of 30 representative and challenging veterinary drugsin bovine liver using a simple protein precipitation extractionfollowed by EMR—Lipid cleanup. The selected veterinarydrugs represent 17 different classes, including hydrophilic tohydrophobic, acidic, neutral, and basic drugs. Table 1 showsthe chemical and regulatory information for these veterinarydrugs.
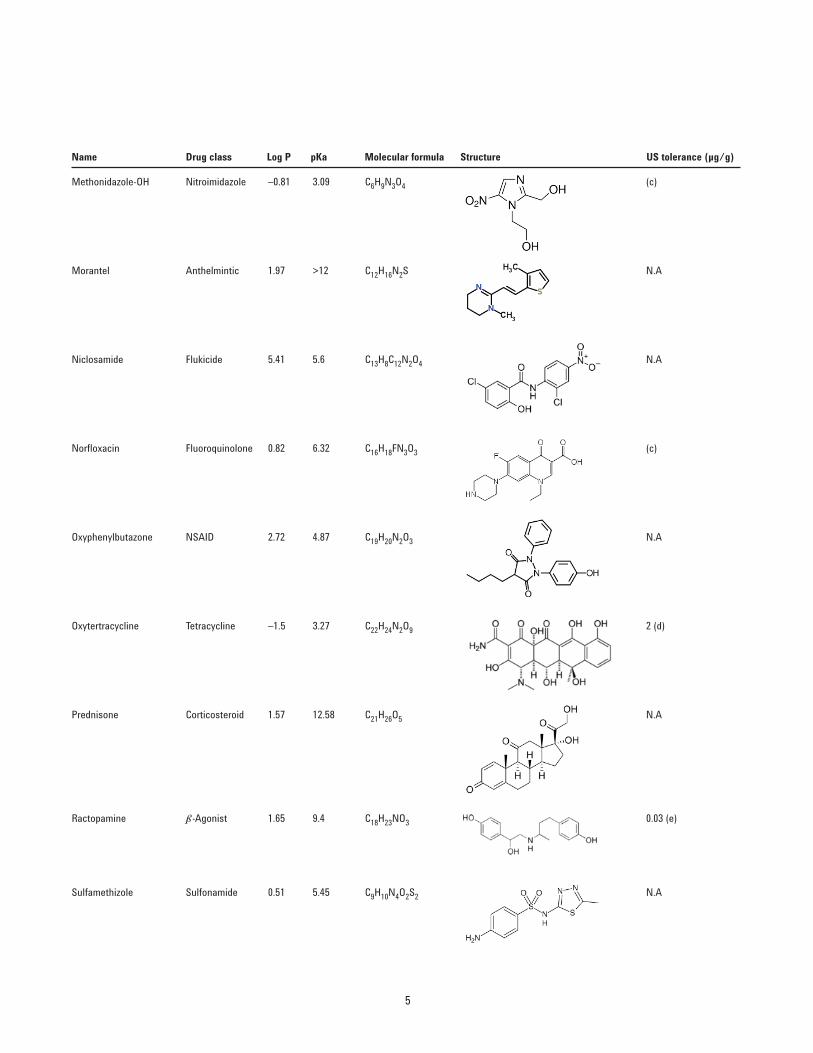
Table 1. Chemical and physical properties of veterinary drugs.
Name Drug class Log P pKa Molecular formula Structure US tolerance (µg/g)
2-Thiouracil Thyreostat –0.28 7.75 C4H4N2OS
Acetopromazine Tranquilizer 3.49 9.3 C19H22N2OS
Amoxicillin b-Lactam 0.86 2.4 C16H19N3O5S
N.A
N.A
0.01
3
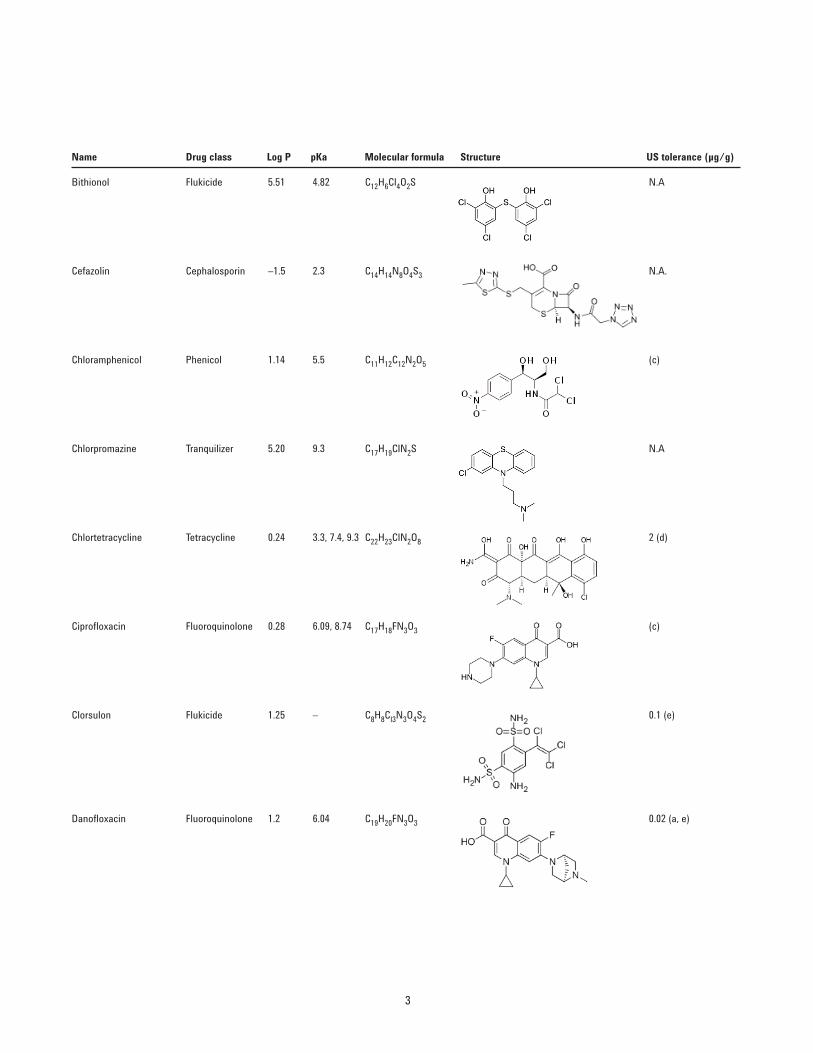
Name Drug class Log P pKa Molecular formula Structure US tolerance (µg/g)
Bithionol Flukicide 5.51 4.82 C12H6Cl4O2S
Cefazolin Cephalosporin –1.5 2.3 C14H14N8O4S3
Chloramphenicol Phenicol 1.14 5.5 C11H12C12N2O5
Chlorpromazine Tranquilizer 5.20 9.3 C17H19ClN2S
Chlortetracycline Tetracycline 0.24 3.3, 7.4, 9.3 C22H23ClN2O8
Ciprofloxacin Fluoroquinolone 0.28 6.09, 8.74 C17H18FN3O3
Clorsulon Flukicide 1.25 – C8H8Cl3N3O4S2
Danofloxacin Fluoroquinolone 1.2 6.04 C19H20FN3O3
N.A
N.A.
(c)
N.A
2 (d)
(c)
0.1 (e)
0.02 (a, e)
4
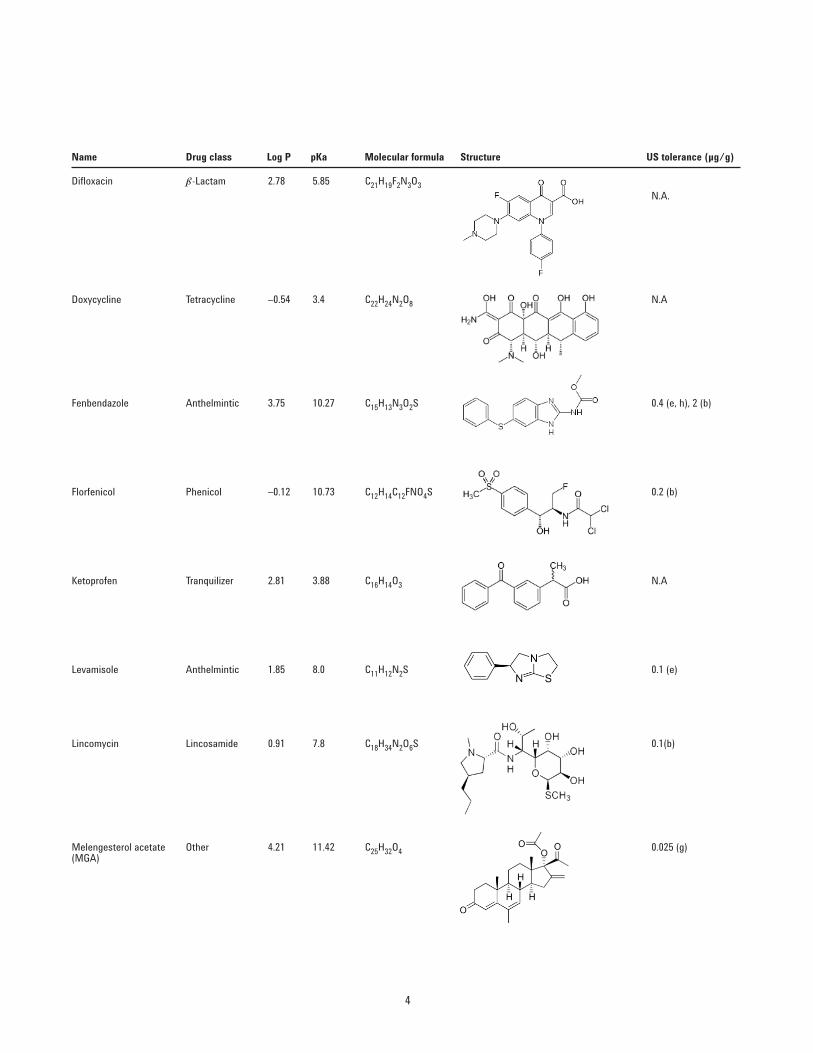
Difloxacin b-Lactam 2.78 5.85 C21H19F2N3O3
Doxycycline Tetracycline –0.54 3.4 C22H24N2O8
Fenbendazole Anthelmintic 3.75 10.27 C15H13N3O2S
Florfenicol Phenicol –0.12 10.73 C12H14C12FNO4S
Ketoprofen Tranquilizer 2.81 3.88 C16H14O3
Levamisole Anthelmintic 1.85 8.0 C11H12N2S
Lincomycin Lincosamide 0.91 7.8 C18H34N2O6S
Melengesterol acetate Other 4.21 11.42 C25H32O4(MGA)
N.A.
N.A
0.4 (e, h), 2 (b)
0.2 (b)
N.A
0.1 (e)
0.1(b)
0.025 (g)
Name Drug class Log P pKa Molecular formula Structure US tolerance (µg/g)
5
Name Drug class Log P pKa Molecular formula Structure US tolerance (µg/g)
Methonidazole-OH Nitroimidazole –0.81 3.09 C6H9N3O4
Morantel Anthelmintic 1.97 >12 C12H16N2S
Niclosamide Flukicide 5.41 5.6 C13H8C12N2O4
Norfloxacin Fluoroquinolone 0.82 6.32 C16H18FN3O3
Oxyphenylbutazone NSAID 2.72 4.87 C19H20N2O3
Oxytertracycline Tetracycline –1.5 3.27 C22H24N2O9
Prednisone Corticosteroid 1.57 12.58 C21H26O5
Ractopamine b-Agonist 1.65 9.4 C18H23NO3
Sulfamethizole Sulfonamide 0.51 5.45 C9H10N4O2S2
(c)
N.A
N.A
(c)
N.A
2 (d)
N.A
0.03 (e)
N.A
6
ExperimentalAll regents and solvents were HPLC or analytical grade.Acetonitrile (ACN) was from Honeywell (Muskegon, MI,USA). Dimethyl sulfoxide (DMSO), vet drug standards, andinternal standard were from Sigma-Aldrich, Corp.(St Louis, MO, USA). Reagent-grade formic acid (FA) was fromAgilent (p/n G2453-86060). Ammonium acetate (NH4OAc)was from Fisher Chemicals (Fair Lawn, NJ, USA).
Solution and standardsFormic acid (5%) in ACN was freshly prepared by adding 5 mL formic acid to 95 mL ACN. Ammonium acetate stocksolution (1 M) was made by dissolving 19.27 g NH4OAc in250 mL Milli-Q water. The solution was stored at 4 °C.A 5 mM ammonium acetate in water solution was made byadding 5 mL of 1 M ammonium acetate stock solution to 1 Lof Milli-Q water.
Standard and internal standard (IS) stock solutions weremade in DMSO at 2.0 mg/mL except for danofloxacin stocksolution in DMSO at 1.0 mg/mL and ciprofloxacin stocksolution in DMSO at 0.25 mg/mL. Amoxicillin and cefazolinstock solutions were made in water at 2.0 mg/mL. All stock
solutions were prepared in amber glass vials, except plasticvials for amoxicillin and cefazolin stock solutions. All stocksolutions were stored at –20 °C. The 30 compounds wereallocated to two groups, G1 and G2, based on instrumentresponse. A combined 25/5 µg/mL (G1/G2) standard workingsolution was prepared in 1/1 ACN/water. Flunixin-d3 ISworking solution (25 µg/mL) was prepared in 1/1 ACN/water.
EquipmentEquipment and material used for sample preparation included:
• Geno/Grinder (SPEX, Metuchen, NJ, USA)
• Centra CL3R centrifuge (Thermo IEC, MA, USA)
• Eppendorf microcentrifuge (Brinkmann Instruments,Westbury, NY, USA)
• Vortexer and multitube vortexers (VWR, Radnor, PA, USA)
• Bottle top dispenser (VWR, So. Plainfield, NJ, USA)
• Eppendorf pipettes and repeater
• Agilent Bond Elut EMR—Lipid tubes (p/n 5982-1010)Agilent Bond Elut Final Polish for Enhanced MatrixRemoval—Lipid (p/n 5982-0101)
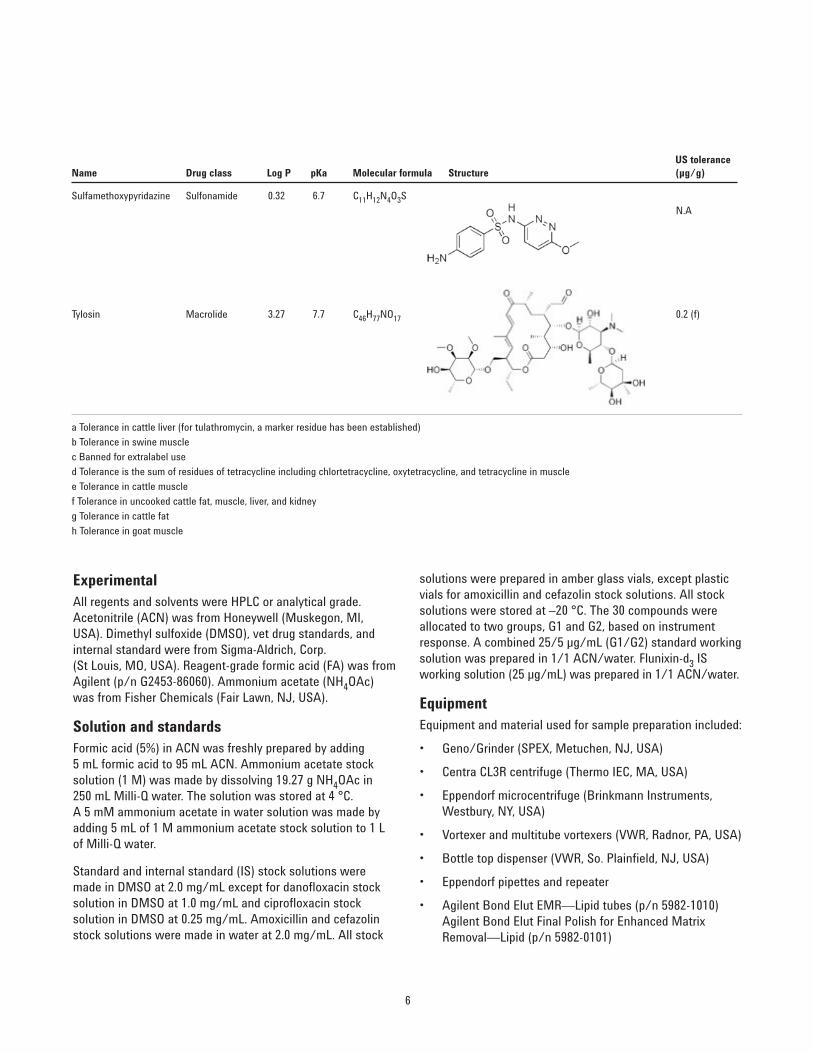
Name Drug class Log P pKa Molecular formula StructureUS tolerance (µg/g)
Sulfamethoxypyridazine Sulfonamide 0.32 6.7 C11H12N4O3S
Tylosin Macrolide 3.27 7.7 C46H77NO17
N.A
0.2 (f)
a Tolerance in cattle liver (for tulathromycin, a marker residue has been established)
b Tolerance in swine muscle
c Banned for extralabel use
d Tolerance is the sum of residues of tetracycline including chlortetracycline, oxytetracycline, and tetracycline in muscle
e Tolerance in cattle muscle
f Tolerance in uncooked cattle fat, muscle, liver, and kidney
g Tolerance in cattle fat
h Tolerance in goat muscle
7
InstrumentationAnalysis was performed on an Agilent 1290 Infinity LCsystem consisting :
• Agilent 1290 Infinity Quaternary Pump (G4204A)
• Agilent1290 Infinity High Performance Autosampler(G4226A) equipped with an Agilent 1290 InfinityThermostat (G1330B), and an Agilent1290 InfinityThermostatted Column Compartment (G1316C)
The UHPLC system was coupled to an Agilent 6490 TripleQuadrupole LC/MS system equipped with an Agilent JetStream electrospray ionization source and iFunnel technology.Agilent MassHunter workstation software was used for dataacquisition and analysis.
Instrument conditions
HPLC conditionsColumn: Agilent Poroshell 120 EC-C18, 2.1 × 150 mm, 2.7 µm
(p/n 693775-902), Agilent Poroshell 120 EC-C18 UHPLC Guard, 2.1 × 5 mm, 2.7 µm (p/n 821725-911)
Mobile phase: A) 0.1% FA in waterB) 0.1% FA in acetonitrile
Flow rate: 0.3 mL/min
Column temp: 40 °C
Autosampler temp: 4 °C
Inj vol: 3 µL
Needle wash: 1:1:1:1 ACN:MeOH:IPA:H2O with 0.2% FA
Gradient: Time (min) %B0 100.5 108.0 100
Stop time: 12 min
Posttime: 3 min
Conditions, MSPositive/negative mode
Gas temp: 120 °C
Gas flow: 14 L/min
Nebulizer: 40 psi
Sheath gas heater: 400 °C
Sheath gas flow: 12 L/min
Capillary: 3,000 V
iFunnel parameters: Positive Negative
High-pressure RF 90 V 90 V
Low-pressure RF 70 V 60 V
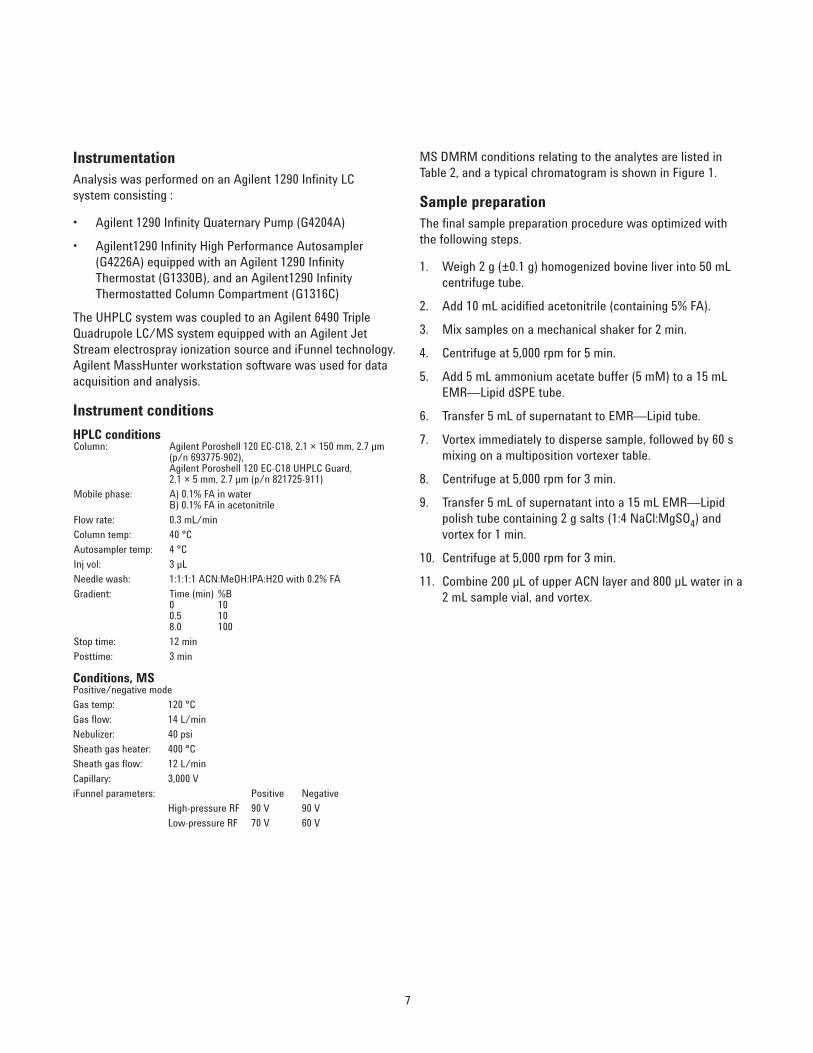
MS DMRM conditions relating to the analytes are listed inTable 2, and a typical chromatogram is shown in Figure 1.
Sample preparation The final sample preparation procedure was optimized withthe following steps.
1. Weigh 2 g (±0.1 g) homogenized bovine liver into 50 mLcentrifuge tube.
2. Add 10 mL acidified acetonitrile (containing 5% FA).
3. Mix samples on a mechanical shaker for 2 min.
4. Centrifuge at 5,000 rpm for 5 min.
5. Add 5 mL ammonium acetate buffer (5 mM) to a 15 mLEMR—Lipid dSPE tube.
6. Transfer 5 mL of supernatant to EMR—Lipid tube.
7. Vortex immediately to disperse sample, followed by 60 smixing on a multiposition vortexer table.
8. Centrifuge at 5,000 rpm for 3 min.
9. Transfer 5 mL of supernatant into a 15 mL EMR—Lipidpolish tube containing 2 g salts (1:4 NaCl:MgSO4) andvortex for 1 min.
10. Centrifuge at 5,000 rpm for 3 min.
11. Combine 200 µL of upper ACN layer and 800 µL water in a2 mL sample vial, and vortex.

8
AnalyteRT (min)
Delta RT(min) Polarity
Precursorion (m/z)
Product ion
Quant ion CE (V) Qual ion CE (V)
2-Thiouracil 1.41 2 Negative 127 57.9 17 – –
Amoxicillin 1.84 2 Positive 366.1 349.2 5 114 25
Methonidazole-OH 2.07 2 Positive 188.1 123.1 9 126.1 13
Levamisole 3.4 2 Positive 205.1 178.1 21 91.1 41
Lincomycin 3.35 2 Positive 407.2 126.1 37 70.1 80
Norfloxacin 4.22 2 Positive 320.1 302.2 21 276.1 17
Oxytetracycline 4.24 2 Positive 461.2 426.1 17 443.2 9
Ciprofloxacin 4.31 2 Positive 332.1 231 45 314.3 21
Danofloxacin 4.42 2 Positive 358.2 340.2 21 81.9 53
Ractopamine 4.4 2 Positive 302.2 107 33 77 77
Morantel 4.9 2 Positive 221.1 123.1 37 76.9 80
Cefazolin 4.65 2 Positive 455 323.1 9 156 13
Sulfamethizole 4.65 2 Positive 271 156.1 13 92 29
Sulfamethoxypyridazine 4.69 2 Positive 281.1 92 33 65.1 57
Difloxacin 4.83 2 Positive 400.2 382 25 356.3 17
Chlortetracycine 5.11 2 Positive 479.1 444.2 21 462.1 17
Doxycycline 5.24 2 Positive 445.2 428.1 17 410.2 25
Florfenicol 5.47 2 Negative 300.1 268.1 25 159.1 41
Chloramphenicol 5.68 2 Negative 321 152 17 257.1 9
Tylosin 5.85 2 Positive 916.5 173.9 45 772.5 33
Closulon 5.86 2 Negative 377.9 341.9 9 – –
Prednisone 5.88 2 Positive 359.2 147.2 33 341.2 9
Acetopromizine 5.93 2 Positive 327.2 86 21 58 45
Chlorpromazine 6.49 2 Positive 319.1 86 21 58.1 45
Fenbendazole 6.77 2 Positive 300.1 268.1 25 159.1 41
Ketoprofen 6.8 2 Positive 255.1 208.9 13 77 57
Oxyphenbutazone 7.27 2 Negative 323.1 133.9 25 295 17
Flunixin-d3 (NEG) 7.53 2 Negative 298.1 254.2 17 192 37
Flunixin-d3 (POS) 7.53 2 Positive 300.1 282 25 264 41
Melengestrol acetate 8.78 2 Positive 397.2 337.4 13 279.2 21
Niclosamide 8.82 2 Negative 325 170.9 25 289.1 13
Bithionol 9.49 2 Negative 352.9 161 21 191.8 25
Table 2. LC/MS/MS DMRM parameters and retention times for target analytes.

9
The sample is now ready for LC/MS/MS analysis. The entiresample preparation flow path is shown in Figure 2. Calibration standards and quality control samples
Prespiked QC samples were fortified with combined standardworking solution appropriately, after step 1, for six replicates.For G1 analytes, the QC samples corresponded to 10, 50, 250,and 750 ng/g in liver. For G2 analytes, QC samplescorresponded to 2, 10, 50, and 150 ng/g in liver. IS solutionwas also spiked into all samples except the matrix blank,corresponding to 200 ng/g of flunixin-d3 in liver.
Matrix-matched calibration standards were prepared withstandard and IS working solutions. Appropriateconcentrations into the matrix blank samples after step 8corresponded to 5, 25, 50, 250, 750, and 1,000 ng/g in liver(G1), or 1, 5, 10, 50, 150, and 200 ng/g in liver (G2), and200 ng/g IS in liver.
1.0 1.4 1.8 2.2 2.6 3.0 3.4 3.8 4.2 4.6 5.0 5.4 5.8 6.2 6.6 7.0 7.4 7.8 8.2 8.6 9.0 9.4 9.80
0.10.20.30.40.50.60.70.80.91.01.11.2×105
Acquisition time (min)
Counts
Figure 1. A typical LC/MS/MS chromatogram (DMRM) of a bovine liver samplefortified with a 50 ng/g veterinary drug standard and extracted by proteinprecipitation followed by cleanup with Agilent Bond Elut EMR—Lipid.
Accurately weigh 2 g (± 0.1 g) comminuted bovine liver into a 50 mL centrifuge tube.
Add 10 mL 5% formic acid in ACN.
Cap and shake vigorously on a mechanical shaker for 2 min.
Centrifuge at 5,000 rpm for 5 min.
Add 5 mL buffer followed by 5 mL ACN crude extract to EMR—Lipid dSPE 15 mL tubes.
Vortex and centrifuge.
Transfer 5 mL of supernatant to a EMR—Lipid polish tube.
Vortex and centrifuge, then, for matrix blank samples, transfer the upper ACN layer to another tube.
Postspike STD and IS into the matrix blank to make matrix-matched calibration standards.
Combine 200 µL upper ACN layer and 800 µL water; vortex.
Samples are ready for LC/MS/MS analysis.
Spike IS and STD into QC samples, and IS into all samples except matrix blanks; vortex.
Figure 2, Sample preparation procedure using Agilent BondElut EMR—Lipid for the analysis of vet drugs in bovine liver.

10
Determining amount of coextractivesThe amount of coextractives was determined by gravimetricmeasurement [7] for three different cleanup techniques; C18,zirconia sorbent, and EMR—Lipid. Samples were prepared asfollows.
1. Heat glass tubes for ~1 h at 110 °C to remove moisture.
2. Cool tubes to room temperature.
3. Preweigh test tubes.
4. Accurately transfer 1 mL of initial matrix blank extract (nocleanup) and the matrix blanks with various cleanups,each in duplicate.
5. Dry all samples on a CentriVap at 50 °C for 1 h or until dry.
6. Heat the tubes for ~1 h at 110 °C to remove moisture.
7. Cool tubes to room temperature.
8. Reweigh the tubes.
The weight difference between after step 8 and after 3 is theamount of sample coextractive. The amount of coextractivesremoved by cleanup was the average weight difference of thematrix coextractives before and after cleanup.
Matrix effect assessmentChromatographic matrix effect was assessed by a postcolumninfusion experiment. The matrix blank samples were injectedwith simultaneous postcolumn infusion of 10 ppb neatstandard vet drug solution at 60 µL/min. All compoundtransitions were monitored through the entire LC cycle.
Additionally, the analyte response (peak area) was comparedbetween postspiked liver extracts and the equivalent neatsolutions. Postspiked liver extracts were made by postspikingstandard solution into the blank liver matrix extract. Thedifference in response (peak area) is directly correlated tomatrix effects.
Method optimization, validation, and comparisonDifferent optimization tests were assessed; 5% FA in ACNversus 1% FA in ACN for protein precipitation, ammoniumacetate buffer versus water for EMR—Lipid cleanup, and withand without polish salts after EMR—Lipid cleanup. Resultswere evaluated based on analyte recovery, precision, andother quantitation parameters. The final optimized methodwas then validated by running a full quantitation batch withduplicated calibration curve standards bracketing all QCsamples.
Recovery comparison data were gathered by pre- andpostspiking liver samples at 50 ng/g. The extracts were thenprocessed with acceptable cleanup protocols. For the EMR—Lipid protocol with protein precipitation, the cleanupprocedure described in Figure 2 was employed. ForQuEChERS, a C18 or zirconia sorbent dSPE cleanup was used,as follows.
1. Weigh 2 g of liver in a 50 mL tube.
2. Add 8 mL phosphate buffer (pH 7.0) and 10 mL acidifiedACN (5% FA).
3. Vortex sample for 30 s.
4. Add EN salts for partitioning/extraction, and shakevigorously on a mechanical shaker.
5. Centrifuge at 5,000 rpm for 5 min.
The crude ACN liver extract used for further cleanup wasprepared as follows.
1. Add 1 mL crude ACN liver extract to a 2 mL vialcontaining 25 mg C18 and 150 mg MgSO4(p/n 5982-4921), or into a 2 mL vial containing 100 mgzirconia sorbent.
2. Cap and vortex for 1 min.
3. Centrifuge at 13,000 rpm for 3 min (microcentrifuge).
4. Transfer 200 µL of supernatant into another vialcontaining 800 µL water.
5. Vortex and filter with a regenerated cellulose 0.45 µmfilter.
Samples are then ready for LC/MS/MS analysis. Therecovery was calculated by the ratio of analyte peak areasfrom pre- and postspiked samples.

11
Results and Discussion
Amount of coextractivesTable 3 shows the results from the sample coextractivegravimetric test, clearly demonstrating that EMR—Lipid dSPEprovides the best matrix cleanup efficiency by weight thandSPE with C18 or zirconia sorbent.
Matrix effect assessmentPostcolumn infusion (PCI) of vet drug standards was used forevaluation of matrix effects in the crude ACN extracts andthree final ACN extracts cleaned up by EMR—Lipid, C18, andzirconia sorbent. All analytes were monitored through theentire LC cycle. The PCI chromatograms reflect the matriximpact for analytes monitored under positive and negativemode. The final ACN extract was not diluted before injection,and the ACN was injected directly. The PCI profiles are shownin Figure 3.
As shown in the red trace, significant matrix suppression(lower baseline) and matrix enhancement (large peaks) wereobserved with the injection of crude liver matrix blank withoutany cleanup. These matrix effects will have dramatic negativeimpacts on method reliability and data quality. In comparison,as shown in the blue trace, the use of EMR—Lipid cleanupgave significant improvements, as observed by reducedmatrix suppression and enhancement.
Table 3. Bovine liver matrix coextractive gravimetric results forAgilent Bond Elut Enhanced Matrix Removal—Lipid, zirconia,and C18 cleanup.
Cleanup technique
Coextractives per1 mL of ACN finalextract (mg) (n = 2)
Matrix coextractiveremoval efficiencyby cleanup (%)
No further cleanup 12.1 –
EMR—Lipid dSPE 5.3 56.2
Zirconia separation with dSPE 6.0 50.4
C18 dSPE 7.8 35.5
0.5 1.0 1.5 2.0 2.5 3.0 3.5 4.0 4.5 5.0 5.5 6.0 6.5 7.0 7.5 8.0 8.5 9.0 9.5 10.0 10.5 11.0 11.50
0.20.40.60.81.01.21.41.61.82.02.22.42.62.83.03.23.43.63.84.04.24.44.6
×105
Acquisition time (min)
Acquisition time (min)
BL matrix blank without EMR—Lipid cleanup with postcolumn infusion of vet drugs 10 ppb neat standard
BL matrix blank with EMR—Lipid cleanup with postcolumn infusion of vet drugs 10 ppb neat standard
BL matrix blank with zirconia separation and cleanup with postcolumn infusion of vet drugs 10 ppb neat standard
BL matrix blank with C18 cleanup with postcolumn infusion of vet drugs 10 ppb neat standard
Counts
Counts
1 2 3 4 5 6 7 8 9 10 11012345678
×104
Figure 3. Postcolumn infusion profiles were generated by injecting a bovine liver (BL) matrix blanksample with simultaneous postcolumn infusion of 10 ppb of veterinary drug standard solution. Allanalytes were monitored for the chromatographic run, and the profile was a combined TIC of allmonitored analyte transitions.
12
The chromatogram insert in Figure 3 shows the PCI profileswith the injection of matrix blank samples using differentcleanup. The profiles of EMR—Lipid (blue) and zirconiasorbent (purple) are similar. The C18 cleanup (green) profilealso shows similarity with the other two, but with moreregions of matrix enhancement and suppression. Thiscomparison corresponds to that of the gravimetriccoextractive evaluation, in which EMR—Lipid cleanup givesslightly better cleanup efficiency than zirconia sorbent, andboth give better cleanup than C18.
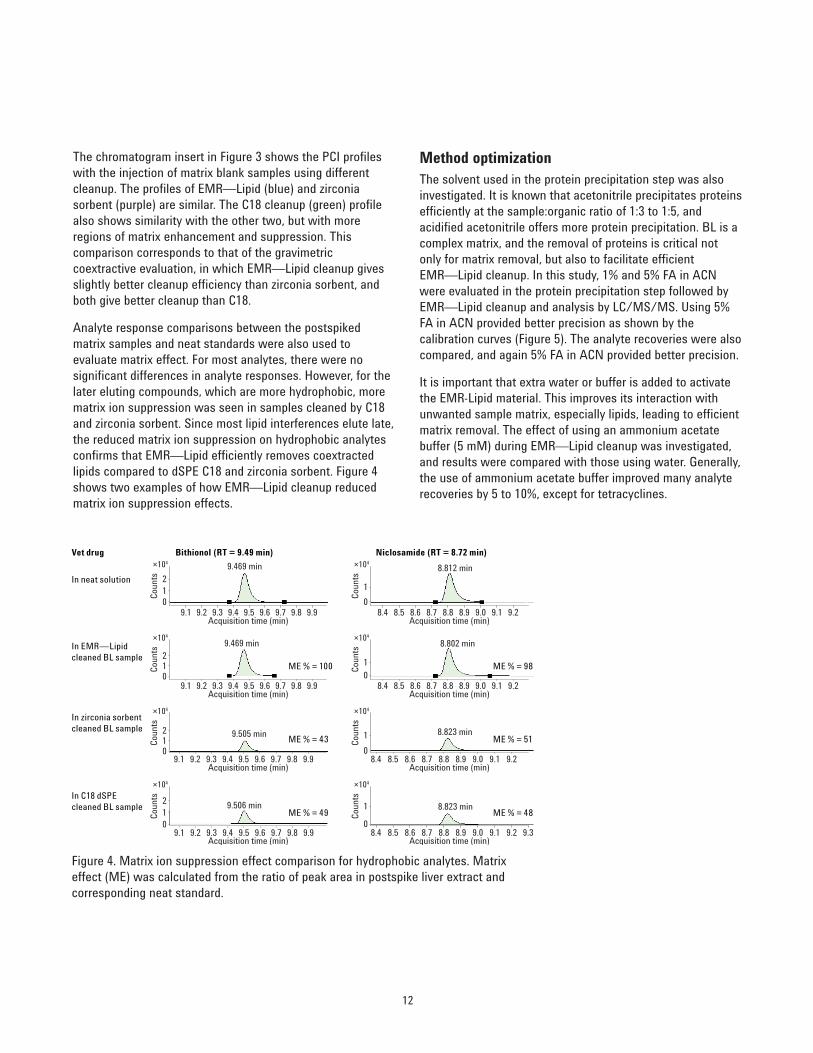
Analyte response comparisons between the postspikedmatrix samples and neat standards were also used toevaluate matrix effect. For most analytes, there were nosignificant differences in analyte responses. However, for thelater eluting compounds, which are more hydrophobic, morematrix ion suppression was seen in samples cleaned by C18and zirconia sorbent. Since most lipid interferences elute late,the reduced matrix ion suppression on hydrophobic analytesconfirms that EMR—Lipid efficiently removes coextractedlipids compared to dSPE C18 and zirconia sorbent. Figure 4shows two examples of how EMR—Lipid cleanup reducedmatrix ion suppression effects.
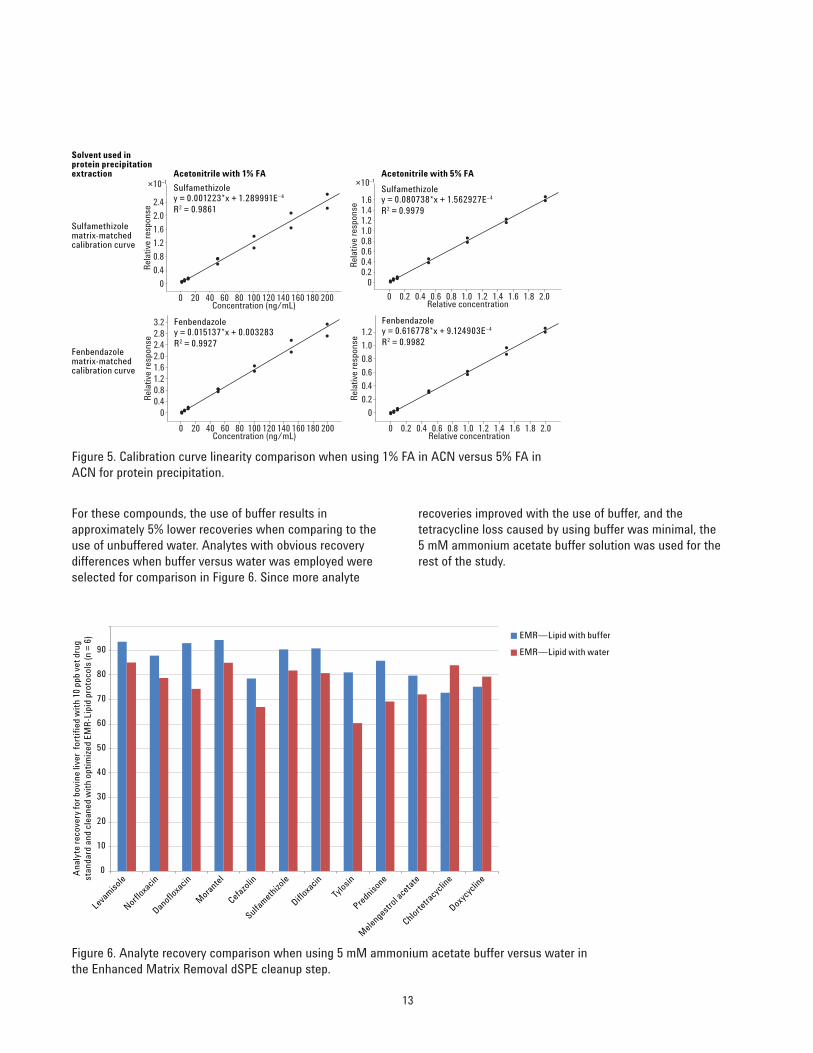
Method optimizationThe solvent used in the protein precipitation step was alsoinvestigated. It is known that acetonitrile precipitates proteinsefficiently at the sample:organic ratio of 1:3 to 1:5, andacidified acetonitrile offers more protein precipitation. BL is acomplex matrix, and the removal of proteins is critical notonly for matrix removal, but also to facilitate efficient EMR—Lipid cleanup. In this study, 1% and 5% FA in ACNwere evaluated in the protein precipitation step followed byEMR—Lipid cleanup and analysis by LC/MS/MS. Using 5%FA in ACN provided better precision as shown by thecalibration curves (Figure 5). The analyte recoveries were alsocompared, and again 5% FA in ACN provided better precision.
It is important that extra water or buffer is added to activatethe EMR-Lipid material. This improves its interaction withunwanted sample matrix, especially lipids, leading to efficientmatrix removal. The effect of using an ammonium acetatebuffer (5 mM) during EMR—Lipid cleanup was investigated,and results were compared with those using water. Generally,the use of ammonium acetate buffer improved many analyterecoveries by 5 to 10%, except for tetracyclines.
Vet drug Bithionol (RT = 9.49 min) Niclosamide (RT = 8.72 min)
In neat solution
In EMR—Lipid cleaned BL sample
In zirconia sorbent cleaned BL sample
In C18 dSPE cleaned BL sample
9.1 9.2 9.3 9.4 9.5
9.469 min
9.6 9.7 9.8 9.9012
×104
Acquisition time (min)
Coun
ts
ME % = 100
9.1 9.2 9.3 9.4 9.5
9.469 min
9.6 9.7 9.8 9.9012
×104
Acquisition time (min)
Coun
ts
ME % = 43012
9.1 9.2 9.3 9.4 9.5
9.505 min
9.6 9.7 9.8 9.9
×104
Acquisition time (min)
Coun
ts
ME % = 49012
9.1 9.2 9.3 9.4 9.5 9.6 9.7 9.8 9.9
9.506 min
×104
Acquisition time (min)
Coun
ts
8.4 8.5 8.6 8.7 8.8
8.812 min
8.9 9.0 9.1 9.20
1
×104
Acquisition time (min)
Coun
ts
ME % = 98
8.4 8.5 8.6 8.7 8.8
8.802 min
8.9 9.0 9.1 9.20
1
×104
Acquisition time (min)
Coun
ts
ME % = 51
8.4 8.5 8.6 8.7 8.8
8.823 min
8.9 9.0 9.1 9.20
1
×104
Acquisition time (min)
Coun
ts
ME % = 488.823 min
8.4 8.5 8.6 8.7 8.8 8.9 9.0 9.1 9.2 9.30
1
×104
Acquisition time (min)
Coun
ts
Figure 4. Matrix ion suppression effect comparison for hydrophobic analytes. Matrixeffect (ME) was calculated from the ratio of peak area in postspike liver extract andcorresponding neat standard.
13
For these compounds, the use of buffer results inapproximately 5% lower recoveries when comparing to theuse of unbuffered water. Analytes with obvious recoverydifferences when buffer versus water was employed wereselected for comparison in Figure 6. Since more analyte
recoveries improved with the use of buffer, and thetetracycline loss caused by using buffer was minimal, the5 mM ammonium acetate buffer solution was used for therest of the study.
Solvent used in protein precipitation extraction
Sulfamethizole matrix-matched calibration curve
Fenbendazole matrix-matched calibration curve
Acetonitrile with 1% FA Acetonitrile with 5% FA
0 20 40 60 80 100 120 140 160 180 200
0
0.4
0.8
1.2
1.6
2.0
2.4
×10–1
Rel
ativ
e re
spon
se
Concentration (ng/mL)
Sulfamethizoley = 0.001223*x + 1.289991E–4
R2 = 0.9861
0 20 40 60 80 100 120 140 160 180 200
00.40.81.21.62.02.42.83.2
Rel
ativ
e re
spon
se
Concentration (ng/mL)
Fenbendazoley = 0.015137*x + 0.003283R2 = 0.9927
0 0.2 0.4 0.6 0.8 1.0 1.2 1.4 1.6 1.8 2.0
00.20.40.60.81.01.21.41.6
×10–1
Rel
ativ
e re
spon
se
Relative concentration
0 0.2 0.4 0.6 0.8 1.0 1.2 1.4 1.6 1.8 2.0Relative concentration
Sulfamethizoley = 0.080738*x + 1.562927E–4
R2 = 0.9979
0
0.2
0.4
0.6
0.8
1.0
1.2
Rel
ativ
e re
spon
se
Fenbendazoley = 0.616778*x + 9.124903E–4
R2 = 0.9982
Figure 5. Calibration curve linearity comparison when using 1% FA in ACN versus 5% FA inACN for protein precipitation.
Figure 6. Analyte recovery comparison when using 5 mM ammonium acetate buffer versus water inthe Enhanced Matrix Removal dSPE cleanup step.
0
10
20
30
40
50
60
70
80
90
Levamiso
le
Norfloxa
cin
Danofloxa
cin
Mora
ntel
Cefazo
lin
Sulfameth
izole
Difloxa
cin
Tylosin
Predniso
ne
Melengestro
l aceta
te
Chlortetra
cyclin
e
Doxycyc
line
Ana
lyte
rec
over
y fo
r bov
ine
liver
for
tifi
ed w
ith
10 p
pb v
et d
rug
stan
dard
and
cle
aned
wit
h op
tim
ized
EM
R-L
ipid
pro
toco
ls (n
= 6
) EMR—Lipid with buffer
EMR—Lipid with water

14
After EMR—Lipid cleanup, the supernatant is approximately a1:1 ACN:aqueous mixture. An aliquot of 5 mL supernatant isthen transferred into EMR—Lipid polish tube, containing 2 gof salt mix (4:1 MgSO4:NaCl) to separate organic and aqueousphases by salt partition. This step not only partitions but alsofacilitates further matrix cleanup and removes dissolved extrasorbents and salts. Therefore, this step is highlyrecommended for both GC and LC analysis. During ourmethod development, good analyte recoveries and precisionwere achieved for all analytes except tetracyclines. Withfurther investigation, we noticed that the low recoveries oftetracyclines (45 to 68%) were related to the salt partitionstep. To reduce tetracycline loss, an alternative protocol(Figure 7) was investigated that omits the EMR—Lipid polishsalts. The procedure is similar, except that 400 µL of extract(from EMR—Lipid dSPE) and 600 µL of water were mixed in amicrocentrifuge vial and vortexed for one minute withoutusing the polish step. Samples were centrifuged on amicrocentrifuge at 13,000 rpm for three minutes, and then thesupernatant was transferred to a 2 mL sample vial forLC/MS/MS analysis. The standards and IS postspiking inmatrix blank was conducted before the mixing/dilution step.This protocol can be considered as nonpartitioning, since thepartition salts were not used.
The results in Figure 8 clearly demonstrate that the recoveriesfor tetracyclines can be substantially improved with thisalternative protocol. However, the results from using thepolish protocol (as shown in Figure 2) for tetracyclines couldbe acceptable, since the precision is for quantitation. The lowrecoveries can be corrected by using an appropriate stablelabeled internal standard. In this study, we split extractedsamples for the alternative nonpolish protocol after EMR—Lipid cleanup, and reported three results fortetracyclines (oxytetracycline, chlortetracycline, anddoxycycline) from the alternative protocol.
Method comparisonThe optimized EMR—Lipid method was then compared with atraditional QuEChERS method with C18 dSPE cleanup andzirconia sorbent cleanup. QuEChERS is often used for analyteor residue extraction, and employs a dSPE cleanup step.Figure 9 shows the statistical recovery comparison results,and Figure 10 shows the comparison for selected, problematicanalytes. The optimized EMR—Lipid protocol providessignificant improvements for recovery and precision of theproblematic analytes, especially with respect to zirconiasorbent, which gives low recoveries for fluoroquinolone andtetracycline classes. Only oxytetracycline and niclosamidegave absolute recoveries of 67% and 68%, respectively.However, the precision for these two compounds for six
Samples after EMR—Lipid cleanup
Combine 400 µL of above supernatant with 600 µL water in a 2 mL snap-cap centrifuge vial.
Vortex and centrifuge.
Samples are ready for LC triple quadrupole analysis.
Postspike STD and IS into matrix blank to make matrix-matched calibration standards.
Figure 7. Optional procedure after Agilent Bond Elut EMR—Lipid. cleanup to improve tetracycline recoveries.
EMR—Lipid without polishEMR—Lipid with polish
0
20
40
60
80
100
120
Oxytetracycline Chlortetracycline Doxycycline
Ana
lyte
rec
over
ies
% (n
= 6
) for
live
r sam
ples
fo
rtif
ied
wit
h 10
ng/
g ve
t dru
gs s
tand
ard
Figure 8. Tetracycline recovery and precision comparison forliver samples prepared with and without a polish stepfollowing cleanup with Agilent Bond Elut EMR—Lipid.
Recovery <70%Recovery 70 to 120%Recovery >120%
0
5
10
15
20
25
30
EMR—Lipid QuEChERS with C18 dSPE
QuEChERS with zirconia sorbent
Num
ber o
f vet
dru
gs te
sted
in b
ovin
e liv
er
Figure 9. Statistical recovery results for comparison of Agilent Bond Elut EMR—Lipid protocol with traditionalQuEChERS protocols.

15
replicates was acceptable with RSD of 12.8% and 2.0%,respectively, considered as acceptable based on SANCOguidelines [9]. These results are superior to results from theother two protocols employing dSPE with C18 and zirconiasorbents.
Method validationThe optimized EMR—Lipid method was validated by runninga full quantitation batch, using the method described in thesample preparation section. Internal standard (flunixin-d3 forpositive and negative mode) was used for quantitation ofaccuracy and precision. The absolute recovery of flunixin-d3was from 90 to 100%. Therefore, accuracy closely
corresponds to absolute recoveries. Table 4 shows thequantitation results. Summarized accuracy (Figure 11) wasgenerated by determining accuracy and precision for 24 QCsat four different levels (G1 = 10, 50, 250, and 750 ppb andG2 = 2, 10, 50, and 150 ppb; see calibration standard section),with six replicates at each level. Acceptable accuracies (70 to120%) were achieved for 93% of analytes, except for twooutliers, which are slightly below 70% recovery, with goodRSDs. The RSD values for six replicates at each level wereexceptional, at below 10% for most compounds. It should benoted that ractopamine and ketoprofen were detected at lowlevels in the BL blank, resulting in the modified calibrationrange.
Figure 10. Selected analyte recovery results comparing the Agilent Bond ElutEnhanced Matrix Removal-Lipid protocol with traditional protocols.Chlortetracycline and doxycycline results were generated from an alternativeprotocol shown in Figure 6. The rest of the compounds used the protocol inFigure 1.
0
20
40
60
80
100
120
2-Thioura
cil
Lincomycin
Norfloxa
cin
Ciproflo
xacin
Cefazo
lin
Chlortetra
cyclin
e
Doxycyc
line
Ave
rage
rec
over
y %
(n =
6) i
n 50
ppb
vet
dru
gs s
pike
d bo
vine
live
r sam
ples
EMR—LipidQuEChERS with C18 dSPEQuEChERS with zirconia sorbent

Groupno. Analyte
Calibration curve Method recovery and precision (ng/g QCs)
Regressionfit/weight R2
Cal. range(ng/g)
2 10 50 150 250 750
Rec% RSD Rec% RSD Rec% RSD Rec% RSD Rec% RSD Rec% RSD
1 2-Thiouracil Linear, 1/x 0.9976 5-1,000 -- -- 106.6 4.9 93.6 5.4 -- -- 87.0 3.0 85.4 8.3
1 Amoxicillin Linear, 1/x 0.9978 5-1,000 -- -- 65.9 12.1 74.3 8.8 -- -- 79.5 4.1 79.7 4.8
1 Methonidazole-OH Linear, 1/x 0.9981 5-1,000 -- -- 92.6 15.1 89.4 6.6 -- -- 89.4 3.5 89.7 3.3
1 Oxytetracycline Linear, 1/x 0.9963 5-1,000 -- -- 73.9 19.1 71.2 14.0 -- -- 67.0 12.8 63.4 9.0
1 Cefazolin Linear, 1/x 0.9966 5-1,000 -- -- 72.1 9.4 81.2 2.7 -- -- 86.7 3.8 82.9 3.0
1 Difloxacin Linear, 1/x 0.9978 5-1,000 -- -- 79.0 8.3 86.5 5.9 -- -- 104.4 5.1 97.7 6.3
1 Chlortetracycine Linear, 1/x 0.9928 5-1,000 -- -- 100.6 14.1 96.9 9.5 -- -- 93.8 14.0 85.0 11.6
1 Doxycycline Linear, 1/x 0.9972 5-1,000 -- -- 118.9 12.0 102.7 10.0 -- -- 110.0 7.7 104.5 8.6
1 Florfenicol Linear, 1/x 0.9942 5-1,000 -- -- 103.4 6.2 107.9 6.0 -- -- 115.2 13.5 107.0 4.0
1 Chloramphenicol Linear, 1/x 0.9962 5-1,000 -- -- 103.6 6.6 107.1 7.9 -- -- 113.7 9.8 100.9 5.2
1 Closulon Linear, 1/x 0.9954 5-1,000 -- -- 77.9 10.3 104.4 6.0 -- -- 102.2 7.1 94.3 3.3
1 Prednisone Linear, 1/x 0.9984 5-1,000 -- -- 105.9 9.1 92.1 11.1 -- -- 103.9 10.5 94.5 2.3
1 Oxyphenbutazone Linear, 1/x 0.9903 5-1,000 -- -- 93.6 3.4 91.9 5.2 -- -- 93.7 5.6 97.0 4.6
1 Melengestrol acetate Linear, 1/x 0.9994 5-1,000 -- -- 70.6 1.4 77.3 3.0 -- -- 82.8 2.1 77.1 2.6
1 Bithionol Quadratic, 1/x 0.9981 5-1,000 -- -- 69.4 6.2 90.4 2.9 -- -- 91.3 4.3 83.1 3.7
2 Levamisole Linear, 1/x 0.9967 1-200 84.5 11.3 95.5 5.1 103.8 5.2 89.4 9.7 -- -- -- --
2 Lincomycin Linear, 1/x 0.9950 1-200 89.5 16.4 79.6 10.6 74.1 4.5 74.8 11.2 -- -- -- --
2 Norfloxacin Linear, 1/x 0.9960 1-200 89.5 9.7 89.2 4.7 95.8 7.4 93.5 7.2 -- -- -- --
2 Ciprofloxacin Linear, 1/x 0.9980 1-200 81.0 5.6 83.6 6.9 96.9 4.1 99.5 5.9 -- -- -- --
2 Danofloxacin Linear, 1/x 0.9985 1-200 78.2 7.8 86.2 5.8 99.5 7.8 96.9 4.8 -- -- -- --
2 Ractopamine Linear, 1/x 0.9961 10-200b -- -- 98.1 15.5 105.0 10.4 102.5 6.8 -- -- -- --
2 Morantel Linear, 1/x 0.9960 1-200 89.5 4.9 95.1 4.5 101.0 8.6 94.1 7.4 -- -- -- --
2 Sulfamethizole Linear, 1/x 0.9928 1-200 85.7 14.6 89.2 8.1 93.9 4.9 88.0 10.4 -- -- -- --
2 Sulfamethoxypyridazine Linear, 1/x 0.9973 1-200 84.7 8.1 84.4 2.9 89.9 5.7 84.9 6.2 -- -- -- --
2 Tylosin Linear, 1/x 0.9967 1-200 80.6 11.2 75.6 2.7 71.0 4.5 65.3 2.3 -- -- -- --
2 Acetopromizine Linear, 1/x 0.9973 1-200 74.1 6.3 73.5 3.0 77.2 4.9 75.2 5.3 -- -- -- --
2 Chlorpromazine Linear, 1/x 0.9967 1-200 66.1 6.1 67.8 3.8 73.4 4.3 72.7 6.5 -- -- -- --
2 Fenbendazole Linear, 1/x 0.9988 1-200 74.6 7.7 82.3 4.6 97.9 9.9 84.9 3.5 -- -- -- --
2 Ketoprofen Linear, 1/x 0.9978 5-200c -- -- 88.3 7.2 98.1 6.9 94.5 3.8 -- -- -- --
2 Niclosamide Linear, 1/x 0.9996 1-200 60.0 15.3 66.6 4.7 71.7 2.0 67.6 3.1 -- -- -- --
16
Table 4. Quantitation results for target analytes using Agilent Bond Elut Enhanced Matrix Removal—Lipid. Each analyte wasassessed at four concentration levels for six replicates at each level.
a Group 1 analytes have a calibration range of 5 to 1,000 ng/g, and QC spiking levels of 10, 50, 250, and 750 ng/g. Group 2 analytes have a calibration range of1 to 200 ng/g, and QC spiking levels of 2, 10, 50, and 150 ng/g.
b Modified calibration range due to ractopamine detected in the BL control blank. c Modified calibration range due to ketoprofen detected in the BL control blank.

17
Conclusions
A rapid, reliable, and robust method using proteinprecipitation extraction followed by Agilent Bond Elut EMR—Lipid and EMR—Lipid polish cleanup was optimizedand validated for the analysis of veterinary drug multiresiduesin BL. Matrix effects were carefully assessed and comparedwith traditional C18 dSPE and zirconia sorbent cleanup.Results demonstrate that the optimized EMR—Lipid methodprovided superior matrix cleanup, and excellent recovery andprecision for this type of application.
It is important to note that direct dilution with water wasused before injection to make samples amenable toLC/MS/MS and maintain peak integrity of the early elutinganalytes. The LC/MS/MS system we used in this studyprovided adequate sensitivity for using direct sample dilution
while still meeting the detection limit requirement. Comparedto common dry-and-reconstitution, this workflow savedsignificant time and effort, and also prevented potentialdeviation and analyte loss. If instrument sensitivity cannotmeet the desired needs by direct sample dilution, a sampleconcentration step at the end should still be considered. Thisis usually achieved by sample evaporation and reconstitution.This application demonstrates that selective matrix removalusing EMR—Lipid provides significant advantages forcomplex samples such as BL, in the form of cleaner samplesand higher recoveries and precision for multiresidueveterinary drug analysis.
Future work will investigate other complex, high-lipidmatrices and target analytes to demonstrate the advantagesof clean samples when using enhanced matrix removal.
Figure 11. Quantitation of 30 representative vet drugs analyzed in BL using the optimized Agilent BondElut Enhanced Matrix Removal—Lipid protocol. The accuracy and precision data were calculated using24 total replicates at four different spike levels (n = 6 at each level). Error bar = 95% CI. Threetetracycline compound results were generated from an alternative protocol shown in Figure 6. The rest ofthe compounds used the protocol in Figure 1.
0
10
20
30
40
50
60
70
80
90
110
100
120
130
140
Ove
rall
anal
yte
accu
racy
of l
ow, m
id, a
nd h
igh
QC
s (n
= 2
4)
2-Thioura
cil
Amoxicilli
n
Metro
nidazole-O
H
Levamiso
le
Lincomycin
Norfloxa
cin
Oxytetra
cyclin
e
Ciproflo
xacin
Danofloxa
cin
Ractopamine
Mora
ntel
Cefazo
lin
Sulfameth
izole
Sulfameth
oxypyr
idazine
Difloxa
cin
Chlortetra
cyclin
e
Doxycyc
line
Florfenicol
Chloramphenicol
Tylosin
Clorsulon
Predniso
ne
Acepromazin
e
Chlorpro
mazine
Fenbendazole
Ketopro
fen
Oxyphenbuta
zone
Melengestro
l aceta
te
Niclosamide
Bithionol

www.agilent.com/chem
Agilent shall not be liable for errors contained herein or for incidental or consequentialdamages in connection with the furnishing, performance, or use of this material.
Information, descriptions, and specifications in this publication are subject to changewithout notice.
© Agilent Technologies, Inc., 2015Printed in the USAAugust 21, 20155991-6096EN
References
1. Anon. A Description of the U.S. Food Safety System,March 2000; U.S. Food and Drug Administration, U.S.Department of Agriculture, Washington DC.www.fsis.usda.gov/oa/codex/system.htm.
2. Anon. European Commission, Commission Decision of12 August 2002 implementing Council Directive96/23/EC concerning the performance of analyticalmethods and the interpretation of results; Off. J. Eur.Comm. 2002, L122, 8.
3. Anon. Administrative Maximum Residue Limits (AMRLs)and Maximum Residue Limits (MRLs) set by Canada,May 2012; Health Canada, Ottawa. www.hc-sc.gc.ca/dhp-mps/alt_formats/pdf/vet/mrl-lmr_versus_new-nouveau-eng.pdf.
4. Ellis, R. L. Food Addit. Contam. A 2008, 25, 1432-1438.
5. Fagerquist, C. K.; Lightfield, A. R.; Lehotay, S. J.Anal. Chem. 2005, 5, 1473-1482.
6. Mastovska, K.; Lightfield, A. R. J. Chromatogr. A 2008,1202, 118-123.
7. Geis-Asteggiante, L.; Lehotay, S. J.; Lightfield, A. R.;Dulko, T.; Ng, C.; Bluhm, L. J. Chromatogr. A 2012, 1258,43-54.
8. Schneider, M. J.; Lehotay, S. J.; Lightfield, A. R.Anal. Bioanal. Chem. 2015, 407, 4423.
9. Anon. Guidance Document on Analytical Quality Controland Validation Procedures for Pesticide ResiduesAnalysis in Food and Feed, SANCO/12571/2013, 19November 2013; European Commission, Health andConsumer Protection Directorate-General, Brussels,Belgium.
For More Information
These data represent typical results. For more information onour products and services, visit our Web site atwww.agilent.com/chem.