Multiplexed protein profiling on microarrays by rolling-circle amplification
7
http://biotech.nature.com • APRIL 2002 • VOLUME 20 • nature biotechnology Multiplexed protein profiling on microarrays by rolling-circle amplification Barry Schweitzer 1,3 , Scott Roberts 2 , Brian Grimwade 1 , Weiping Shao 1 , Minjuan Wang 1 , Qin Fu 1 , Quiping Shu 1 , Isabelle Laroche 1 , Zhimin Zhou 1 , Velizar T.Tchernev 1 , Jason Christiansen 1 , Mark Velleca 2 , and Stephen F. Kingsmore 1 * Fluorescent-sandwich immunoassays on microarrays hold appeal for proteomics studies, because equipment and antibodies are readily available, and assays are simple, scalable, and reproducible.The achievement of adequate sensitivity and specificity, however, requires a general method of immunoassay amplification.We describe coupling of isothermal rolling-circle amplification (RCA) to universal antibodies for this purpose. A total of 75 cytokines were measured simultaneously on glass arrays with signal amplification by RCA with high specificity, femtomolar sensitivity, 3 log quantitative range, and economy of sample consumption.A 51-feature RCA cytokine glass array was used to measure secretion from human dendritic cells (DCs) induced by lipopolysaccharide (LPS) or tumor necrosis factor-α (TNF-α). As expected, LPS induced rapid secretion of inflammatory cytokines such as macrophage inflammatory protein (MIP)-1β, interleukin (IL)-8, and interferon- inducible protein (IP)-10. We found that eotaxin-2 and I-309 were induced by LPS; in addition, macrophage- derived chemokine (MDC), thymus and activation-regulated chemokine (TARC), soluble interleukin 6 receptor (sIL-6R), and soluble tumor necrosis factor receptor I (sTNF-RI) were induced by TNF-α treatment. Because microarrays can accommodate ∼1,000 sandwich immunoassays of this type, a relatively small number of RCA microarrays seem to offer a tractable approach for proteomic surveys. RESEARCH ARTICLE Several recent reports have established the feasibility of protein arrays for a variety of applications 1–7 . To meet the emerging needs of expression proteomics, however, such arrays must yield highly mul- tiplexed, sensitive, quantitative, and reproducible measurements of protein levels. It is also desirable that assays on these arrays utilize small sample volumes and be compatible with hardware and soft- ware used by the DNA microarray industry. Microarrays of ordered immobilized capture antibodies and attendant sandwich immuno- assays are a straightforward, near-term approach for highly parallel measurement of protein levels. Polyclonal or monoclonal antibodies for several thousand proteins are available, and are being supple- mented with affinity probes generated by phage and ribosomal dis- play, affibodies, and aptamers 8–11 . Indeed, recent studies have described sensitive 12,13 or highly multiplexed 14 arrays of ordered cap- ture antibodies and sandwich immunoassays for measurement of protein levels. Concomitant achievement of adequate sensitivity and multiplexing for practical proteomics studies has not been demon- strated because unamplified immunoassays are insensitive, and con- ventional signal amplification procedures, such as enzyme-catalyzed chemiluminescence, have limited multiplexing capabilities because of signal diffusion. RCA is a useful alternative for on-chip signal amplification 15–17 . It permits sensitive and highly multiplexed assays on microarrays because RCA-amplified signals remain localized at the microarray spot (Fig. 1) 16,17 . When utilized on microarrays of printed proteins, RCA has been shown to allow detection of protein analytes with zeptomole sensitivity and broad dynamic range 16,18,19 . In the present study, we establish the utility of RCA for high-throughput analysis of protein expression on microarrays, providing assays that are highly sensitive, quantitative, and reproducible. We describe highly multiplexed, microarray immunoassays with four steps: sample application and protein capture by specific antibodies affixed to a microarray, binding of second antibodies to captured proteins, binding of a universal antibody to the second antibodies, and RCA signal amplification on the universal antibody. This approach was used to examine the time course of cytokine secretion by human DCs cultured with or without the maturation agents LPS or TNF-α (ref. 20). This study confirmed the detection of a number of cytokines that have been previously reported to be induced in DCs, and also revealed the secretion of several proteins that had not been heretofore reported. Results and discussion Antibody microarrays. Microarrays were printed on thiolsilane- coated and crosslinker-activated glass slides divided by Teflon boundaries into 16 circular analysis sites of 0.5 cm diameter, or “subarrays”. This format minimized reagent consumption, segre- gated immunoassays into relatively small groups, and allowed dif- ferent samples to be applied to each. Subarray spacing allowed automated processing by a liquid-handling robot with an eight- pipette tip head. Cytokines representing both inflammatory and homeostatic groups were chosen for analysis (Table 1), because they represented low-abundance proteins whose absolute level was of biological significance 21–24 . Within each subarray, 256 “features” were printed at known locations. Approximately 150 of these rep- resented 37–38 single monoclonal antibodies, each spotted in qua- 1 Molecular Staging, Inc., Suite 701, 300 George Street, New Haven, CT 06511. 2 Cellular Genomics, Inc., 36 East Industrial Road, Branford, CT 06405. 3 Present address: Protometrix, Inc., 66 High Street, Guilford, CT 06437. *Corresponding author ([email protected]). 359 © 2002 Nature Publishing Group http://biotech.nature.com
Transcript of Multiplexed protein profiling on microarrays by rolling-circle amplification

http://biotech.nature.com • APRIL 2002 • VOLUME 20 • nature biotechnology
Multiplexed protein profiling on microarrays byrolling-circle amplification
Barry Schweitzer1,3, Scott Roberts2, Brian Grimwade1, Weiping Shao1, Minjuan Wang1, Qin Fu1, Quiping Shu1,Isabelle Laroche1, Zhimin Zhou1, Velizar T.Tchernev1, Jason Christiansen1, Mark Velleca2, and Stephen F. Kingsmore1*
Fluorescent-sandwich immunoassays on microarrays hold appeal for proteomics studies, because equipmentand antibodies are readily available, and assays are simple, scalable, and reproducible. The achievement ofadequate sensitivity and specificity, however, requires a general method of immunoassay amplification. Wedescribe coupling of isothermal rolling-circle amplification (RCA) to universal antibodies for this purpose. Atotal of 75 cytokines were measured simultaneously on glass arrays with signal amplification by RCA with highspecificity, femtomolar sensitivity, 3 log quantitative range, and economy of sample consumption. A 51-featureRCA cytokine glass array was used to measure secretion from human dendritic cells (DCs) induced bylipopolysaccharide (LPS) or tumor necrosis factor-α (TNF-α). As expected, LPS induced rapid secretion ofinflammatory cytokines such as macrophage inflammatory protein (MIP)-1β, interleukin (IL)-8, and interferon-inducible protein (IP)-10. We found that eotaxin-2 and I-309 were induced by LPS; in addition, macrophage-derived chemokine (MDC), thymus and activation-regulated chemokine (TARC), soluble interleukin 6 receptor(sIL-6R), and soluble tumor necrosis factor receptor I (sTNF-RI) were induced by TNF-α treatment. Becausemicroarrays can accommodate ∼ 1,000 sandwich immunoassays of this type, a relatively small number of RCAmicroarrays seem to offer a tractable approach for proteomic surveys.
RESEARCH ARTICLE
Several recent reports have established the feasibility of proteinarrays for a variety of applications1–7. To meet the emerging needs ofexpression proteomics, however, such arrays must yield highly mul-tiplexed, sensitive, quantitative, and reproducible measurements ofprotein levels. It is also desirable that assays on these arrays utilizesmall sample volumes and be compatible with hardware and soft-ware used by the DNA microarray industry. Microarrays of orderedimmobilized capture antibodies and attendant sandwich immuno-assays are a straightforward, near-term approach for highly parallelmeasurement of protein levels. Polyclonal or monoclonal antibodiesfor several thousand proteins are available, and are being supple-mented with affinity probes generated by phage and ribosomal dis-play, affibodies, and aptamers8–11. Indeed, recent studies havedescribed sensitive12,13 or highly multiplexed14 arrays of ordered cap-ture antibodies and sandwich immunoassays for measurement ofprotein levels. Concomitant achievement of adequate sensitivity andmultiplexing for practical proteomics studies has not been demon-strated because unamplified immunoassays are insensitive, and con-ventional signal amplification procedures, such as enzyme-catalyzedchemiluminescence, have limited multiplexing capabilities becauseof signal diffusion.
RCA is a useful alternative for on-chip signal amplification15–17. Itpermits sensitive and highly multiplexed assays on microarraysbecause RCA-amplified signals remain localized at the microarrayspot (Fig. 1)16,17. When utilized on microarrays of printed proteins,RCA has been shown to allow detection of protein analytes withzeptomole sensitivity and broad dynamic range16,18,19. In the presentstudy, we establish the utility of RCA for high-throughput analysis
of protein expression on microarrays, providing assays that arehighly sensitive, quantitative, and reproducible. We describe highlymultiplexed, microarray immunoassays with four steps: sampleapplication and protein capture by specific antibodies affixed to amicroarray, binding of second antibodies to captured proteins,binding of a universal antibody to the second antibodies, and RCAsignal amplification on the universal antibody. This approach wasused to examine the time course of cytokine secretion by humanDCs cultured with or without the maturation agents LPS or TNF-α(ref. 20). This study confirmed the detection of a number ofcytokines that have been previously reported to be induced in DCs,and also revealed the secretion of several proteins that had not beenheretofore reported.
Results and discussionAntibody microarrays. Microarrays were printed on thiolsilane-coated and crosslinker-activated glass slides divided by Teflonboundaries into 16 circular analysis sites of 0.5 cm diameter, or“subarrays”. This format minimized reagent consumption, segre-gated immunoassays into relatively small groups, and allowed dif-ferent samples to be applied to each. Subarray spacing allowedautomated processing by a liquid-handling robot with an eight-pipette tip head. Cytokines representing both inflammatory andhomeostatic groups were chosen for analysis (Table 1), becausethey represented low-abundance proteins whose absolute level wasof biological significance21–24. Within each subarray, 256 “features”were printed at known locations. Approximately 150 of these rep-resented 37–38 single monoclonal antibodies, each spotted in qua-
1Molecular Staging, Inc., Suite 701, 300 George Street, New Haven, CT 06511. 2Cellular Genomics, Inc., 36 East Industrial Road, Branford, CT 06405.3Present address: Protometrix, Inc., 66 High Street, Guilford, CT 06437. *Corresponding author ([email protected]).
359
©20
02 N
atu
re P
ub
lish
ing
Gro
up
h
ttp
://b
iote
ch.n
atu
re.c
om

Figure 1. Schematic representation of immunoassays with RCAsignal amplification. (A) In the adaptation of RCA used for proteinsignal amplification, the 5′ end of an oligonucleotide primer isattached to an antibody. (B) The antibody–DNA conjugate bindsto its specific target molecule; in the multiplexed microarrayimmunoassay, the targets are biotinylated secondary antibodiesand the conjugate is an anti-biotin antibody. (C) A circular DNAmolecule hybridizes to its complementary primer on theconjugate, and in the presence of DNA polymerase andnucleotides, rolling-circle replication occurs. (D) A long singleDNA molecule that represents a concatamer of complements ofthe circle DNA sequence is generated that remains attached tothe antibody. (E) This RCA product is detected by hybridization ofmultiple fluorescent, complementary oligonucleotide probes.RCA product fluorescence is measured with a conventionalmicroarray scanning device. The amount of fluorescence at eachspot is directly proportional to the amount of specific protein inthe original sample.
druplicate and each specific for a single cytokine. The remainingfeatures represented internal calibrators (dilutions of cyanin 5(Cy5)-labeled BSA) or controls for binding and signal amplifica-tion by the anti-biotin–DNA conjugate and RCA (biotin-labeledIgG). The latter features permitted standardization between subar-rays and microarrays. Thus, each microarray slide allowed mea-surements of 75 human cytokines in eight samples. Coefficients ofvariation (CV), as measured by fluorescent intensity after incuba-tion with Cy5-labeled goat anti-mouse antibody, were ∼ 10% forquadruplicate features on the array, whereas CVs between differentantibodies were ∼ 25% (see Supplementary Figure 1 on the NatureBiotechnology website). Repeated testing of antibody microarraysstored dry at 4°C indicated that there was no loss in sensitivity forat least 1 month.
Immunoassays for each of the 75 cytokines were done with arrayedcapture monoclonal antibodies and biotinylated, polyclonal, secondantibodies. Because assays were performed simultaneously with acocktail of 37–38 second antibodies applied to 37–38 capture antibod-ies on a subarray, antibodies were extensively evaluated for sensitivity,cross-reactivity, and nonspecific signals using purified cytokines, andapproximately one half were replaced. Most remaining nonspecificsignals were eliminated in the two groups of 37–38 immunoassays byiteratively switching between subarrays capture antibodies that gavenonspecific signals with particular polyclonal second antibodies.Residual cross-reactivity and nonspecific signals were minimized byoptimization of washing and blocking conditions, antibody concen-trations, and incubation times (see Supplementary Figure 2).
Sensitivity and specificity of cytokine detection by RCA.Amplification of immunoassay signals on microarrays was necessarybecause customary sensitivity using fluorescence detection withoutamplification was ∼ 1 ng/ml; this sensitivity was insufficient for mea-
surement of biologically significant cytokine perturbations(Fig. 2)21–24. Immunoassay sensitivity enhancement wasachieved by covalent attachment of an oligonucleotide forRCA priming to an anti-biotin antibody with a stoichiometryof ∼ 5:1. RCA was carried out with an 80-mer synthetic DNAcircle and a DNA polymerase, yielding, as a single product, along ribbon of single-stranded DNA after a 45 min reac-tion15,25. This product remained attached to the anti-biotinantibody and was detected by hybridization of complemen-tary fluorescent oligonucleo-tides to tandem copies of circlesequence16. RCA was done at 37°C in an isotonic buffer ofneutral pH. Nonspecific signals related to RCA were signifi-cantly less than those related to antibody cross-reactivity, andwere minimized by appropriate washing and blocking condi-tions (see Supplementary Figure 3). RCA immunoassay sensi-tivity on microarrays, as measured by serial dilution of single,purified cytokines, was femtomolar, representing more than a
1,000-fold improvement (Fig. 2A): 45 (60%) of the 75 cytokine fea-tures had a sensitivity of ≤10 pg/ml, 22 (29%) had a sensitivity of≤100 pg/ml, and 8 (11%) had a sensitivity of ≤1,000 pg/ml (Table 1).For 21 of the cytokines represented on the chip, no correspondingELISA kit is commercially available. Importantly, the dynamic rangeand precision of RCA microarray immunoassays was similar to unam-plified immunoassays (approximately 3 orders of magnitude dynamicrange with an array scanner (Fig. 2) and precision of∼ 5% CV for assays carried out on four arrays, even at low cytokineconcentrations (see Supplementary Figure 4)). Femtomolar sensitivityand 3 log dynamic range are adequate for measurement of most bio-logically relevant changes in cytokine secretion and, probably, for mostbiologically relevant changes in protein expression (Table 1)26–28.
Specificity of RCA microarray immunoassays was examined in threeways. First, microarrays were incubated with relatively high concentra-tions of 2 cytokines (1 ng/ml macrophage chemoattractant protein(MCP)-1 or fibroblast growth factor (FGF)-7), followed by detectionwith 24 biotinylated antibodies and RCA. Signals were only observed atthe appropriate features, and signal:noise ratio was >100:1 (seeSupplementary Figure 5A). Second, serial dilutions of a mixture of7 cytokines were applied to microarrays, followed by detection with 7 biotinylated antibodies and RCA. Dose-dependent signals wereobserved only at the appropriate features, and sensitivity for each was1–10 pg/ml (Fig. 2B, C). Third, a mixture of 10 cytokines (100 pg/ml)was applied to microarrays, but detection was with biotinylated poly-clonal antibodies to only 4, followed by RCA. Signals were observedonly where both cytokine and specific polyclonal antibody were present(see Supplementary Figure 5B). Low, fixed, nonspecific signal wasdetected with a few cytokines. This nonspecific signal could be elimi-nated by adsorbing secondary antibodies on mouse IgG (data notshown), but this was unnecessary in practice.
RESEARCH ARTICLE
nature biotechnology • VOLUME 20 • APRIL 2002 • http://biotech.nature.com360
DNA Primer Enzyme
Antibody Generic DNA circle
TargetSignal-generating
“decorator”
A
EDC
B
©20
02 N
atu
re P
ub
lish
ing
Gro
up
h
ttp
://b
iote
ch.n
atu
re.c
om

RESEARCH ARTICLE
Application of antibody arrays toLangerhans cell maturation. Dend-ritic cells are critical in both initiat-ing and directing the immuneresponse. DCs, which include multi-ple subsets29, sample and processantigen and then, given the properenvironmental cues, mature, mig-rate, and present these antigens tonaive T-cell populations in draininglymph nodes. An earlier version ofthe microarray consisting of 51 dif-ferent anti-cytokine antibodies wasused to study factors secreted duringmaturation of Langerhans cells(LCs), a type of DC found in the epi-dermis of skin, to shed light on LCsignals for helper T-cell (TH) matu-ration. The identification of suchcytokines is important, because LCselaborate numerous cytokines thataffect both the development of LCsand lymphocytes in the surroundingarea29,30. Factors secreted by LCs atcertain stages of differentiation ind-uce naive helper T lymphocytes (TH0)to differentiate into either TH1 or TH2
cells that, in turn, stimulate cellularor humoral immune responses, res-pectively. Following antigen stimula-tion, the relative induction of TH1
and TH2 populations is believed to bean important determinant of imm-une response and immunopatholo-gy. Synchronized LC maturationcan be induced in vitro by LPS orTNF-α (ref. 20); LPS induces LCdifferentiation to maturity, associat-ed with cytokine secretion sufficientto stimulate TH0→TH1 transition,whereas TNF-α treatment drivesLCs to an intermediate stage of dif-ferentiation, associated with cyto-kine secretion that stimulates TH0
→TH2 transition20,30.CD34+ cells from granulocyte
colony-stimulating factor (G-CSF)–treated patients were cultured with-out FCS (to allow precise measurement of secreted proteins) inmedium containing a defined cocktailof cytokines for 7–8 days. Resultantimmature LCs were isolated andrecultured for 4 days in the presenceof either LPS, TNF-α, or unsupple-mented growth medium, as des-cribed20. Supernatant samples werecollected at six time points after startof reculture, and the levels of51 cytokines in each sample weremeasured simultaneously in dupli-cate on the protein chips. The fluores-cence intensity of microarray featureswas averaged for each feature and
http://biotech.nature.com • APRIL 2002 • VOLUME 20 • nature biotechnology 361
Table 1. Performance characteristics of the 75-feature cytokine microarray
Cytokine Biological activity Mean serum levels ELISA sensitivity Array sensitivity(ED50, pg/ml) (pg/ml) (pg/ml) (pg/ml)
ANG NAa 3.6 × 10⁶ 6 5AR 5,000–15,000 NA NA 10BDNF 3,000–10,000 28,000 20 10BLC 5,000–20,000 NA NA 10CNTF 50,000–150,000 NDb 8 500EGF 100–400 336 0.7 1ENA-78 3,000–15,000 1,449 15 30EOT 10,000–20,000 70 5 5EOT-2 10,000–50,000 981 8.5 5FAS 10,000–40,000 9,406 20 50FGF-6 100–300 NA NA 300FGF-7 15,0000–25,000 ND 15 20FGF-9 1,000–2000 NA NA 100FLT-3L 500–1,000 94 7 10G-CSF 20–60 22 20 1,000GDNF 1,000–3,000 NA NA 10GM-CSF 20–80 ND 3 3GRO-α 1,000–4,000 93 10 10HCC-4 1.5–7.5 × 10⁴ NA NA 300I-309 3,000–9,000 NA NA 10IFN-α 3.8 × 10⁸ units/mg NA 25 10IFN-γ 800–1,500 ND 8 10IL-1α 30–70 ND 1 1IL-1β 13–20 5.4 1 1IL-1rA 20,000–60,000 418 22 10IL-1sRI 5 × 10⁶–1 × 10⁸ NA NA 100IL-2 250–500 ND 7 10IL-2sRa 5 × 10⁶–1 × 10⁸ 1,346 10 10IL-4 50–200 ND 10 10IL-5 100–200 ND 3 10IL-6 200–800 1.62 0.7 1IL-6sR 5,000–15,000 31,000 7 30IL-7 200–500 4 1 1IL-8 100–500 13.2 10 0.5IL-10 500–1,000 ND 3.9 100IL-12p40 50–200 77 15 30IL-12p70 50–200 ND 5 10IL-13 3,000–6,000 ND 32 20IL-15 500–2,000 ND 2 60IL-16 100,000 171 13 500IL-17 2,000–6,000 ND 15 60IL-18 NA 126 12.5 20IP-10 3,000–12,000 89 4.46 5LIF 500 ND 8 100MCP-1 5,000–20,000 370 5 1MCP-2 30,000–120,000 NA NA 5MCP-3 20,000–80,000 NA NA 10M-CSF 500–1,500 670 9 5MDC 3,000–9,000 1,089 62.5 5MIF 50,000–100,000 NA NA 100MIG 2–6 × 10⁶ NA NA 20MIP-1α 2,000–10,000 ND 10 10MIP-1β 10,000–30,000 80 11 5MIP-1δ 2,000–8,000 NA NA 50MPIF-1 2–6 x 10⁶ 536 17.5 20MSP 10,000–30,000 NA NA 50NAP-2 1–3 × 10⁶ NA NA 50NT-3 10,000–30,000 NA NA 10NT-4 5,000–15,000 NA NA 10OSM 50–300 ND 6 10PARC 5 × 10⁶–2 × 10⁸ NA NA 1PIGF NA ND 7 20RANTES 10,000–20,000 49,137 8 3SCF 2.500–5,000 984 9 5sGP130 3,000–9,000 NA NA 300TARC 3,000–9,000 331 7 10TGF-β1 15–20 48.6 7 10TGF-β3 15–30 NA NA 10TNF-α 20–50 1.25 4.4 10TNF-β 20–50 ND 16 10sTNF-RI 45,000–90,000 1,198 3 6sTNF-RII NA NA 100 50TRAIL 50,000–150,000 NA NA 1,000uPAR 50,000–150,000 2,370 33 300VEGF 5,000–10,000 220 9 30
ED50 information was obtained from product literature by R&D Systems. ELISA sensitivity information was obtained fromproduct literature provided by R&D Systems for the Quantikine Immunoassay Kits. aNA, not available; ND, not detectable.
©20
02 N
atu
re P
ub
lish
ing
Gro
up
h
ttp
://b
iote
ch.n
atu
re.c
om

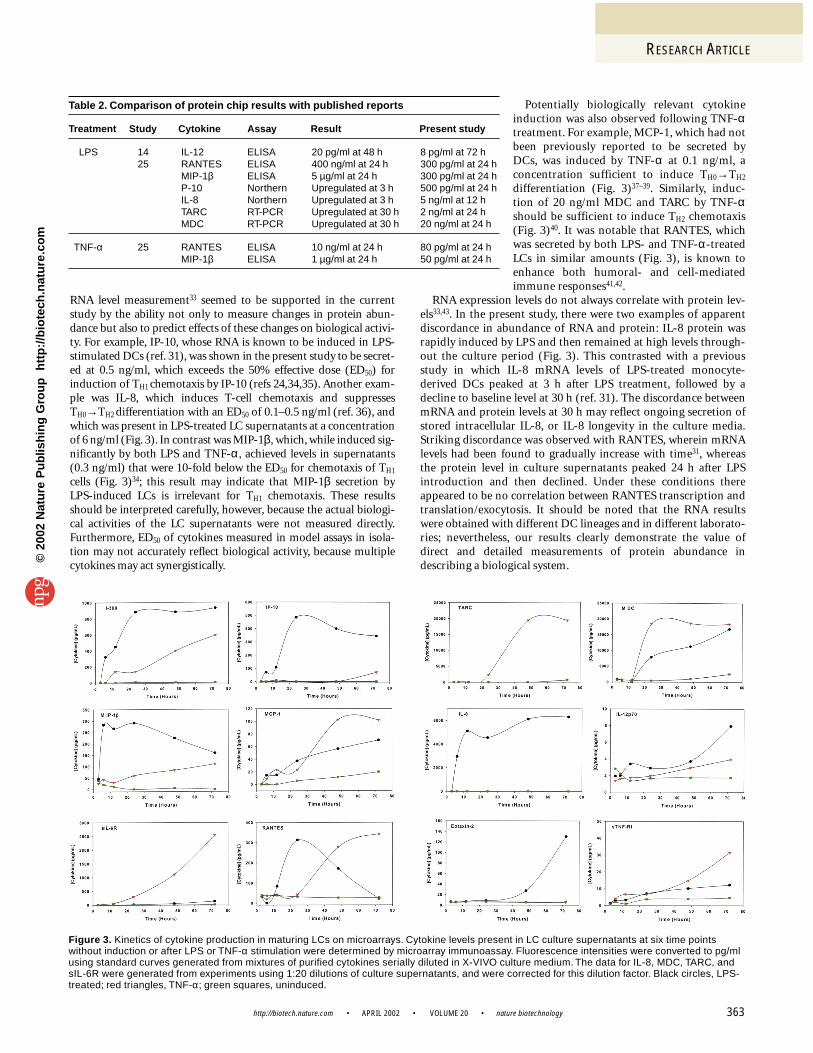
sample, and the resulting time courses of cytokine secretion were deter-mined (see Supplementary Figure 6). For selected cytokines, fluores-cence intensities were converted to protein levels with standard curvesgenerated from serial dilutions of purified analytes in unsupplementedgrowth medium (Fig. 3).
Protein chip analysis revealed that about one third of the cytokinesrepresented on the 51-feature microarray increased in abundance atleast fourfold during the 72 h culture (Fig. 4). LPS induced 16cytokines by at least fourfold, whereas TNF-α induced 12. Only 3cytokines were secreted by LCs cultured without addition of LPS orTNF-α; in no case was a cytokine secreted in untreated LCs but not inLPS- or TNF-α-treated cells. In contrast, 6 cytokines (IL-1β, IL-6,IL-8, IL-11, IL-12, and CNTF) were specifically induced by LPS, and 1
cytokine (ANG) was induced only by TNF-α (Fig. 4). A total of 9cytokines (Eot-2, I-309, IP-10, MCP-1, RANTES, MIP-1β, IL-6sR,TARC, and MDC) were induced by both LPS and TNF-α, althoughthe levels and time course of secretion induced by the treatments wereusually significantly different (Fig. 3). It was clear, therefore, that mul-tiplexed measurements of cytokine secretion on these chips were use-ful for characterizing LC activity during induced differentiation.
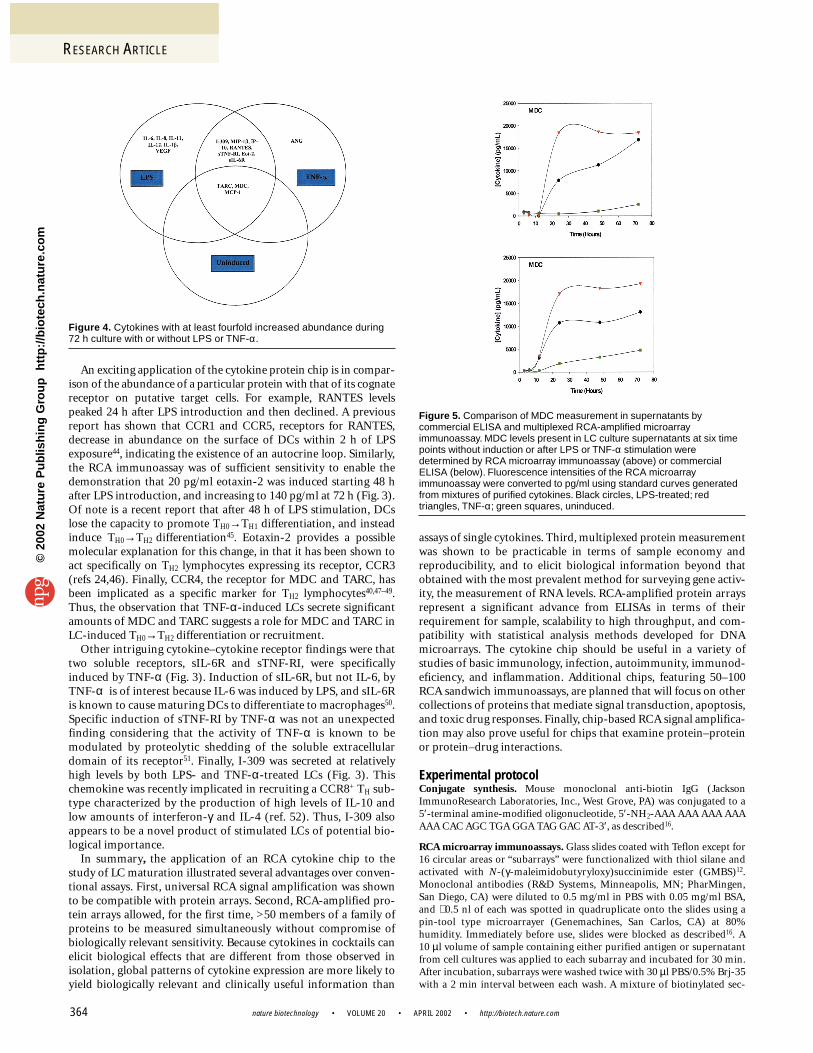
Validation of the cytokine microarray. We validated the resultsobtained with our protein chip platform by comparison with theresults of previous studies and conventional formats (Table 2). MDC,for example, was induced sufficiently to allow reliable confirmationof the microarray data with a less sensitive ELISA assay. Results fromboth assays were concordant (Fig. 5), although the ELISA assay wouldhave consumed 1,000-fold more sample to produce the data acquiredwith the microarray. MDC and a related chemokine, TARC, havepreviously been shown by RT-PCR to be induced in DCs by LPS(Table 2)31. Our results confirmed these findings but also extendedthem by demonstrating that MDC and TARC are induced by TNF-αwith faster kinetics and a greater abundance than LPS (Fig. 3).Concordance with previous studies was also found with IL-8, IP-10,IL-12, MIP-1β, and RANTES, all of which were induced with LPS(Table 2, Fig. 3)20,31,32. Of note were IL-12p70, RANTES, and MIP-1βinduction by LPS; previous studies have shown greater induction ofthese cytokines in monocyte-derived DCs than was observed withLCs in the current study. As has been shown for IL-12p70 (ref. 14),this may reflect differences between monocyte-derived DCs and LCs,rather than immunoassay platform differences. These discrepanciesnotwithstanding, the observed patterns of cytokine expression wereconsistent with previous studies of LPS- and TNF-α-treated LCs,attesting to the validity of the cytokine microarray method.
Insights and future applications. The suggestion that quantitative-expression proteomics surveys are of greater biological relevance than
RESEARCH ARTICLE
nature biotechnology • VOLUME 20 • APRIL 2002 • http://biotech.nature.com362
A B
C
Figure 2. Sensitivity of cytokine detection by RCA and direct detection.(A) Serial dilutions of individual cytokines were incubated on duplicatesubarrays. On one set of subarrays, detection was carried out using RCAsignal amplification. On the second set of subarrays, “direct” detectionwas performed using Cy5-labeled streptavidin. Fluorescence intensity ofeach spot was measured with a microarray scanner, and averages of theeight replicates of each antibody were plotted. (B) Seven cytokines weremixed, serially diluted, and incubated on subarrays containing monoclonalantibodies spotted in quadruplicate columns. Shown are fluorescenceimages of subarrays obtained with a microarray scanner. Top row ofquadruplicate columns, left to right: MIP-1β, TARC, MCP-1, RANTES;bottom row of quadruplicate columns, left to right: sIL-6R, MDC, I-309,biotin-mIgG (positive control). (C) Indicated on each graph are meanfluorescence intensities and standard deviations derived from twosubarrays, with four spots per subarray.
©20
02 N
atu
re P
ub
lish
ing
Gro
up
h
ttp
://b
iote
ch.n
atu
re.c
om
RESEARCH ARTICLE
RNA level measurement33 seemed to be supported in the currentstudy by the ability not only to measure changes in protein abun-dance but also to predict effects of these changes on biological activi-ty. For example, IP-10, whose RNA is known to be induced in LPS-stimulated DCs (ref. 31), was shown in the present study to be secret-ed at 0.5 ng/ml, which exceeds the 50% effective dose (ED50) forinduction of TH1 chemotaxis by IP-10 (refs 24,34,35). Another exam-ple was IL-8, which induces T-cell chemotaxis and suppressesTH0→TH2 differentiation with an ED50 of 0.1–0.5 ng/ml (ref. 36), andwhich was present in LPS-treated LC supernatants at a concentrationof 6 ng/ml (Fig. 3). In contrast was MIP-1β,which, while induced sig-nificantly by both LPS and TNF-α, achieved levels in supernatants(0.3 ng/ml) that were 10-fold below the ED50 for chemotaxis of TH1
cells (Fig. 3)34; this result may indicate that MIP-1β secretion by LPS-induced LCs is irrelevant for TH1 chemotaxis. These resultsshould be interpreted carefully, however, because the actual biologi-cal activities of the LC supernatants were not measured directly.Furthermore, ED50 of cytokines measured in model assays in isola-tion may not accurately reflect biological activity, because multiplecytokines may act synergistically.
Potentially biologically relevant cytokineinduction was also observed following TNF-αtreatment. For example, MCP-1, which had notbeen previously reported to be secreted byDCs, was induced by TNF-α at 0.1 ng/ml, aconcentration sufficient to induce TH0→TH2
differentiation (Fig. 3)37–39. Similarly, induc-tion of 20 ng/ml MDC and TARC by TNF-αshould be sufficient to induce TH2 chemotaxis(Fig. 3)40. It was notable that RANTES, whichwas secreted by both LPS- and TNF-α-treatedLCs in similar amounts (Fig. 3), is known toenhance both humoral- and cell-mediatedimmune responses41,42.
RNA expression levels do not always correlate with protein lev-els33,43. In the present study, there were two examples of apparentdiscordance in abundance of RNA and protein: IL-8 protein wasrapidly induced by LPS and then remained at high levels through-out the culture period (Fig. 3). This contrasted with a previousstudy in which IL-8 mRNA levels of LPS-treated monocyte-derived DCs peaked at 3 h after LPS treatment, followed by adecline to baseline level at 30 h (ref. 31). The discordance betweenmRNA and protein levels at 30 h may reflect ongoing secretion ofstored intracellular IL-8, or IL-8 longevity in the culture media.Striking discordance was observed with RANTES, wherein mRNAlevels had been found to gradually increase with time31, whereasthe protein level in culture supernatants peaked 24 h after LPSintroduction and then declined. Under these conditions thereappeared to be no correlation between RANTES transcription andtranslation/exocytosis. It should be noted that the RNA resultswere obtained with different DC lineages and in different laborato-ries; nevertheless, our results clearly demonstrate the value ofdirect and detailed measurements of protein abundance indescribing a biological system.
http://biotech.nature.com • APRIL 2002 • VOLUME 20 • nature biotechnology 363
Table 2. Comparison of protein chip results with published reports
Treatment Study Cytokine Assay Result Present study
LPS 14 IL-12 ELISA 20 pg/ml at 48 h 8 pg/ml at 72 h25 RANTES ELISA 400 ng/ml at 24 h 300 pg/ml at 24 h
MIP-1β ELISA 5 µg/ml at 24 h 300 pg/ml at 24 hP-10 Northern Upregulated at 3 h 500 pg/ml at 24 hIL-8 Northern Upregulated at 3 h 5 ng/ml at 12 hTARC RT-PCR Upregulated at 30 h 2 ng/ml at 24 hMDC RT-PCR Upregulated at 30 h 20 ng/ml at 24 h
TNF-α 25 RANTES ELISA 10 ng/ml at 24 h 80 pg/ml at 24 hMIP-1β ELISA 1 µg/ml at 24 h 50 pg/ml at 24 h
Figure 3. Kinetics of cytokine production in maturing LCs on microarrays. Cytokine levels present in LC culture supernatants at six time pointswithout induction or after LPS or TNF-α stimulation were determined by microarray immunoassay. Fluorescence intensities were converted to pg/mlusing standard curves generated from mixtures of purified cytokines serially diluted in X-VIVO culture medium. The data for IL-8, MDC, TARC, andsIL-6R were generated from experiments using 1:20 dilutions of culture supernatants, and were corrected for this dilution factor. Black circles, LPS-treated; red triangles, TNF-α; green squares, uninduced.
©20
02 N
atu
re P
ub
lish
ing
Gro
up
h
ttp
://b
iote
ch.n
atu
re.c
om
An exciting application of the cytokine protein chip is in compar-ison of the abundance of a particular protein with that of its cognatereceptor on putative target cells. For example, RANTES levelspeaked 24 h after LPS introduction and then declined. A previousreport has shown that CCR1 and CCR5, receptors for RANTES,decrease in abundance on the surface of DCs within 2 h of LPSexposure44, indicating the existence of an autocrine loop. Similarly,the RCA immunoassay was of sufficient sensitivity to enable thedemonstration that 20 pg/ml eotaxin-2 was induced starting 48 hafter LPS introduction, and increasing to 140 pg/ml at 72 h (Fig. 3).Of note is a recent report that after 48 h of LPS stimulation, DCslose the capacity to promote TH0→TH1 differentiation, and insteadinduce TH0→TH2 differentiation45. Eotaxin-2 provides a possiblemolecular explanation for this change, in that it has been shown toact specifically on TH2 lymphocytes expressing its receptor, CCR3(refs 24,46). Finally, CCR4, the receptor for MDC and TARC, hasbeen implicated as a specific marker for TH2 lymphocytes40,47–49.Thus, the observation that TNF-α-induced LCs secrete significantamounts of MDC and TARC suggests a role for MDC and TARC inLC-induced TH0→TH2 differentiation or recruitment.
Other intriguing cytokine–cytokine receptor findings were thattwo soluble receptors, sIL-6R and sTNF-RI, were specificallyinduced by TNF-α (Fig. 3). Induction of sIL-6R, but not IL-6, byTNF-α is of interest because IL-6 was induced by LPS, and sIL-6Ris known to cause maturing DCs to differentiate to macrophages50.Specific induction of sTNF-RI by TNF-α was not an unexpectedfinding considering that the activity of TNF-α is known to bemodulated by proteolytic shedding of the soluble extracellulardomain of its receptor51. Finally, I-309 was secreted at relativelyhigh levels by both LPS- and TNF-α-treated LCs (Fig. 3). Thischemokine was recently implicated in recruiting a CCR8+ TH sub-type characterized by the production of high levels of IL-10 andlow amounts of interferon-γ and IL-4 (ref. 52). Thus, I-309 alsoappears to be a novel product of stimulated LCs of potential bio-logical importance.
In summary, the application of an RCA cytokine chip to thestudy of LC maturation illustrated several advantages over conven-tional assays. First, universal RCA signal amplification was shownto be compatible with protein arrays. Second, RCA-amplified pro-tein arrays allowed, for the first time, >50 members of a family ofproteins to be measured simultaneously without compromise ofbiologically relevant sensitivity. Because cytokines in cocktails canelicit biological effects that are different from those observed inisolation, global patterns of cytokine expression are more likely toyield biologically relevant and clinically useful information than
assays of single cytokines. Third, multiplexed protein measurementwas shown to be practicable in terms of sample economy andreproducibility, and to elicit biological information beyond thatobtained with the most prevalent method for surveying gene activ-ity, the measurement of RNA levels. RCA-amplified protein arraysrepresent a significant advance from ELISAs in terms of theirrequirement for sample, scalability to high throughput, and com-patibility with statistical analysis methods developed for DNAmicroarrays. The cytokine chip should be useful in a variety ofstudies of basic immunology, infection, autoimmunity, immunod-eficiency, and inflammation. Additional chips, featuring 50–100RCA sandwich immunoassays, are planned that will focus on othercollections of proteins that mediate signal transduction, apoptosis,and toxic drug responses. Finally, chip-based RCA signal amplifica-tion may also prove useful for chips that examine protein–proteinor protein–drug interactions.
Experimental protocolConjugate synthesis. Mouse monoclonal anti-biotin IgG (JacksonImmunoResearch Laboratories, Inc., West Grove, PA) was conjugated to a5′-terminal amine-modified oligonucleotide, 5′-NH2-AAA AAA AAA AAAAAA CAC AGC TGA GGA TAG GAC AT-3′ , as described16.
RCA microarray immunoassays. Glass slides coated with Teflon except for16 circular areas or “subarrays” were functionalized with thiol silane andactivated with N-(γ-maleimidobutyryloxy)succinimide ester (GMBS)12.Monoclonal antibodies (R&D Systems, Minneapolis, MN; PharMingen,San Diego, CA) were diluted to 0.5 mg/ml in PBS with 0.05 mg/ml BSA,and ∼ 0.5 nl of each was spotted in quadruplicate onto the slides using apin-tool type microarrayer (Genemachines, San Carlos, CA) at 80%humidity. Immediately before use, slides were blocked as described16. A 10 µl volume of sample containing either purified antigen or supernatantfrom cell cultures was applied to each subarray and incubated for 30 min.After incubation, subarrays were washed twice with 30 µl PBS/0.5% Brj-35with a 2 min interval between each wash. A mixture of biotinylated sec-
RESEARCH ARTICLE
nature biotechnology • VOLUME 20 • APRIL 2002 • http://biotech.nature.com364
Figure 4. Cytokines with at least fourfold increased abundance during72 h culture with or without LPS or TNF-α.
Figure 5. Comparison of MDC measurement in supernatants bycommercial ELISA and multiplexed RCA-amplified microarrayimmunoassay. MDC levels present in LC culture supernatants at six timepoints without induction or after LPS or TNF-α stimulation weredetermined by RCA microarray immunoassay (above) or commercialELISA (below). Fluorescence intensities of the RCA microarrayimmunoassay were converted to pg/ml using standard curves generatedfrom mixtures of purified cytokines. Black circles, LPS-treated; redtriangles, TNF-α; green squares, uninduced.
©20
02 N
atu
re P
ub
lish
ing
Gro
up
h
ttp
://b
iote
ch.n
atu
re.c
om

RESEARCH ARTICLE
ondary antibodies (25 µl diluted to 0.1 µg/ml in PBS/0.5% Brj-35) wasapplied to each subarray, incubated for 30 min, and washed as describedabove.
The anti-biotin antibody conjugate was annealed for 30 min in PBS/0.5%Brj-35/2 mM EDTA at 37°C with an oligonucleotide (5′-CTC AGC TGTGTA ACA ACA TGA AGA TTG TAG GTC AGA ACT CAC CTG TTA GAAACT GTG AAG ATC GCT TAT TAT GTC CTA TC-3′) that had been circu-larized as described15. A total of 25 µl was applied to each subarray and, afterincubation for 30 min, microarrays were washed twice. The RCA reactionwas carried out for 45 min at 37°C in a 25 µl volume containing T7 nativeDNA polymerase as described16 in the presence of 0.05 µM detector probe5′-Cy5-TGT CCT ATC CTC AGC TGG-Cy5.
Note: Supplementary information is available on the Nature Biotechnologywebsite.
AcknowledgmentsWe thank K. Kukanskis and S. Cooley (MSI) for manufacturing the proteinmicroarrays used in this study. We also thank Ron Lennox for suggesting the col-laboration between Molecular Staging, Inc. and Cellular Genomics, Inc.
Competing interests statementThe authors declare competing financial interests: see the NatureBiotechnology website (http://biotech.nature.com) for details.
Received 2 October 2001; accepted 6 February 2002
http://biotech.nature.com • APRIL 2002 • VOLUME 20 • nature biotechnology 365
1. Bussow, K. et al. A method for global protein expression and antibody screeningon high-density filters of an arrayed cDNA library. Nucleic Acids Res. 26,5007–5008 (1998).
2. Leuking, A. et al. Protein microarrays for gene expression and antibody screening.Anal. Biochem. 270, 103–111 (1999).
3. Ge, H. UPA, a universal protein array system for quantitative detection of pro-tein–protein, protein–DNA, protein–RNA and protein–ligand interactions. NucleicAcids Res. 28, e3 (2000).
4. de Wildt, R.M.T., Mundy, C.R., Gorick, B.D. & Tomlinson, I.M. Antibody arrays forhigh-throughput screening of antibody–antigen interactions. Nat. Biotechnol. 18,989–994 (2000).
5. MacBeath, G. & Schreiber, S.L. Printing proteins as microarrays for high-through-put function determination. Science 289, 1760–1763 (2000).
6. Zhu, H. et al. Global analysis of protein activities using proteome chips. Science293, 2101–2105 (2001).
7. Mendoza, L.G. et al. High-throughput microarray-based enzyme-linkedimmunoabsorbant assay (ELISA). Biotechniques 27, 778–788 (1999).
8. Holt, L.J., Enever, C., de Wildt, R.M. & Tomlinson, I.M. The use of recombinantantibodies in proteomics. Curr. Opin. Biotechnol. 11, 445–449 (2000).
9. Hanes, J., Schaffitzel, C., Knappik, A. & Pluckthun, A. Picomolar affinity antibodiesfrom a fully synthetic naive library selected and evolved by ribosome display. Nat.Biotechnol. 18, 1287–1292 (2000).
10. Lohse, P.A. & Wright, M.C. In vitro protein display in drug discovery. Curr. Opin.Drug Discov. Devel. 4, 198–204 (2001).
11. Nord, K., Gunneriusson, E., Uhlén, M. & Nygren, P.-Å. Ligands selected from com-binatorial libraries of protein A for use in affinity capture of apolipoprotein A-1Mand Taq DNA polymerase. J. Biotechnol. 80, 45–54 (2000).
12. Wiese, R., Belosludtsev, Y., Powdrill, T., Thompson, P. & Hogan, M. Simultaneousmultianalyte ELISA performed on a microarray platform. Clin. Chem. 47,1451–1457 (2001).
13. Moody, M.D., Van Arsdell, S.W., Murphy, K.P., Orencole, S.F. & Burns, C. Array-based ELISAs for high-throughput analysis of human cytokines. Biotechniques31, 186–194 (2001).
14. Haab, B.B., Dunham, M.J. & Brown, P.O. Protein microarrays for highly paralleldetection and quantitation of specific proteins and antibodies in complex solu-tions. Genome Biol. 2, 1–13 (2001).
15. Lizardi, P. et al. Mutation detection and single molecule counting using isothermalrolling circle amplification. Nat. Genet. 19, 225–232 (1998).
16. Schweitzer, B. et al. Immunoassays with rolling circle DNA amplification: a versa-tile platform for ultrasensitive antigen detection. Proc. Natl. Acad. Sci. USA 97,10113–10119 (2000).
17. Nallur, G. et al. Signal amplification by rolling circle amplification on DNA microar-rays. Nucleic Acids Res. 29, e118 (2001).
18. Wiltshire, S. et al. Detection of multiple allergen-specific IgE on microarrays byimmunoassay with rolling circle amplification. Clin. Chem. 46, 1990–1993 (2000).
19. Mullenix, M.C., Wiltshire, S., Shao, W., Kitos, G. & Schweitzer, B. Allergen-specificIgE detection on microarrays using rolling circle amplification: correlation with invitro assays for serum IgE. Clin. Chem. 47, 1926–1929 (2001).
20. Gatti, E. et al. Large-scale culture and selective maturation of human Langerhanscells from granulocyte colony-stimulating factor-mobilized CD34+ progenitors. J.Immunol. 164, 3600–3607 (2000).
21. Foster, J.R. The functions of cytokines and their uses in toxicology. Int. J. Exp.Pathol. 82, 171–192 (2001).
22. Pulendran, B., Palucka, K. & Banchereau, J. Sensing pathogens and tuningimmune responses. Science 293, 253–256 (2001).
23. Zlotnik, A. & Yoshie, O. Chemokines: a new classification system and their role inimmunity. Immunity 12, 121–127 (2000).
24. Moser, B. & Loetscher, P. Lymphocyte traffic control by chemokines. Nat. Immunol.2, 123–127 (2001).
25. Dean, F.B., Nelson, J.R., Giesler, T.L. & Lasken, R.S. Rapid amplification of plas-mid and phage DNA using phi29 DNA polymerase and multiply primed rolling cir-cle amplification. Genome Res. 11, 1095–1099 (2001).
26. Naaby-Hansen, S., Waterfield, M.D. & Cramer, R. Proteomics—post-genomic car-
tography to understand gene function. Trends Pharmacol. Sci. 22, 376–384(2001).
27. Figeys, D. Array and lab on a chip technology for protein characterization. Curr.Opin. Mol. Ther. 1, 685–694 (1999).
28. Emili, A.Q. & Cagney, G. Large-scale functional analysis using peptide or proteinarrays. Nat. Biotechnol. 18, 393–397 (2000).
29. Liu, Y-J. Dendritic cell subsets and lineages, and their functions in innate andadaptive immunity. Cell 106, 259–262 (2001).
30. Mellman, I. & Steinman, R.M. Dendritic cells: specialized and regulated antigenprocessing machines. Cell 106, 255–258 (2001).
31. Sallusto, F. et al. Distinct patterns and kinetics of chemokine production regulatedendritic cell function. Eur. J. Immunol. 29, 1617–1625 (1999).
32. Moser, M. & Murphy, K.M. Dendritic cell regulation of TH1-TH2 development. Nat.Immunol. 1, 199–205 (2000).
33. Gygi, S.P., Rochon, Y., Franza, B.R. &. Aebersold, R. Correlation between proteinand mRNA abundance in yeast. Mol. Cell. Biol. 19, 1720–1730 (1999).
34. Sebastiani, S. et al. Chemokine receptor expression and function in CD4+ T lym-phocytes with regulatory activity. J. Immunol. 166, 996–1002 (2001).
35. Loetscher, P. et al. The ligands of CXC chemokine receptor 3, I-TAC, Mig, andIP10, are natural antagonists for CCR3. J. Biol. Chem. 276, 2986–2991 (2001).
36. Gesser, B. et al. IL-8 induces T cell chemotaxis, suppresses IL-4, and up-regu-lates IL-8 production by CD4+ T cells. J. Leukoc. Biol. 59, 407–411 (1996).
37. Matsushima, K., Larsen, C.G., DuBois, G.C. & Oppenheim, J.J. Purification andcharacterization of a novel monocyte chemotactic and activating factor producedby a human myelomonocytic cell line. J. Exp. Med. 169, 1485–1490 (1989).
38. Karpus, W.J. & Kennedy, K.J. MIP-1α and MCP-1 differentially regulate acute andrelapsing autoimmune encephalomyelitis as well as Th1/Th2 lymphocyte differen-tiation. J. Leukoc. Biol. 62, 681–687 (1997).
39. Gu, L. et al. Control of TH2 polarization by the chemokine monocyte chemoattrac-tant protein-1. Nature 404, 407–411 (2000).
40. Imai, T. et al. Selective recruitment of CCR4-bearing Th2 cells toward antigen-pre-senting cells by the CC chemokines thymus and activation-regulated chemokineand macrophage-derived chemokine. Int. Immunol. 11, 81–88 (1999).
41. Lillard, J.W. Jr., Boyaka, P.N., Taub, D.D. & McGhee, J.R. RANTES potentiatesantigen-specific mucosal immune responses. J. Immunol. 166, 162–169 (2001).
42. Kawai, T. et al. Selective diapedesis of Th1 cells induced by endothelial cellRANTES. J. Immunol. 163, 3269–3278 (1999).
43. Harford, J.B. & Morris, D.R. Post-transcriptional gene regulation. (Wiley-Liss, Inc.,New York; 1997).
44. Sallusto, F. & Lanzavecchia, A. Understanding dendritic cell and T-lymphocyte traf-fic through the analysis of chemokine receptor expression. Immunol. Rev. 177,134–140 (2000).
45. Langenkamp, A., Messi, M., Lanzavecchia, A. & Sallusto, F. Kinetics of dendriticcell activation: impact on priming of TH1, TH2 and nonpolarized T cells. Nat.Immunol. 1, 311–316 (2000).
46. Sallusto, F., Mackay, C.R., & Lanzavecchia, A. Selective expression of the eotaxinreceptor CCR3 by human T helper 2 cells. Science 277, 2005–2008 (1997).
47. Andrew, D.P. et al. STCP-1 (MDC) CC chemokine acts specifically on chronicallyactivated Th2 lymphocytes and is produced by monocytes on stimulation with Th2cytokines IL-4 and IL-13. J. Immunol. 161, 5027–5038 (1998).
48. Imai, T. et al. Macrophage-derived chemokine is a functional ligand for the CCchemokine receptor 4. J. Biol. Chem. 273, 1764–1768 (1998).
49. Baba, M. et al. Identification of CCR6, the specific receptor for a novel lympho-cyte-directed CC chemokine LARC. J. Biol. Chem. 272, 14893–14898 (1997).
50. Chomarat, P. et al. IL-6 switches the differentiation of monocytes from dendriticcells to macrophages. Nat. Immunol. 1, 510–514 (2000).
51. Thijs, L.G. & Hack, C.E. Time course of cytokine levels in sepsis. Intensive CareMed. Suppl 2, S258–S263 (1995).
52. Cavani, A. et al. Patients with allergic contact dermatitis to nickel and nonallergicindividuals display different nickel-specific T cell responses: evidence for the pres-ence of effector CD8+ and regulatory CD4+ T cells. J. Invest. Dermatol. 111,621–628 (2000).
©20
02 N
atu
re P
ub
lish
ing
Gro
up
h
ttp
://b
iote
ch.n
atu
re.c
om


![Integrated biofabrication for electro-addressed in-film ... · microarrays, DNA amplification, fermentation, and molecular separations) [6–12]. Systems that inte-grate two or more](https://static.fdocuments.in/doc/165x107/5f7f3400cc3aca136b54356b/integrated-biofabrication-for-electro-addressed-in-film-microarrays-dna-amplification.jpg)


![Donut PCR: a rapid, portable, multiplexed, and ... · 24/04/2020 · but low multiplexing platforms (qPCR [7, 8] and isothermal amplification [9, 10]). Two notable exceptions to](https://static.fdocuments.in/doc/165x107/5f87cc4751b4e01afa751a94/donut-pcr-a-rapid-portable-multiplexed-and-24042020-but-low-multiplexing.jpg)