Multiple Pathways To Success Quarter 3 Learning Module ... · Quarter 3 Learning Module ... could...
14
Multiple Pathways To Success Quarter 3 Learning Module Aligned with Maryland State Standards Algebra 1 Other Functions Copyright July 31, 2014 – Written December 15, 2015 Prince George’s County Public Schools Board of Education of Prince George’s County, Maryland
Transcript of Multiple Pathways To Success Quarter 3 Learning Module ... · Quarter 3 Learning Module ... could...

Multiple Pathways To Success Quarter 3 Learning Module
Aligned with Maryland State Standards
Algebra 1
Other Functions
Copyright July 31, 2014 – Written December 15, 2015
Prince George’s County Public Schools Board of Education of Prince George’s County, Maryland

Dear Scholars, As you move through the Algebra I curriculum, the level of academic rigor will increase. This could potentially lead to gaps in your understanding. Therefore, this learning module has been designed to assist you in acquiring and strengthening the essential skills needed for successful completion of Algebra I Common Core. Your experiences with this module will also help to remediate misconceptions, confusion, and rebuild areas of weakness. Sincerely, Writers of the Multiple Pathways to Success Modules

Part I: Interpreting Functions
Student Learning Outcomes ● Write the correct domain for a function ● Identify the appropriate domain for a function within the context of a word
problem (e.g. when to accept/reject negative solutions, when fractional solutions are not appropriate)
Mathematical Practices
● MP1: Make sense of a problem and persevere in solving them ● MP2: Reason abstractly and quantitatively ● MP3: Construct a viable argument and critique the reasoning of others ● MP4: Model with mathematics ● MP6: Attend to precision ● MP7: Look for and make use of structure
Resources/Websites
● The following page contains the graphic organizer Common Vocabulary Associated With Law of Exponents. This organizer provides the definitions of basic vocabulary terms associated with solving equations and offers visual representations of how the terms look are actually applied in mathematics.
● Powerpoint: Domain of a Function
https://drive.google.com/open?id=0BwVrRDNmsGlSHIwdlZxUnVWREk

1. Find the domain of each of the following radical functions in interval notation.
D) E) F)
G)
2. Jake’s cell phone service costs $5 each month plus $0.35 for each minute he uses. Every fraction of a minute is rounded up to the next minute.
Part A: Draw a graph to represent the cost of using the cell phone. Part B: What is Jake’s monthly bill if he uses 124.8 minutes? Explain how you determined your answer. Part C: What if Jake’s monthly bill costs $6.50 per month for each minute he uses? Create a model to determine the monthly bill per month. Explain your reasoning.

Part II: Rate of Change
Student Learning Outcomes: ● Calculate the rate of change from an equation ● Calculate the rate of change from a graph ● Calculate the rate of change from a table of values ● Calculate the rate of change for a given interval ● Estimate the rate of change from a graph ● Describe the rate of change in terms of the context of the situation
Mathematical Practices: ● MP1: Make Sense of a Problem and Persevere ● MP2: Reason Abstractly and Quantitatively ● MP3: Construct a viable argument and critique the reasoning of others ● MP4: Model with Mathematics ● MP6: Attend to Precision ● MP7: Make Use of Structure
Resources/Websites: ● Youtube Video: Instantaneous Rate of Change of Square root Function
https://www.youtube.com/watch?v=Rj6A0ddsgY

1. One type of rectangle has lengths that are always two inches more than their widths. The function f describes the relationship between the width of this rectangle in x inches and its area, f(x), in square inches, and is represented by the table below.
x f(x)
0 0
1 3
2 8
3 15
4 24
5 35
A second type of rectangle has lengths that are always onehalf of their widths. The function g(x) = ½ describes the relationship between the width given in inches and the area, g(x) , given in(x) xg = 2
1 2 square inches of such a rectangle.
a. Use g(x) to determine the area of a rectangle of the second type if the width is 20 inches.
b. Why is (0,0) contained in the graphs of both functions? Explain the meaning of (0,0) in terms of the situations that the functions describe. c. Determine which function has a greater average rate of change on the interval 0< x < 3.
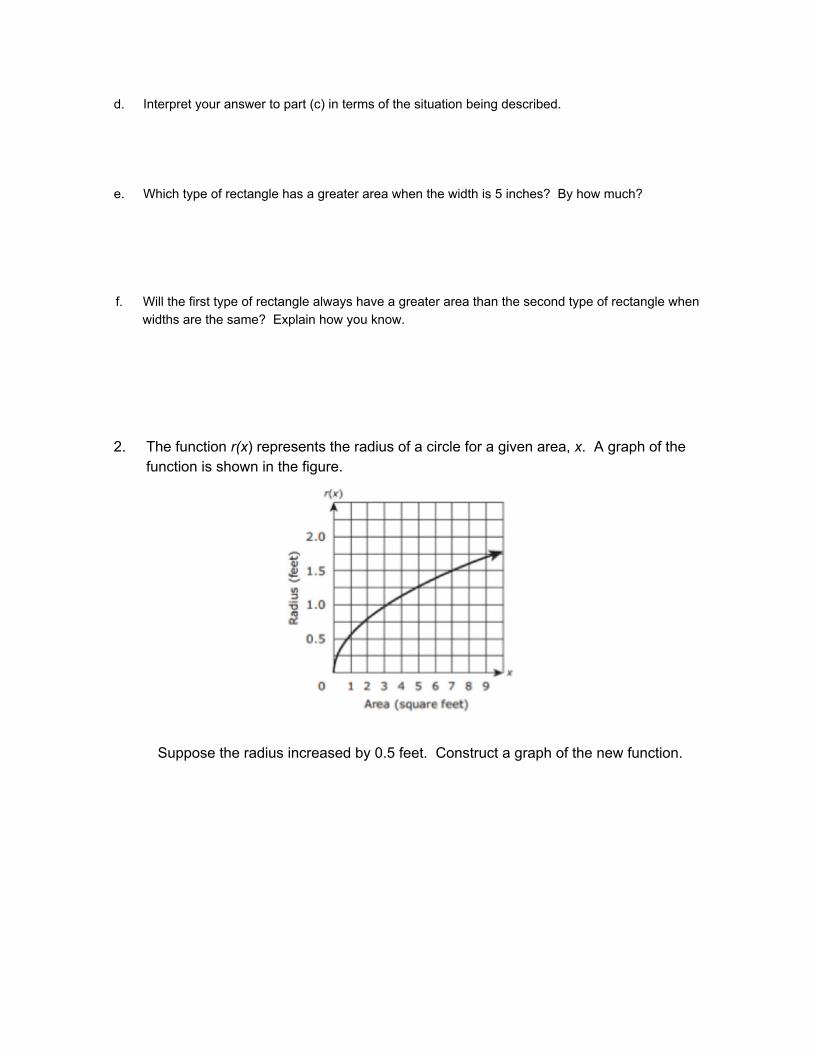
d. Interpret your answer to part (c) in terms of the situation being described. e. Which type of rectangle has a greater area when the width is 5 inches? By how much? f. Will the first type of rectangle always have a greater area than the second type of rectangle when widths are the same? Explain how you know.
2. The function r(x) represents the radius of a circle for a given area, x. A graph of the function is shown in the figure.
Suppose the radius increased by 0.5 feet. Construct a graph of the new function.

Part III: Interpreting Graphs of Functions
Student Learning Objectives: ● Graph absolute value functions. ● Graph square root functions. ● Graph cube root functions. ● Graph piecewisedefined functions. ● Graph step functions.
Mathematical Practices:
● MP1: Make Sense of a Problem and Persevere ● MP2: Reason Abstractly and Quantitatively ● MP3: Construct a viable argument and critique the reasoning of others ● MP4: Model with Mathematics ● MP6: Attend to Precision ● MP7: Make Use of Structure
Resources/Websites: ● Powerpoint: Graphing Square Root and Cube Root Functions
https://drive.google.com/open?id=0BwVrRDNmsGlQXFncVhOUEp6dzA
● Powerpoint: Graphing PieceWise, Step and Absolute Value Functions https://drive.google.com/open?id=0BwVrRDNmsGlbkpTZGtlNFJtVWs

1. Graph the following functions and find the range for each function.
a) y = √x 3+ − 5
b)
c)
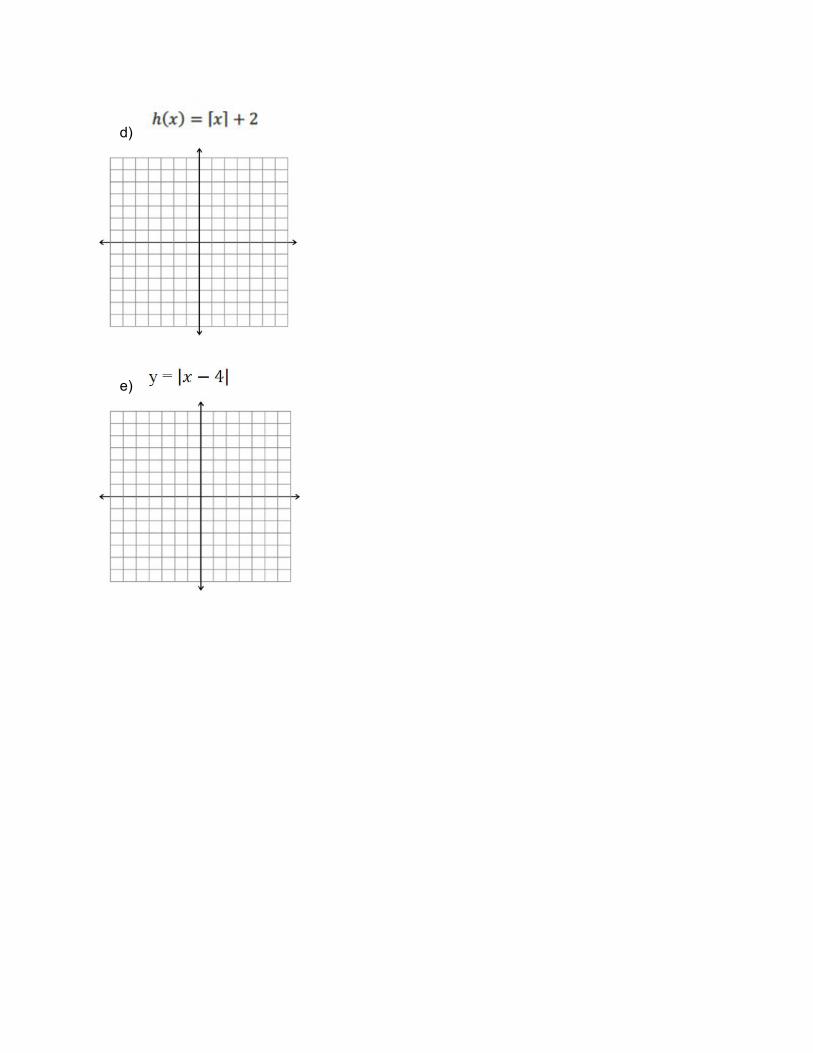
d)
e)

2. CAPACITORS A capacitor is a set of plates that can store energy in an electric field. The voltage V required to store E joules of energy in a capacitor with a capacitance of C farads is given by . V = √ C
2E Part A Rewrite and simplify the equation for the case of a 0.0002farad capacitor. Part B Graph the equation from Part A.
Part C How would the graph differ if you wished to store E + 1 joules of energy in the capacitor instead? Part D How would the graph differ if you applied a voltage of V + 1 volts instead?

Maryland College and Career Readiness Standards
F.IF.5 Relate the domain of a function to its graph and, where applicable, to the quantitative relationship it describes. (major) F.IF.6 Calculate and interpret the average rate of change of a function (presented symbolically or as a table) over a specified interval. Estimate the rate of change from a graph. (major)
F.IF.7★ Graph functions expressed symbolically and show key features of the graph, by hand in simple cases using technology for more complicated cases. b. Graph square root, cube root, and piecewisedefined functions, including step functions and absolute value functions. (supporting)
F.IF.9 Compare properties of two functions each represented in a different way (algebraically, graphically, numerically in tables, or by verbal descriptions). For example, given a graph of one quadratic function and an algebraic expression for another, say which has the larger maximum. (supporting)

Scoring Rubric / Success Criteria
Conceptual Understanding
36 Total Points
Part I: Interpreting Function
8 One point for each part of each problem
1a, 1b, 1c, 1d, 1e, 1f, 1g, 2a 4
Two points for each part of 2b and 2c
Part II: Rate of Change
4 One point for each part of each problem
1a, 1c, 1d, 2 6
Two points for each part of 1b, 1e, 1f
Part III: Interpreting Graph of Function
4 One point for each part of each problem
2a, 2b, 2c, 2d 10
Two points for each part of 1a, 1b, 1c, 1d, 1e
Execution of Mathematical Practices
12 Total Points
MP1: Make sense of a problem and persevere in solving them
● Analyze and explain the meaning of the
problem
● Actively engage in problem solving
(Develop, carry out, and refine a plan)
2
one point per bullet
MP2: Reason abstractly and quantitatively ● Represent a problem with symbols
3
one point per bullet
● Explain their thinking
● Examine the reasonableness of their
answers/calculations
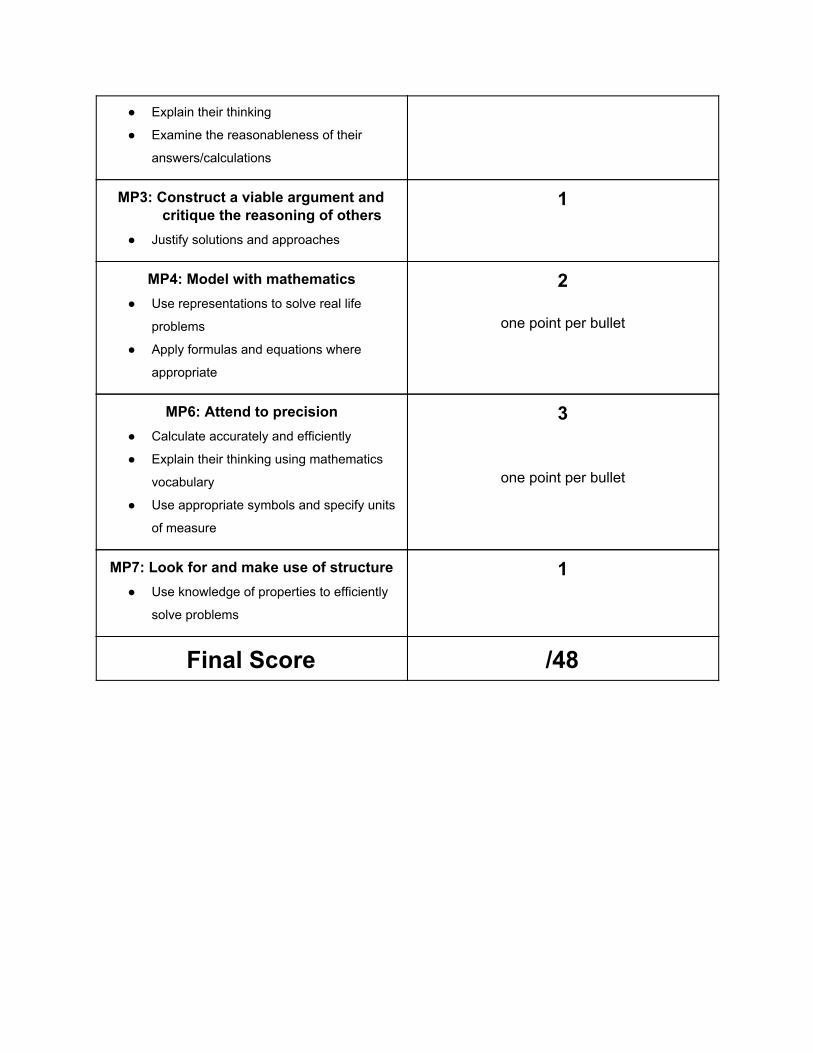
MP3: Construct a viable argument and critique the reasoning of others ● Justify solutions and approaches
1
MP4: Model with mathematics ● Use representations to solve real life
problems
● Apply formulas and equations where
appropriate
2
one point per bullet
MP6: Attend to precision ● Calculate accurately and efficiently
● Explain their thinking using mathematics
vocabulary
● Use appropriate symbols and specify units
of measure
3
one point per bullet
MP7: Look for and make use of structure ● Use knowledge of properties to efficiently
solve problems
1
Final Score /48