MULTIPLE MARKET IMPERFECTIONS, FIRM PROFITABILITY … Calcagnini... · “MULTIPLE MARKET...
33
WP-EMS Working Papers Series in Economics, Mathematics and Statistics “MULTIPLE MARKET IMPERFECTIONS, FIRM PROFITABILITY AND INVESTMENT ” • Giorgio Calcagnini (U. Urbino) • Annalisa Ferrando (European Central Bank Frankfurt ) • Germana Giombini (U. Urbino) WP-EMS # 2013/05 ISSN 1974-4110 (on line edition) ISSN 1594-7645 (print edition)
Transcript of MULTIPLE MARKET IMPERFECTIONS, FIRM PROFITABILITY … Calcagnini... · “MULTIPLE MARKET...

WP-EMSWorking Papers Series in
Economics, Mathematics and Statistics
“MULTIPLE MARKET IMPERFECTIONS, FIRM PROFITABILITY AND INVESTMENT ”
• Giorgio Calcagnini (U. Urbino) • Annalisa Ferrando (European Central Bank Frankfurt ) • Germana Giombini (U. Urbino)
WP-EMS # 2013/05
ISSN 1974-4110 (on line edition)ISSN 1594-7645 (print edition)

Multiple Market Imperfections, Firm Profitability andInvestment∗
Giorgio CalcagniniDepartment of Economics, Society, Politics, University of Urbino, and Mo.Fi.R.
Annalisa FerrandoEuropean Central Bank, Frankfurt
Germana Giombini†Department of Economics, Society, Politics, University of Urbino, and Mo.Fi.R.
Abstract
This paper investigates the impact of the interaction between product, laborand financial market imperfections on firms’ investment by using a panel data ofEuropean firms over the period 1994-2008. It studies the impact of product andlabor market regulations on firm investment and how it changes with the degreeof financial market imperfections. Findings show that product and labor marketregulations negatively affect firm investment by lowering firm profitability. Thepresence of more efficient financial markets increases firm investment and lowers thenegative effects of market regulations.
Keywords: Investment, Regulation Impact, EPL, Financial Market Development.JEL Classification: D21, D43, E22, E60.
∗This paper is one of the products of the 2007-2009 PRIN (Progetti di Ricerca di Interesse Nazionale)project on Market Imperfections, Economic Decisions, and Productivity funded by the Italian Ministryof University and Research, which we gratefully acknowledge. It benefited from comments and sug-gestions from participants at the international conference Beyond the short run: productivity growth,market imperfections and macroeconomic disequilibrium held in Rome on May 11-12th, 2012; and fromparticipants at theSwedish Entrepreneurship Forum on Regulations, Entrepreneurship and Firm Dy-namics held in Stockholm, 23-24 August 2013. We are especially grateful to R. Chirinko, E. Saltari, E.Sterken, and G. Travaglini. The usual disclaimers apply.†Corresponding author. Via Saffi 42, 61029 Urbino, Italy. E mail: [email protected]. Tel.
+39 0722 305557. Fax: +39 0722 305541.
1

Non-technical Summary
In an environment where product, labor and capital markets are imperfect, companies
should revise their investment decisions as these market imperfections may affect the
cost of external funds as well as the availability of their internal sources of finance.
Market imperfections affect investment through different channels: product and la-
bor market regulations affect firm’s investment indirectly through the level of firm prof-
itability. Capital market imperfections, instead, affect firm investment both directly,
by increasing firm access to credit (and at a lower cost), and indirectly, through their
impact on firm profitability. In this paper we test both these direct and indirect impact
by using a rich dataset that combines information on almost 120.000 firms with country
level information from eight euro area countries. We consider several indicators of mar-
ket imperfections. Labor market imperfection is measured by means of the Employment
Protection Legislation (EPL) index, according to which higher EPL values mean more
rigid labor markets. The degree of product regulation is controlled for by the OECD
Regulation Impact indicator (RII) and higher values of this indicator means that a firm
faces higher production costs because another sector that provides its products as inputs
is heavily regulated. We introduce three alternative measures of financial development:
one encompassing indicator of the overall size of capital markets and two more specific
indicators of financial efficiency and development, which, respectively, measure the de-
velopment of the credit market and the activity of financial intermediaries in channelling
savings to investors.
Empirically, our strategy is twofold. First, we investigate the role of market imper-
fections on firm profitability. We expect that labor and product market imperfections
have a negative impact on firm profitability, and then on investment. As for capital mar-
ket imperfections, a positive role played by firms’ capacity to generate internal funds is
expected, while the degree of financial market development might generate two opposite
effects on profitability. On one hand, a more developed financial market may lead to more
competitive markets, and thus to lower profitability in financially dependent sectors. On
the other, more efficient financial markets are expected to foster firm profitability and
2

investment by decreasing costs of credit access. The final impact of financial develop-
ment and efficiency depends on which of these two opposite effects prevails. Second, a
dynamic investment model is estimated by means of GMM techniques. It is assumed
that product, labor market and financial market imperfections affect firms’ profitability,
and through it investment, while financial market imperfections also influence investment
directly.
Our findings show that market regulations hamper profitability and, in turn, invest-
ment. As for capital market imperfections, estimates show that the overall effect on
investment of an improved access to external funds and higher levels of internal liquid-
ity is positive. Finally, interactions between labor, product and financial markets show
that in the presence of more efficient financial markets, the (indirect) negative impact of
market regulations on firm investment is lower.
3

1 Introduction
Recently, national and international institutions have been focussing on reducing market
imperfections as a means to stimulate economic growth. For instance, the International
Monetary Fund claims that “Further efforts are needed to address the twin challenges of
reviving growth and creating jobs. This requires actions on multiple fronts, which are
mutually reinforcing” (IMF, 2013, pag. 1).
This paper addresses the role of the interaction between product, labor and financial
market imperfections on firms’ investment by using a panel dataset containing balance
sheet information on European firms and other country-level information on financial-,
labor- and product-market regulations from 1994 to 2008.
Economic literature on the role of market imperfections on investment is large, but
fragmented. Traditionally, investment models take each type of market imperfection in
isolation with respect to the other imperfections. Therefore, for instance, there is sub-
stantial theoretical and empirical literature analyzing the role of financial constraints or
financial development on firms’ investment (for instance, Fazzari et al., 1988; Kaplan and
Zingales, 1997; Levine, 2005). Still limited is instead the number of papers that consider
how investment is affected by the contemporaneous presence of market imperfections.
Recently, some authors started analyzing investment decisions in the contemporaneous
presence of labor and financial market imperfections (Calcagnini et al., 2009; Cingano
et al., 2010; Calcagnini et al., 2013).1
This paper improves on existing literature by analyzing the simultaneous presence of
product, financial and labor market imperfections on firms’ investment by using a large
panel dataset that combines firm data with country level information. To our knowledge,
this paper is the first that attempts to capture the effects of the simultaneous presence
of multiple market imperfections on firm profitability and investment.
Balance sheet data come from Amadeus, produced by Bureau van Dijk, while market
imperfection information comes form several sources.1Example of papers that study the effects of the contemporaneous presence of markets imperfections
are Nickell and Nicolitsas, 1999; Belke and Fehn, 2000; Arnold, 2002; Blanchard and Giavazzi, 2003;Spector, 2004; Rendon, 2004; Wasmer and Weil, 2004; Povel and Raith, 2004; Amable and Ekkehard,2005; Fiori et al., 2007; Griffith et al., 2007. However, they are not concerned with investment decisions.
4

Labor market imperfection is measured by means of the Employment Protection
Legislation (EPL) index (Venn, 2009) according to which higher EPL values mean more
rigid labor markets.
The degree of product regulation is controlled for by the OECD Regulation Im-
pact indicator (RII). It measures the “knock-on” effects of non-manufacturing regulation
on the cost structures faced by firms that use the output of non-manufacturing sec-
tors as intermediate inputs in the production process: higher values of the RII mean
a higher production costs (Conway and Nicoletti, 2006). RII is used for at least three
reasons. First, non-manufacturing sectors cover around two thirds of economic activity
and, in terms of productivity growth and employment, are the most dynamic part of
the economy in many OECD countries. Second, most of economic regulations regards
non-manufacturing sectors. Moreover, because import penetration is much more lim-
ited in these sectors than in manufacturing sectors, final and intermediate consumers of
non-manufacturing products have little alternative than to purchase these products on
the domestic market. Therefore, domestic regulations are most relevant for economic
activity and the consumers’ welfare. Finally, empirical evidence on how the regulation
in non-manufacturing sectors that produce intermediate inputs affect firm profitability
and investment is scanty. 2
Capital market imperfections, caused by asymmetric information, incentive problems
and transaction costs, make external funds more expensive than internal funds, and give
rise to the existence of financing constraints. Following the pioneeristic work of Fazzari
et al. (1988), capital market imperfections are conventionally controlled for by firm-
level liquidity indicators (cash-flow, etc.) that are added as explanatory variables in
empirical investment models.3 Capital market imperfections can be thought of as the2 Research on the role of product market regulation has mainly focused on its direct effects on eco-
nomic performance, i.e: the allocation of resources between sectors and between firms; the productivityof existing firms; the pace of productivity growth (Schiantarelli, 2005). Regulatory reforms that implya reduction in entry barriers, in the markup of prices over costs and in adjustment costs tend to in-crease investment (Alesina et al., 2005). Recently, Barone and Cingano (2011) find that lower serviceregulation has non-negligible positive effects on the value added, productivity and export growth ratesof service-intensive users. For a survey of the literature on regulation and economic performance seeRincon-Aznar et al. (2010) and Arnold et al. (2011).
3Some authors are critical towards this popular approach. See Erickson and Whited (2000); Bond etal. (2004); Whited (2010); Moyen (2004).
5

sum of firm- (idiosyncratic) and country-level components. In a cross-country analysis of
firm investment decisions, keeping the two components separated would provide a more
correct way to specify empirical models and a better description of the role of this type
of market imperfection on investment. Therefore, empirical profitability and investment
models in this paper include among the regressors both idiosyncratic liquidity variables
and country-level financial variables, such as the size of capital markets, or measures of
financial efficiency and financial development (ECB, 2013).4
To study the effects of multiple market imperfections on investment, this paper follows
a two-step strategy as in Griffith et al. (2007).
In the first step, the role of market imperfections on firm profitability is studied.
Based on previous considerations, it is expected that labor and product market imper-
fections have a negative impact on firm profitability, and then on investment. As for
capital market imperfections, a positive role played by firms’ capacity to generate inter-
nal funds is expected, while the degree of financial market development might generate
two opposite effects on profitability. On one hand, a more developed financial market
may lead to more competitive markets, and thus to lower profitability in financially de-
pendent sectors, even when it reduces the number of firms and increases standard market
concentration indexes (Dellas and Fernandes, 2007). On the other, more efficient finan-
cial markets are expected to foster firm profitability and investment by decreasing costs
of credit access (Rajan and Zingales, 1998). The final impact of financial development
and efficiency depends on which of these two opposite effects prevails.
In the second step a dynamic investment model is estimated by means of GMM
techniques. The extent of product and labor market regulations on firm’s investment are
captured by the level of firm profitability. Capital market imperfections, instead, affect
firm investment both directly, by increasing firm access to credit (and at a lower cost),
and indirectly, through its impact on firm profitability.
Empirical findings show that labor and product market regulations reduce firm prof-4It is expected that the influence of idiosyncratic variates, such as the cash-flow, on investment also
depends on the degree of countries’ financial development (Love, 2003; Becker and Sivadasan, 2010).Indeed, the correlation coefficient between firm liquidity (i.e., total cash-in-hand available to the firm)and an index of financial development (i.e., financial efficiency), as shown in Tables 2 and 3, is -0.77 andstatistically significant at the 1% probability level.
6

itability, and consequently investment. As for capital market imperfections, estimates
show that the overall effect on investment of an improved access to external funds and
higher levels of internal liquidity is positive. Finally, interactions between labor, product
and financial markets show that in the presence of more efficient financial markets, the
(indirect) negative impact of market regulations on firm investment is lower.
These results have important policy implications for the ongoing debate surrounding
market deregulations. While product market regulation hampers competition and makes
the cost of inaction low, inflexible employment protection legislation reduces both firms’
incentives to experiment with uncertain growth opportunities and the reallocation of
labor to more productive uses (Biosca, 2010). Thus, the debate on Employment Pro-
tection needs to consider not only its impact on employment flows, but also its role on
investment. As for financial market imperfections, estimates show that improvements in
credit markets should stimulate firm investment by reducing the cost of external funds
and by lowering the negative impact of market regulations on investment.
The paper is organized as follows. Section 2 describes the data used, while Section
3 the empirical models and strategy. Session 4 discusses the findings, and Session 5
concludes.
2 Data Sources and Descriptive Statistics
The dataset contains observations on multiple phenomena observed over the 1994-2008
period for eight European countries (Belgium, Germany, Spain, Finland, France, Italy,
Netherlands, and Portugal) and a variable number of firms. It includes accounting
information at firm level and country-level indicators of market regulations that vary
over time across countries or industries.
Firm Data
We use the entire universe of the Bureau van Dijk (hereinafter BvD) Amadeus database
for the accounting data (both balance sheets and income statements). Amadeus is a
comprehensive, pan-European database containing accounting information. BvD col-
lects accounting information directly from a variety of sources, such as official registers,
7

regulatory bodies, annual reports, private correspondence, company websites and news
reports, and indirectly from BvD associated information providers. It further harmo-
nizes the financial accounts to allow cross-country comparisons. There are several studies
that have analyzed the limitations, but also the benefits of the Amadeus database5. For
instance, although Amadeus includes companies regardless of their size, limited coverage
may still occur because the degree of company accounts filing and publication require-
ments differ between countries. This would imply a sample selection bias towards coun-
tries with more demanding accounting standards. However, one advantage of Amadeus
is that it includes firms that are mostly private, increasing its country representativeness
in comparison with datasets based only on listed companies. The dataset includes also
many SMEs which represent the backbone of the European economy and which are par-
ticularly targeted from market imperfections in their daily activity. Another well-known
bias of the database is related to the practice of BvD to restrict the release of the finan-
cial statements to at most the preceding ten accounting years of each firm. Further, BvD
removes a firm after at least five years of no reporting data. To eliminate this potential
survivorship bias, we compile our database by collecting accounting information from
each annual release retrospectively so that we can have the complete history of data
for all firms across the entire sample period. The original dataset contains end-of-year
accounting information for the period 1993–2008. For our analysis we drop the first
one year because of poor coverage, and draw a 15 % random sample for computational
reasons. We eliminate observations when there are inputting mistakes (e.g., negative
total assets) and focus our analysis on eight non-financial sectors: 1) manufacturing,
2) construction, 3) post and telecommunication, 4) computers and related activities, 5)
R&D, 6) other business activities, 7) wholesale and retail trade and 8) transport and
storage. We keep firms with at least three years of observations, so as to have enough
information to analyze the investment behavior. We winsorize all variables at the top
and bottom 1 % of their distribution within each country and sector. After performing
our data filtering, we end up with an unbalanced panel of 117,072 firms and 569,980
firm-year observations over the 1994–2008 period. The final sample contains eight euro5See for instance Ferrando et al. (2013).
8

area countries (Belgium, Finland, France, Germany, Italy, Netherlands, Portugal, and
Spain). Table 1 shows the sample coverage. One third of the total sample is made up
of Spanish firms and together with French and Italian firms represent 85 % of the entire
sample. Firm size varies substantially across countries. The mean values of real total
assets (Size) in our sample are e 3,168 thousands (hereinafter th) with the lowest mean
value for Portuguese firms (e1,180 th) and the highest for Dutch firms (e98,659 th).
On average firms are 15 years old, with Dutch firms being on average 34 years old and
Spanish firms around 12 years old.
Table 1: Sample characteristicsThe sample includes all non-financial corporations with accounting information for at least three years
over 1994-2008
Country No obs No firms Size (eth) Age FreqBE 10,946 1,565 19,902 25 1.9DE 7,609 2,283 20,548 31 1.3ES 196,011 33,926 1,180 12 34.4FI 13,494 2,733 2,061 16 2.4FR 140,643 23,525 1,283 16 24.7IT 144,195 34,500 3,212 16 25.3NL 3,230 574 98,659 34 0.6PT 53,852 17,966 771 16 9.4Total 569,980 117,072 3,168 15 100Source: Amadeus Bureau van Dijk.
Table 2 shows descriptive statistics of all variables of interest for this paper. Prof-
itability (PROF) is defined as the ratio between operating profit/loss and fixed assets.6
The median euro area firms’ operating profits is 26 % of their fixed assets, where Finnish
and French firms show the highest level of profitability, while Portuguese and Spanish
the lowest. These figures are in line with those documented by Ferrando et al. (2013)
for the same countries. Profitability and investment rates (I/K) are positively corre-
lated, ranking countries in the same order with the exception of Finland, for which the
median investment rate is relatively low with respect to previous studies. Looking at
the cash holding-to-total-assets ratio (LIQ), French and Finnish firms are characterized
by the highest median values, while Dutch firms the lowest (almost one fifth compared6Most of the firms in the BvD Amadeus database are not listed; thus the construction of firm marginal
or average q is not feasible. It is assumed that PROF is a proxy for q.
9
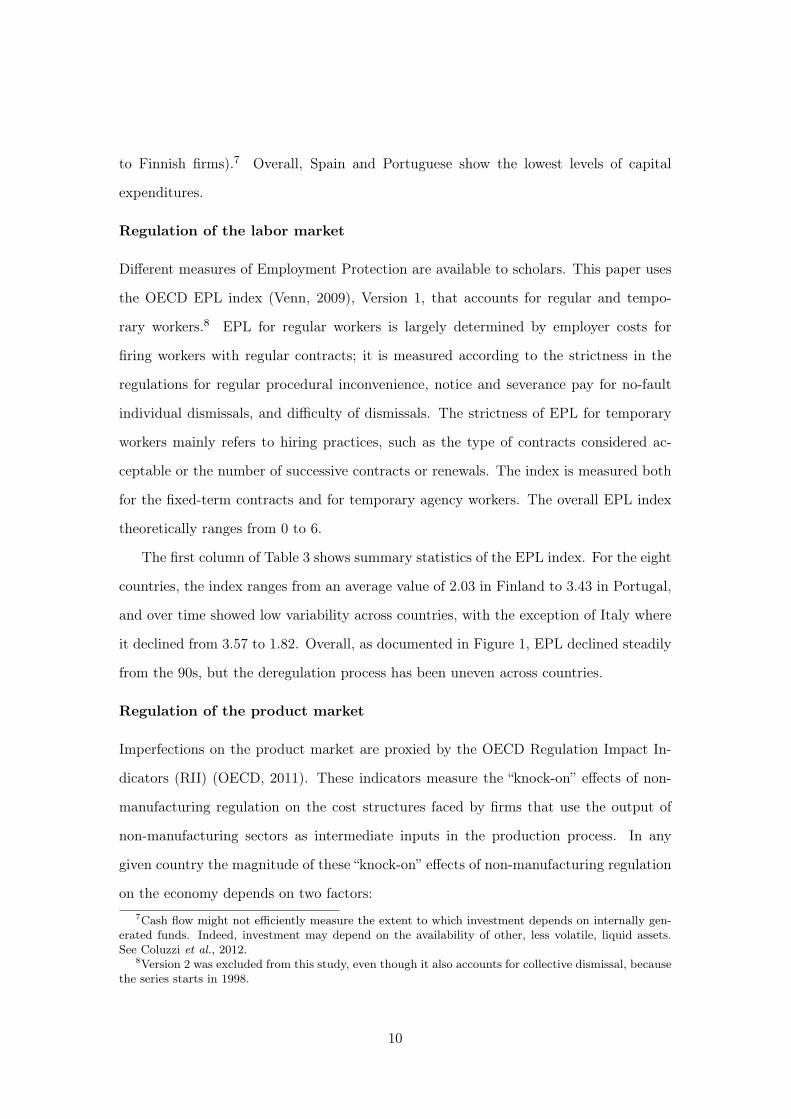
to Finnish firms).7 Overall, Spain and Portuguese show the lowest levels of capital
expenditures.
Regulation of the labor market
Different measures of Employment Protection are available to scholars. This paper uses
the OECD EPL index (Venn, 2009), Version 1, that accounts for regular and tempo-
rary workers.8 EPL for regular workers is largely determined by employer costs for
firing workers with regular contracts; it is measured according to the strictness in the
regulations for regular procedural inconvenience, notice and severance pay for no-fault
individual dismissals, and difficulty of dismissals. The strictness of EPL for temporary
workers mainly refers to hiring practices, such as the type of contracts considered ac-
ceptable or the number of successive contracts or renewals. The index is measured both
for the fixed-term contracts and for temporary agency workers. The overall EPL index
theoretically ranges from 0 to 6.
The first column of Table 3 shows summary statistics of the EPL index. For the eight
countries, the index ranges from an average value of 2.03 in Finland to 3.43 in Portugal,
and over time showed low variability across countries, with the exception of Italy where
it declined from 3.57 to 1.82. Overall, as documented in Figure 1, EPL declined steadily
from the 90s, but the deregulation process has been uneven across countries.
Regulation of the product market
Imperfections on the product market are proxied by the OECD Regulation Impact In-
dicators (RII) (OECD, 2011). These indicators measure the “knock-on” effects of non-
manufacturing regulation on the cost structures faced by firms that use the output of
non-manufacturing sectors as intermediate inputs in the production process. In any
given country the magnitude of these “knock-on” effects of non-manufacturing regulation
on the economy depends on two factors:7Cash flow might not efficiently measure the extent to which investment depends on internally gen-
erated funds. Indeed, investment may depend on the availability of other, less volatile, liquid assets.See Coluzzi et al., 2012.
8Version 2 was excluded from this study, even though it also accounts for collective dismissal, becausethe series starts in 1998.
10

Table 2: Summary statisticsThis table reports summary statistics at country level of the variables included both in the profitability
and investment models: firm profitability (PROF), investment rate (I/K), and cash-to-total-assets(LIQ). All variables are winsorized at the 1st and 99th percentiles of their distribution within each
country. Please refer to Appendix 1 for all variables definitions.
Country Statistics PROF I/K LIQBE obs 10,946 9,442 10,303
mean .715 .261 .180median .277 .199 .127
sd 1.465 .232 .164DE obs 7,609 6,221 7,290
mean .732 .296 .258median .296 .211 .203
sd 1.345 .273 .199ES obs 196,011 153,176 178,678
mean .501 .187 .133median .195 .112 .079
sd 1.031 .225 .148FI obs 13,494 10,414 12,926
mean 1.090 .208 .289median .426 .125 .227
sd 1.869 .251 .225FR obs 140,643 122,028 130,889
mean .855 .280 .271median .341 .243 .221
sd 1.558 .230 .196IT obs 144,195 117,732 132,352
mean .766 .284 .281median .312 .198 .194
sd 1.311 .279 .242NL obs 3,230 2,139 2,775
mean .690 .247 .098median .296 .183 .042
sd 1.412 .214 .131PT obs 53,852 40,362 49,372
mean .553 .164 .173median .190 .067 .089
sd 1.360 .246 .201Total obs 569,980 461,514 524,585
mean .682 .238 .215median .256 .168 .143
sd 1.326 .249 .207Source: Amadeus Bureau van Dijk.
11

Figure 1: Employment Protection Legislation Index by Country: 1994-2008
Source: OECD.
12

• the extent of anti-competitive regulation in non-manufacturing sectors, and
• the importance of these sectors as suppliers of intermediate inputs.
Using total input-output coefficients, the sectoral RII indicators in each country are
calculated as follows :
RIIk,t =∑j
NMRj,t ∗ wk,j
where the variableNMRj,t is an indicator of anti-competitive regulation in non-manufacturing
sector j at time t, and the weight wj,k is the total input requirement of sector k for in-
termediate inputs from non-manufacturing sector j.
Higher values of the RII means that a firm faces higher production costs because
another sector that provides its products as inputs is heavily regulated. Furthermore,
higher regulation in the intermediate sectors may affect the costs of entry for new firms
that use these inputs, how firms outsource these inputs, the work organization within
the firm, the resource allocation between firms and, finally, the scope for the associated
productivity improvements.9
The second column in Table 3 shows RII values. Differences in the RII across coun-
tries are more contained but more persistent than in the EPL case. Netherlands and
Germany are the two countries with the lowest mean RII, France and Belgium with the
highest. During the 1994-2008 period, RII decreased in all countries, but Portugal (see
Figure 2).
Indicators of financial development
Following previous studies, this paper uses three different measures of financial develop-
ment: the size of capital markets, financial efficiency, and financial development.
Levine and Zervos (1998) shows that the size of capital markets is a useful summary
statistic of a country’s degree of financial development. Additionally, Levine (2002)
shows that both the size of domestic securities markets and the amount of bank lending
to the non-bank private sector positively affect growth. Hence Capital Market Size (CAP
MK) is calculated as the amount of outstanding stocks, bonds and bank loans over GDP9See http://www.oecd.org/eco/reform/45654705.pdf for a description of the RII indicator.
13

Figure 2: Regulation Impact Indicator by Country: 1994-2008
Source: OECD.
14

Figure 3: Capital market size by Country: 1994-2008
Source: ECB.
(ECB, 2013). Column 5 in Table 3 shows the CAP MK values across countries. The
Netherlands has the largest capital market among the eight European countries, while
Spain, Finland and Portugal are the three countries that experienced strongest growth in
their capital markets as proxied by the difference between the maximum and minimum
CAP MK values.10
The other two measures of financial development come from the World Bank financial
structure dataset (Beck et al., 2009).
Financial Development (FIN DEV) is a measure of the relative importance of deposit
money banks relative to central banks and it is calculated as the ratio between deposit
money and Central Bank assets. This indicator of financial development could be seen
as a specific part of the encompassing indicator on the size of capital markets - the part
related to the development of the credit market- and has been used as a measure of fi-
nancial development by, among others, Levine et al. (2000). Specifically, countries where
deposit money banks have a larger role in financial intermediation than central banks can
be considered as having higher levels of financial development, and the relationship be-
tween Deposit Money vs. Central Bank Assets and economic growth is positive (Levine10However, Finland experienced a smaller contraction of its capital market than the other countries,
given that it already witnessed a story of a credit-led boom-bust cycle during the 90s and a strongfinancial crisis at the end of the 90s.
15

and Zervos, 1998). FIN DEV shows the lowest cross-country variability among the three
financial development indicators: Portugal shows the highest value, Italy the lowest (see
Table 3, column 6)
Financial Efficiency (FIN EFF) is a measure of the activity of financial intermediaries
and is calculated as the ratio of private credit by deposit money banks and other financial
institutions to GDP. This indicator measures the activity of financial intermediaries in
channeling savings to investors (Levine and Zervos, 1998; Levine et al., 2000). Countries
with higher levels of private credit to GDP have been shown to grow faster and experience
faster rates of poverty reduction (Beck et al., 2007). FIN EFF shows a cross-country
variability similar to CAP MK and countries with larger capital market size also show,
on average, more developed financial intermediaries (see Table 3, column 7).
3 Empirical Models
There at least two ways to study the effects of market imperfections on investment. On
one hand, one might start from a “standard” investment model and add to it variates that
measure market imperfections. On the other, one still assumes that some measures of
market imperfections directly influence investment, while all or some of them indirectly
affect capital accumulation through another variable already present in the “standard”
model. This paper follows this second road and assume that product, labor market and
financial market imperfections directly affect firms’ profitability, and through it invest-
ment. Further, it also assumes that financial market imperfections directly influence
investment.
This approach is implemented by estimating two separate models: one concerning
firm profitability, and the other an investment equation. Given the dynamic nature of
the latter, the investment equation is estimated by means of GMM techniques.
16

Table 3: Summary statistics of the market imperfection variablesThis table reports summary statistics of the indicators of employment protection index (EPL),
regulation impact index (RII), capital market size (as the sum of outstanding stocks, bonds and bankloans, CAP MK), financial development index ( as deposit money banks relative to central bank
assets, FIN DEV) and financial efficiency (private credit by deposit money banks and other financialinstitutions divided by GDP, FIN EFF).
Country Statistics EPL RII CAP MK FIN DEV FIN EFFBE min 2.15 .099 1.16 .991 .714
max 3.15 .563 1.88 .998 .937mean 2.34 .283 1.51 .995 .767
DE min 2.09 .029 1.26 .994 .962max 3.09 .454 1.89 .999 1.17mean 2.18 .141 1.67 .998 1.1
ES min 2.93 .043 1.04 .96 .704max 3.05 .556 3.27 .995 1.88mean 2.98 .222 2.2 .984 1.2
FI min 1.96 .043 1.03 .985 .501max 2.16 .339 3.25 1 .805mean 2.03 .178 2.07 .998 .648
FR min 2.98 .049 1.3 .991 .81max 3.05 .495 2.32 .998 1.07mean 3.03 .271 1.88 .995 .908
IT min 1.82 .052 .78 .878 .538max 3.57 .551 1.63 .975 1.03mean 2.04 .212 1.37 .951 .841
NL min 1.95 .03 1.59 .994 .923max 2.73 .37 3.38 1 1.93mean 2.25 .124 2.71 .998 1.47
PT min 3.15 .049 .682 .976 .613max 3.85 .586 2.7 .999 1.72mean 3.43 .229 2.31 .999 1.5
Total min 1.82 .029 .682 .878 .501max 3.85 .586 3.38 1 1.93mean 2.75 .23 1.9 .981 1.05
Source: OECD, ECB, World Bank Financial Structure Dataset.
17

3.1 Market regulations and firm profitability
The first model assumes that firm profitability (PROF) is a function of labor, product
and financial market imperfections, and other firm characteristics, as follows:
PROFi,s,j,t = β0+β1RIIs,j,t+β2EPLj,t+β3FMDj,t+β4LIQi,s,j,t+X′i,j,s,tβ5+ui,t+εi,t
(1)
where i refers to the firm, j to the country, s to the industry and t to the time period.
RII, EPL and LIQ are variates that, as described above, controls for regulations in the
product and labor markets, and firms’ financial conditions. FMD captures countries’
financial market development and, alternatively, is defined as Capital Market Size (CAP
MK), Financial Efficiency (FIN EFF), or Financial Development (FIN DEV). Regulation
indexes and FMD variates are beginning of period, to control for the fact that regulations
take some time to produce economic effects and the potential endogeneity of LIQ. X
is a vector of control variables. We control for firm characteristics such as firm size
(ASSET, the natural log of a firm total assets) and age ( AGE, number of years since
incorporation), and the sector of activity. Finally, ui,t and εi,t are, respectively, between-
firm and within-firm error terms of the random effects model.11
The estimated coefficients of RII and EPL are expected to be negative (β1 < 0, and
β2 < 0). As long as RII increases, the effects of the anti-competitive regulations in the
non-manufacturing sectors are higher, and intermediate input costs increase, thus firm
profitability decreases. Higher EPL levels are also expected to lower firm profitability
due to higher labor costs.
The coefficient of LIQ is expected to be positive (β4 > 0): more liquidity means that
a firm is able to react to sudden changes in its environment and, thus, reduces exposure
to the risk of being unable to meet short-term financial commitments (Goddard et al.,
2006).
The estimated coefficient of FMD may be either negative (β3 < 0), if a more devel-
oped financial market lead to more competitive markets (Dellas and Fernandes, 2007), or11Profitability is modeled as characterized by random effects because the firm sample used to estimate
model (1) was randomly drawn from a larger firm population. The presence of random effects is testedby the Breusch and Pagan Lagrangian Multiplier (BP LM) test that fails to reject the null of no needof random effects (V ar(u) = 0), as shown at the bottom of Table 4.
18

positive (β3 > 0), if efficient financial markets decrease the costs of credit access (Rajan
and Zingales, 1998). If both effects co-exist, the final impact of FDM on firm profitability
depends on which of these two opposite effects prevails.
The estimated coefficient of ASSET is expected to be positive if firms gain advantages
from scale or scope economies as they expand in size. Alternatively, if growth tends to
lead to diseconomies of scale, the size-profit relationship could be negative (Goddard et
al., 2006). A negative sign is expected for the coefficient of AGE: in their early years,
firms obtain significant increases in profitability, while mature firms seldom experience
low profitability levels (Warusawitharana, 2012).
Finally, model (1) includes country- and sector- specific year effects. Year-country
and year-industry interactions are interpreted as national and industry-specific business
cycles and are considered as indicators for the relevance of macroeconomic environment
in explaining profitability variation (Schiefer and Hartmann, 2013).
3.2 Market regulations and firm investment
The second model (the “second step”) aims at capturing the effects of market imperfec-
tions on firm investment. As described at the beginning of this Section, it is assumed
that product, labor market and financial market imperfections affect firms’ profitability,
and through it investment, while financial market imperfections also influence investment
directly.
The empirical investment specification is as follow:
I/Ki,s,j,t = γ0 + γ1I/Ki,s,j,t−1 + γ2I/Ki,s,j,t−2 + γ3PROFi,s,j,t + γ4FMDj,t
+ γ5PROFi,s,j,t ∗ FMDj,t + γ6LIQi,s,j,t + γ7PROFi,s,j,t ∗ LIQi,s,j,t
+ C′i,j,s,tγ8 + εui,t. (2)
where, as above for equation (1), i refers to the firm, j to the country, s to the
industry, and t to the time period.
Equation (2) states that investment is a function of firm profitability, two measures
of the degree of financial market imperfections, and their interaction with profitability.
19
These two interaction variables (PROF*FMD, PROF*LIQ) aim at describing how the
contemporaneous presence of product, labor and financial market imperfections affect
firm investment because, as shown in equation (1), profitability is also a function of
product and labor market imperfections.
Equation (2) also controls for the presence of the autoregressive process in observed
investment by adding the dependent variable lagged twice.
Finally, vector C includes control variables. Specifically, it is assumed that changes in
the user cost of capital among firms can be controlled for by country- and sector- specific
year effects. More generally, these variables control for the heterogeneous environment
in which firms operate.
Technically, given its dynamic structure, the endogeneity of PROF and the likely
presence of unobserved firm-specific effects, equation (2) is estimated by means of the
system GMM estimator.12 One advantage of the GMM method is that it allows to
directly instrument endogenous variables (i.e., PROF) by defining appropriate instru-
ments. In the case of equation (2), appropriate instruments are all explanatory variables
of equation (1) and standard errors of the estimated coefficients are unbiased. Thus, by
combining estimated coefficients of equation (2) with those of equation (1), the overall
effects on investment of the three types of market imperfections can be calculated and
statistical test run.
4 Results
4.1 Market imperfections and firm profitability
Table 4 shows the estimated coefficients of model (1). Columns (1) to (3) control for
the capital market imperfections by using the three alternative measures of country
level FMD i.e.: Capital Market Size, Financial Development and Financial Efficiency,12See Blundell et al. (2000), and Blundell and Bond (1998). This method uses equations in first-
differences for which endogenous variables lagged two or more periods will be valid instruments, providedthere is no serial correlation in the time varying component of the error term. This assumption is testedby performing tests for serial correlation in the first differences residuals. The equations in differencesare combined with the equations in levels, for which lagged differences of the variables are used asinstruments. AR(1) and AR(2) are the empirical realizations of the test statistics of first and secondorder residual autocorrelation. Significance means that the null hypothesis of no autocorrelation isrejected. The absence of AR(2) is the necessary condition for unbiased and efficient estimates.
20
respectively. Columns (4) to (6) also control for the firm capability to generate internal
funds by means of the variable LIQ.
Overall, the estimates show that, as expected, EPL and RII reduce firm profitability
as higher EPL and RII levels imply higher firm costs. As for FMD, indifferently from
the type of variable used, it also decreases firm profitability. This finding suggests that
more developed financial markets increase competition among firms, thus reducing firm
rents and profits. This effect more than counterbalances the potential positive effect on
firm profitability that should be driven by lower financing costs in the presence of more
developed financial markets.
LIQ positively affects firm profitability. By reducing firm exposure to the risk of
being unable to meet short-term financial commitments, liquidity produces a beneficial
effect on profitability, i.e. liquid firms adapt more easily to changing circumstances in
an increasingly volatile competitive environment.
Among control variables, both AGE and ASSETS negatively affect firm profitability.
While the first finding is in line with the firm growth cycle according to which mature
firms face slow declines in profitability, the second one reveals that, on average, larger
firms experiment diseconomies of scale and X - Inefficiency that, in turn, lower firm
profitability.
4.2 Market imperfections and firm investment
Estimation results for five different specifications of the investment equation (2) are
shown in Table 5.13
A key issue in estimating equation (2) is the potential endogeneity of the profitability
variable that, if not controlled for, may lead to biased and inconsistent results.
For comparative purposes, column (1) shows the base model in which firm profitabil-
ity is assumed to be as exogenous. All estimated coefficients, with the exception of those
of the investment rate dated t-2 and Capital Market Size (γ2 and γ4, respectively) are
statistically significant at conventional probability levels. However, these findings also13Table 5 presents estimates for a a specification of equation (2) in which the interaction term
PROF*FMD is left out of the model because its estimated coefficient is not statistically significant.Estimates are available upon request from the authors.
21

Table 4: The impact of imperfect markets on firm profitability.Estimation by XTREG using STATA 10 SE package.
VARIABLES 1 2 3 4 5 6
EPL -0.045*** -0.060*** -0.032*** -0.017*** -0.060*** -0.006(0.006) (0.006) (0.006) (0.006) (0.006) (0.006)
RII -0.893*** -0.912*** -1.153*** -1.017*** -0.912*** -1.219***(0.059) (0.060) (0.059) (0.061) (0.060) (0.061)
CAP MK -0.188*** -0.146***(0.007) (0.008)
FIN DEV -1.441*** -1.441***(0.157) (0.157)
FIN EFF -0.504*** -0.391***(0.012) (0.013)
LIQ 1.107*** 1.123*** 1.067***(0.019) (0.019) (0.019)
AGE -0.002*** -0.002*** -0.002*** -0.002*** -0.002*** -0.002***(0.000) (0.000) (0.000) (0.000) (0.000) (0.000)
ASSETS -0.027*** -0.013*** -0.028*** -0.013*** -0.013*** -0.014***(0.002) (0.003) (0.002) (0.002) (0.003) (0.002)
Constant 1.218*** 2.289*** 1.320*** 0.905*** 2.289*** 0.989***(0.040) (0.165) (0.040) (0.043) (0.165) (0.043)
Country-specific year effects yes yes yes yes yes yesIndustry-specific year effects yes yes yes yes yes yes
BP LM test (p-value) 0.000 0.000 0.000 0.000 0.000 0.000Observations 569,980 524,521 569,980 524,521 524,521 524,521Number of firms 117,072 116,041 117,072 116,041 116,041 116,041
Standard errors are reported in brackets below coefficients.*p < 0.10; **p < 0.05; ***p < 0.01 significance levels respectively.
22

indicate that model (2) is misspecified: the Sargan test of overidentifying restrictions
rejects the hypothesis that the error term in the first-differenced equations is orthogonal
to these instruments, and suggests that PROF is endogenous. Indeed, even if (1) does
not includes investment as explanatory variable, PROF is weakly endogenous because
the disturbances are correlated between equations (1) and (2). For example, investment
and firm profitability might be contemporaneously affected by a positive demand shock.
Column (2) shows results when PROF is instrumented with all variables from model
(1). The validity of these moment conditions is confirmed by the Sargan statistic, as
shown at the bottom of column (2), which suggests that the over identified restrictions
that the market regulation variables can be excluded from this regression cannot be
rejected.14
As expected, investment shows a persistent autoregressive dynamics. Moreover, the
profitability coefficient is positive and statistically significant, as well as the estimated
coefficient of the variable Capital Market Size.
Furthermore, the liquidity index coefficient is positive and statistically significant.
The latter result supports the hypothesis that, on average, firms in our dataset show
excess sensitivity to the availability of internal liquidity sources or, equivalently, that
financial market imperfections do likely exist.
The interaction term PROF*LIQ captures how the (indirect) impact of multiple
market imperfections varies with firm liquidity, measured at the beginning of each year
to mitigate potential problems of endogeneity. The estimated coefficient of this variable
(γ̂7) is negative and statistically significant, and leads to a twofold interpretation.
On one hand, the overall impact of liquidity on investment reveals that investment
decisions of more profitable firms are less sensitive to the availability of internal sources
of funds. Indeed, by recalling equations 1 and 2, the overall impact of LIQ on I/K
(computed as ∂(I/K)∂LIQ ) depends on: its direct impact (γ̂6), on its role in determining
profitability (γ̂3 ∗ β̂4), on its interaction with the profitability itself (γ̂7 ∗ β̂4 ∗ LIQ +
γ̂7 ∗ PROF ), where LIQ and PROF are the sample mean values of LIQ and PROF,14The two models (1) and (2) generate a triangular system and one does not need to include all
exogenous variables of equation (2) as instruments for the profitability (Baltagi, 2002).
23

respectively. As expected, the following F test result rejects the null in favor of a positive
impact of LIQ on investment, meaning that the interaction effect does not outweigh the
linear effect:
∂(I/K)
∂LIQ: γ̂6︸︷︷︸positive
+ γ̂3 ∗ β̂4︸ ︷︷ ︸positive
+ γ̂7 ∗ (β̂4 ∗ LIQ+ PROF )︸ ︷︷ ︸negative
= 0
On the other, more efficient financial markets, mitigate the (indirect) negative impact
of market regulations on investment. To analyze the overall impact of RII, EPL, and
FMD on investment, the following F tests are run:
∂(I/K)
∂RII: γ̂3 ∗ β̂1︸ ︷︷ ︸
negative
+ γ̂7 ∗ β̂1 ∗ LIQ︸ ︷︷ ︸positive
= 0 (3)
∂(I/K)
∂EPL: γ̂3 ∗ β̂2︸ ︷︷ ︸
negative
+ γ̂7 ∗ β̂2 ∗ LIQ︸ ︷︷ ︸positive
= 0 (4)
∂(I/K)
∂FMD: γ̂3 ∗ β̂3︸ ︷︷ ︸
negative
+ γ̂7 ∗ β̂3 ∗ LIQ︸ ︷︷ ︸positive
+ γ̂4︸︷︷︸positive
= 0 (5)
The first terms of each of tests (3), (4) and (5) show that RII, EPL, and FMD neg-
atively affect firm investment by lowering firm profitability. However, the second terms,
which capture the role of the interaction between firm profitability and liquidity, suggest
that investment of more liquid firms suffers less from multiple market imperfections.
Table 5, bottom of column (2), shows the p-values of the above F tests. Results for
(3) and (4) reject the null in favor of a negative impact of RII and EPL on investment.
Thus, stringent regulations hamper firm profitability by increasing firm costs, and, in
turn, lower investment. Diversely, the F test for (5) does not reject the null: overall, the
size of capital markets does not affect firm investment decisions. This finding suggests
that the impact of capital market imperfections on firm investment is better controlled
for by the liquidity index (LIQ) than by the Capital Market Size.
Estimates shown in columns (3) and (4) of Table 5 use two alternative indexes of
FMD, i.e. Financial Development and Financial Efficiency, respectively. Overall, esti-
mates confirm previous findings. However, this time the F test for (5) rejects the null
24

Table 5: Fixed Investment Models.Estimation by GMM-SYSTEM using STATA 10 SE package two-step results; “Sargan test ” is test ofthe overidentified restrictions (p-value reported); AR(k) is the test statistic for the presence of k-th
order serial correlation in the first-differenced residuals, (p-value reported)
VARIABLES (1) (2) (3) (4) (5)
I/Ki,t−1 0.332*** 0.422*** 0.427*** 0.378*** 0.438***(0.020) (0.051) (0.053) (0.044) (0.049)
I/Ki,t−2 -0.003 0.011 0.014 -0.003 0.019(0.010) (0.018) (0.018) (0.016) (0.018)
PROF 0.015*** 0.383*** 0.349*** 0.330*** 0.320***(0.002) (0.068) (0.066) (0.080) (0.093)
LIQ 0.173*** 0.663*** 0.598*** 0.536*** 0.477**(0.052) (0.113) (0.105) (0.126) (0.218)
LIQ *PROF -0.023*** -0.756*** -0.688*** -0.650*** -0.537**(0.006) (0.132) (0.127) (0.155) (0.263)
CAP MK 0.053 0.123* 0.141**(0.036) (0.065) (0.064)
FIN DEV 2.179**(0.876)
FIN EFF 0.397***(0.116)
Constant 0.104** -0.348 -2.161** -0.750*** -0.395(0.050) (0.451) (0.907) (0.256) (0.426)
Country-specific year effects yes yes yes yes yesIndustry-specific year effects yes yes yes yes yes
Arellano-Bond test AR1 (p-value) 0.00 0.00 0.00 0.00 0.00Arellano-Bond test AR2 (p-value) 0.20 0.17 0.94 0.97 0.21Sargan test (p-value) 0.00 0.33 0.50 0.58 0.15RII F test (p-value) - 0.000 0.000 0.000 0.000EPL F test (p value) - 0.000 0.000 0.000 0.000FMD F test (p value) - 0.212 0.030 0.011 0.112Observations 246,373 244,733 244,733 244,733 244,733Number of firms 66,610 66,105 66,105 66,105 66,105
Robust standard errors are reported in brackets below coefficients.*** p<0.01, ** p<0.05, * p<0.1
in favor of a positive impact of these FMD variables on investment. In other words, in-
vestment are more responsive to financial efficiency and development than to the capital
market size.
Finally, controlling for the potential endogeneity of the interaction term LIQ *PROF
does not significantly changes previous findings as shown in column (5) of Table 5.
25

5 Conclusions and Policy Implications
The Lisbon agenda called for EU to become by the end of the current decade “the most
competitive and dynamic knowledge-based economy in the world” through reforms to
product, labor and capital markets (Griffith et al., 2007).
This paper contributes to the ongoing debate on market regulations by empirically
analyzing the impact of product and labor market regulations and credit market imper-
fections on firm profitability and investment. The findings show that market regulations
hamper profitability and, in turn, investment, while the role of financial market develop-
ment is twofold. On the one side, financial market development generates an increasing
competition effect that reduces firm profitability. On the other side, when financial mar-
kets are more developed, firms have a better access to credit markets and might finance
their investment projects at a lower costs. Thus, financial market development fosters
investment. The paper also provide evidence that the size of the labor and product
market regulation effects on firm investment varies with the degree of financial mar-
ket development, as investment of more liquid firms suffers less from multiple market
imperfections.
These findings have important policy implications. First, the effect of product mar-
ket regulations that restrict competition in non-manufacturing sectors is by no means
confined to these sectors. These “knock-on” effects of non-manufacturing regulation are
likely to have become particularly salient over recent years given the large and increas-
ingly important role of the non-manufacturing sector as a supplier of intermediate inputs
in OECD countries (Arnold et al., 2011). Second, the estimates confirm previous find-
ings according to which EPL affect not only labor market variables but also the capital
accumulation. Furthermore, the effects of labor and product market regulations vary
with the degree of financial market imperfections: they are smaller in the presence of
more efficient financial markets, of which firm liquidity might be considered a substitute.
To operate efficiently, many components need to be in place (Haltiwanger 2011).
Labor markets need to be sufficiently flexible not only to allow job reallocation from
less productive to more productive sectors, but also to reduce firm production costs
26
and allow higher investment rates. Intermediate product markets need to be sufficiently
competitive, and this also means lower regulations that, by reducing costs should lead
to higher investment and firm growth. This means that regulation has to be designed to
provide an appropriate oversight without imposing onerous time and resource costs on
firms.
Finally, financial markets need to be efficient and sufficiently developed to provide
access to funding to firms that aim at expanding their businesses and to start up firms.
The results of the paper support the effort put forward by the European Institutions
to reform markets in recent years.
References
Alesina A., Ardagna S., Nicoletti G., and F. Schiantarelli, 2005. Regulation and
Investment. Journal of the European Economic Association, 3, 791-825.
Amable B., and E. Ekkehard, 2005. Financial and Labor Market Interactions. Spe-
cific investment and labor market activity. Centre for Empirical Macroeconomics, Work-
ing Paper No. 93.
Arnold J., Nicoletti G., and S. Scarpetta, 2011. Does Anti-Competitive Regulation
Matter for Productivity? Evidence from European Firms. IZA Discussion Papers 5511,
Institute for the Study of Labor (IZA).
Arnold L. G., 2002. Financial Market Imperfections, Labour Market Imperfections
and Business Cycles. Scandinavian Journal of Economics 104, 105-124.
Baltagi B. H., 2002. Econometric Analysis of Panel data. John Wiley and Sons Ltd,
The Atrium, Southern Gate, Chichester, West Sussex PO19 8SQ, England.
Barone G., Cingano F., 2011. Sevice regulation and growth: evidence from OECD
countries. Economic Journal, Royal Economic Society, vol. 121(555), 931-957.
Beck T., Demirgüc-Kunt A., and R. Levine, 2009. Financial Institutions and Markets
across Countries and over Time. Data and Analysis. World Bank Policy Research
Working Paper n. 4943.
Beck T., Demirgüc-Kunt A., and R. Levine, 2007. Finance, Inequality, and the Poor.
27

Journal of Economic Growth, 12, 27-49.
Becker B., and J. Sivadasan, 2010. The Effect of Financial Development on the
Investment-Cash Flow Relationship: Cross-Country Evidence from Europe. The B.E.
Journal of Economic Analysis & Policy, De Gruyter, vol. 10(1), pages 1-49, May.
Belke A., and R. Fehn, 2000. Institutions and Structural Unemployment: Do Capital-
Market Imperfections Matter?. CEPS Working Document, No. 158.
Biosca A. B., 2010. Growth Dynamics. Exploring business growth and contraction
in Europe and the US. NESTA Research report: November 2010.
Blanchard O. and F. Giavazzi, 2003. Macroeconomic Effects of Regulation and Dereg-
ulation in Goods and Labor Markets. Quarterly Journal of Economics, 118 (3): 879-907.
Blundell R., and S. Bond, 1998. Initial Conditions and Moment Restrictions in
Dynamic Panel Data Models. Journal of Economterics, 87, 115-143.
Blundell R., Bond S., and F. Windmeijer, 2000. Estimation in Dynamic Panel Data
Models: Improving the Performance of the Standard GMM Estimators. Nonstationary
panels, panel cointegration, and dynamic panels ; 15. - Amsterdam [u.a.] : JAI, ISBN
978-0-7623-0688-6, 53-91
Bond S., Klemm A., Newton-Smith R., Syed M., and G. Vlieghe, 2004. The Roles
of Expected Profitability, Tobin’q and Cash Flow in Econometric Models of Company
Investment. Institute for Fiscal Studies, London, Working Paper 04/12.
Calcagnini G., Ferrando A., and G. Giombini, 2013. Does Employment Protection
Legislation Affect Firm Investment? The European Case. Economic Modelling. DOI:
10.1016/j.econmod.2013.06.036.
Calcagnini G., Giombini G., and E. Saltari, 2009. Firms’ Investment in the Presence
of Financial and Labour Market Imperfections. Economics Letters 102, 22-26.
Cingano F., Leonardi M., Messina J. and G. Pica. 2010. The effects of employment
protection legislation and financial market imperfections on investment: evidence from
a firm-level panel of EU countries, Economic Policy, CEPR, CES, MSH, 25, 117-163.
Coluzzi C., Ferrando A., and C. Martinez-Carrascal, 2012. Financing obstacles and
growth: an analysis for euro area non-financial firms. The European Journal of Finance.
28

DOI:10.1080/1351847X.2012.664154.
Conway, P. and G. Nicoletti, 2006. Product market regulation in the non-manufacturing
sectors of OECD countries: measurement and highlights. OECD, Economics Department
Working Papers No. 530
Dellas H., and A. Fernandes, 2007. Finance and Competition. Diskussionsschriften
Discussion Paper 0703, Universitaet Bern, Departement Volkswirtschaft.
ECB, 2013. Financial Integration in Europe.
Erickson T. and T. Whited, 2000. Measurement Error and the Relationship between
Investment and q, Journal of Political Economy, 108, 1027-57.
Fazzari S., Hubbard R.G., and B.C. Petersen, 1988. Financing Constraints and
Corporate Investment. Brookings Papers on Economic Activity, 1, 141-206.
Ferrando A., Marchica M-T. and R. Mura, 2013. Financial Flexibility Across the
Euro Area and the UK. Available at SSRN: http://ssrn.com/abstract=2246581 or
http://dx.doi.org/10.2139/ssrn.2246581
Fiori G., Nicoletti G., Scarpetta S., and F. Schiantarelli, 2007. Employment Out-
comes and the Interaction Between Product and Labor Market Deregulation: Are They
Substitutes or Complements? IZA Discussion Paper Series, No. 2770.
Goddard J., Tavakolib M., and J. O. S. Wilson, 2005. Determinants of profitability
in European manufacturing and services: evidence from a dynamic panel model. Applied
Financial Economics, 2005, 15, 1269–1282.
Griffith R., Harrison, R., and G. Macartney, 2007. Product Market Reforms, Labour
Market Institutions and Unemployment. Economic Journal, Royal Economic Society,
117, C142-C166.
Haltiwanger J., 2011. Firm dynamics and productivity growth. EIB papers, 16 (1),
116-136.
IMF, 2013. EURO AREA POLICIES. IMF Country Report No. 13/231, July.
Kaplan S., and L. Zingales, 1997. Do Investment-Cash Flow Sensitivities Provide
Useful Measures of Financing Constraints?. Quarterly Journal of Economics, 112, 169-
215.
29

Levine R., 2005. Finance and Growth: Theory and Evidence. In Handbook of
Economic Growth, Volume 1A, Aghion P. and Durlauf, S. N. (Eds.), Elsevier B.V.,
865-934.
Levine R., 2002. Bank-based or Market-based Financial Systems: Which Is Better?.
Journal of Financial Intermediation, 11, 1-30.
Levine R. and S. Zervos, 1998. Stock Markets, Banks, and Economic Growth. Amer-
ican Economic Review, 88, 537-558.
Levine R., Loayza N. V. and T. Beck, 2000. Financial Intermediation and Growth:
Causality and Causes. Journal of Monetary Economics,16, 31-77.
Love I., 2003. Financial Development and Financing Constraints: International Ev-
idence from the Structural Investment Model. Review of Financial Studiee, 16 (3),
765-791.
Moyen N., 2004. Investment-Cash Flow Sensitivities: Constrained Versus Uncon-
strained Firms. Journal of Finance 59, 2061-2092.
Nickell, S., Nicolitsas, D., 1999. How does financial pressure affect firms? European
Economic Review, 43, 1435-1456.
OECD, 2011. Product Market Regulation Database, www.oecd.org/economy/pmr.
Papaioannou E., 2008. Finance and Growth. A macroeconomic assessment of the
evidence from a European angle. in Handbook of European Financial Markets and
Institutions. X. Freixas, P. Hartmann and C. Mayer (eds.), Oxford University Press,
Oxford, UK
Povel P., and M. Raith, 2004. Financial constraints and product market competition:
ex ante vs. ex post incentives. International Journal of Industrial Organization, 22, 917-
949.
Rajan R., and L. Zingales, 1998. Financial Dependence and Growth. American
Economic Review, 88(3), 559-86.
Rendon S., 2004. Job Creation and Investment in Imperfect Capital and Labour
Markets. centrA, Documento de Trabajo, E2004/35.
Rincon-Aznar A., Graf N., Paterson I., Schwarzbauer W., Sellner R., Siebert S., and
30

C. Yildirim, 2010. Regulation and Economic Performance: Literature Review. SER-
VICEGAP Review Paper 4.
Schiantarelli F., 2005. Product Market Regulation and Macroeconomic Performance:
A Review of Cross-Country Evidence. World Bank Policy Research Working Paper, No.
3770.
Schiefer J., and M. Hartmann, 2013. Industry, firm, year, and country effects on prof-
itability in EU food processing. Institute for Food and Resource Economics, University
of Bonn. Discussion Paper 2013:2
Spector D., 2004. Competition and the capital-labor conflict. European Economic
Review, 48(1), 25-38.
Venn D., 2009. Legislation, collective bargaining and enforcement: Updating the
OECD employment protection indicators, www.oecd.org/els/workingpapers.
Warusawitharana M., 2012. Profitability and the Lifecycle of Firms. Finance and
Economics Discussion Series Divisions of Research & Statistics and Monetary Affairs
Federal Reserve Board, Washington, D.C.
Wasmer E. and P. Weil, 2004. The Macroeconomics of Labour and Credit Market
Imperfections. American Economic Review, 94, 4, 944-963.
Whited T., What Can Cash Shortfalls and Windfalls Tell Us About Finance Con-
straints?, in Giorgio Calcagnini and Enrico Saltari (eds.) The Economics of Imperfect
Markets, Springer, New York, 2010.
Annex 1. Variable definitions
• AGE is the number of years since incorporation;
• ASSETS is the natural log of total assets (in e mil), expressed in real value. It is
used as a measure of firm size;
• I/K is the ratio of capital expenditure at time t to tangible total assets at time
t-1. Capital expenditure is computed as the annual change in tangible fixed assets
plus depreciation;
31

• LIQ is the ratio of cash and cash equivalents to total assets;
• PROF is the ratio of operating profits to total fixed assets;
• EPL is the Employment Protection Index, Version 1 (OECD, 2004) . The index
includes the costs for employers of firing workers with regular contracts and it
is measured according to the strictness in the regulations for regular procedural
inconvenience, notice and severance pay for no-fault individual dismissals, and diffi-
culty of dismissals. It also includes the degree of strictness of labour regulations for
temporary workers related to hiring practices such as type of contracts considered
acceptable or number of successive contracts or renewals. The index is measured
both for the fixed-term con- tracts and for temporary agency workers. The overall
EPL index ranges theoretically from 0 to 6;
• RII is the sectoral regulation impact index, based on OECD Regulation Impact
indicators (Conway and Nicoletti, 2006). This indicator measures the knock-on-
effects of non-manufacturing regulation on the cost structures faced by firms that
use the output of non-manufacturing sectors as intermediate inputs in the produc-
tion process. The index is calculated as follows
RIIk,t =∑j
NMRj,t ∗ wk,j (6)
where the variable NMRj,t is an indicator of anti-competitive regulation in non-
manufacturing sector j at time t and the weight wj,k is the total input requirement
of sector k for intermediate inputs from non- manufacturing sector j;
• CAP MK is the Capital market size index. The measure is the sum of outstanding
stocks, bonds and bank loans as a share of GDP (ECB, 2013);
• FIN EFF is the Financial Efficiency index. It is measured as private credit by
deposit money banks and other financial institutions to GDP (from the World
Bank Financial Structure Dataset);
• FIN DEV is the Financial Development index. It is measured as Deposit Money
to Central Bank Assets (from the World Bank Financial Structure Dataset).
32


![Imperfections in Solids [Autosaved]](https://static.fdocuments.in/doc/165x107/56d6bcc11a28ab30168b54f1/imperfections-in-solids-autosaved.jpg)