Multiple Marker Analysis in the Avian Optic Tectum … · Although neuroglia have been estimated to...
9
0270.6474/85/0509-2388$02 00/O CopyrIght 0 Smety for Neurowence Printed m U.S.A. The Journal of Neuroscience Vol. 5, No. 9, pp. 2388-2396 September 1985 Multiple Marker Analysis in the Avian Optic Tectum Reveals Three Classes of Neuroglia and Carbonic Anhydrase-containing Neurons’ PAUL J. LINSER C. V. Whitney Laboratory for Experimental Marine Biology and Medicine, and Department of Anatomy, University of Florida, St. Augustine, Florida 32086 Abstract The distribution and biochemical diversity of neuroglial cells in the avian optic tectum were analyzed using immu- nohistochemical techniques. Polyclonal and monoclonal anti- bodies were employed to define the distributions and locali- zations of four proteins that are considered to be glial- specific in the mammalian central nervous system: glutamine synthetase, carbonic anhydrase-C, glial fibrillary acidic pro- tein, and S-100 protein. The results showed the presence of at least three distinguishable populations of glia: glutamine synthetase/glial fibrillary acidic protein-positive fibrous as- trocytes, glutamine synthetase/carbonic anhydrase-c-posi- tive protoplasmic astrocytes, and S-IOO-positive oligoden- droglia. In addition, a distinct population of neurons was observed that showed very intense immunostaining for the presence of carbonic anhydrase-C. The results suggest that the segregation of biochemical functions in the major cate- gories of brain neuroglial cells (oligodendroglia and astroglia) varies significantly between vertebrate species. This obser- vation raises the possibility of using comparative studies to refine our understanding of the roles that glial cells play in nervous tissue. Neural tissue of most organisms is extremely complex and is composed of myriads of different cells. In the simplest analysis, this cellular complexity can be subdivided into two major categories of cell types, the neuronal cells and the neuroglia. The neuronal cells are the conduits of electrical and chemical information transfer and, thus, are considered the functional units of the nervous system. Although neuroglia have been estimated to be the most numerous class of cells in the vertebrate nervous system (Glees, 1955), they have not been as intensively studied as neurons and, consequently, the functions of glia are less understood. In general, it is evident that the neuroglia are involved in a number of functions that relate to the metabolic and physical support of neurons (Glees, 1955; Stewart and Rosenberg, 1979; Haan et al., 1982). To understand the roles of the neuroglia in greater detail, investi- gators have employed histological and immunohistochemical tech- niques to investigate the diversity of these cells (Raff et al., 1979; Roots, 1982). Through the use of antibody probes to specific enzymes, structural proteins, or other constituents found predomi- Received November 6, 1984; Revised February 1, 1985; Accepted February 5, 1985 ’ This work was supported in part by Grant 5-425 from the March of Dimes Birth Defects Foundation and by Grant BNS-8417797 from the National Science Foundation. I would like to gratefully acknowledge the expert technical assistance of Margaret Perkins, the artistic assistance of Lynn Mllstead, and the clerical assistance of Louise MacDonald. nantly in neuroglia, it has been possible to arrive at some conclusions concerning the roles of these cells. Using such methods of analysis, neuroglial cells have been grossly subdivided into two main popu- lations of neuroectodermal cells: the astroglia (and astroglia-like cells) and the oligodendroglia (Glees, 1955; Roots, 1982). Indeed, it has been possible to assign certain markers as characteristic of defined subpopulations of neuroglia. However, under the influence of the local demands of specific regions of the nervous system, it is likely that glial cells will exhibit a much broader range of biochemical and functional characteristics than is implied by the astroglial-oligoden- droglial classification scheme. In this paper, I examine the diversity of glia in the chick optic tectum with regard to the compartmentali- zation of several widely used glial-specific markers. Two particular markers which have been used to define glial cell types are the enzymes glutamine synthetase (GS) and carbonic anhydrasec (CA-C) (Ghandour et al., 1979; Norenberg, 1979; Roots, 1982; Linser and Moscona, 1984). GS is an integral enzyme in the metabolic compartment called the “small glutamate pool” (Hamberger et al., 1979; Stewart and Rosenberg, 1979). Several lines of evidence support the hypothesis that this compartment is largely responsible for sequestering and metabolizing amino acid neurotransmitters such as glutamate and GABA, returning th_e car- bon and nitrogen atoms of the transmitters to the general pool in the form of glutamine (Hamberger et al., 1979, Stewart and Rosen- berg, 1979). Through immunohistochemical and biochemical meth- ods, it has been shown that high levels of GS are found exclusively in neuroglial cells in the nervous system (Linser and Moscona, 1979; Norenberg, 1979). Thus, it is evident that the neuroglia are critical to neuronal function with respect to the extracellular environment of those neurons that secrete or are sensitive to such neuroactive amino acids (Hamberger et al., 1979). Furthermore, it has been shown that the GS-containing neuroglia of the mammalian CNS are of the astroglial variety (Norenberg, 1979). CA-C (also referred to as CA II) is the high activity isoenzyme of the family of carbonic anhydrases and is felt to be the physiologically significant enzyme with regard to the formation of bicarbonate from metabolic carbon dioxide (Maren, 1967; Maren and Sanyal, 1983). Recent studies have shown that the majority of CA-C in the mam- malian CNS is compartmentalized in the oligodendroglial compart- ment (Ghandour et al., 1979; Roots, 1982). Although early immu- nohistochemical studies reported the presence of this enzyme in astroglial cells, later studies compared the distribution of CA-C with that of a cytoskeletal protein, considered to be a definitive marker for fibrous astroglia, known as glial fibrillary acidic protein, or GFA (Eng et al., 1971; Bignami et al., 1972; Dahl and Bignami, 1973). These studies showed clearly that these two glial markers were never co-localized (Ghandour et al., 1979). Thus, it was concluded that CA-C is a specific marker for oligodendroglia (Ghandour et al., 1979). Several subsequent reports have corroborated this both in situ and in vitro (Delaunoy et al., 1980; Pettmann et al., 1980). Nevertheless, controversy over the point remains (Roots, 1982). To 2388
Transcript of Multiple Marker Analysis in the Avian Optic Tectum … · Although neuroglia have been estimated to...

0270.6474/85/0509-2388$02 00/O CopyrIght 0 Smety for Neurowence Printed m U.S.A.
The Journal of Neuroscience Vol. 5, No. 9, pp. 2388-2396
September 1985
Multiple Marker Analysis in the Avian Optic Tectum Reveals Three Classes of Neuroglia and Carbonic Anhydrase-containing Neurons’
PAUL J. LINSER
C. V. Whitney Laboratory for Experimental Marine Biology and Medicine, and Department of Anatomy, University of Florida, St. Augustine, Florida 32086
Abstract
The distribution and biochemical diversity of neuroglial cells in the avian optic tectum were analyzed using immu- nohistochemical techniques. Polyclonal and monoclonal anti- bodies were employed to define the distributions and locali- zations of four proteins that are considered to be glial- specific in the mammalian central nervous system: glutamine synthetase, carbonic anhydrase-C, glial fibrillary acidic pro- tein, and S-100 protein. The results showed the presence of at least three distinguishable populations of glia: glutamine synthetase/glial fibrillary acidic protein-positive fibrous as- trocytes, glutamine synthetase/carbonic anhydrase-c-posi- tive protoplasmic astrocytes, and S-IOO-positive oligoden- droglia. In addition, a distinct population of neurons was observed that showed very intense immunostaining for the presence of carbonic anhydrase-C. The results suggest that the segregation of biochemical functions in the major cate- gories of brain neuroglial cells (oligodendroglia and astroglia) varies significantly between vertebrate species. This obser- vation raises the possibility of using comparative studies to refine our understanding of the roles that glial cells play in nervous tissue.
Neural tissue of most organisms is extremely complex and is composed of myriads of different cells. In the simplest analysis, this cellular complexity can be subdivided into two major categories of cell types, the neuronal cells and the neuroglia. The neuronal cells are the conduits of electrical and chemical information transfer and, thus, are considered the functional units of the nervous system. Although neuroglia have been estimated to be the most numerous class of cells in the vertebrate nervous system (Glees, 1955), they have not been as intensively studied as neurons and, consequently, the functions of glia are less understood. In general, it is evident that the neuroglia are involved in a number of functions that relate to the metabolic and physical support of neurons (Glees, 1955; Stewart and Rosenberg, 1979; Haan et al., 1982).
To understand the roles of the neuroglia in greater detail, investi- gators have employed histological and immunohistochemical tech- niques to investigate the diversity of these cells (Raff et al., 1979; Roots, 1982). Through the use of antibody probes to specific enzymes, structural proteins, or other constituents found predomi-
Received November 6, 1984; Revised February 1, 1985; Accepted February 5, 1985
’ This work was supported in part by Grant 5-425 from the March of Dimes Birth Defects Foundation and by Grant BNS-8417797 from the National Science Foundation. I would like to gratefully acknowledge the expert technical assistance of Margaret Perkins, the artistic assistance of Lynn Mllstead, and the clerical assistance of Louise MacDonald.
nantly in neuroglia, it has been possible to arrive at some conclusions concerning the roles of these cells. Using such methods of analysis, neuroglial cells have been grossly subdivided into two main popu- lations of neuroectodermal cells: the astroglia (and astroglia-like cells) and the oligodendroglia (Glees, 1955; Roots, 1982). Indeed, it has been possible to assign certain markers as characteristic of defined subpopulations of neuroglia. However, under the influence of the local demands of specific regions of the nervous system, it is likely that glial cells will exhibit a much broader range of biochemical and functional characteristics than is implied by the astroglial-oligoden- droglial classification scheme. In this paper, I examine the diversity of glia in the chick optic tectum with regard to the compartmentali- zation of several widely used glial-specific markers.
Two particular markers which have been used to define glial cell types are the enzymes glutamine synthetase (GS) and carbonic anhydrasec (CA-C) (Ghandour et al., 1979; Norenberg, 1979; Roots, 1982; Linser and Moscona, 1984). GS is an integral enzyme in the metabolic compartment called the “small glutamate pool” (Hamberger et al., 1979; Stewart and Rosenberg, 1979). Several lines of evidence support the hypothesis that this compartment is largely responsible for sequestering and metabolizing amino acid neurotransmitters such as glutamate and GABA, returning th_e car- bon and nitrogen atoms of the transmitters to the general pool in the form of glutamine (Hamberger et al., 1979, Stewart and Rosen- berg, 1979). Through immunohistochemical and biochemical meth- ods, it has been shown that high levels of GS are found exclusively in neuroglial cells in the nervous system (Linser and Moscona, 1979; Norenberg, 1979). Thus, it is evident that the neuroglia are critical to neuronal function with respect to the extracellular environment of those neurons that secrete or are sensitive to such neuroactive amino acids (Hamberger et al., 1979). Furthermore, it has been shown that the GS-containing neuroglia of the mammalian CNS are of the astroglial variety (Norenberg, 1979).
CA-C (also referred to as CA II) is the high activity isoenzyme of the family of carbonic anhydrases and is felt to be the physiologically significant enzyme with regard to the formation of bicarbonate from metabolic carbon dioxide (Maren, 1967; Maren and Sanyal, 1983). Recent studies have shown that the majority of CA-C in the mam- malian CNS is compartmentalized in the oligodendroglial compart- ment (Ghandour et al., 1979; Roots, 1982). Although early immu- nohistochemical studies reported the presence of this enzyme in astroglial cells, later studies compared the distribution of CA-C with that of a cytoskeletal protein, considered to be a definitive marker for fibrous astroglia, known as glial fibrillary acidic protein, or GFA (Eng et al., 1971; Bignami et al., 1972; Dahl and Bignami, 1973). These studies showed clearly that these two glial markers were never co-localized (Ghandour et al., 1979). Thus, it was concluded that CA-C is a specific marker for oligodendroglia (Ghandour et al., 1979). Several subsequent reports have corroborated this both in situ and in vitro (Delaunoy et al., 1980; Pettmann et al., 1980). Nevertheless, controversy over the point remains (Roots, 1982). To
2388

The Journal of Neuroscience Neuroglial Markers in the Avian Optic Tectum 2389
v
:: h
j Ir
, =
L
i
d
’ e f
I: 9
F/gure 7. Hrstologrcal structure of the mature chick optic tectum cortex. Six-mrcrometer sectron of the central regron of the tectum cut perpendicular to the long axis, starned with hematoxylrn and eosrn, and then photographed with Nomarskr optics. Blood vessels are labeled (V). The ventricle (Vent.) IS at the bottom of the figure. The various lamrnae of the tectum are labeled according to the method of LaVail and Cowan (1971). Magnifrcatron X 140. P, pra; SO, stratum optrcum; SGFS, stratum gnseum et frbrosum superfrcrale (a to j, sublamrnae of the SGFS); SGC. stratum gnseum centrale; SAC, stratum album centrale; SGP, stratum gnseum penventnculare; SFP, stratum frbrosum penventnculare; E, ependyma.
- SGFS
-SGC
-SAC
. SGP v SFP
date, no definitive studies have been published that explain the role of glial CA-C in neural tissue function and, hence, it is of importance to know whether the enzyme is characteristic of a specific population of glia.
In this study, I have examined the localization of GS and CA-C in the chick optic tectum as an extension of previous work in the vertebrate visual system (Linser and Moscona, 1979, 1981a, b, 1984; Linser et al., 198413). In addition, I have examined the distri- butions of the cytoskeletal protein GFA and the neural tissue-specific S-100 protein as secondary markers for astroglia and oligodendrog- lia, respectively (Dahl and Bignami, 1973; Hartman et al., 1977). The results indicate that there are at least three distinguishable popula- tions of glia in the optic tectum on the basis of marker distribution: typical fibrous astroglia that contain both GS and GFA, oligoden- droglia which contain S-l 00, and a dense population of protoplasmic astroglra which possess both GS and CA-C but neither GFA nor S- 100. Also , a very specific population of neurons is present that surprisingly contain high levels of CA-C immunoreactivity, unlike any other previously described neuron of the vertebrate brain.
Materials and Methods Animals. White Leghorn chickens were used in this study. The animals
were hatched under controlled conditions in the laboratory and were sacn- freed by cervrcal drslocatron approximately 6 weeks after hatching.
Antisera. Polyclonal rabbit and mouse antisera to chicken GS and CA-C and rabbit anti-bovine S-100 were produced as has been prevrously de- scribed (Lrnser and Moscona, 1979, 1981a, b). Antiserum to human GFA was purchased from Accurate Brochemrcals Inc. Monoclonal antibodies to chicken CA-C were produced also as has been described (Lrnser et al., 1984a). Monoclonal antibodies to bovrne S-100 were generously provided by Dr. Karl Steffansson, University of Chicago Department of Neurobrology.
Hatcchemrstry. For rmmunohrstochemrcal analysis, the optic lobes of freshly killed chickens were removed and immediately placed In Ice-cold 4% paraformaldehyde. 0.1 M cacodylate buffer, pH 7.4. The menrnges were removed and the lobes were cut into approximately 2-mm slices perpendrc- ular to the long axis of the tectum. Two or three slices from the centralmost region of the tectum were selected and incubated in the formaldehyde frxatrve for 2 hr at 4“C. Next, the slrces were transferred to Carnoy’s fluid and incubated an additional 90 min. The fixed tissues were then dehydrated and embedded in paraffin by standard methods (Lrnser and Moscona, 1979). Six-micrometer sectrons were cut and mounted on slides and then rehy- drated. The details of single-label rmmunohrstochemrcal staining procedures have been described previously (Lrnser and Moscona, 1979). All primary antisera were used at a working drlutron of 1:lOO. Monoclonal antibodies from hybndoma culture supernatants were diluted 1 :lO. For double-label analyses, rehydrated sections were exposed for 30 mm at 37°C to a diluted mixture of primary antisera from mouse and rabbit in phosphate-buffered salrne (PBS) plus 2% normal goat serum. The specrmens were then washed In several changes of PBS and then exposed to a mixture of diluted secondary antibodies (fluorescein sothrocyanate-contugated goat anti-mouse IgG; rho- damrne-conjugated goat anti-rabbit IgG) In PBS, again containing 2% normal goat serum, for 30 min at 37’C. The fluorescently labeled secondary antibodies were purchased from Krrke,gard and Perry. These probes are affinity-purified IgGs and were tested and shown to have no appreciable species cross-reactrvrty. Fluorescent breakthrough was not a problem in the double-label analyses, as all observations reported here were checked by reversrng the two fluorophores and comparing double-label results to those generated by single-label techniques. To minimize problems of background staining, sections were prerncubated with sodium m-penodate and sodrum borohydnde according to the method of Schachner et al (1977). Control sections treated with either prermmune serum or antiserum that had been adsorbed with the appropriate purified antigen (i.e., chick CA-C and GS, bovine S-100, rat spinal cord GFA) showed no starnrng (Lnser and Moscona, 1979, 1981 a, b). Micrographs were generated using a Leitz Dralux photomr- croscope equipped for mutually exclusive eprfluorescent visualization of fluorescein and rhodamine fluorescence.
Results
The normal histological appearance of the mature chicken optic tectum is shown in Figure 1. Designations for the many laminations of the chick tectum are those defined by LaVail and Cowan (1971). In this and all subsequent figures, the tissue sections are oriented with the pial surface at the top of the figure.
Linser Vol. 5, No. 9, Sept. 1985
Frgure 2. lmmunohrstochemrcal localrzatron of GS (a) and CA-C (b) in parallel sections of tectum onented as in Figure 1. Patterns of starnrng for both antigens are very similar with some notable differences: staining for GS in stratum optrcum (SO) and the ependymal cells (E) IS not paralleled by CA-C; staining for CA-C in stratum album centrale (SAC) IS less intense than that for GS; and a population of intensely fluorescent cells is evident in the central regron of the tectum labeled for CA-C that IS not seen in the GS-labeled specimen (arrows; see also Fig. 3). Magnifrcatron x 160.
I W cc CA GS car ant1
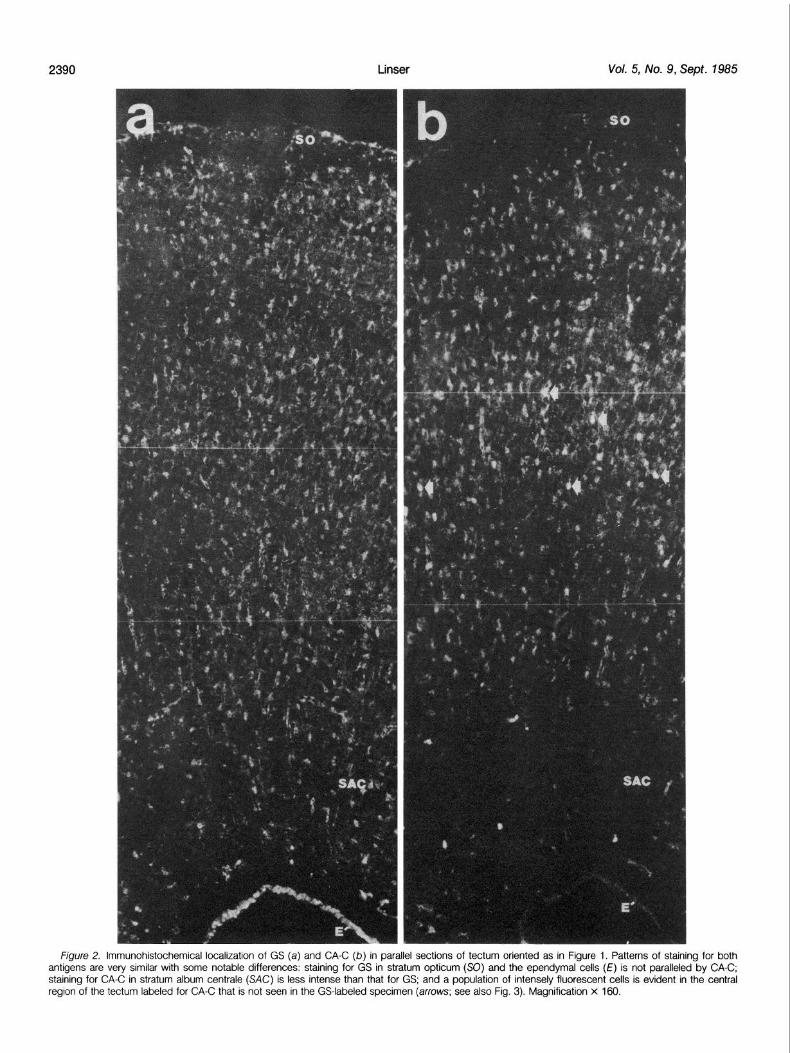
=igure 3. Double-label analysis of GS (a and c) and CA-C (b and d) in sections of tectum using mouse anti-GS, rabbit anti-CA-C, and goat anti-m’ i labeled with fluorescein and goat anti-rabbit IgG labeled with rhodamine. a and b show a single section of tectum near the pial surface. GS (a) and b) show identical patterns of staining except in stratum opticum (SO) where only GS is evident. The somata of several cells that possess both GS -C in stratum griseum et fibrosum superficiale (SGFS) are indicated with arrows. In c and d a section from the ventricular side of SGFS is shown. A and CA-C are co-localized in many cells. However, a population of large cells intensely stained for the presence of CA-C (d, arrows), in the
responding to sublamina j of SGFS, is characterized by a lack of staining for GS (c, arrows). Control sections treated with antigen-adsorbed pri iserum showed no staining (see “Materials and Methods”). Magnification X 400.
I CA- I and gain, area
mary
Aser Vol. 5, No. 9, Sept. 1985
Figure 2 shows low power micrographs of immunofluorescent staining for GS and CA-C in parallel sections of tectum. At this magnification, both antigens exhibit a broad distribution across most of the laminations of the tectum. Staining for both antigens is very diffuse, with an obvious pattern of unstained spherical structures which correspond to the cell somata of numerous neuronal cells throughout the tissue, giving such preparations a “Swiss cheese- like” appearance. Relatively little of either antigen is present in the regions of heavy myelination, stratum opticum (SO; LaVail and Cowan, 1971) and stratum album centralae (SAC; LaVail and Cowan, 1971). When viewed at higher magnification, the rather generalized staining for GS and CA-C proves to be very granular. Also, staining is evident in numerous cells with small somata scattered throughout most of the cellular layers of the tectum. When viewed at very high magnification, the fine granular material appears to be cross-sec- tional views of very fine cellular processes, probably originating from the stained small cells. From examination of parallel sections stained for GS or CA-C, it seemed likely that these two antigens were compartmentalized in the same cell type. In order to verify this, we employed double-labeling techniques for the simultaneous localiza- tion of both GS and CA-C.
Figure 3 shows a double-label analysis of GS and CA-C localiza- tion. In most regions of the tectum, these two enzymes are indeed co-localized in the same population of cells and cellular processes. At this point I tentatively identified this rather extensive population of cells as some type of astroglial cell. However, in sublamina j of stratum griseum et fibrosum superficiale, I encountered a population of CA-C-positive cells which did not show staining for GS (Fig. 3). In order to determine whether these cells represented a population of neurons or a different type of neuroglial cell, I examined the locali- zation of other putatively glia-specific protejns.
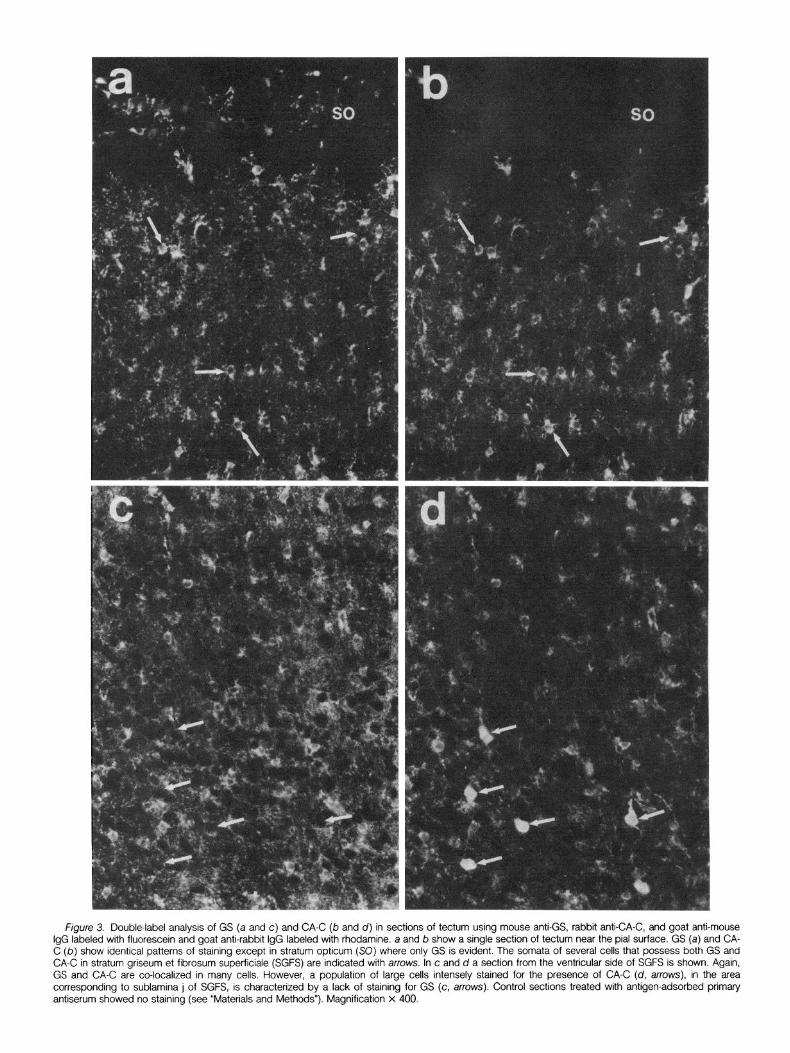
The next antigen that I investigated was the intermediate filament protein of fibrous astroglial cells, GFA (Schachner et al., 1977). Figure 4 shows the distribution of GFA staining in the tectum. Two regions of staining are evident. First of all, cells with the typical morphology of fibrous astrocytes (Glees, 1955) are evident in the subpial region and throughout stratum opticum (Fig. 4a). These cells have small perikarya and finger-like processes that extend laterally in the plane of SO. These cells and their processes are apparently limited to SO, as no staining for GFA was evident in the lamina of the tectum immediately subjacent to SO. A second population of GFA-positive cells was also observed. Coursing through SAC in a vertically oriented manner are numerous fibrous processes which stain for GFA. These processes originate from cells that lie in stratum griseum periventriculare and SAC or from the cells which form the ependymal lining of the tectum. These cells are somewhat analogous in morphology to the Bergmann glial cells of the cerebellum and are probably a variety of fibrous astroglia. GFA staining of this population of cells in the chick tectum SAC was previously described by Dahl and Bignami (1973). Double-label analyses comparing GS or CA-C to GFA showed that the GFA-positive cells were also weakly positive for GS but lacked detectable CA-C (not shown).
Next, I examined the localization of S-100 protein. In the mam- malian brain, S-100 has been considered to be a marker for both oligodendroglia and astrocytes (Haan et al., 1982; Roots, 1982). However, in chick brain, it has been reported that antiserum to this protein reacts primarily with oligodendroglia (Hartman et al., 1977). No reports of astroglial S-100 in chicken brain have appeared in the literature. Figure 5 shows the distribution of S-100 immunoreactivity in the chicken tectum in comparison to CA-C. My results showed
Fjgure 4 Localrzatron of GFA In optrc tectum. GFA-posrtrve fibrous astro- vertical processes which frequently extend Into SAC (b). Cell bodies of the cytes and their processes are evrdent In stratum optrcum (SO) but not In the GFA-contarnrng glia In the ventricular layers of the tectum are found among subjacent layers of stratum gnseum et frbrosum superfrciale (a). GFA-posttwe the ependymal cells, as well as scattered in the more superfrcral layers up to cells are also present In the ependymal king of the tectum (c) possessrng but not beyond SAC. Magnrfrcatron x 330.

Figure 5. Double-label analysis of CA-C (mouse anti-CA-C) (a and c) and S-100 (rabbit anti-S-100) (b and d) localization in optic tectum sections taken from the transitional region between SAC and sublamina j of stratum griseum et fibrosum superficiale. a shows the distribution of CA-C: erythrocytes in blood vessels (V); generalized staining and small cell somata of glia (g); and large, intensely labeled cells (so/id arros) and their vertical processes with multiple varicosities (open arrowheads). b shows S-100 distribution in the same section as in a: staining of numerous myelinated nerve fascicles (open arrowheads); and cell somata of oligodendroglial cells in association with myelin sheaths (solid arrows). c and d show a similar comparison including the most superficial region of SAC. Again, note CA-C staining in apparent neuronal processes with multiple varicosities (c; open arrowheads) and complete lack of staining aside from blood vessels (V) in SAC. d shows the presence of S-100 in the concentrated myelinated nerve fascicles characteristic of SAC and also staining in several cell somata of oligodendroglia (arrows). Magnification x 340.
GS CA-C G+:::.i:.:::.:.. ,. . . . . . ..Z*.~
Linser
GFA
that a population of small cells with thick processes labeled for S- 100. These cells were located primarily in or bordering on the internal
myeiinated region of the tectum, SAC. High magnification examina- tion showed that myelinated nerve fascicles also stained, ‘providing
a clear picture of the myelinated nerve tracts. The size and shape of the stained cell bodies and the association of these cells with the
similarly stained myelinated axon bundles indicate that these cells are oligodendroglial cells, thus confirming previous observations in
the chick brain (Hartman et al., 1977).
d
- SGFS
i
- SGC
- SAC
- SGP
- SFP
Vol. 5, No. 9, Sept. 1985
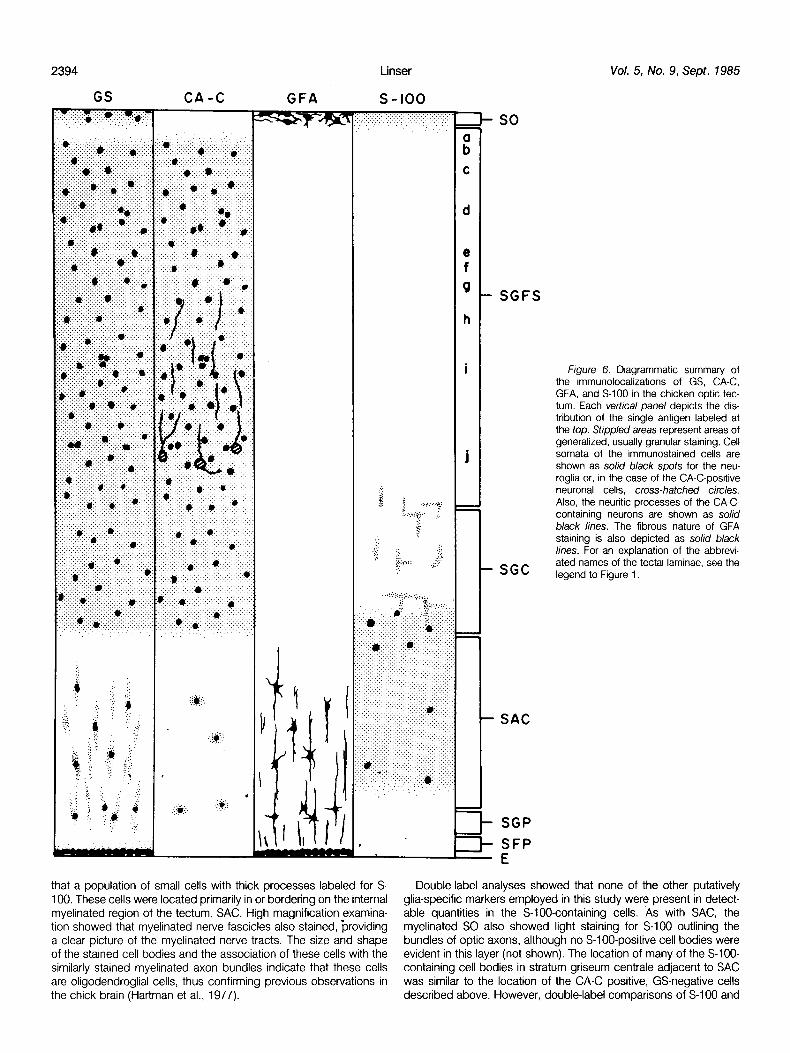
Figure 6. Diagrammatic summary of the immunolocalizations of GS, CA-C, GFA, and S-100 in the chicken optic tec- turn. Each vertical panel depicts the dis- tribution of the single antigen labeled at the top. Stippled areas represent areas of generalized, usually granular staining. Cell somata of the immunostained cells are shown as solid black spots for the neu- roglia or, in the case of the CA-C-positive neuronal cells, cross-hatched circles. Also, the neuritic processes of the CA-C- containing neurons are shown as so/id black lines. The fibrous nature of GFA staining is also depicted as solid black lines. For an explanation of the abbrevi- ated names of the tectal laminae, see the legend to Figure 1.
Double-label analyses showed that none of the other putatively
glia-specific markers employed in this study were present in detect- able quantities in the S-lOOcontaining cells. As with SAC, the
myelinated SO also showed light staining for S-100 outlining the
bundles of optic axons, although no S-100.positive cell bodies were evident in this layer (not shown). The location of many of the S-lOO-
containing cell bodies in stratum griseum centrale adjacent to SAC was similar to the location of the CA-C positive, GS-negative cells
described above. However, double-label comparisons of S-100 and

The Journal of Neuroscience Neuroglial Markers in the Avian Optic Tectum 2395
CA-C showed clearly that these are two separate populations of cells. Figure 5 shows such a comparison. In this figure, it is evident that the CA-C containing cells have a distinct morphology: the cell soma is large relative to the GS- and S-lOOcontaining glia; these cells usually have a large process which frequently bifurcates close to the cell body; the processes of these cells are distinctly oriented in a vertical pattern and show characteristic periodic varicosities (Fig. 5, a and c). On the basis of these morphological characteristics and the lack of staining for any other glial marker, I have tentatively identified these CA-C containing cells as a distinct population of neurons. Furthermore, I have applied recently described monoclonal antibodies aginst chick CA-C (Linser et al., 1984a) and against bovine S-100 (see “Materials and Methods”) to this analysis, with identical results to those generated with the polyclonal sera, thus minimizing the possibility that the antiserum to CA-C recognizes spuriously cross-reactive molecules in this population of neurons.
Figure 6 is a diagrammatic representation of the distribution of the several antigenic markers used in this study in the mature chicken optic tectum. The results indicate the presence of at least three distinguishable categories of glia: GS/CA-C-containing protoplasmic astroglia, GFA/GS-containing fibrous astroglia, and S-lOOcontaining oligodendroglia. In addition, a population of neuronal cells which stain intensely for CA-C is shown.
Discussion
Using several of the most widely accepted neuroglial-specific antigenic markers, I have examined the distribution and heteroge- neity of neuroglial cells in the chicken optic tectum. The results clearly demonstrate the presence of at least three distinguishable populations of glia on the basis of marker compartmentalization: GS/CA-C positive, GFA/GS positive, and S-l 00 positive.
The most numerous type of glia observed was the GS/CA-C positive cells. These cells are randomly distributed throughout the tectum and have a small perikaryon with very extensive fine arbori- zations. Staining for both GS and CA-C reveals a fine granular pattern in which the larger neuronal cells appear in negative staining. I interpret this to indicate that the GS/CA-C positive glia form an extensive network of cytoplasmic extensions in which the neuronal cells are embedded. This is quite consistent with the view that glial cells serve as physically and metabolically supportive cells for neurons and exemplifies the potentially insulatory role of glia (Glees, 1955). I propose that these cells are of the protoplasmic astroglial variety for several reasons. First of all, these cells are not oligoden- droglia in that they are not associated with myelinated nerve tracts and they do not contain S-100, a marker for oligodendrocytes in this system (Hartman et al., 1977). Also, it is unlikely that these cells could be microglia in that they are larger and more numerous than microglia in general (Glees, 1955). Furthermore, studies in progress in my laboratory on the development of the optic tectum both in viva and in vitro have shown that these cells arise from the neural portion of the tectum. As it is generally felt that microglia invade the brain from mesenchymal tissues late in development, the genesis of these cells from neuroectodermal tissue suggests that they cannot be microglia. Therefore, the GS/CA-C-positive glia in the optic tectum must be considered a type of astroglial cell. Due to the fact that these cells lack detectable GFA, the accepted definitive marker for fibrous astrocytes, I feel that these cells”should be considered protoplasmic astrocytes.
Two morphological variants of fibrous astroglia were observed which possessed both GS and GFA. In SO, typical fibrous astrocytes forming the glia limitans subjacent to the pial surface were evident. In addition, originating close to the ventricular surface of the tectum, a population of GS/GFA-positive astrocytes with a more extended morphology, which have been described previously (Dahl and Big- nami, 1973) were observed. These cells have very long vertical processes which extend a considerable distance through the tectal laminae toward the pial surface. The somata of these cells appeared to be confined mostly to the tectal laminae adjacent to the ventricle,
although it was frequently difficult to trace fibers to their origins as the cell bodies in general possessed little of the GFA antigen. However, developmental studies in progress have indicated that these cells are derived from the primitive ependymal glia that tran- siently extend across the entire breadth of the embryonic tectum.
The third category of neuroglia that I observed in the chick tectum was typical oligodendroglia which stained for the presence of S-l 00 protein. The identity of these cells was established by their typical morphological characteristics and their association and frequent cytoplasmic continuity with myelin sheaths. In this case, both poly- clonal as well as monoclonal antibodies to S-100 were employed yielding identical results.
In addition to the three main types of glia that I was able to distinguish, I also observed a population of CA-C-positive cells that showed no other glial characteristics. Indeed, these cells have markedly neuronal morphology with bifurcated axon-like processes which exhibit neuronotypic periodic varicosities. Although it seems likely that these cells are indeed neurons, I am currenty trying to further qualify this interpretation through the use of various markers for distinct neuronal subtypes. The immunohistochemical detection of CA-C in CNS neurons has not been previously described. In a few instances, CA-C has been found in neurons of the mammalian PNS (Wong et al., 1983) and recently in very specific populations of neurons in the neural retinas of a variety of vertebrates (Linser and Moscona, 1984). Since it is generally believed that the presence of relatively high levels of a given protein or enzyme in a specific cell population reflects a specialized function of that cell, my results raise questions concerning the need for high levels of CA-C in such a specific, limited population of neurons.
Several conclusions can be drawn from my observations. First, it is evident that, phenotypically, neuroglial cells are a very diverse group. This is not a new notion but one that is often ignored in the literature. Frequently, investigators will define a neuroglial cell as either an astrocyte or an oligodendrocyte by virtue of the presence or absence of one or two specific markers, and then draw broad conclusions concerning glia on the basis of that example. My results indicate a need for caution in such cases. For instance, if I had focused my attention only on GFA and S-100, I would have com- pletely missed the major population of GS/CA-C-positive proto- plasmic astroglia. Furthermore, if I had assumed a priori that CA-C and GFA are characteristic of oligodendroglia and astroglia, respec- tively, as is currently believed by many, I might have employed only those two markers and again drawn completely erroneous conclu- sions. It is evident that neuroglial cells are phenotypically diverse and that any investigation involving these cells must take this into account and employ several markers or criteria to define glial subtypes. This is a particularly important consideration when dealing with studies on glial cells conducted in vitro.
It should be pointed out that most of the available literature in this field has been generated using mammalian animal models. My results indicate several differences between chickens and mammals, particularly with reference to the compartmentalization of CA-C and S-100. Although there remains a controversy as to whether or not CA-C is ever found in astroglial cells in mammalian brain, it is quite clear that oligodendroglia do indeed possess high levels of this enzyme (Ghandour et al., 1979). In the chick system, however, I have not as yet found evidence of appreciable quantities of CA-C in the myelin-forming glia. Also, S-100 is reportedly found predomi- nantly in astroglia in mammalian systems (Haan et al., 1982) yet my results confirm a previous report that in the chick brain, immuno- reactive S-l 00 is primarily found in oligodendrocytes (Hartman et al., 1977). I have also examined mouse brain with my battery of anti- bodies, and it appears that mammalian and avian brain do indeed differ as described above. For example, the Golgi epithelial cells and Bergmann fibers of the mammalian cerebellum are characterized by possessing GS, GFA, and S-l 00 but not CA-C. In the chick, however, the structurally and presumably functionally analogous cells have GS and CA-C with relatively little or no GFA and no detectable S-

2396 Linser Vol. 5, No. 9, Sept. 1985
100 (P. J. Linser, unpublished observations). Absence of detectable GFA in chick Bergmann fibers has been reported previously, using antiserum to human GFA as in this study (Dahl and Bignami, 1973) and with an antiserum raised specifically against chick GFA (Tap- scott et al., 1981).
Therefore, it is possible that there are fundamental differences between the functioning of mammalian and avian neural tissue. This remains to be explored, but the observations made here suggest that comparative studies could be extremely valuable in assessing the functional significance of cell-specific compartmentalization of CA-C and S-100 in particular. To date, very little is known about the roles of these proteins in nervous tissue function, but the fact that their cellular compartments can vary between different vertebrate species may be indicative of an evolutionary change or refinement of neural tissue processes. It should be noted that the antiserum and monoclonal antibodies to S-100 used in this study were gener- ated against bovine antigen. Although the structural relatedness of chicken and mammalian immunoreactive S-100 has been docu- mented (Levine and Moore, 1965) it remains possible that the two are not functionally equivalent. This question remains to be explored. However, this does not invalidate or minimize the value of such immunological reagents in studying specific cell types in the avian or mammalian nervous system.
From the evidence presented here as well as elsewhere (Noren- berg, 1979; Linser and Moscona, 1984) it is evident that GS is a very reliable marker for astrocytic neuroglia. Indeed, I have observed that GS is much more reliable than even GFA in detecting the general population of astroglial cells. Hence, investigators should be cautious in defining glial cell populations purely on the basis of the presence or absence of GFA. In the course of other investigations, I have studied the distribution of several markers in neural tissue from at least one example of every extant class of vertebrates (Linser and Moscona, 1984). The findings indicate that glial-specific com- partmentalization of GS is characteristic of most if not all vertebrates. Therefore, it seems likely that the specific compartmentalization of GS in neuroglial cells represents a fundamental step in the evolution of the vertebrate nervous system.
References
Bignamr, A., L. F. Eng, D. Dahl, and C. T. Uyeda (1972) Localrzation of the glial fibrillary acidic protein In astrocytes by immunofluorescence. Brain Res. 43: 429-435.
Dahl, D., and A. Bignami (1973) lmmunochemical and immunofluorescence studies of the glial fibrillary acidrc protein in vertebrates. Brain Res. 67: 279-293.
Delaunoy, J. P., F. Hog, G. Deviliers, M. Bansart, P. Mandel, and M. Sensenbrenner (1980) Developmental changes and localrzation of car- bonic anhydrase In cerebral hemispheres of the rat and in rat glial cell cultures. Cell. Mol. Biol. 26: 235-240.
Eng, L. F., J. J. Vanderhaeghen, A. Bignamr, and B. Gerstl (1971) An acidrc protein isolated from fibrous astrocytes. Brain Res. 28: 351-354.
Ghandour, M. S., 0. K. Langley, G. Vincendon, and G. Gombos (1979) Double labelling immunohistochemical technique provides evidence of the specificity of glial cell markers. J. Histochem. Cytochem. 27: 1634-1637.
Glees, P. (1955) Neuroglia: Morphology, and Function, Charles C Thomas, Publisher, Springfield, IL.
Haan, E. A., B. D. Boss, and W. M. Cowan (1982) Production and charac- terization of monoclonal antibodies against the “brarn-specific” proteins 14. 3-2 and S-100. Proc. Natl. Acad. Sci. U. S. A. 79: 7585-7589.
Hamberger, A. C., G. Han Chiang, E. S. Nylen, S. W. Scheff, and C. W. Cotman (1979) Glutamate as a CNS transmitter. I. Evaluation of glucose and glutamine as precursors for the synthesis of preferentially released glutamate. Brain Res. 168: 513-530.
Hartman, B. K., M. Cimino, B. W. Moore, and H. C. Agrawal (1977) Immu- nohtstochemical localization of brain specrfic proteins during development. Trans. Am. Sot. Neurochem. 8: 66.
LaVail, J. H., and W. M. Cowan (1971) The development of the chtck optic tectum. I. Normal morphology and cytoarchitectonic development. Brarn Res. 28: 391-419.
Levine, L., and B. W. Moore (1965) Structural relatedness of a vertebrate brain acrdic protern as measured immunochemrcally. Neurosci. Res. Pro- gram Bull. 3: 18-22.
Linser, P., and A. A. Moscona (1979) Induction of glutamine synthetase in embryonic neural retina: Localizatron in Mijller fibers and dependence on cell interactions. Proc. Natl. Acad. Sci. U. S. A. 76: 6476-6480.
Linser, P., and A. A. Moscona (1981a) Developmental changes in the distributron of S-100 in avian neural retina. Dev. Neurosci. 4: 433-441.
Linser, P., and A. A. Moscona (1981 b) Carbonic anhydrase-C in the neural retina: Transition from generalized to glra-specific cell localization during embrvonlc development. Proc. Natl. Acad. Sci. U. S. A. 78: 7190-7194.
Linser, P., and A. A. ‘Moscona (1984). Variable CA II compartmentalization in vertebrate retina. Ann. N. Y. Acad. Sci. 429: 430-446.
Linser, P. J., M. S. Perkins, F. W. Fitch, and A. A. Moscona (1984a) Comparative characterization of monoclonal antrbodies to carbonic anhy: drase. Biochem. Bioohvs. Res. Commun. 125: 690-697.
Linser, P. J., M. Sorrentino, and A. A. Moscona (1984b) Cellular compart- mentalrzatron of carbonic anhydrase-C and glutamine synthetase in de- veloping and mature mouse neural retina. Dev. Brarn Res. 73: 65-73.
Maren, T. (1967) Carbonic anhydrase: Chemistry, physiology and inhibition. Physiol. Rev. 47: 595-781.
Maren, T. H., and G. Sanyal (1983) The activity of sulfonamides and anions against the carbonic anhydrases of animals, plants and bacteria. Annu. Rev. Pharmacol. Toxicol. 23: 439-459.
Norenberg, M. D. (1979) The distribution of glutamine synthetase in the rat central nervous system. J. Histochem. Cytochem. 27: 756-762.
Pettmann, B., J. Delaunoy, J. Courageot, G. Devilliers, and M. Sensenbrenner (1980) Rat brain glial cells in culture: Effects of brain extracts on the development of oligodendroglia-like cells. Dev. BIoI. 75: 278-287.
Raff, M. C., K. L. Fields, S. Hakomori, R. Mirsky, R. M. Pruss, and J. Winter (1979) Cell-type-specific markers for distinguishing and studying neurons and their maior classes of altal cells in culture. Brain Res. 174: 283-308.
Roots, B. E. (1982) Compa&ve studies on glial markers. J. Exp. BIoI. 95: 167-180.
Schachner, M., E. T. Hedley-White, D. W. Hsu, G. Schoonmaker, and A. Bignami (1977) Ultrastructural localization of glial fibrillary acidic protein in mouse cerebellum by immunoperoxidase labelling. J. Cell Biol. 75: 67-73.
Stewart, R. M., and R. N. Rosenberg (1979) Physrology of glia: Glial-neuronal interactions. Int. Rev. Neural. 27: 275-309.
Tapscott, S. J., G. S. Bennett, Y. Koyama, F. Kleinhart, and H. Holtzer (1981) Intermediate filament proteins in the developing chick spinal cord. Dev. Biol. 86: 40-54.
Wong, V., C. P. Barrett, E. J. Donati, L. F. Eng, and L. Guth (1983) Carbonic anhydrase activity In first-order sensory neurons of the rat. J. Histochem. Cytochem. 37: 293-300.


![POSSIBLE ROLES OF VERTEBRATE NEUROGLIA IN POTASSIUM DYNAMICS, SPREADING DEPRESSION AND ...ucgbarg/res/jeb_95_111.pdf · 2009-07-15 · Vertebrate neuroglia in potassium dynamics HighEC[K+]](https://static.fdocuments.in/doc/165x107/5f14071992d3e603436d6ccc/possible-roles-of-vertebrate-neuroglia-in-potassium-dynamics-spreading-depression.jpg)