
Theoretical Determination of Rate Constants from Excited ...
University of New Orleans University of New Orleans
ScholarWorks@UNO ScholarWorks@UNO
Electrical Engineering Faculty Publications Department of Electrical Engineering
10-15-1984
Multiple determination of the optical constants of thin-film Multiple determination of the optical constants of thin-film
coating materials coating materials
D. P. Arndt
R. M.A. Azzam University of New Orleans, [email protected]
J. M. Bennett
J. P. Borgogno
C. K. Carniglia
See next page for additional authors
Follow this and additional works at: https://scholarworks.uno.edu/ee_facpubs
Part of the Electrical and Electronics Commons, and the Optics Commons
Recommended Citation Recommended Citation D. P. Arndt, R. M. A. Azzam, J. M. Bennett, J. P. Borgogno, C. K. Carniglia, W. E. Case, J. A. Dobrowolski, U. J. Gibson, T. Tuttle Hart, F. C. Ho, V. A. Hodgkin, W. P. Klapp, H. A. Macleod, E. Pelletier, M. K. Purvis, D. M. Quinn, D. H. Strome, R. Swenson, P. A. Temple, and T. F. Thonn, "Multiple determination of the optical constants of thin-film coating materials," Appl. Opt. 23, 3571-3596 (1984)
This Article is brought to you for free and open access by the Department of Electrical Engineering at ScholarWorks@UNO. It has been accepted for inclusion in Electrical Engineering Faculty Publications by an authorized administrator of ScholarWorks@UNO. For more information, please contact [email protected].

Authors Authors D. P. Arndt, R. M.A. Azzam, J. M. Bennett, J. P. Borgogno, C. K. Carniglia, W. E. Case, J. A. Dobrowolski, U. J. Gibson, T. Tuttle Hart, F. C. Ho, V. A. Hodgkin, W. P. Klapp, H. A. Macleod, E. Pelletier, M. K. Purvis, D. M. Quinn, D. H. Strome, R. Swenson, P. A. Temple, and T. F. Thonn
This article is available at ScholarWorks@UNO: https://scholarworks.uno.edu/ee_facpubs/92
Multiple determination of the optical constants of thin-filmcoating materials
D. P. Arndt, R. M. A. Azzam, J. M. Bennett, J. P. Borgogno, C. K. Carniglia, W. E. Case,
J. A. Dobrowolski, U. J. Gibson, T. Tuttle Hart, F. C. Ho, V. A. Hodgkin, W. P. Klapp, H. A. Macleod,
E. Pelletier, M. K. Purvis, D. M. Quinn, D. H. Strome, R. Swenson, P. A. Temple, and T. F. Thonn
The seven participating laboratories received films of two different thicknesses of Sc203 and Rh. All sam-
ples of each material were prepared in a single deposition run. Brief descriptions are given of the various
methods used for determination of the optical constants of these coating materials. The measurement dataare presented, and the results are compared. The mean of the variances of the Sc203 refractive-index deter-minations in the 0.40-0.75-nm spectral region was 0.03. The corresponding variances for the refractive
index and absorption coefficient of Rh were 0.35 and 0.26, respectively.
These letters link the participating groups of authors to the sub-sections of Section III:
A-D. P. Arndt, J. M. Bennett, V. A. Hodgkin, and P. A. Temple are
with U.S. Naval Weapons Center, Physics Division, Michelson Lab-oratory, China Lake, California 93555.
B-R. M. A. Azzam and T. F. Thona are with University of NewOrleans, Department of Electrical Engineering, Lakefront, New Or-leans, Louisiana 70148.
C-J. P. Borgogno and E. Pelletier are with Rcole Nationale Su-p6rieure de Physique, Centre d':tude des Couches Minces, Domaine
Universitaire de St. Jer6me, 13397 Marseille CEDEX 13, France.
D-C. K. Carniglia, T. Tuttle Hart, W. P. Klapp, and D. M. Quinnare with Optical Coating Laboratory, Inc., 2789 Northpoint Parkway,Santa Rosa, California 95407-7397.
E-W. E. Case, M. K. Purvis, and D. H. Strome are with LTVAerospace & Defense Company, Vought Missiles & Advanced Pro-grams Division, P.O. Box 225907, Dallas, Texas 75265.
F-J. A. Dobrowolski and F. C. Ho are with National ResearchCouncil of Canada, Division of Physics, Ottawa, Ontario, KlA OR6.
G-U. J. Gibson and R. Swenson are with University of Arizona,Optical Sciences Center, Tucson, Arizona 85721.
H-H. A. Macleod and R. Swenson are with University of Arizona,Optical Sciences Center, Tucson, Arizona 85721.
Received 11 May 1984.
1. Introduction
There are numerous applications for optical multi-layer interference coatings in science and technology.In the past years sophisticated designs based on use ofboth absorbing and nonabsorbing coating materialshave become commonplace. For economic reasons theprocess still most commonly used for the preparationof such systems is based on thermal evaporation in avacuum. It is common knowledge, however, that filmsproduced by this process in different laboratories (orindeed, in different deposition systems of the samelaboratory) have different optical constants. This isbecause different deposition geometries and conditionsgive rise to different film structures and composi-tions.
For the design and manufacture of multilayers a goodknowledge of the refractive indices and absorptioncoefficients of the coating materials is essential. It is,therefore, not surprising that there exist hundreds ofpapers devoted to determination of these parameters.It almost seems that every laboratory has its own fa-vorite method.
The Optical Materials and Thin Films TechnicalGroup of the Optical Society of America organized aSymposium on the Characterization of the Optical andMechanical Properties of Optical Coating Materials1 2
at the 1983 Annual Meeting of the Society in New Or-leans. In conjunction with this symposium it seemedappropriate to hold a panel discussion on the mea-surement of the optical constants of absorbing andnonabsorbing thin films. The panel consisted of R. M.A. Azzam, J. M. Bennett, W. E. Case, C. K. Carniglia,J. A. Dobrowolski (Chairman), U. J. Gibson, H. A.Macleod, and E. Pelletier.
15 October 1984 / Vol. 23, No. 20 / APPLIED OPTICS 3571
The intention of the panel discussion was to dem-onstrate that, even for nominally the same films, carefulexperimenters will obtain different values of the opticalconstants, depending on the method used and the modelassumed for the films. To this end the panelists wereasked to use their favorite method to determine theoptical constants from two samples each of one metallicand one dielectric coating material supplied to them.They were requested to give a brief description of theirmethod and to present their results in graphical ortabular form during the panel discussion. These re-sults, and their intercomparison, resulted in a livelydiscussion. Many members of the audience requestedthat this work be made available in Applied Optics.This was made possible through the generous cooper-ation of the panelists and their colleagues.
It may be of interest to state briefly how this paperwas written. Because it was deemed desirable that thecontributions from the various laboratories cover thesame ground, a brief set of instructions was prepared.Among other things, it was suggested that reference bemade to a published description of the method with onlya skeleton outline in the present text. Only if this werenot possible should an adequate, but laconic, descrip-
tion be given. The thin-film model and assumptionsused in the calculations were to be clearly stated. Theapparatus used, cleaning procedures employed, and theconditions prevailing during the measurements were tobe described. Whenever possible, raw measurementdata were to be included. Results were to be presentedin graphical or tabular form together with an estimateof the sensitivity of the determination. The perceivedadvantages and disadvantages of the method were to bestated.
The paper was prepared for publication by J. A. Do-browolski, who also wrote Secs. I and IV. C. K. Carni-glia provided Sec. II. The texts from the participatinggroups were edited only to standardize nomenclature,units, and format. They are presented in Sec. III.A-III.H. (The letters A-H correspond to the groups in thebyline.) The symbols adopted for this paper are de-fined in Table I. Some tables were merged, and one ortwo figures with data that also appeared in tabular formwere omitted to reduce the length of the paper. Mostfigures were redrawn. The resulting manuscript wassubmitted to all participating laboratories for correc-tions and approval.
Table I. Terminology Used in This Paper
A
tno ns
- wavelength (nm)
- thickness of film (nm)
- refractive index of air,
substrate
n, n, n - film refractive indices: average,
and at air, substrate interfaces
Tf, Rf, Tf
TobsT*
- inhomogeneity of film refractive
index
k - film absorption coefficient
A, A' - film absorption for front, back
surface incidence of light
Tw, Rw - transmittance, reflectance of
uncoated witness
Rwc - as above, but calculated value
Ts R - transmittance, reflectance of
single, uncoated surface of
substrate
T, R, R' - transmittance, front- and back
surface reflectances of coated
substrate with second surface
reflections
TC, R, Rc' - as above, but calculated values
Tp(#), Rp ()
- transmittance, front- and back
surface reflectances of film on
substrate without second surface
reflections
- T/Tw
- transmittance of coated substratewith uncoated witness oiled on
- angle of incidence ()
- transmittance, reflectance for
light incident at +* and
polarized parallel to plane ofincidence
Ts(+), R4) - as above, but for light polarized
perpendicular to plane of
incidence
Tmax, Tmin - transmittance at maximum, minimum
RmaxI RminTint
A , *
- reflectance at maximum, minimum
- maximum transmittance
interpolated to position of
minimum
- ellipsometric angles
3572 APPLIED OPTICS / Vol. 23, No. 20 / 15 October 1984
An
11. Sample Preparation
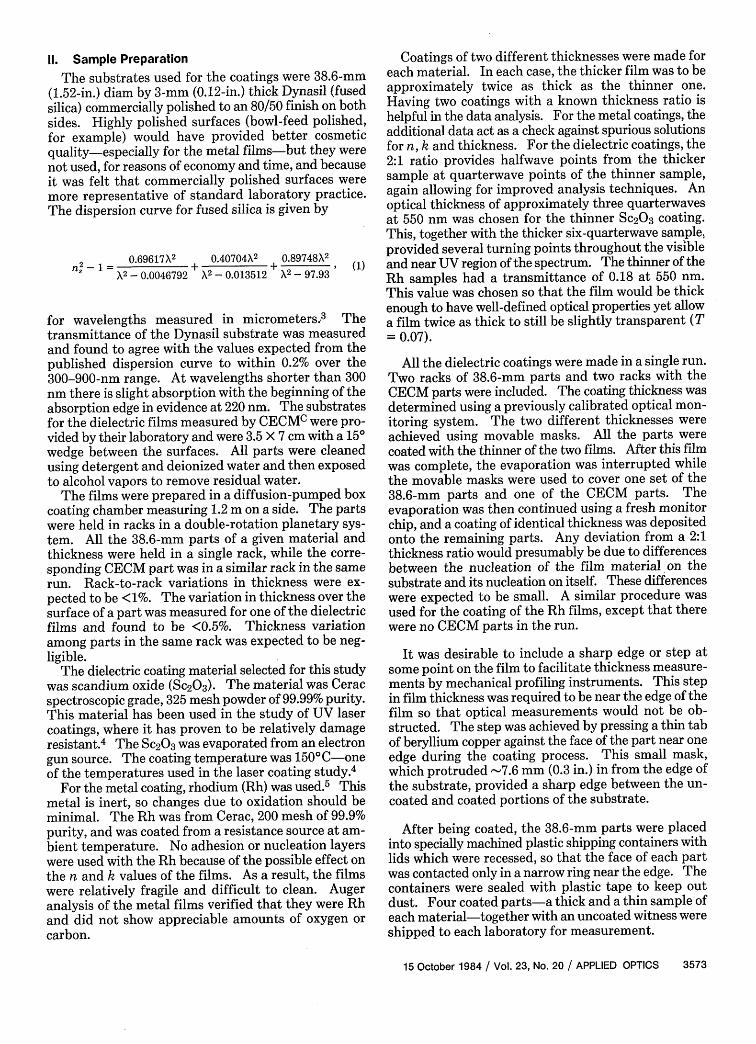
The substrates used for the coatings were 38.6-mm(1.52-in.) diam by 3-mm (0.12-in.) thick Dynasil (fusedsilica) commercially polished to an 80/50 finish on bothsides. Highly polished surfaces (bowl-feed polished,for example) would have provided better cosmeticquality-especially for the metal films-but they werenot used, for reasons of economy and time, and becauseit was felt that commercially polished surfaces weremore representative of standard laboratory practice.The dispersion curve for fused silica is given by
2 1 0.69617X2 0.40704X2 0.89748X2.- 1= + + I (1)X2 - 0.0046792 X2
- 0.013512 X2- 97.93
for wavelengths measured in micrometers,3 Thetransmittance of the Dynasil substrate was measuredand found to agree with the values expected from thepublished dispersion curve to within 0.2% over the300-900-nm range. At wavelengths shorter than 300nm there is slight absorption with the beginning of theabsorption edge in evidence at 220 nm. The substratesfor the dielectric films measured by CECMC were pro-vided by their laboratory and were 3.5 X 7 cm with a 150wedge between the surfaces. All parts were cleanedusing detergent and deionized water and then exposedto alcohol vapors to remove residual water.
The films were prepared in a diffusion-pumped boxcoating chamber measuring 1.2 m on a side. The partswere held in racks in a double-rotation planetary sys-tem. All the 38.6-mm parts of a given material andthickness were held in a single rack, while the corre-sponding CECM part was in a similar rack in the samerun. Rack-to-rack variations in thickness were ex-pected to be <1%. The variation in thickness over thesurface of a part was measured for one of the dielectricfilms and found to be <0.5%. Thickness variationamong parts in the same rack was expected to be neg-ligible.
The dielectric coating material selected for this studywas scandium oxide (Sc20 3). The material was Ceracspectroscopic grade, 325 mesh powder of 99.99% purity.This material has been used in the study of UV lasercoatings, where it has proven to be relatively damageresistant. 4 The Sc2 03 was evaporated from an electrongun source. The coating temperature was 1500C-oneof the temperatures used in the laser coating study.4
For the metal coating, rhodium (Rh) was used. 5 Thismetal is inert, so changes due to oxidation should beminimal. The Rh was from Cerac, 200 mesh of 99.9%purity, and was coated from a resistance source at am-bient temperature. No adhesion or nucleation layerswere used with the Rh because of the possible effect onthe n and k values of the films. As a result, the filmswere relatively fragile and difficult to clean. Augeranalysis of the metal films verified that they were Rhand did not show appreciable amounts of oxygen orcarbon.
Coatings of two different thicknesses were made foreach material. In each case, the thicker film was to beapproximately twice as thick as the thinner one.Having two coatings with a known thickness ratio ishelpful in the data analysis. For the metal coatings, theadditional data act as a check against spurious solutionsfor n, k and thickness. For the dielectric coatings, the2:1 ratio provides halfwave points from the thickersample at quarterwave points of the thinner sample,again allowing for improved analysis techniques. Anoptical thickness of approximately three quarterwavesat 550 nm was chosen for the thinner Sc20 3 coating.This, together with the thicker six-quarterwave sample,provided several turning points throughout the visibleand near UV region of the spectrum. The thinner of theRh samples had a transmittance of 0.18 at 550 nm.This value was chosen so that the film would be thickenough to have well-defined optical properties yet allowa film twice as thick to still be slightly transparent (T= 0.07).
All the dielectric coatings were made in a single run.Two racks of 38.6-mm parts and two racks with theCECM parts were included. The coating thickness wasdetermined using a previously calibrated optical mon-itoring system. The two different thicknesses wereachieved using movable masks. All the parts werecoated with the thinner of the two films. After this filmwas complete, the evaporation was interrupted whilethe movable masks were used to cover one set of the38.6-mm parts and one of the CECM parts. Theevaporation was then continued using a fresh monitorchip, and a coating of identical thickness was depositedonto the remaining parts. Any deviation from a 2:1thickness ratio would presumably be due to differencesbetween the nucleation of the film material on thesubstrate and its nucleation on itself. These differenceswere expected to be small. A similar procedure wasused for the coating of the Rh films, except that therewere no CECM parts in the run.
It was desirable to include a sharp edge or step atsome point on the film to facilitate thickness measure-ments by mechanical profiling instruments. This stepin film thickness was required to be near the edge of thefilm so that optical measurements would not be ob-structed. The step was achieved by pressing a thin tabof beryllium copper against the face of the part near oneedge during the coating process. This small mask,which protruded -7.6 mm (0.3 in.) in from the edge ofthe substrate, provided a sharp edge between the un-coated and coated portions of the substrate.
After being coated, the 38.6-mm parts were placedinto specially machined plastic shipping containers withlids which were recessed, so that the face of each partwas contacted only in a narrow ring near the edge. Thecontainers were sealed with plastic tape to keep outdust. Four coated parts-a thick and a thin sample ofeach material-together with an uncoated witness wereshipped to each laboratory for measurement.
15 October 1984 / Vol. 23, No. 20 / APPLIED OPTICS 3573
Ill. Determination of the Optical Constants
A. R, T, t Method
The optical constants of the SC2 0 3 and Rh films werecalculated from measurements of the film thickness,normal incidence reflectance R, and transmittance T.Two different instruments were used for the R and Tmeasurements.
A 50-mW Spectra-Physics model 171-19 argon-ionlaser with a beam diameter of -2 mm was used tomeasure T at normal incidence and R at 10 incidenceat wavelengths of 488.0 and 514.5 nm. Each film-coatedsample had an additional fused quartz substrate oiledonto the back surface using an index matching fluid toeliminate interference effects of the laser beam in the3.2-mm (0.125-in.) thick substrate. Both R and Twere determined as ratios of sample-in to sample-outof the beam in the single beam instrument (see TableII). To eliminate the effect of source fluctuations, twoLaser Precision pyroelectric detectors ratioed the signalfrom the sample, or from the beam at the sample posi-tion, to the incident beam. The precision (repeatabil-ity) of the R and T measurements was a few parts in thefourth decimal place, while the accuracy was approxi-mately 0.001.
Normal incidence transmittance was also measuredat eight wavelengths in the 450-800-nm wavelengthrange as the ratio of T, the film-coated sample trans-mittance, to T, the transmittance of an identical un-coated fused quartz substrate. The film-coated anduncoated substrates were alternately placed in front ofthe entrance slit of a spectrophotometer designed tomeasure the change in reflectance with temperature 6
The instrument had Perkin-Elmer Corp. source optics
(tungsten source) and a P-E model 99 double-passmonochromator with a potassium bromide prism dis-perser. Since the source optics module was enclosed,the sample and bare substrate became slightly heated,but the temperature was not measured. The standarddeviation of the twelve ratio measurements made ateach wavelength was -0.06% of the C20 3 ratio and'-0.03% of the Rh ratio. Since the ratios were quitedifferent for the two materials (see Table III), the ab-solute values of the standard deviations differed ac-cordingly. The accuracy of the measurements wasprobably better than 0.1% and included factors such asthe linearity of the detector and electronics and thewavelength calibration. All the measurements weremade with the samples in room air.
Before the C203 samples were measured, they weredrag wiped once using Kodak lens tissue moistened withmethanol (gas chromatography grade). An attempt wasmade to drag wipe the thick Rh sample, but the filmbecame badly scratched. Fortunately we were able toobtain the sample that had been measured at OCLI.
The normal incidence reflectance of the samples wasnot measured at NWC, except at the two argon wave-lengths, because the absolute reflectometer7 was not inoperation. However, OCLI kindly provided absolutereflectance data for the Rh films measured on a Cary17D spectrophotometer using a V-W attachment.Details of the measurements are given in Sec. III.D.The Rh films appeared to contain pinholes and possiblyparticulate contamination when observed underNomarski illumination. These defects were avoidedas much as possible when making the optical measure-ments described above.
Thicknesses of all four films were measured on aTalystep surface profiling instrument 8 at three positions
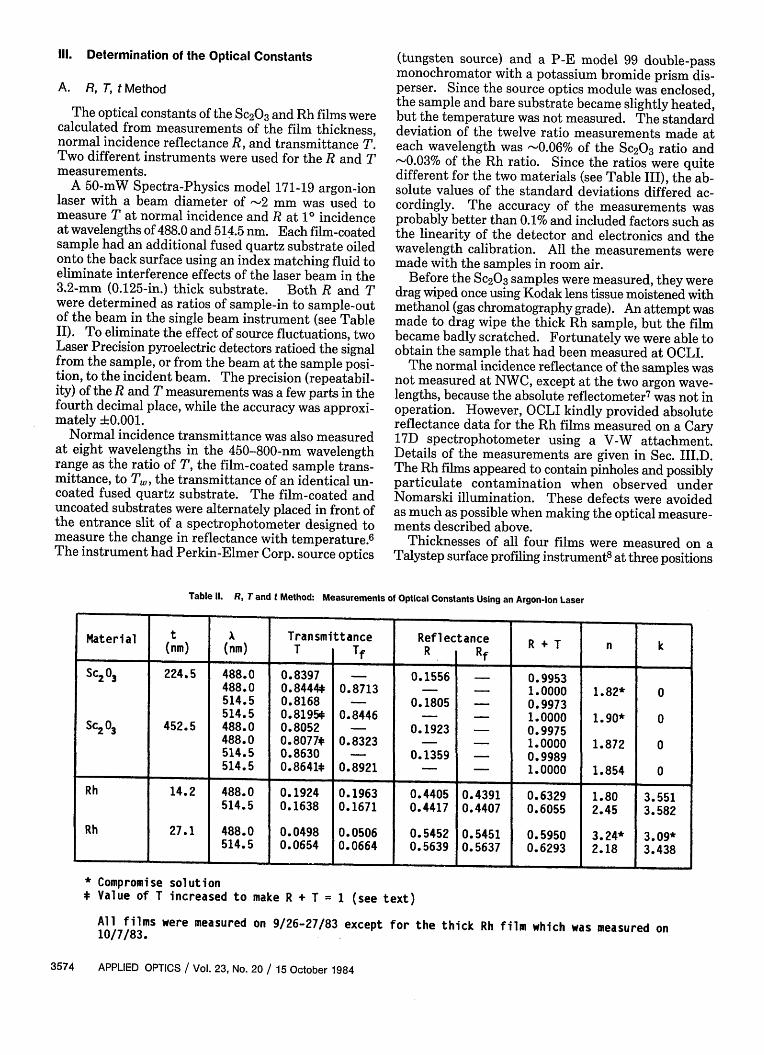
Table II. R, T and t Method: Measurements of Optical Constants Using an Argon-Ion Laser
Material t Transmittance Reflectance R + T n k(nm) (nm) T Tf RI Rf _____
Sc2 03 224.5 488.0 0.8397 - 0.1556 - 0.9953488.0 0.8444 0.8713 - - 1.0000 1.82* 0514.5 0.8168 - 0.1805 - 0.9973514.5 0.81951: 0.8446 - - 1.0000 1.90* 0
SC2 03 452.5 488.0 0.8052 - 0.1923 - 0.9975488.0 0.8077* 0.8323 - - 1.0000 1.872 0514.5 0.8630 - 0.1359 - 0.9989514.5 0.8641* 0.8921 - - 1.0000 1.854 0
Rh 14.2 488.0 0.1924 0.1963 0.4405 0.4391 0.6329 1.80 3.551514.5 0.1638 0.1671 0.4417 0.4407 0.6055 2.45 3.582
Rh 27.1 488.0 0.0498 0.0506 0.5452 0.5451 0.5950 3.24* 3.09*514.5 0.0654 0.0664 0.5639 0.5637 0.6293 2.18 3.438
* Compromise solution* Value of T increased to make R + T = 1 (see text)
All films were measured on 9/26-27/83 except for the thick Rh film which was measured on10/7/83.
3574 APPLIED OPTICS Vol. 23, No. 20 15 October 1984
along the 12.7-mm (0.5-in.) long masked region near theedge of each sample. A 2-mg stylus loading was usedto obtain a nondestructive measurement of the step.This loading was previously found to not leave perma-nent marks on films of the type measured here. Theresults are as follows:
Sc2 03 (thick) 452.5 i 1.4 nm, Rh (thick) 27.1 + 1.4 nm,
(thin) 224.5 i 0.7 nm, (thin) 14.2 + 1.7 nm.
The uncertainties in the Sc203 film thicknesses areprimarily caused by the 3.27 and 1.63-nm digitizationincrements of the profile data for the thick and thinfilms plus small actual thickness variations between thethree places measured. (Two measurements were madeat each place.) The uncertainties in the Rh filmthicknesses are caused by the -3.5-nm peak-to-valleyroughness of the commercially polished fused silicasubstrates. The height calibration of the Talystep in-
strument was checked at the time of the measurementsusing a 702.2-nm thick Ge film that had previously beenmeasured on a FECO interferometer. 9 The instrumentcalibration was found to be good to -0.2% of the totalfilm thickness. The thin Sc20 3 and Rh films were in-tended to be half 'as thick as the thick films of the samematerials. This is certainly true for the Rh films andprobably also true for the Sc203 films, although thedifference is outside the quoted uncertainties.
The measured R and T data for all films and also thecalculated optical constants are shown in Tables II andIII. Table II contains measurements taken with theargon-ion laser, while Table III includes NWC trans-mittance data and OCLI reflectance data taken onspectrophotometer-type instruments. (The OCLI dataare from a continuous wavelength scan while the NWCmeasurements were taken point by point.) In Table IIthe columns labeled T and R are the measured quan-
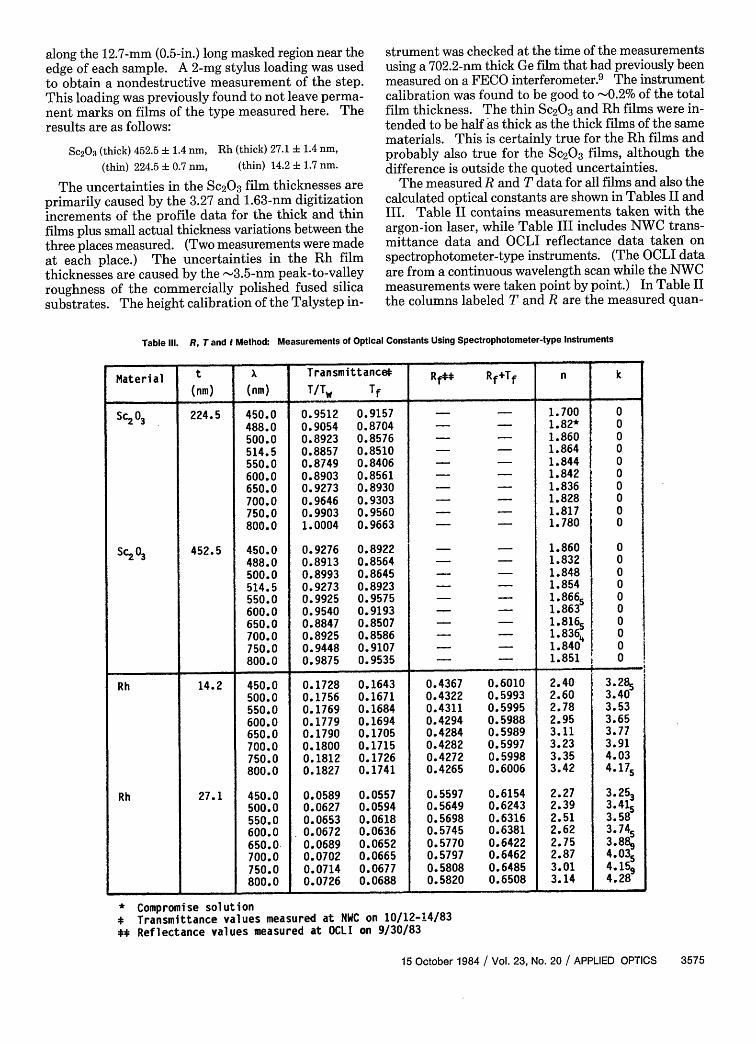
Table I. R, T and t Method: Measurements of Optical Constants Using Spectrophotometer-type Instruments
Material t X Transmittancel: Rf** Rf+Tf n k(nm) (nm) T/Tw Tf
SC203 224.5 450.0 0.9512 0.9157 - - 1.700 0488.0 0.9054 0.8704 - - 1.82* 0500.0 0.8923 0.8576 - - 1.860 0514.5 0.8857 0.8510 - - 1.864 0550.0 0.8749 0.8406 - - 1.844 0600.0 0.8903 0.8561 - - 1.842 0650.0 0.9273 0.8930 - - 1.836 0700.0 0.9646 0.9303 - - 1.828 0750.0 0.9903 0.9560 - - 1.817 0800.0 1.0004 0.9663 - - 1.780 0
Sc2 03 452.5 450.0 0.9276 0.8922 - - 1.860 0488.0 0.8913 0.8564 - - 1.832 0500.0 0.8993 0.8645 - - 1.848 0514.5 0.9273 0.8923 - - 1.854 0550.0 0.9925 0.9575 - - 1.8665 0600.0 0.9540 0.9193 - - 1.863 0650.0 0.8847 0.8507 - - 1.8165 0700.0 0.8925 0.8586 - - 1.8364 0750.0 0.9448 0.9107 - - 1.840 0800.0 0.9875 0.9535 - - 1.851 0
Rh 14.2 450.0 0.1728 0.1643 0.4367 0.6010 2.40 3.28S500.0 0.1756 0.1671 0.4322 0.5993 2.60 3.40550.0 0.1769 0.1684 0.4311 0.5995 2.78 3.53600.0 0.1779 0.1694 0.4294 0.5988 2.95 3.65650.0 0.1790 0.1705 0.4284 0.5989 3.11 3.77700.0 0.1800 0.1715 0.4282 0.5997 3.23 3.91750.0 0.1812 0.1726 0.4272 0.5998 3.35 4.03800.0 0.1827 0.1741 0.4265 0.6006 3.42 4.175
Rh 27.1 450.0 0.0589 0.0557 0.5597 0.6154 2.27 3. 253500.0 0.0627 0.0594 0.5649 0.6243 2.39 3.41550.0 0.0653 0.0618 0.5698 0.6316 2.51 3.585600.0 0.0672 0.0636 0.5745 0.6381 2.62 3.745650.0 0.0689 0.0652 0.5770 0.6422 2.75 3.88w700.0 0.0702 0.0665 0.5797 0.6462 2.87 4.035750.0 0.0714 0.0677 0.5808 0.6485 3.01 4.15w800.0 0.0726 0.0688 0.5820 0.6508 3.14 4.28
* Compromise solution* Transmittance values measured at NWC on 10/12-14/8314 Reflectance values measured at OCLI on 9/30/83
15 October 1984 / Vol. 23, No. 20 / APPLIED OPTICS 3575
tities for each sample, which include the effect of theback surface of the substrate and multiple reflectionswithin the substrate. The columns labeled Tf and Rfare the corrected values of transmittance or reflectancefrom air, through the film, and into the substrate.These are used in the calculations of optical constants,as discussed in the next section. The measured samplereflectance and transmittance are summed in the col-umn labeled R + T. The sum for the Sc20 3 films isnearly unity, indicating that the residual absorption andscattering losses are small. The reflected scattering intoa hemisphere was measured at a wavelength of 514.5 nmfor these two films using the Optical Evaluation Facility(OEF)10; the hemispherical scattering was 2.9 X 10⁻⁴of the incident beam intensity, about an order of mag-nitude smaller than the differences from unity given inTable II. Because of the small depth of focus in theOEF, the measured scattering primarily occurred in thefilm. Some scattering could be seen in the indexmatching fluid when the samples were illuminated bythe argon-ion laser. Scattering and absorption in theindex matching fluid could probably account for all thedifference from unity of the R + T values. Thus theSc203 films were assumed to be nonabsorbing and ho-mogeneous, and the transmittance values were in-creased to make R + T = 1 in the calculations of theoptical constants. The second entries in the T columnat each wavelength give these values.
In Table III the columns under Transmittance giveT/T, and T as previously mentioned. In the measuredOCLI reflectance data Rf for the Rh films, the effect ofthe back surface of the substrate has been neglected.
The measured data for the Sc2 03 films were correctedand the optical constants were calculated as follows.Since k was assumed to be zero, n could be calculatedfrom the measured transmittance and film thickness;reflectance data are not needed. To obtain T withoutthe effect of the back surface of the substrate andmultiple reflections within the substrate, the T valuesin Table II were corrected using Eq. (16) in Ref. 11:
T = T( - RR)IT., (2)where T and R are the air-substrate transmittanceand reflectance for a bare single surface. Here T wascalculated twice using, first, a value of 1 - T for R and,second, the 1 - T value from the first calculation. Tocalculate T from T/T, in Table III, the latter valueswere multiplied by the calculated transmittance T ofan uncoated fused silica sample, taking into accountboth surfaces and multiple reflections within the sam-ple. The value of T was calculated from Eq. (15) inRef. 11; refractive-index values for fused silica wereobtained from the AMERICAN INSTITUTE OFPHYSICS HANDBOOK. 3
The Rh transmittance values T/T, in Table III werefirst multiplied by T as for the Sc203 films. Then Tin both tables was changed to T using Eq. (11) fromRef. 6:
T = Tob(l - R + RA)I[1 + R( - Tbs), (3)
where Tobs is TIT, and A is the absorption in the film.
(Actually A is the absorption in the film when light isincident on the film from the substrate side. However,since Tf is so close to Tpbs, the small difference betweenAf and At is negligible.) Since Af is equal to 1 - Tf -Rf and T is nearly equal to Tf, T can be used in place ofTf to calculate At. No correction was necessary for theRh reflectance data in Table III since Rf was measureddirectly. In Table II, the approximate relation
Rf = R-T R(1 -Tf) (4)
was used to correct the R values of the Rh films. Sincethe difference between R and Rf was very small, only-0.001, Rf in the second term on the right-hand side ofEq. (4) was assumed to equal R. The differences be-tween T and Tf for the thin and thick Rh films were alsoonly a few tenths of a percent.
An iterative approach was used to obtain n and k forthe Rh and n for the Sc20 3 films. Equations similar tothe form given by Hass on p. 6-120 of Ref. 3 were pro-grammed into a Hewlett-Packard calculator. Guesseswere made for n and k; Tf and also Rf (for the Rh films)were calculated and compared with the measuredquantities. The values of n and k were adjusted untilthe calculated and measured quantities agreed withinthe limits of experimental error, and the results aregiven in Tables II and III. In some cases (asterisks)exact solutions were not possible, probably because ofinhomogeneities in the films, so compromise solutionsare given where the fits are closest for both n and k.
The optical constants calculated for the Sc203 filmsshow more variation than might be expected or desired.Specifically, the optical constants determined with theargon laser (Table II) do not agree for the two films anddo not agree with values calculated from the spectro-photometer measurements in Table III. The opticalconstants for the two films in Table III do not agree witheach other and, furthermore, have different wavelengthdependences. Comparing the T values in Tables IIand III for the two Sc20 3 films at 488.0 and 514.5 nm,it is seen that two of the values agree almost exactly, butthe two others differ by more than the combined as-sumed errors in the measurements. The worst agree-ment is for the 452.5-nm thick Sc20 3 film at 488.0 nmwhere the T values differ by 0.0241. A possible ex-planation for these discrepancies is that the films areinhomogeneous-the optical constants may vary as afunction of distance from the substrate or spatiallyacross the substrate or both. Since different areas ofthe films were illuminated in the two instruments,spatial variations in film homogeneity could account forsome of the observed effects. However, the fact thatno single value of n could be used to predict the mea-sured transmittance at 488.0 nm for the thinner filmsuggests that there is at least some inhomogeneity as afunction of depth within the film. Another possiblecontributing factor would be a variation in film thick-ness as a function of position on the film, at least to theextent that it was different in the center where thetransmittance was measured and at the edge where thethickness was measured. Spatial variation measure-ments were made at a wavelength of 488.0 nm on the
3576 APPLIED OPTICS / Vol. 23, No. 20 / 15 October 1984
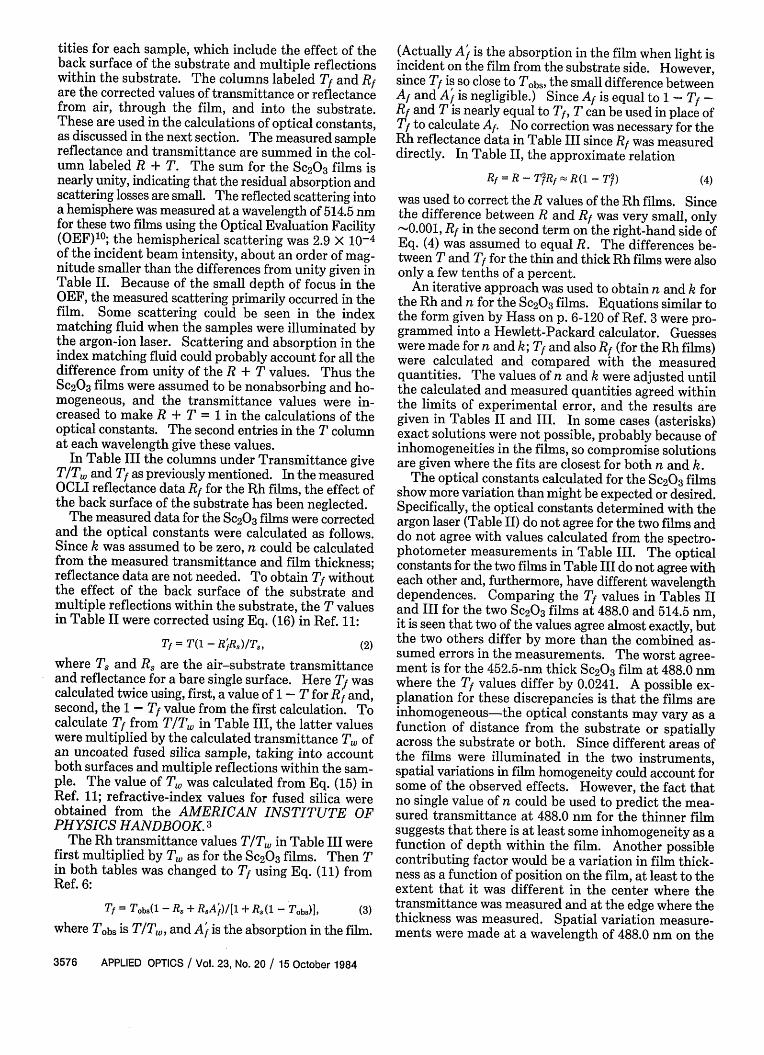
Table IV. R, T and t Method: Measurements on the 14.2-nm Thick Rh Film Using the Argon Laser; X = 488.0 nm
Date T R R + T Position
9/27/83 0.1924 0.4405 0.6329 Center10/14/83 0.1773 0.4362 0.6135 Center10/14/83 0.1763 0.4432 0.6195 2 n off center10/14/83 0.1622 0.4255 0.5877 4 m off center
thick Sc203 film using the argon laser. The value of R+ T varied by a maximum of only 0.005 over a 4-mmdistance on the film.
The optical constants calculated for the Rh films alsoshow some inconsistencies. However, in Table III thevalues of n and k increase with increasing wavelengthfor both films as well as in Table II where solutions forn and k were found. Note that the Rf + Tf values forthe thinner Rh film are nearly independent of wave-length, whereas they increase with wavelength for thethicker film. The absolute magnitude of Rf + Tf islarger for the thicker film, meaning that the absorption,1 - Rf - Tf, is smaller. This latter conclusion issomewhat uncertain since the measurements were madeon different thin Rh films but the same thick Rh film(although at different times). Also, aging effects wereobserved, as noted below.
Aging effects and spatial variations in the filmproperties were observed in the argon laser measure-ments on the thinner Rh film, as shown in Table IV.These indicate that not only is the absorption changingwith time but also there is a short range spatial variationof the absorption. Further measurements should bemade to determine if this effect is general for Rh orsimply a one-time occurrence for this particular film.With a precise instrument, variations of 0.02 such asseen here should be easily measured.
In conclusion, the advantage of the normal incidenceR, T, and film thickness method is that high accuracy,
t0.001, optical measurements can be made with aminimum of systematic errors, and the mechanical filmthickness can be measured with a small percentage erroras long as the substrates on which the films are depos-ited are smooth compared with the film thickness. Themethod cannot give information about film inhomo-geneities unless additional assumptions are made.Either a solution for n and k is obtained which fits themeasured data, or it is not. With a small diameter laserbeam as an illuminating source, differences in filmproperties can easily be detected as a function of posi-tion on the sample.
B. Reflection Ellipsometry
In ellipsometry12 measurements of the polarizationstates of collimated monochromatic light before andafter reflection from a surface permit determination ofthe ratio, p = Rp/R, = tan4 exp(iA), of the complex pand s reflection coefficients. A model of the reflectingsample is assumed (in the present case a homogeneousisotropic film with plane-parallel boundaries on asemi-infinite homogeneous and isotropic substrate), and
the ratio of reflection coefficients is also computed.Model parameters (film complex refractive index n -ik and thickness t) are sought (and found) that bestmatch the computed and measured values of p.
Two-zone null measurements 1 3 were taken on aGaertner L119XUV ellipsometer with a He-Ne laser (X= 632.8 nm) and also with a Hg/Xe-arc lamp filtered bya GS100 Schoeffel monochromator (1-mm slit width =8.5 nm) to pass a few visible wavelengths ( = 404.7,486.1, and 546.1 nm). At these wavelengths the Babi-net-Soleil compensator settings for quarterwave re-tardation were already known. Measurements weremade on all the samples as received (with no furthercleaning) and in air.
To test the utility of multiple-angle-of-incidence el-lipsometry (MAIE) for the determination of n, k, andt of the same film, data were initially taken on eachsample at incidence angles 0 = 40 and 80° with X =632.8 nm. Having found that inversion of the ellipso-metric equations using MAIE (2-(k) data is inferior toinversion based on (2 - t) data obtained on the twodifferent-thickness films of the same material, all sub-sequent measurements, at all other wavelengths, weremade at 0 = 600 only.
For the bare fused silica substrate a pseudocomplexrefractive index 1ii - ik8 was determined at each-wavelength by ellipsometry. The value of n was con-sistently slightly less (by 0.01) than the correspondingvalue obtained by Malitson14 using a prism refractionmethod, and k8, which does not represent any real ab-sorption, was generally <0.005. The Brewster angle ofthe fused silica substrate was also measured, and itstangent agreed with Malitson's index to within twodecimal places at all wavelengths. The pseudocomplexrefractive index i4 - ik, accounts for the effect of thepresence of a polish layer and roughness on the surfaceof fused silica and is, in principle, the preferred indexto use in subsequent inversion of the ellipsometricequations to obtain film properties. However, all in-dices mentioned above differ only very little numeri-cally, and all lead to essentially the same film parame-ters.
The two-zone-averaged values of 4' and A measuredat the central region of the thin and thick Sc203 and Rhfilms are given in Table V.
Besides assuming that each film is homogeneous andisotropic and has plane-parallel boundaries, the thinand thick films of the same material (Sc203 or Rh) werepresumed to have the same optical constants n and k.Film thicknesses are independently determined fromellipsometric data. The inversion method is an adap-tation of one previously described.15
15 October 1984 / Vol. 23, No. 20 / APPLIED OPTICS 3577
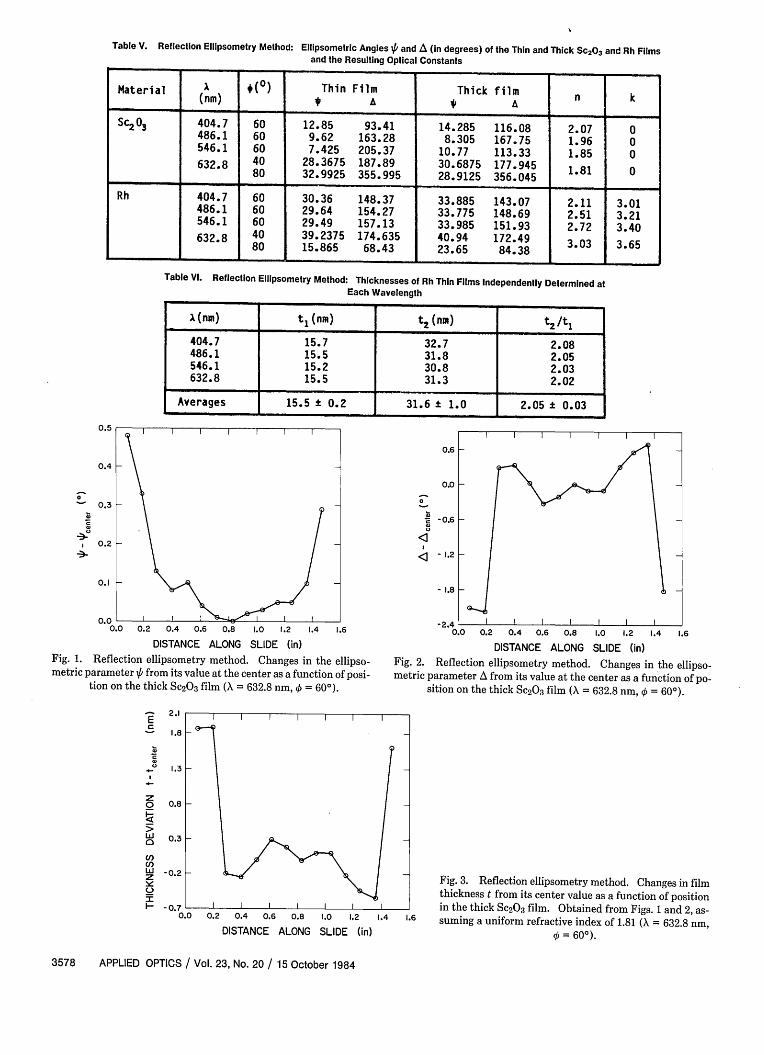
Table V. Reflection Ellipsometry Method: Ellipsometric Angles A' and A (in degrees) of the Thin and Thick Sc203 and Rh Filmsand the Resulting Optical Constants
Material A +(O) Thin Film Thick film(nm) A A n k
SC2 03 404.7 60 12.85 93.41 14.285 116.08 2.07 0486.1 60 9.62 163.28 8.305 167.75 1.96 0546.1 60 7.425 205.37 10.77 113.33 1.85 0632.8 40 28.3675 187.89 30.6875 177.945 1.81 080 32.9925 355.995 28.9125 356.045
Rh 404.7 60 30.36 148.37 33.885 143.07 2.11 3.01486.1 60 29.64 154.27 33.775 148.69 2.51 3.21546.1 60 29.49 157.13 33.985 151.93 2.72 3.40632.8 40 39.2375 174.635 40.94 172.49 3.03 3.6580 15.865 68.43 23.65 84.38
Table VI. Reflection Ellipsometry Method: Thicknesses of Rh Thin Films Independently Determined atEach Wavelength
X(nm) t1 (nm) tO(nM) 2 t
404.7 15.7 32.7 2.08486.1 15.5 31.8 2.05546.1 15.2 30.8 2.03632.8 15.5 31.3 2.02
Averages 15.5 ± 0.2 31.6 ± 1.0 2.05 ± 0.03
0.5
0.4
0.3
0.2
0.1
0. L0.0 0.2 0.4 0.6 0.8 1.0 1.2 1.4 1.6
DISTANCE ALONG SLIDE (in)Fig. 1. Reflection ellipsometry method. Changes in the ellipso-metric parameter from its value at the center as a function of posi-
tion on the thick Sc2 0 3 film ( = 632.8 nm, = 60°).
t
CJ
z0I-
C,)C')wz
1-
2.1
1.8
-0.7 L0.0 0.2 0.4 0.6 0.8 1.0 1.2 1.4
DISTANCE ALONG SLIDE (in)
0.6
-0.6 H
- 1.2 K
- 1.8 e
0.0 0.2 0.4 0.6 0.8 1.0 1.2 1.4 1.6DISTANCE ALONG SLIDE (in)
Fig. 2. Reflection ellipsometry method. Changes in the ellipso-metric parameter A from its value at the center as a function of po-
sition on the thick Sc2 0 3 film (X = 632.8 nm, = 60°).
1.6
Fig. 3. Reflection ellipsometry method. Changes in filmthickness t from its center value as a function of positionin the thick Sc203 film. Obtained from Figs. 1 and 2, as-suming a uniform refractive index of 1.81 (X = 632.8 nm,
q = 60°).
3578 APPLIED OPTICS / Vol. 23, No. 20 / 15 October 1984
I I I I 1 1
% / 9L0.0 H
I I I I I I
1.3 H
0.8 H
0.3 H
-0.2 H
I I I I I I I
t'E
_�,f
L
I I I I I I I-2.4 -
For the Sc203 films, thicknesses t = 228.2 nm andt2 = 462.6 nm were determined from the X = 632.8-nmdata (t 2 /tl = 2.03) and were kept constant at otherwavelengths.
The refractive index n of Sc2 03 obtained by averagingthe independently determined indices of the thin andthick films is also shown in Table V. In addition k wascomputed (k ranged from -0.07 to 0.001), but the re-sults are considered unacceptable.
Table VI gives the thicknesses tj and t2 of the thinand thick Rh films, independently determined at eachwavelength by inverting (',/A)1- 2 data on both films atthe same angle. The spread with wavelength of tj andt 2 of the Rh films is significantly less than that obtainedfor the Sc2 03 films. (The Sc 203 films are shown else-where in this paper to be appreciably inhomo-geneous.)
The values of n and k of the Rh films obtained (si-multaneously with tj and t2 ) by inversion of the thin-and thick-film data at the same incidence angle aregiven in Table V. The computed intensity transmit-tances of the thin and thick Rh films using the opticalconstants at X = 546.1 nm are 16 and 5%, respectively.These compare reasonably with 18 and 7% measuredtransmittances quoted by the OCLI team for X 550.0nm. However, n is significantly higher and k lower thancorresponding values determined for Rh by Coulter etal. 5 10 years ago.
To test the uniformity of one sample, measurementswere made at fourteen equispaced points along a di-ameter (missing the clear notch area) on the thick Sc20 3
film. The He-Ne laser was used at 0 = 600, and theilluminated spot size on the sample surface was '1 mm2 .Figures 1 and 2 show the changes of 4 (psi) and A (delta)as a function of position on the Sc203 film. If a constantrefractive index of 1.81 (Table V) is assumed throughoutthe film, these 4 and A profiles lead to the thickness-variation profile of Fig. 3. The film is reasonably uni-form, excluding some edge effects.
Null ellipsometry has the advantage of involving onlypurely angular measurements (no absolute or relativephotometry); hence it can be highly accurate. Fur-thermore, ellipsometry permits the simultaneous de-termination of film thickness and optical constants fromthe same data. Its sensitivity to ultrathin films (downto 1 A) is difficult to match. On the other hand, theellipsometer is sometimes looked at (unfairly) as acomplicated instrument. Certainly, data acquisitionneeds care, and subsequent inversion is not as simpleor straightforward as one wishes. We obviously couldnot determine the extinction coefficient k of the Sc20 3films using this technique. The estimated accuracy ofthe ellipsometric determination of n and k is about+0.1.
C. Wideband Spectrophotometric Method
The technique16-18 uses normal incidence measure-ments of Rf and T over a wide spectral range. We ap-plied it to determination of the optical constants of theSc203 only. Each layer is assumed to be inhomo-geneous with index varying from ni at the interface with
the substrate to n1 at the interface with air. Then n isthe mean index given by (ni + nj)/2 and An = nj - ni.For calculation, the variation of index between ni andn1 is considered to be linear, and the laver is modeledby ten homogeneous sublayers of equal thickness. Ifj is the order of the sublayer, counted from the sub-strate, the jth index is given by n = n + An[(2j -
11)/20]. In this system of notation, An/n is negativewhen the index of the layer decreases from the sub-strate. Layers that are absorbing are considered to havea constant value of k throughout the set of sublayers.
Both nj and k are functions of wavelength. Scat-tering losses are not taken into account separately, andthe value obtained for the extinction coefficient simplyassumes that all significant losses are due to absorp-tion. -
The sample consists of a rectangular substrate coatedover half of its area and slightly wedged so that beamsreflected from the rear surface are deflected outside theinstrumental aperture. It is placed in a goniometercarrying two receivers (silicon photodiodes were usedfor these measurements), one for Rf and one for T
C
Uii
0z:w_H.
c-)
2.1
2.0
1.9
1.8
1.7
1.6
1.5
1.4
300 400 500 600 700 800 900
WAVELENGTH (nm)
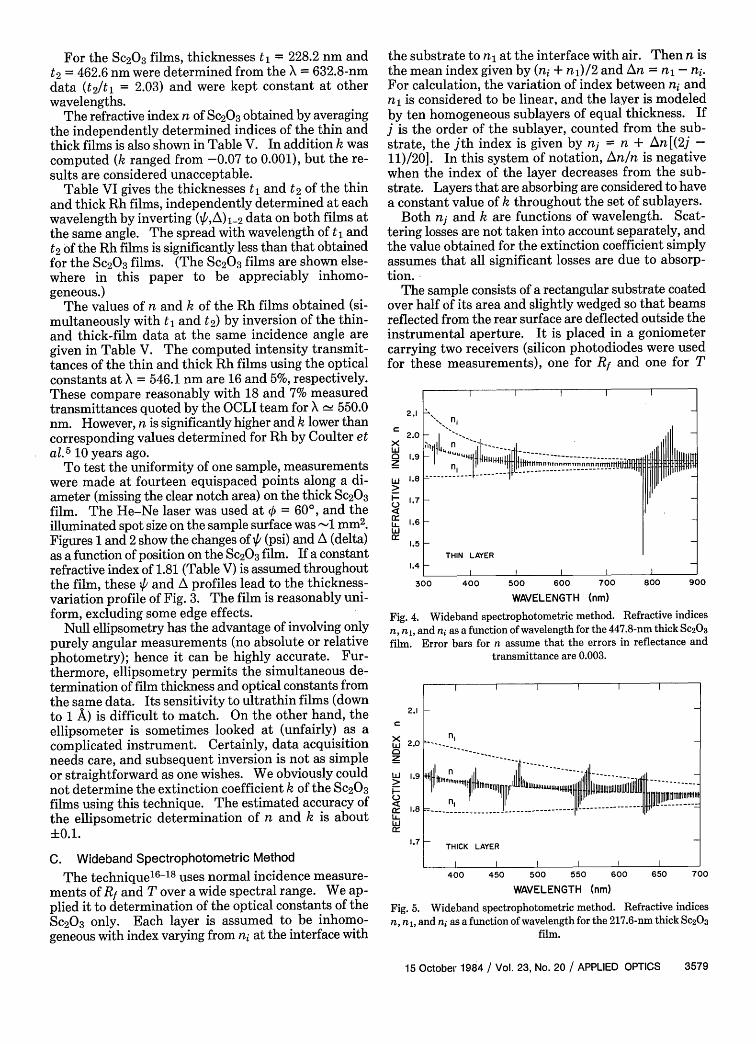
Fig. 4. Wideband spectrophotometric method. Refractive indices
n, n, and n as a function of wavelength for the 447.8-nm thick Sc2 03film. Error bars for n assume that the errors in reflectance and
transmittance are 0.003.
2.1C
0z
LiiHC-
2.0
1.9
1.8
1.7
400 450 500 550
WAVELENGTH (nm)
600 650 700
Fig. 5. Wideband spectrophotometric method. Refractive indicesn, nj, and ni as a function of wavelength for the 217.6-nm thick Sc203
film.
15 October 1984 / Vol. 23, No. 20 / APPLIED OPTICS 3579
I I I II
ni
THICK LAYER
I I I I I
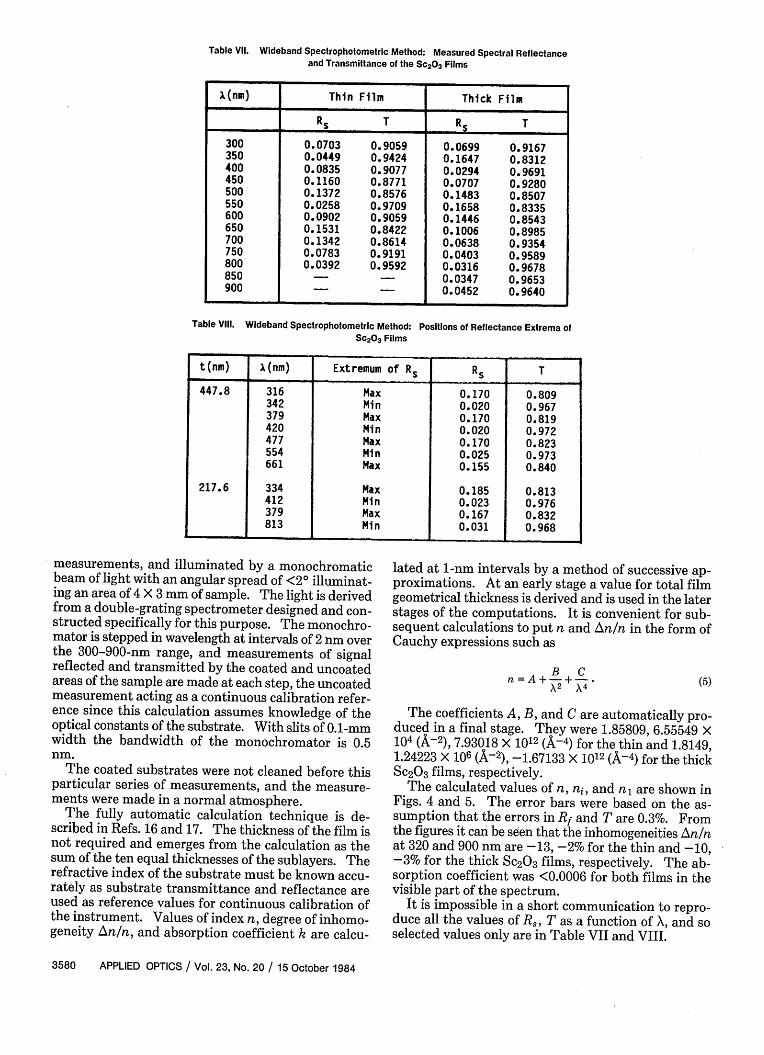
Table VIl. Wideband Spectrophotometric Method: Measured Spectral Reflectanceand Transmittance of the Sc2 03 Films
A(nm) Thin Film Thick Film
Rs T R T
300 0.0703 0.9059 0.0699 0.9167350 0.0449 0.9424 0.1647 0.8312400 0.0835 0.9077 0.0294 0.9691450 0.1160 0.8771 0.0707 0.9280500 0.1372 0.8576 0.1483 0.8507550 0.0258 0.9709 0.1658 0.8335600 0.0902 0.9059 0.1446 0.8543650 0.1531 0.8422 0.1006 0.8985700 0.1342 0.8614 0.0638 0.9354750 0.0783 0.9191 0.0403 0.9589800 0.0392 0.9592 0.0316 0.9678850 - - 0.0347 0.9653900 _ _ 0.0452 0.9640
Table Vil. Wdeband Spectrophotometric Method:Sc203 Films
measurements, and illuminated by a monochromaticbeam of light with an angular spread of <2° illuminat-ing an area of 4 X 3 mm of sample. The light is derivedfrom a double-grating spectrometer designed and con-structed specifically for this purpose. The monochro-mator is stepped in wavelength at intervals of 2 nm overthe 300-900-nm range, and measurements of signalreflected and transmitted by the coated and uncoatedareas of the sample are made at each step, the uncoatedmeasurement acting as a continuous calibration refer-ence since this calculation assumes knowledge of theoptical constants of the substrate. With slits of 0.1-mmwidth the bandwidth of the monochromator is 0.5nm.
The coated substrates were not cleaned before thisparticular series of measurements, and the measure-ments were made in a normal atmosphere.
The fully automatic calculation technique is de-scribed in Refs. 16 and 17. The thickness of the film isnot required and emerges from the calculation as thesum of the ten equal thicknesses of the sublayers. Therefractive index of the substrate must be known accu-rately as substrate transmittance and reflectance areused as reference values for continuous calibration ofthe instrument. Values of index n, degree of inhomo-geneity An/n, and absorption coefficient k are calcu-
Positions of Reflectance Extrema of
lated at 1-nm intervals by a method of successive ap-proximations. At an early stage a value for total filmgeometrical thickness is derived and is used in the laterstages of the computations. It is convenient for sub-sequent calculations to put n and An/n in the form ofCauchy expressions such as
n =A+2+ C . (5)
The coefficients A, B, and C are automatically pro-duced in a final stage. They were 1.85809, 6.55549 X10⁴ (A-2), 7.93018 X 10¹² (A-4) for the thin and 1.8149,1.24223 X 106 (A-2), -1.67133 X 10¹² (A-4) for the thickSc203 films, respectively.
The calculated values of n, n, and n are shown inFigs. 4 and 5. The error bars were based on the as-sumption that the errors in R and T are 0.3%. Fromthe figures it can be seen that the inhomogeneities An/nat 320 and 900 nm are -13, -2% for the thin and -10,-3% for the thick Sc203 films, respectively. The ab-sorption coefficient was <0.0006 for both films in thevisible part of the spectrum.
It is impossible in a short communication to repro-duce all the values of R, T as a function of X, and soselected values only are in Table VII and VIII.
3580 APPLIED OPTICS / Vol. 23, No. 20 1 15 October 1984
t(nm) A(nm) Extremum of Rs Rs T
447.8 316 Max 0.170 0.809342 Min 0.020 0.967379 Max 0.170 0.819420 Min 0.020 0.972477 Max 0.170 0.823554 Min 0.025 0.973661 Max 0.155 0.840
217.6 334 Max 0.185 0.813412 Min 0.023 0.976379 Max 0.167 0.832813 Min 0.031 0.968
D. Modified Valeev Turning Point Method and the
Nestell and Christy Method
Our methods for determining the optical constantsand thickness of a thin metal or dielectric film werebased on analysis of spectral scans of transmittance andreflectance of the sample. These scans were made ona Cary 17-DX spectrophotometer interfaced to anHP9825T desktop computer for data collection. Thisspectrophotometer is a dual-beam instrument coveringthe visible, near UV, and near IR. For this study, wemade scans over the 200-900-nm wavelength rangeusing a Hamamatsu R955 photomultiplier tube. Thedeuterium light source was used for wavelengths shorterthan 400 nm, and the tungsten-halogen lamp was usedfor wavelengths longer than 400 nm. The entire in-strument was purged with dry nitrogen, and parts wereallowed to equilibrate for at least an hour in the samplecompartment prior to taking the spectra.
Transmittance measurements were made by firstscanning the transmittance Tw of an uncoated fusedsilica substrate and then scanning the transmittance Tof the coated part to be measured. The transmittanceTobs was then calculated as follows:
Tob. = T/Tw. (6)
By using the ratio of these two measurements, the ef-fects of substrate absorption were minimized. Thereflection losses for the uncoated substrate and for thecoated part were calculated using the dispersion curvefor fused silica given in Sec. II. These were taken intoaccount in the analysis.
The reflectance of the dielectric coatings was mea-sured using a specially designed single bounce reflec-tance attachment. The spectrophotometer light beamwas incident on the sample at an angle of 100, althoughthis deviation from normal incidence was ignored. Onlythe reflectance from the first surface of the sample wasmeasured. The reflectance of the second surface waseliminated by using an index matching fluid to attacha piece of fused silica to the back of the sample beingmeasured. The second surface of this piece of fusedsilica was frosted to diffuse the reflected light. Thereflectance Rf was determined using
Rf = RobsRsc/Rs (7)
where Robs is the measured reflectance of the coatedpart, RS is the measured reflectance of a fused silicawitness, and R8,c is the calculated Fresnel reflectanceof fused silica.
The reflectance of the metal coatings was measuredusing the Strong (V-W) reflectance attachment' 9 pro-vided with the Cary. This device measures Rf' since thelight beam reflects twice from the surface of the part.The angle of incidence was 8°, which was assumed to beequivalent to normal incidence. Because the reflec-tance of the metal coatings was relatively high and thetransmittance was low, the effects of the second surfacewere expected to be small and were ignored.
Each measurement consisted of the appropriatebackground scan (e.g., with the uncoated part in thebeam) followed by the scan of the coated part. This
procedure was repeated a number of times for each scan,and the final values represent the average of two or threemeasurements. In this way, the effects of randomfluctuations and drift of the spectrophotometer wereminimized.
The dielectric coatings were cleaned with methyl al-cohol and a soft towel prior to measurement. The metalcoatings were not cleaned. However, care was taken toprotect the central portion of the metal coatings wherethe Rf and T measurements were made.
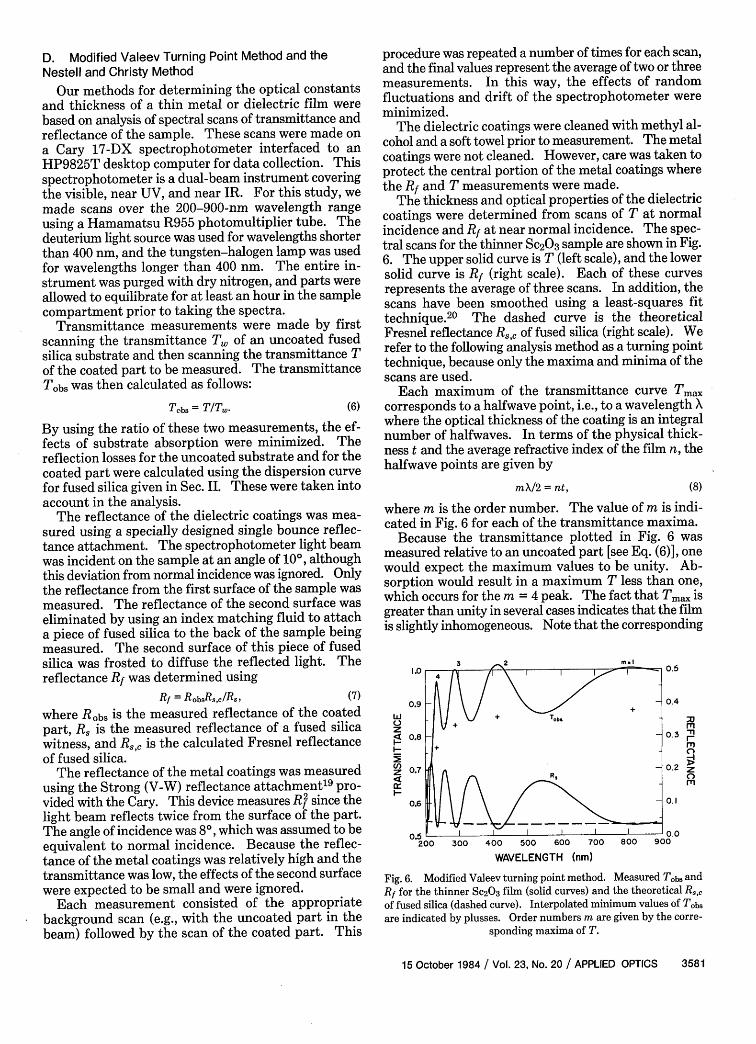
The thickness and optical properties of the dielectriccoatings were determined from scans of T at normalincidence and Rf at near normal incidence. The spec-tral scans for the thinner Sc203 sample are shown in Fig.6. The upper solid curve is T (left scale), and the lowersolid curve is Rf (right scale). Each of these curvesrepresents the average of three scans. In addition, thescans have been smoothed using a least-squares fittechnique.2 0 The dashed curve is the theoreticalFresnel reflectance R8,, of fused silica (right scale). Werefer to the following analysis method as a turning pointtechnique, because only the maxima and minima of thescans are used.
Each maximum of the transmittance curve Tmax
corresponds to a halfwave point, i.e., to a wavelength Xwhere the optical thickness of the coating is an integralnumber of halfwaves. In terms of the physical thick-ness t and the average refractive index of the film n, thehalfwave points are given by
mX/2 = nt, (8)
where m is the order number. The value of m is indi-cated in Fig. 6 for each of the transmittance maxima.
Because the transmittance plotted in Fig. 6 wasmeasured relative to an uncoated part [see Eq. (6)], onewould expect the maximum values to be unity. Ab-sorption would result in a maximum T less than one,which occurs for the m = 4 peak. The fact that Tma_, isgreater than unity in several cases indicates that the filmis slightly inhomogeneous. Note that the corresponding
1.0
0.9
z< 0.8
C,)z 0.7r
0.6
0.5 -200
m.I
300 400 500 600 700
WAVELENGTH (nm)
0.5
0.4
m0.3 r
0.2 z
0.I
L 0.0800 900
Fig. 6. Modified Valeev turning point method. Measured TobW andRf for the thinner Sc203 film (solid curves) and the theoretical R8,,of fused silica (dashed curve). Interpolated minimum values of Tobs
are indicated by plusses. Order numbers m are given by the corre-sponding maxima of T.
15 October 1984 / Vol. 23, No. 20 / APPLIED OPTICS 3581
minimum values of Rf are less than the reflectance Rs,cof the uncoated substrate.
The n and k determination was made using themethod of Valeev.2"22 This technique uses the trans-mittance values at the turning points and gives the op-tical properties only at the halfwave points. Valeev'smethod was extended to account for the inhomogeneity.The steps in the analysis were as follows:
(1) The transmittance values at the minima wereinterpolated to the wavelengths of the maxima. Theresulting transmittance values Tint are denoted bypluses in Fig. 6.
(2) The average index n and an approximate valueof k were determined at the halfwave points from Tm8,Tint, , and m using the method of Valeev.2122
(3) A more accurate value of k was determinedusing
k = nA/2irm, (9)
where the absorption A is given by
A = 1 Rmin Tf. (10)
Here Rmin is the reflectance [see Eq. (7)] measured atthe minimum corresponding to the mth-order maxi-mum of T, and Tf is the maximum transmittance of thecoating only-compensating for the effects of the sec-ond surface of the substrate. This is given approxi-mately by
T _ Tax(1 - RcRmin)/(l + R,c). (11)
(4) The degree of inhomogeneity was determinedfrom the reflectance minima using
An n(R8a, - Rin)/(4.4Rc). (12)
This is an approximate expression which was arrivedat empirically by modeling an inhomogeneous layer byseveral thin homogeneous ones and making calculationsof reflectance for several cases using standard thin-filmtechniques. In terms of An, the index of the film at thesubstrate interface is given by
ni = n + An/2
and at the air interface by
nli = n - An/2.
(13a)
(5) The mechanical or physical thickness t of the filmwas calculated at each halfwave point using Eq. (8).
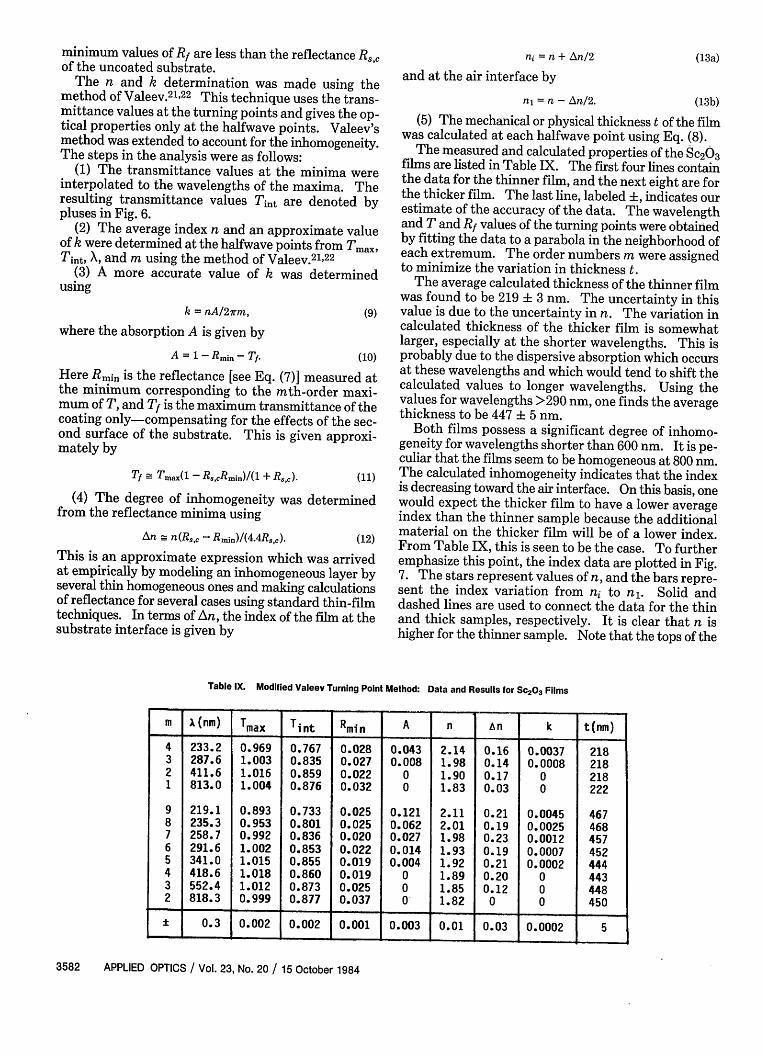
The measured and calculated properties of the Sc203films are listed in Table IX. The first four lines containthe data for the thinner film, and the next eight are forthe thicker film. The last line, labeled ±, indicates ourestimate of the accuracy of the data. The wavelengthand T and Rf values of the turning points were obtainedby fitting the data to a parabola in the neighborhood ofeach extremum. The order numbers m were assignedto minimize the variation in thickness t.
The average calculated thickness of the thinner filmwas found to be 219 3 nm. The uncertainty in thisvalue is due to the uncertainty in n. The variation incalculated thickness of the thicker film is somewhatlarger, especially at the shorter wavelengths. This isprobably due to the dispersive absorption which occursat these wavelengths and which would tend to shift thecalculated values to longer wavelengths. Using thevalues for wavelengths >290 nm, one finds the averagethickness to be 447 5 nm.
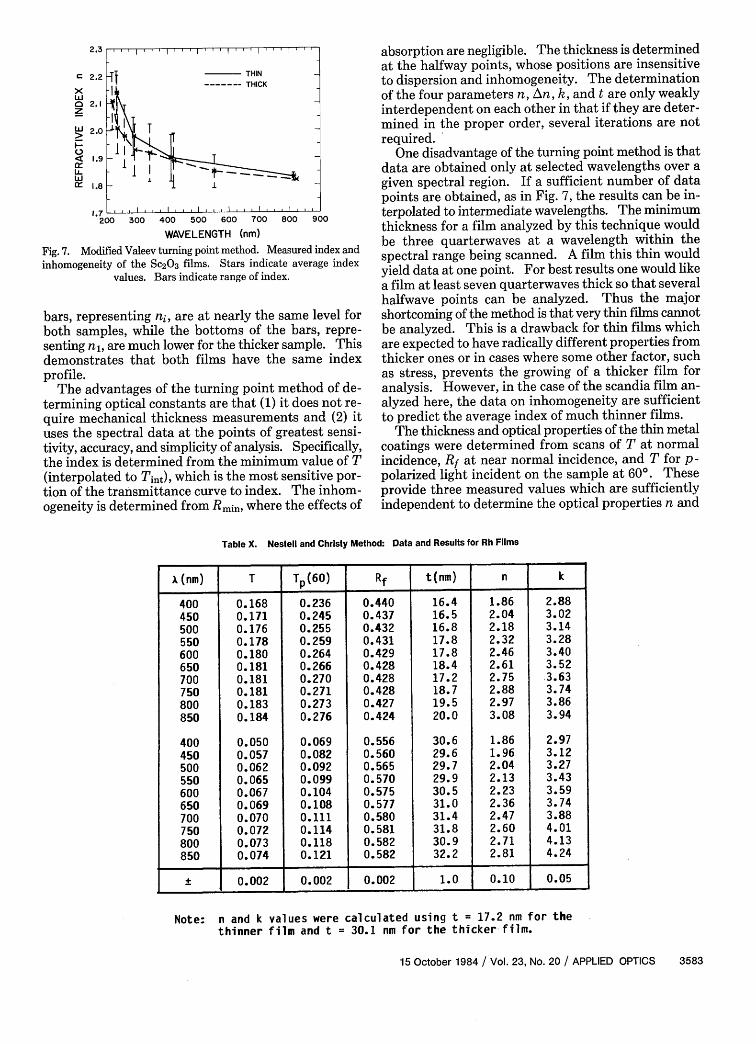
Both films possess a significant degree of inhomo-geneity for wavelengths shorter than 600 nm. It is pe-culiar that the films seem to be homogeneous at 800 nm.The calculated inhomogeneity indicates that the indexis decreasing toward the air interface. On this basis, onewould expect the thicker film to have a lower averageindex than the thinner sample because the additionalmaterial on the thicker film will be of a lower index.From Table IX, this is seen to be the case. To furtheremphasize this point, the index data are plotted in Fig.7. The stars represent values of n, and the bars repre-sent the index variation from n to n. Solid anddashed lines are used to connect the data for the thinand thick samples, respectively. It is clear that n ishigher for the thinner sample. Note that the tops of the
Table IX. Modified Valeev Turning Point Method: Data and Results for SC203 Films
m X(nm) Tmax Tint Rmin A n an k t(nm)
4 233.2 0.969 0.767 0.028 0.043 2.14 0.16 0.0037 2183 287.6 1.003 0.835 0.027 0.008 1.98 0.14 0.0008 2182 411.6 1.016 0.859 0.022 0 1.90 0.17 0 2181 813.0 1.004 0.876 0.032 0 1.83 0.03 0 222
9 219.1 0.893 0.733 0.025 0.121 2.11 0.21 0.0045 4678 235.3 0.953 0.801 0.025 0.062 2.01 0.19 0.0025 4687 258.7 0.992 0.836 0.020 0.027 1.98 0.23 0.0012 4576 291.6 1.002 0.853 0.022 0.014 1.93 0.19 0.0007 4525 341.0 1.015 0.855 0.019 0.004 1.92 0.21 0.0002 4444 418.6 1.018 0.860 0.019 0 1.89 0.20 0 4433 552.4 1.012 0.873 0.025 0 1.85 0.12 0 4482 818.3 0.999 0.877 0.037 0 1.82 0 0 450
± 0.3 0.002 0.002 0.001 0.003 0.01 0.03 0.0002 5
3582 APPLIED OPTICS / Vol. 23, No. 20 / 15 October 1984
(13b)
2.3
200 300 400 500 600 700 800 900
WAVELENGTH (nm)
Fig. 7. Modified Valeev turning point method. Measured index and
inhomogeneity of the Sc2O3 films. Stars indicate average indexvalues. Bars indicate range of index.
bars, representing ni, are at nearly the same level forboth samples, while the bottoms of the bars, repre-senting n1, are much lower for the thicker sample. Thisdemonstrates that both films have the same indexprofile.
The advantages of the turning point method of de-termining optical constants are that (1) it does not re-quire mechanical thickness measurements and (2) ituses the spectral data at the points of greatest sensi-tivity, accuracy, and simplicity of analysis. Specifically,the index is determined from the minimum value of T(interpolated to Tint), which is the most sensitive por-tion of the transmittance curve to index. The inhom-ogeneity is determined from Rmin, where the effects of
absorption are negligible. The thickness is determinedat the halfway points, whose positions are insensitiveto dispersion and inhomogeneity. The determinationof the four parameters n, An, k, and t are only weaklyinterdependent on each other in that if they are deter-mined in the proper order, several iterations are notrequired.
One disadvantage of the turning point method is thatdata are obtained only at selected wavelengths over agiven spectral region. If a sufficient number of datapoints are obtained, as in Fig. 7, the results can be in-terpolated to intermediate wavelengths. The minimumthickness for a film analyzed by this technique wouldbe three quarterwaves at a wavelength within thespectral range being scanned. A film this thin wouldyield data at one point. For best results one would likea film at least seven quarterwaves thick so that severalhalfwave points can be analyzed. Thus the majorshortcoming of the method is that very thin films cannotbe analyzed. This is a drawback for thin films whichare expected to have radically different properties fromthicker ones or in cases where some other factor, suchas stress, prevents the growing of a thicker film foranalysis. However, in the case of the scandia film an-alyzed here, the data on inhomogeneity are sufficientto predict the average index of much thinner films.
The thickness and optical properties of the thin metalcoatings were determined from scans of T at normalincidence, Rf at near normal incidence, and T for p-polarized light incident on the sample at 60°. Theseprovide three measured values which are sufficientlyindependent to determine the optical properties n and
Table X. Nestell and Christy Method: Data and Results for Rh Films
X(nm) T Tp(60) Rf t(nm) n k
400 0.168 0.236 0.440 16.4 1.86 2.88450 0.171 0.245 0.437 16.5 2.04 3.02500 0.176 0.255 0.432 16.8 2.18 3.14550 0.178 0.259 0.431 17.8 2.32 3.28600 0.180 0.264 0.429 17.8 2.46 3.40650 0.181 0.266 0.428 18.4 2.61 3.52700 0.181 0.270 0.428 17.2 2.75 3.63750 0.181 0.271 0.428 18.7 2.88 3.74800 0.183 0.273 0.427 19.5 2.97 3.86850 0.184 0.276 0.424 20.0 3.08 3.94
400 0.050 0.069 0.556 30.6 1.86 2.97450 0.057 0.082 0.560 29.6 1.96 3.12500 0.062 0.092 0.565 29.7 2.04 3.27550 0.065 0.099 0.570 29.9 2.13 3.43600 0.067 0.104 0.575 30.5 2.23 3.59650 0.069 0.108 0.577 31.0 2.36 3.74700 0.070 0.111 0.580 31.4 2.47 3.88750 0.072 0.114 0.581 31.8 2.60 4.01800 0.073 0.118 0.582 30.9 2.71 4.13850 0.074 0.121 0.582 32.2 2.81 4.24
± 0.002 0.002 0.002 1.0 0.10 0.05
15 October 1984 / Vol. 23, No. 20 / APPLIED OPTICS 3583
Note: n and k values were calculated using t = 17.2 nm for thethinner film and t = 30.1 n for the thicker-film.
k and the t of the film. Since the equations for Rf, T,and Tp (60) cannot be solved explicitly for n, k, and t,it is necessary to use an iterative approach to solve forvalues of n, k, and t consistent with the measured valuesof Rf, T and Tp(60). We have used the method ofNestell and Christy.23
Spectral data were obtained over the 400-900-nmrange at 5-nm intervals. Wavelengths shorter than 400nm could not be used because the Glan-Thompsonpolarizing prism used to make the Tp(60) scans wasopaque at shorter wavelengths. The data represent theaverage of two scans. Data at 50-nm intervals for T,Tp (60), and Rf are listed in Table X. The upper set ofdata refers to the thinner film, and the lower set refersto the thicker film. The row of values at the bottomlabeled ± contains our estimate of the accuracy of thedata.
The method of Nestell and Christy involves threesteps:
(1) Solve for n, k, and t consistent with T, Tp(60),and Rf at each wavelength. Because the calculationsat each wavelength are independent of each other, thecalculated value of t may not be (in fact, is usually not)the same at all wavelengths. This is probably due toinhomogeneities in the film expected to be present invery thin metal films. Table X lists the values of t innanometers calculated from the spectral data. Theytend to increase at longer wavelengths. This behaviormay be due to a slight oxidation of the outer surface ofthe film24 or from effects of nucleation.
(2) A best average value of the thickness of the filmis determined from the values obtained in the short-wavelength region of the visible spectrum. Over thisspectral range, the uncertainty in the value of t is thesmallest, and the variation due to oxidation effects isalso minimal. Values of 17.2 + 1.2 and 30.1 ± 1.2 nmwere obtained for the thicknesses of the thin and thickerfilms, respectively. These values were found by aver-aging t over the 400-650-nm range. The uncertaintyin thickness of the thinner film is due to the variationin calculated values of t, while the uncertainty in thevalue for the thicker film results from our estimate ofthe accuracy of the spectral measurements. Note thatthe thicker film is slightly less than twice as thick as thethinner film.
(3) Using the thickness calculated in step (2), all thedata were reanalyzed using only the scan of T and R togive self-consistent values of n and k. [Thus note thatthe value of T (60) was used only in determination ofthe thickness.f The resulting values calculated for nand k for the two films are listed in the last two columnsof Table X.
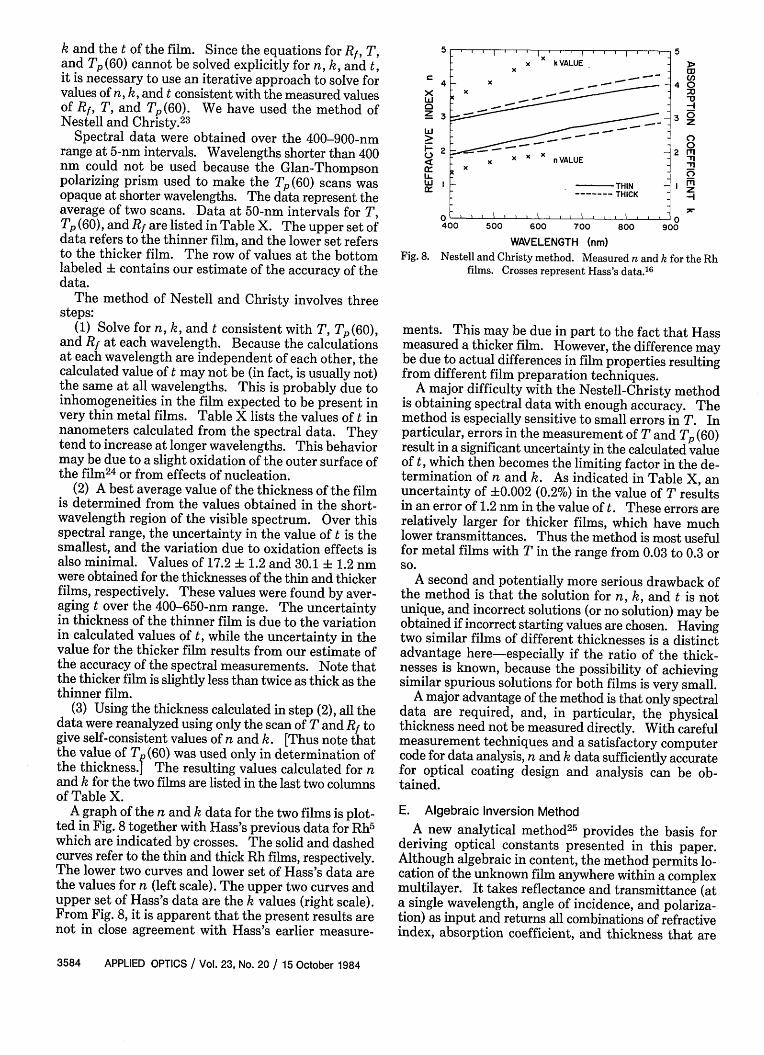
A graph of the n and k data for the two films is plot-ted in Fig. 8 together with Hass's previous data for Rh5
which are indicated by crosses. The solid and dashedcurves refer to the thin and thick Rh films, respectively.The lower two curves and lower set of Hass's data arethe values for n (left scale). The upper two curves andupper set of Hass's data are the k values (right scale).From Fig. 8, it is apparent that the present results arenot in close agreement with Hass's earlier measure-
5
4wx
0z
i.
Fig. 8.
2
5
coC',4 0
--I3 0z
002 1n
I ZZ--
v~~~~~~~~~ . .400 500 600 700 800 900WAVELENGTH (nm)
Nestell and Christy method. Measured n and k for the Rhfilms. Crosses represent Hass's data.16
ments. This may be due in part to the fact that Hassmeasured a thicker film. However, the difference maybe due to actual differences in film properties resultingfrom different film preparation techniques.
A major difficulty with the Nestell-Christy methodis obtaining spectral data with enough accuracy. Themethod is especially sensitive to small errors in T. Inparticular, errors in the measurement of T and Tp (60)result in a significant uncertainty in the calculated valueof t, which then becomes the limiting factor in the de-termination of n and k. As indicated in Table X, anuncertainty of ±0.002 (0.2%) in the value of T resultsin an error of 1.2 nm in the value of t. These errors arerelatively larger for thicker films, which have muchlower transmittances. Thus the method is most usefulfor metal films with T in the range from 0.03 to 0.3 orso.
A second and potentially more serious drawback ofthe method is that the solution for n, k, and t is notunique, and incorrect solutions (or no solution) may beobtained if incorrect starting values are chosen. Havingtwo similar films of different thicknesses is a distinctadvantage here-especially if the ratio of the thick-nesses is known, because the possibility of achievingsimilar spurious solutions for both films is very small.
A major advantage of the method is that only spectraldata are required, and, in particular, the physicalthickness need not be measured directly. With carefulmeasurement techniques and a satisfactory computercode for data analysis, n and k data sufficiently accuratefor optical coating design and analysis can be ob-tained.
E. Algebraic Inversion MethodA new analytical method25 provides the basis for
deriving optical constants presented in this paper.Although algebraic in content, the method permits lo-cation of the unknown film anywhere within a complexmultilayer. It takes reflectance and transmittance (ata single wavelength, angle of incidence, and polariza-tion) as input and returns all combinations of refractiveindex, absorption coefficient, and thickness that are
3584 APPLIED OPTICS / Vol. 23, No. 20 / 15 October 1984
Ix ' I . . I I- ~~~x k VALUE
XX X __ VLU
THIN --- THICK
. . . . . . . . . . . . . . . ....- 5
I " I
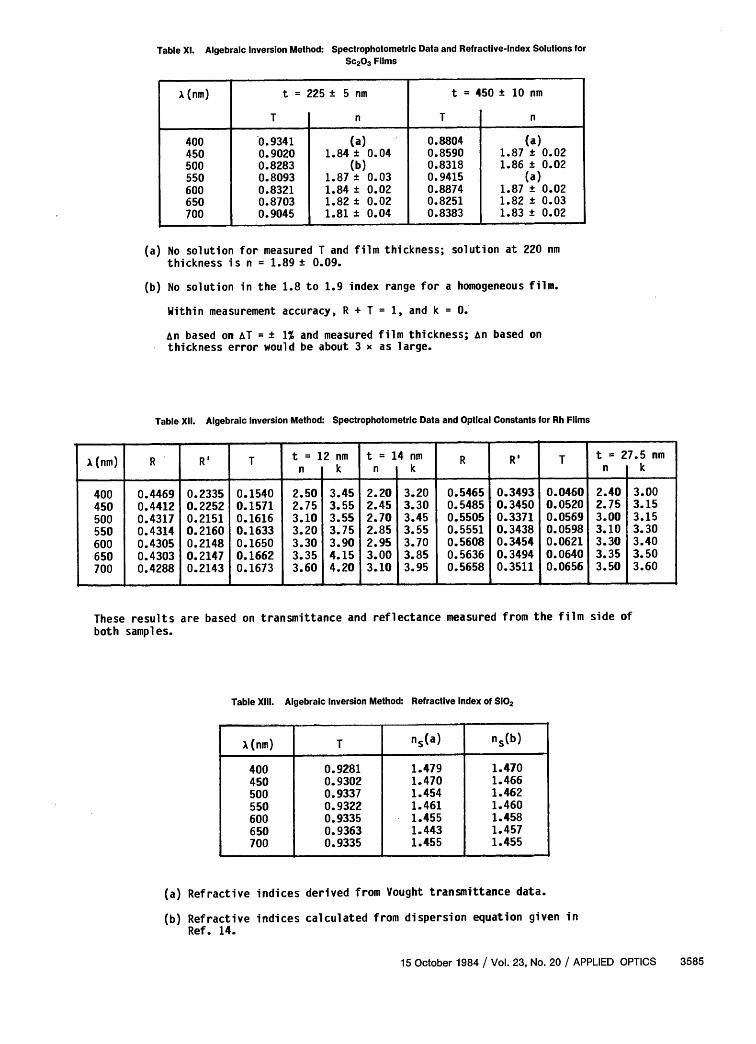
Table Xl. Algebraic Inversion Method: Spectrophotometric Data and Refractive-Index Solutions forSc2 03 Films
A(nm) t = 225 ± 5 n t = 450 ± 10 nm
T n T n
400 0.9341 (a) 0.8804 (a)450 0.9020 1.84 ± 0.04 0.8590 1.87 ± 0.02500 0.8283 (b) 0.8318 1.86 ± 0.02550 0.8093 1.87 ± 0.03 0.9415 (a)600 0.8321 1.84 ± 0.02 0.8874 1.87 ± 0.02650 0.8703 1.82 ± 0.02 0.8251 1.82 ± 0.03700 0.9045 1.81 ± 0.04 0.8383 1.83 ± 0.02
(a) No solution for measured T and film thickness; solution at 220 nmthickness is n = 1.89 ± 0.09.
(b) No solution in the 1.8 to 1.9 index range for a homogeneous film.
Within measurement accuracy, R + T = 1, and k = 0.
An based on AT = ± 1% and measured film thickness; an based onthickness error would be about 3 x as large.
Table Xli. Algebraic Inversion Method: Spectrophotometric Data and Optical Constants for Rh Films
These resultsboth samples.
are based on transmittance and reflectance measured from the film side of
Table XIII. Algebraic Inversion Method: Refractive Index of S102
(a) Refractive indices derived from Vought transmittance data.
(b) Refractive indices calculated from dispersion equation given inRef. 14.
15 October 1984 / Vol. 23, No. 20 / APPLIED OPTICS 3585
1(nm) R ' T t = 12 nm t = 14 nm R T t = 27.5 nmn k n k n k
400 0.4469 0.2335 0.1540 2.50 3.45 2.20 3.20 0.5465 0.3493 0.0460 2.40 3.00450 0.4412 0.2252 0.1571 2.75 3.55 2.45 3.30 0.5485 0.3450 0.0520 2.75 3.15500 0.4317 0.2151 0.1616 3.10 3.55 2.70 3.45 0.5505 0.3371 0.0569 3.00 3.15550 0.4314 0.2160 0.1633 3.20 3.75 2.85 3.55 0.5551 0.3438 0.0598 3.10 3.30600 0.4305 0.2148 0.1650 3.30 3.90 2.95 3.70 0.5608 0.3454 0.0621 3.30 3.40650 0.4303 0.2147 0.1662 3.35 4.15 3.00 3.85 0.5636 0.3494 0.0640 3.35 3.50700 0.4288 0.2143 0.1673 3.60 4.20 3.10 3.95 0.5658 0.3511 0.0656 3.50 3.60
X(nm) T n,(a) ns(b)
400 0.9281 1.479 1.470450 0.9302 1.470 1.466500 0.9337 1.454 1.462550 0.9322 1.461 1.460600 0.9335 1.455 1.458650 0.9363 1.443 1.457700 0.9335 1.455 1.455
consistent with the input data. In the present case,independent measurements of film thicknesses wereused to narrow the range of solutions.
Transmission and reflectance were measured with aPerkin-Elmer model 330 spectrophotometer and thedata recorded on a Perkin-Elmer model 3600 data sta-tion. In our laboratory, the double-beam mode is em-ployed routinely, ambient air from a clean room envi-ronment (50% relative humidity) filling the instrument.For reflectance, two plane mirrors are inserted, the firstdeflecting the incident beam onto the sample at an angleof 10° from normal and the second turning the re-flected beam back down the instrument optical axis.Transmittance data are normalized to the transmissionof an empty sample holder; reflectance data are nor-malized with respect to aged vacuum-deposited alu-minum on glass (NBS Standard Reference Material2003a). We estimate the accuracy of the transmittanceand reflectance measurements at ±1.0%.
The samples were cleaned prior to measurement bypulling a tissue wetted with a few drops of ethanol acrossthe horizontal sample surfaces until no liquid remained.This technique scratched the thick Rh film surfacenoticeably, so the thin Rh film was measured withoutcleaning.
Spectrophotometric data are presented at selectedvisible wavelengths for all film samples in Tables XI andXII. Reflectance was measured twice, once with theinstrument beam incident onto the film surface R andagain with the beam incident onto the back surface ofthe substrate R'.
Thicknesses were measured for the Sc20 3 samplesusing a stylus profilometer (Tencor Alpha-Step profi-lometer) with a precision of ±10 nm, established byscanning a standard supplied by the manufacturer.The step on each sample was scanned in several loca-tions, and these values differed at most by ±5 nm.Overall, we estimate the thicknesses of the Sc20 3 filmsto be 225 5 and 450 10 m. For the Rh films, thick-nesses were determined by the Tolansky2 6 method usinga Sloan model M-100 angstrometer. Several fringepatterns for each sample were photographed and measured.These thickness results are 12 ± 2 and 27.5 ± 4.5 nm.
We call attention to a few simplifying assumptionsin connection with the data analysis. A polarizer wasnot available for the photometric measurements, sonormal incidence of light was assumed in all computa-tions. We did not find that this approximation intro-duced errors comparable with the instrumental preci-sion of the spectrophotometer. Also the sum of re-flectance and transmittance measured for each Sc20 3film was within these same instrumental limits.Therefore we assumed the Sc203 material to be non-absorbing with negligible surface scattering. Finally,for both materials, we used as a model for computingoptical constants a homogeneous film with planar par-allel surfaces.
The refractive index of the bare substrate material(fused silica) was derived from transmission measure-ments at a number of wavelength points in the visiblespectrum. These values are in excellent agreement with
w
V)zEx
0.98
0.94
0.90
0.86
0.821
41
W
U,z4r
0.98
0.94
0.90
0.86
0.82
600 500 600 70WAVELENGTH nm)
'0
400 500 600 700WAVELENGTH (nm)
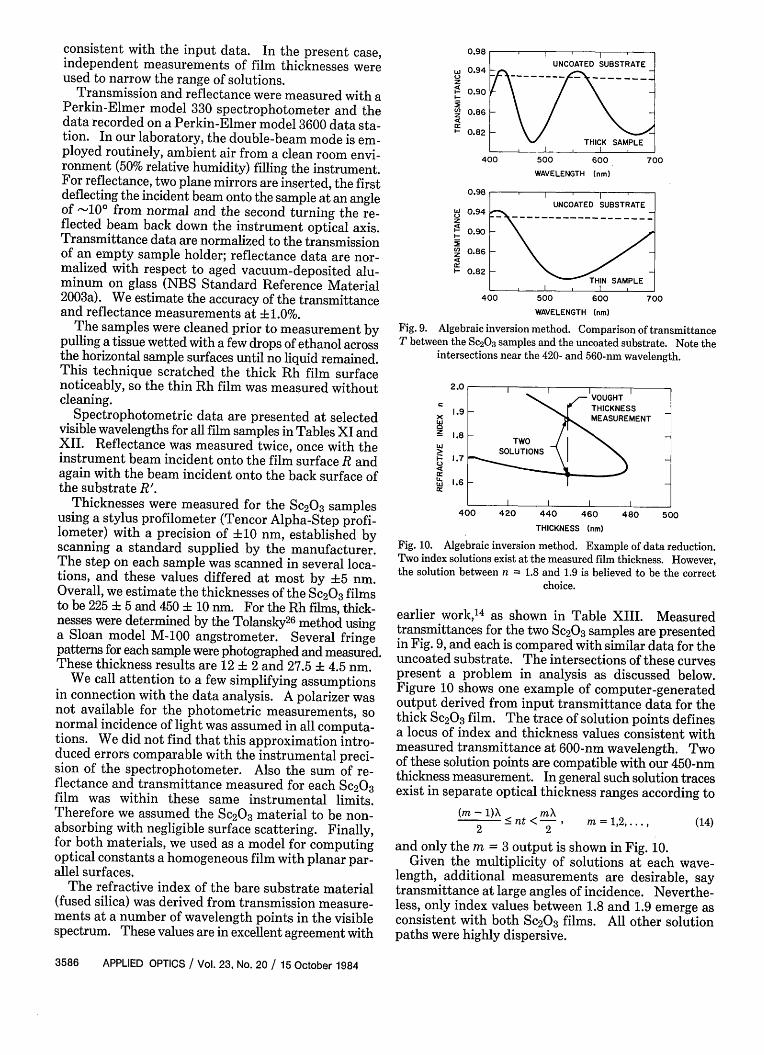
Fig. 9. Algebraic inversion method. Comparison of transmittanceT between the Sc20 3 samples and the uncoated substrate. Note the
intersections near the 420- and 560-nm wavelength.
2.0
C
z
It!3w
C.4:
L-w
1.9
1.8 F
1.7
1.6
400 420 440 460 480 500THICKNESS (nm)
Fig. 10. Algebraic inversion method. Example of data reduction.Two index solutions exist at the measured film thickness. However,the solution between n = 1.8 and 1.9 is believed to be the correct
choice.
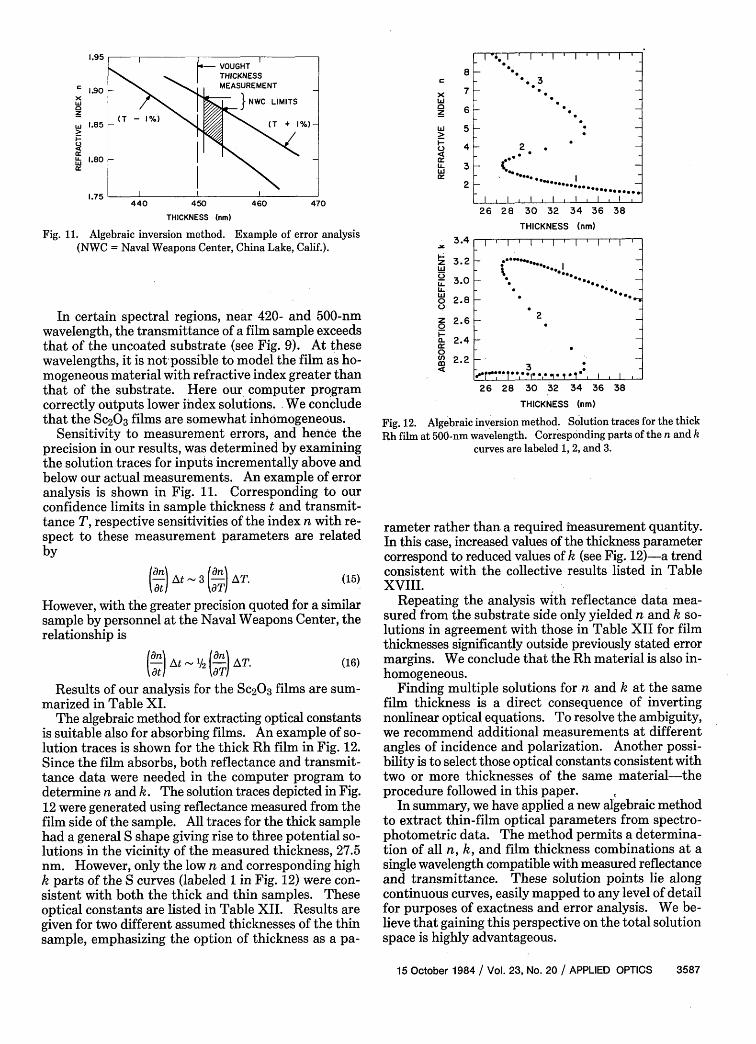
earlier work,'14 as shown in Table XIII. Measuredtransmittances for the two Sc20 3 samples are presentedin Fig. 9, and each is compared with similar data for theuncoated substrate. The intersections of these curvespresent a problem in analysis as discussed below.Figure 10 shows one example of computer-generatedoutput derived from input transmittance data for thethick Sc20 3 film. The trace of solution points definesa locus of index and thickness values consistent withmeasured transmittance at 600-nm wavelength. Twoof these solution points are compatible with our 450-nmthickness measurement. In general such solution tracesexist in separate optical thickness ranges according to
(m-1)X mX< nt< 2 I m = 1,2,....2 2 (14)
and only the m = 3 output is shown in Fig. 10.Given the multiplicity of solutions at each wave-
length, additional measurements are desirable, saytransmittance at large angles of incidence. Neverthe-less, only index values between 1.8 and 1.9 emerge asconsistent with both Sc203 films. All other solutionpaths were highly dispersive.
3586 APPLIED OPTICS / Vol. 23, No. 20 / 15 October 1984
l IUNCOATED SUBSTRATE
THICK SAMPLE
I l -lUNCOATED SUBSTRATE
I THIN SAMPLE
I I I IVOUGHTTHICKNESSMEASUREMENT
TWO
SOLUTIONS
I I I I _ _L
1.95
' 1.90xwaz
W 1.85
4
u- 1.80w
1.75
x
0z
I-
CrU-wr
440 450 460 470THICKNESS (nm)
Fig. 11. Algebraic inversion method. Example of error analysis(NWC = Naval Weapons Center, China Lake, Calif.).
In certain spectral regions, near 420- and 500-nmwavelength, the transmittance of a film sample exceedsthat of the uncoated substrate (see Fig. 9). At thesewavelengths, it is not' possible to model the film as ho-mogeneous material with refractive index greater, thanthat of the substrate. Here our, computer programcorrectly outputs lower index solutions. We concludethat the Sc203 films are somewhat inhomogeneous.
Sensitivity to measurement errors, and hence theprecision in our results, was determined by examiningthe solution traces for inputs incrementally above andbelow our actual measurements. An example of erroranalysis is shown in Fig. 11. Corresponding to ourconfidence limits in sample thickness t and transmit-tance T, respective sensitivities of the index n with re-spect to these measurement parameters are relatedby
(d- I-t 3 (dn AT. (15)
However, with the greater precision quoted for a similarsample by personnel at the Naval Weapons Center, therelationship is
(dn At' (-an AT. (16)
Results of our analysis for the Sc203 films are sum-marized in Table XI.
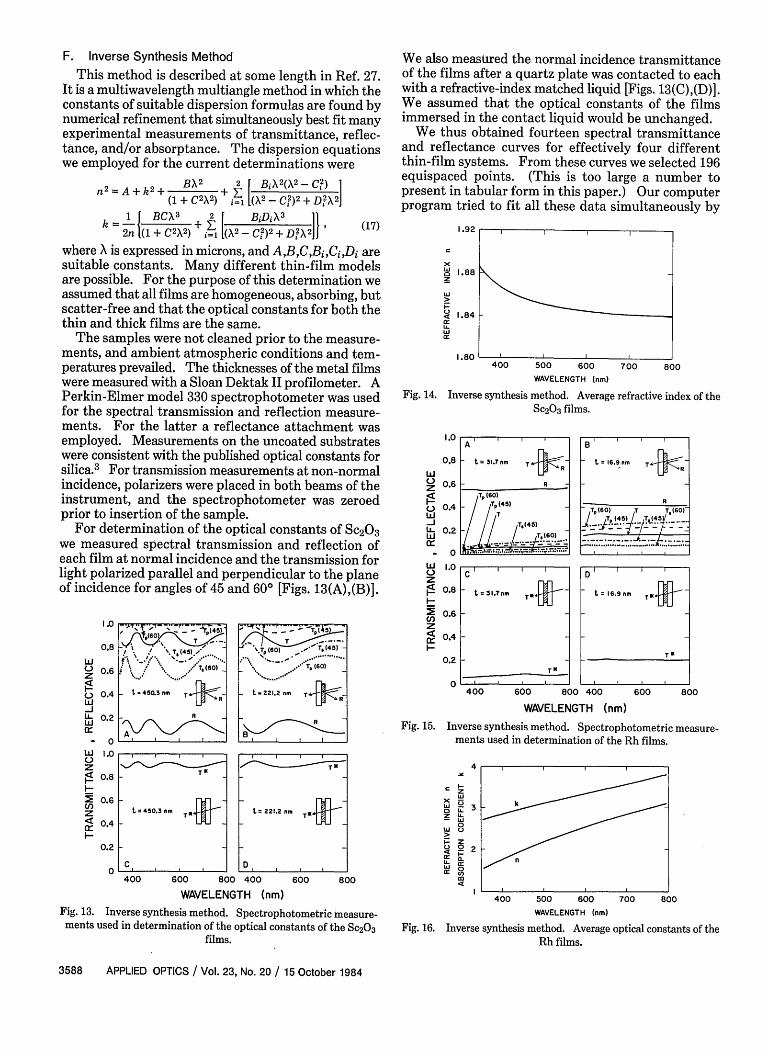
The algebraic method for extracting optical constantsis suitable also for absorbing films. An example of so-lution traces is shown for the thick Rh film in Fig. 12.Since the film absorbs, both reflectance and transmit-tance data were needed in the computer program todetermine n and k. The solution traces depicted in Fig.12 were generated using reflectance measured from thefilm side of the sample. All traces for the thick samplehad a general S shape giving rise to three potential so-lutions in the vicinity of the measured thickness, 27.5nm. However, only the low n and corresponding highk parts of the S curves (labeled 1 in Fig. 12) were con-sistent with both the thick and thin samples. Theseoptical constants are listed in Table XII. Results aregiven for two different assumed thicknesses of the thinsample, emphasizing the option of thickness as a pa-
ILz
C-)
U.U-0
I-_a-0ch4
8
7
6
5
4
3
2
3.4
3.2
3.0
2.8
2.6
2.4
2.2
*
26 28 30 32 34 36 38
THICKNESS (nm)
26 28 30 32 34 36 38
THICKNESS (nm}
Fig. 12. Algebraic inversion method. Solution traces for the thickRh film at 500-nm wavelength. Corresponding parts of the n and k
curves are labeled 1, 2, and 3.
rameter rather than a required measurement quantity.In this case, increased values of the thickness parametercorrespond to reduced values of k (see Fig. 12)-a trendconsistent with the collective results listed in TableXVIII.
Repeating the analysis with reflectance data mea-sured from the substrate side only yielded n and k so-lutions in agreement with those in Table XII for filmthicknesses significantly outside previously stated errormargins. We conclude that the Rh material is also in-homogeneous.
Finding multiple solutions for n and k at the samefilm thickness is a direct consequence of invertingnonlinear optical equations. To resolve the ambiguity,we recommend additional measurements at differentangles of incidence and polarization. Another possi-bility is to select those optical constants consistent withtwo or more thicknesses of the same material-theprocedure followed in this paper. C
In summary, we have applied a new algebraic methodto extract thin-film optical parameters from spectro-photometric data. The method permits a determina-tion of all n, k, and film thickness combinations at asingle wavelength compatible with measured reflectanceand transmittance. These solution points lie alongcontinuous curves, easily mapped to any level of detailfor purposes of exactness and error analysis. We be-lieve that gaining this perspective on the total solutionspace is highly advantageous.
15 October 1984 / Vol. 23, No. 20 / APPLIED OPTICS 3587
I I I III I I I I I I I
2_
I _
F. Inverse Synthesis Method
This method is described at some length in Ref. 27.It is a multiwavelength multiangle method in which theconstants of suitable dispersion formulas are found bynumerical refinement that simultaneously best fit manyexperimental measurements of transmittance, reflec-tance, and/or absorptance. The dispersion equationswe employed for the current determinations were
BX2 2 [ BX2 \2- C)1n2=A+k2+ B + a- Bi2 -I)(1 + C2 X2) +=1 [(X2 - C) 2 + D9X2]
I ~I ' (172n 1(1 + C2? 2) i=1 L(X2 - C?)2 +DiX 2 J(
where X is expressed in microns, and ABCBiCiDi aresuitable constants. Many different thin-film modelsare possible. For the purpose of this determination weassumed that all films are homogeneous, absorbing, butscatter-free and that the optical constants for both thethin and thick films are the same.
The samples were not cleaned prior to the measure-ments, and ambient atmospheric conditions and tem-peratures prevailed. The thicknesses of the metal filmswere measured with a Sloan Dektak II profilometer. APerkin-Elmer model 330 spectrophotometer was usedfor the spectral transmission and reflection measure-ments. For the latter a reflectance attachment wasemployed. Measurements on the uncoated substrateswere consistent with the published optical constants forsilica.3 For transmission measurements at non-normalincidence, polarizers were placed in both beams of theinstrument, and the spectrophotometer was zeroedprior to insertion of the sample.
For determination of the optical constants of Sc20 3we measured spectral transmission and reflection ofeach film at normal incidence and the transmission forlight polarized parallel and perpendicular to the planeof incidence for angles of 45 and 600 [Figs. 13(A),(B)].
wdU-zHZC.wd
.' - ---- - -rc45/ '4 5)I / *v ~~~~~~~~~
0.6 4 x .,1601
0.4 t I 450.3, Tm
RA\V~-jLi. 0.2w
-0 Li 1.0
z< 0.8
2 0.6z< 0.4H
0.2
0
.~ a_ . .. m._ .-T _ -T .. , _r ,- - ps
160 ,.' T t 0
Tt.221.2 . ....
.. %.T! (6 0) -
B I . . .
400 600 800 400 600 800WAVELENGTH (nm)
Fig. 13. Inverse synthesis method. Spectrophotometric measure-ments used in determination of the optical constants of the Sc203
films.
We also measured the normal incidence transmittanceof the films after a quartz plate was contacted to eachwith a refractive-index matched liquid [Figs. 13(C),(D)].We assumed that the optical constants of the filmsimmersed in the contact liquid would be unchanged.
We thus obtained fourteen spectral transmittanceand reflectance curves for effectively four differentthin-film systems. From these curves we selected 196equispaced points. (This is too large a number topresent in tabular form in this paper.) Our computerprogram tried to fit all these data simultaneously by
1.92 ll l
wo 1.88z
w
' 1.84U-
1.80 , | | 400 500 600 700 800
WAVELENGTH (nm)
Fig. 14. Inverse synthesis method. Average refractive index of theSc203 films.
I .0
0.8wo 0.6zo 0.4w
-JLi.. 0.2w
-r.0WL 1.00zj5 0.8
2 0.6U,)z
0.4
0.2
0
A B
t=31.7nm T-'IR -~ tI6.9nm Tel3
R
T 60)
Tr(41 (45) ~T 10
T,1601
L Dt = 3 1.7 t 16.9 nm T
400 600 800 400 600 800
WAVELENGTH (nm)
Fig. 15. Inverse synthesis method. Spectrophotometric measure-ments used in determination of the Rh films.
4
' z
O U-Z U-
- W0z U
_ j2U Ic
a eU)
I L-400 500 600
WAVELENGTH (nm)
700 800
Fig. 16. Inverse synthesis method. Average optical constants of theRh films.
3588 APPLIED OPTICS / Vol. 23, No. 20 / 15 October 1984
t. = 450.3 nm T "U
C
t= 221.2 m Tag-
D
k
. _ .. _ _ _ _ _ . _ _ _ _ . . .. _ _ _ _ _ _ _ . _ _
, . . . .
I n%
I
I
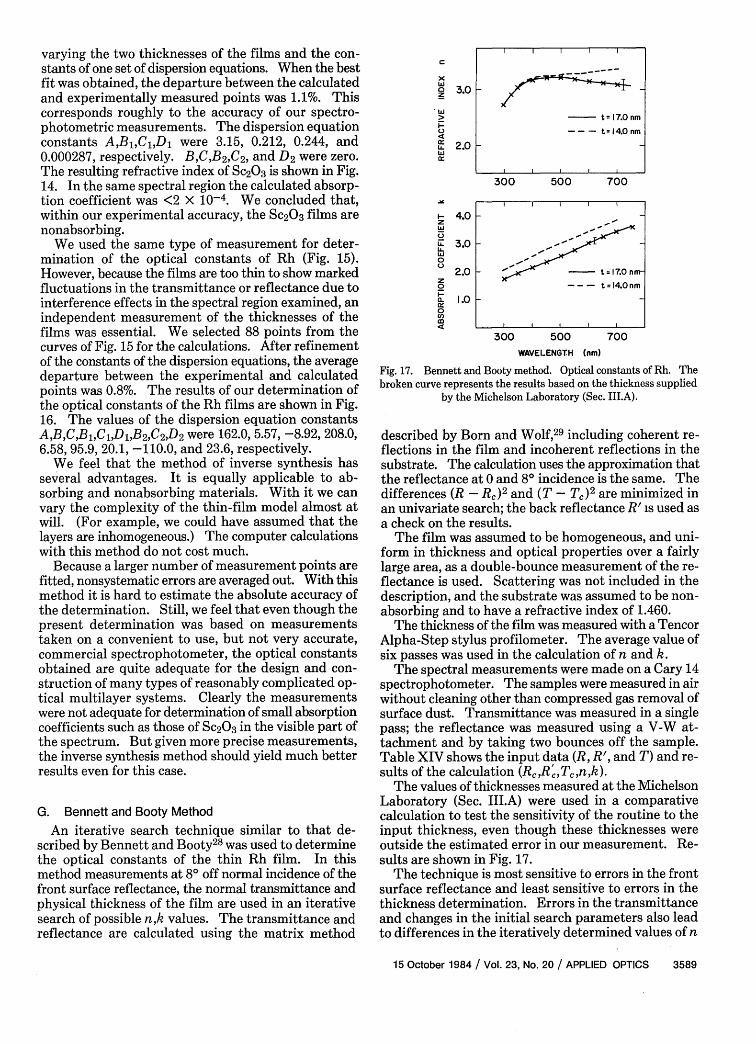
varying the two thicknesses of the films and the con-stants of one set of dispersion equations. When the bestfit was obtained, the departure between the calculatedand experimentally measured points was 1.1%. Thiscorresponds roughly to the accuracy of our spectro-photometric measurements. The dispersion equationconstants A,B1,C 1,Dj were 3.15, 0.212, 0.244, and0.000287, respectively. B,C,B 2 ,C2 , and D2 were zero.The resulting refractive index of Sc2 03 is shown in Fig.14. In the same spectral region the calculated absorp-tion coefficient was <2 X 10⁻⁴. We concluded that,within our experimental accuracy, the Sc203 films arenonabsorbing.
We used the same type of measurement for deter-mination of the optical constants of Rh (Fig. 15).However, because the films are too thin to show markedfluctuations in the transmittance or reflectance due tointerference effects in the spectral region examined, anindependent measurement of the thicknesses of thefilms was essential. We selected 88 points from thecurves of Fig. 15 for the calculations. After refinementof the constants of the dispersion equations, the averagedeparture between the experimental and calculatedpoints was 0.8%. The results of our determination ofthe optical constants of the Rh films are shown in Fig.16. The values of the dispersion equation constantsA,B,C,Bi,C,,D,,B 2 ,C2 ,D2 were 162.0, 5.57, -8.92, 208.0,6.58, 95.9, 20.1, -110.0, and 23.6, respectively.
We feel that the method of inverse synthesis hasseveral advantages. It is equally applicable to ab-sorbing and nonabsorbing materials. With it we canvary the complexity of the thin-film model almost atwill. (For example, we could have assumed that thelayers are inhomogeneous.) The computer calculationswith this method do not cost much.
Because a larger number of measurement points arefitted, nonsystematic errors are averaged out. With thismethod it is hard to estimate the absolute accuracy ofthe determination. Still, we feel that even though thepresent determination was based on measurementstaken on a convenient to use, but not very accurate,commercial spectrophotometer, the optical constantsobtained are quite adequate for the design and con-struction of many types of reasonably complicated op-tical multilayer systems. Clearly the measurementswere not adequate for determination of small absorptioncoefficients such as those of Sc203 in the visible part ofthe spectrum. But given more precise measurements,the inverse synthesis method should yield much betterresults even for this case.
G. Bennett and Booty Method
An iterative search technique similar to that de-scribed by Bennett and Booty28 was used to determinethe optical constants of the thin Rh film. In thismethod measurements at 80 off normal incidence of thefront surface reflectance, the normal transmittance andphysical thickness of the film are used in an iterativesearch of possible n,k values. The transmittance andreflectance are calculated using the matrix method
C
'CW
0z
U-IC
U-LU0
0
a.IC0U)
3.0 1
2.0 H
300 500 700
4.0 -
3.0 I
2.0 -
1.0
300 500WAVELENGTH
700(nm)
Fig. 17. Bennett and Booty method. Optical constants of Rh. Thebroken curve represents the results based on the thickness supplied
by the Michelson Laboratory (Sec. III.A).
described by Born and Wolf,29 including coherent re-flections in the film and incoherent reflections in thesubstrate. The calculation uses the approximation thatthe reflectance at 0 and 80 incidence is the same. Thedifferences (R - R,)2 and (T - T) 2 are minimized inan univariate search; the back reflectance R' is used asa check on the results.
The film was assumed to be homogeneous, and uni-form in thickness and optical properties over a fairlylarge area, as a double-bounce measurement of the re-flectance is used. Scattering was not included in thedescription, and the substrate was assumed to be non-absorbing and to have a refractive index of 1.460.
The thickness of the film was measured with a TencorAlpha-Step stylus profilometer. The average value ofsix passes was used in the calculation of n and k.
The spectral measurements were made on a Cary 14spectrophotometer. The samples were measured in airwithout cleaning other than compressed gas removal ofsurface dust. Transmittance was measured in a singlepass; the reflectance was measured using a V-W at-tachment and by taking two bounces off the sample.Table XIV shows the input data (R, R', and T) and re-sults of the calculation (RcRcTcnk).
The values of thicknesses measured at the MichelsonLaboratory (Sec. III.A) were used in a comparativecalculation to test the sensitivity of the routine to theinput thickness, even though these thicknesses wereoutside the estimated error in our measurement. Re-sults are shown in Fig. 17.
The technique is most sensitive to errors in the frontsurface reflectance and least sensitive to errors in thethickness determination. Errors in the transmittanceand changes in the initial search parameters also leadto differences in the iteratively determined values of n
15 October 1984 / Vol. 23, No. 20 / APPLIED OPTICS 3589
t = 17.0 nm
-- - t4.0nm
l I I
,-I
Z n- t=17.Onm---- t=14.0nm
l I I I
i
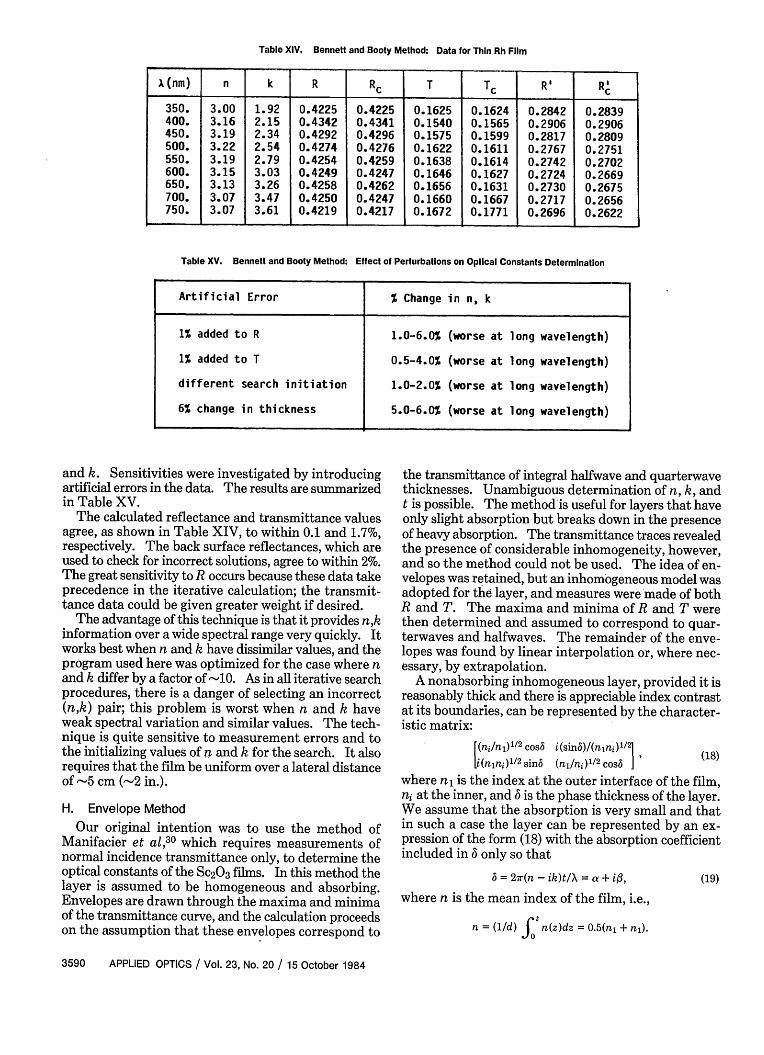
Table XIV. Bennett and Booty Method: Data for Thin Rh Film
X(nm) n k R RC T Tc Re RC
350. 3.00 1.92 0.4225 0.4225 0.1625 0.1624 0.2842 0.2839400. 3.16 2.15 0.4342 0.4341 0.1540 0.1565 0.2906 0.2906450. 3.19 2.34 0.4292 0.4296 0.1575 0.1599 0.2817 0.2809500. 3.22 2.54 0.4274 0.4276 0.1622 0.1611 0.2767 0.2751550. 3.19 2.79 0.4254 0.4259 0.1638 0.1614 0.2742 0.2702600. 3.15 3.03 0.4249 0.4247 0.1646 0.1627 0.2724 0.2669650. 3.13 3.26 0.4258 0.4262 0.1656 0.1631 0.2730 0.2675700. 3.07 3.47 0.4250 0.4247 0.1660 0.1667 0.2717 0.2656750. 3.07 3.61 0.4219 0.4217 0.1672 0.1771 0.2696 0.2622
Table XV. Bennett and Booty Method: Effect of Perturbations on Optical Constants Determination
Artificial Error % Change in n, k
1% added to R 1.0-6.0% (worse at long wavelength)
1% added to T 0.5-4.0% (worse at long wavelength)
different search initiation 1.0-2.0% (worse at long wavelength)
6% change in thickness 5.0-6.0% (worse at long wavelength)
and k. Sensitivities were investigated by introducingartificial errors in the data. The results are summarizedin Table XV.
The calculated reflectance and transmittance valuesagree, as shown in Table XIV, to within 0.1 and 1.7%,respectively. The back surface reflectances, which areused to check for incorrect solutions, agree to within 2%.The great sensitivity to R occurs because these data takeprecedence in the iterative calculation; the transmit-tance data could be given greater weight if desired.
The advantage of this technique is that it provides n,kinformation over a wide spectral range very quickly. Itworks best when n and k have dissimilar values, and theprogram used here was optimized for the case where nand k differ by a factor of 10. As in all iterative searchprocedures, there is a danger of selecting an incorrect(n,k) pair; this problem is worst when n and k haveweak spectral variation and similar values. The tech-nique is quite sensitive to measurement errors and tothe initializing values of n and k for the search. It alsorequires that the film be uniform over a lateral distanceof -5 cm (-2 in.).
H. Envelope Method
Our original intention was to use the method ofManifacier et al,3 0 which requires measurements ofnormal incidence transmittance only, to determine theoptical constants of the Sc203 films. In this method thelayer is assumed to be homogeneous and absorbing.Envelopes are drawn through the maxima and minimaof the transmittance curve, and the calculation proceedson the assumption that these envelopes correspond to
the transmittance of integral halfwave and quarterwavethicknesses. Unambiguous determination of n, k, andt is possible. The method is useful for layers that haveonly slight absorption but breaks down in the presenceof heavy absorption. The transmittance traces revealedthe presence of considerable inhomogeneity, however,and so the method could not be used. The idea of en-velopes was retained, but an inhomogeneous model wasadopted for the layer, and measures were made of bothR and T. The maxima and minima of R and T werethen determined and assumed to correspond to quar-terwaves and halfwaves. The remainder of the enve-lopes was found by linear interpolation or, where nec-essary, by extrapolation.
A nonabsorbing inhomogeneous layer, provided it isreasonably thick and there is appreciable index contrastat its boundaries, can be represented by the character-istic matrix:
(18)
where n1 is the index at the outer interface of the film,ni at the inner, and is the phase thickness of the layer.We assume that the absorption is very small and thatin such a case the layer can be represented by an ex-pression of the form (18) with the absorption coefficientincluded in 6 only so that
(19)= 2ir(n - ik)t/X = a + i,
where n is the mean index of the film, i.e.,t
n = (d) a; n(z)dz = 0.5(n + n).
3590 APPLIED OPTICS / Vol. 23, No. 20 / 15 October 1984
(ni/ni)112 COS6 i(sin5)Anjnj)1/ I ,1i(n1nj)1/2sin6 (nj/nj)1/2C0S5 j

Here :3 is assumed to be sufficiently small for first-orderexpansions in :3 to be of acceptable accuracy.
We assume in the calculations that the quarterwavesand halfwaves are given by ar = m-r/2. We also assumethat the same value of : applies to both halfwaves andquarterwaves at the same wavelength. We write Tmin,Rmax, Tmax, and Rmin for the transmittance and reflec-tance corresponding to quarterwave and halfwavethicknesses, respectively. If
x = n~n8 /(nnX)' 12 + (nini)/ 2 ,
y = n~n/(ninX/2 - (nni)1/2
p = n(ni/nl)'/ 2 + n8(n,/ni)1/2, (20)
q = n.(ni/nl)1/2 -n(nj/n&/2'
then, neglecting terms of second and higher order in/,
{X + flp)2 = 4nfolns/Tmin,
(p + fX)2 = 4nofns/Tmax,
(y + flq)2 = 4nofns(Rmax/Tmin), (21)
(a + fy)2 = 4non, (Rmin/Tmax).
In the present case, y and q are negative, and so wetake negative roots for R and positive for T. The iter-ative scheme for the calculation of nj, ni, and isthen
x = 2(nons/Tmin)1/2- fp',
p = 2(nfos/Tmax.)/2 -'x',
y = -2(nonsRmax/Tmiu)1/2 - /'q', (22)
q = -2(nonsRmin/Tmax)1/2 - y,
= 0.5C[(1 -Tmin - Rmax)/Tmin] + [(1 - Tmx - Rmin)/Tmax]
[(n,/ni + ni/n,) + A']
where /', p', etc. are the values obtained in the previousiteration. Then
[(X - y)(p - q) 1/2
[n(x -y)(p +q) 1/
[(x +s F )(p- (23)
If we assume that the optical thickness is given by (n,+ ni)t/2, we can derive the geometrical thickness fromthe wavelengths corresponding to the extrema. Thevalues measured from the transmittance curves areassumed for these, since the positions of the reflectanceextrema may be slightly displaced by the small angle ofincidence. The necessary expression is
2ir[(n, + ni)/21(t/X) = mir/2. (24)
The order m, an integer, can readily be established fromthe range of extrema, and then a value of t can be foundfrom each extremum. The final value of t is calculatedas the mean of the individual values. Next k is givenby
k = 3A/(2-rt). (25)
The derivations so far have used the single-surface
reflectance and transmittance. The quantities that areactually measured include the effect of the rear surfaceand must be corrected. Also the index of the substraten, must be known.
Incoherent multiple-beam summation that assumesabsorption is confined to the surface coatings yields forthe net transmittance T and reflectance R:
T= TTf R Rf-Rs(RfTf2) (26)(1 - RRf) (1 -RRf)
where T8, R, and Tf, Rf are the reflectances and trans-mittances of the two surfaces. If Tf, Rf refer to thecoated surfaces in this case,
Tf =T(1 - RRf) Rf = R(1 - RRf) + R (R? - T2), (27)
and these two expressions can be used in an iterativesolution for Tf and RJ given T and R, the measuredvalues, and T8 and R, the values corresponding to therear uncoated substrate surface. T and R, can befound from a separate measurement on an uncoatedsubstrate. In this case we assume no absorption eitherat the interface or through the bulk and obtain
Tf=T, Rf=R8 =1-T,
so that
T = 2T/(1 + T) R, = (1 - T)1( + T).
Finally, n, can then be found from R, as
(1 +Rs 2)s - 1/2)
(1 -Rs 1 2
(28)
(29)
(30)
Measurements were made over the 300-700-nm rangeon a Cary 14 spectrometer. A V-W absolute reflectanceattachment was used for the reflectance measurements.Transmittance measurements were made at normalincidence but reflectance at 8°. The V-W attachmentgives R2 and uses two small neighboring areas of thesample so that errors in uniformity may lead to reflec-tance errors. Both coated and uncoated substrateswere measured together with background and zeroscans.
Although it is possible to obtain values over the entirewavelength region, the derivations in this example havebeen limited to the wavelengths corresponding to theextrema. Table XVI shows the reflectance valuescorrected for the effects of the rear surface together withthe value derived for n,. The values of wavelengthcorrespond to the extrema of the transmittance curves,although there is little difference, if any, between thepositions of the extrema in R and T. The values of n,are quoted to four decimal places not as an indicationof possible accuracy but because they are used in sub-sequent calculations.
Table XVI also shows the derived values of n1, ni, k,and t. Note that k is negative for the final two wave-lengths corresponding to the thick film. This is simplybecause the values of R and T sum to slightly greaterthan unity. Within the accuracy of the measurement(see below) we can simply say that k is virtually zero.
The consistency of the measurement is illustrated bythe results in the last column of Table XVI, which are
15 October 1984 / Vol. 23, No. 20 / APPLIED OPTICS 3591
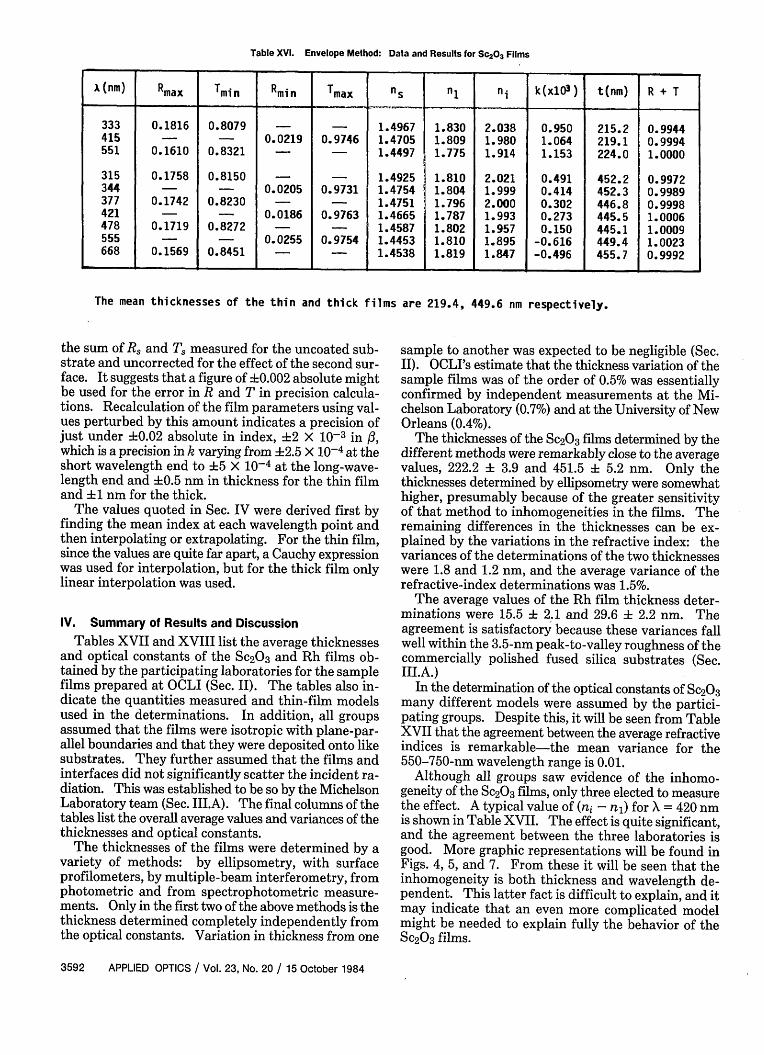
Table XV. Envelope Method: Data and Results for Sc2 03 Films
| (nm) Rmax Tmin Rmin Tmax nL n | n k(x103) t(nm) R + T
333 0.1816 0.8079 - - 1.4967 1.830 2.038 0.950 215.2 0.9944415 - - 0.0219 0.9746 1.4705 1.809 1.980 1.064 219.1 0.9994551 0.1610 0.8321 - - 1.4497 1.775 1.914 1.153 224.0 1.0000
315 0.1758 0.8150 - - 1.4925 1.810 2.021 0.491 452.2 0.9972344 - - 0.0205 0.9731 1.4754 1.804 1.999 0.414 452.3 0.9989377 0.1742 0.8230 - - 1.4751 1.796 2.000 0.302 446.8 0.9998421 - - 0.0186 0.9763 1.4665 1.787 1.993 0.273 445.5 1.0006478 0.1719 0.8272 - _ 1.4587 1.802 1.957 0.150 445.1 1.0009555 - - 0.0255 0.9754 1.4453 1.810 1.895 -0.616 449.4 1.0023668 0.1569 0.8451 - _ 1.4538 1.819 1.847 -0.496 455.7 0.9992
The mean thicknesses of the thin and thick films are 219.4, 449.6 nm respectively.
the sum of R, and T, measured for the uncoated sub-strate and uncorrected for the effect of the second sur-face. It suggests that a figure of ±0.002 absolute mightbe used for the error in R and T in precision calcula-tions. Recalculation of the film parameters using val-ues perturbed by this amount indicates a precision ofjust under +0.02 absolute in index, 2 X 10⁻³ in ,which is a precision in k varying from 2.5 X 10⁻⁴ at theshort wavelength end to 5 X 10⁻⁴ at the long-wave-length end and ±0.5 nm in thickness for the thin filmand 1 nm for the thick.
The values quoted in Sec. IV were derived first byfinding the mean index at each wavelength point andthen interpolating or extrapolating. For the thin film,since the values are quite far apart, a Cauchy expressionwas used for interpolation, but for the thick film onlylinear interpolation was used.
IV. Summary of Results and Discussion
Tables XVII and XVIII list the average thicknessesand optical constants of the Sc20 3 and Rh films ob-tained by the participating laboratories for the samplefilms prepared at OCLI (Sec. II). The tables also in-dicate the quantities measured and thin-film modelsused in the determinations. In addition, all groupsassumed that the films were isotropic with plane-par-allel boundaries and that they were deposited onto likesubstrates. They further assumed that the films andinterfaces did not significantly scatter the incident ra-diation. This was established to be so by the MichelsonLaboratory team (Sec. III.A). The final columns of thetables list the overall average values and variances of thethicknesses and optical constants.
The thicknesses of the films were determined by avariety of methods: by ellipsometry, with surfaceprofilometers, by multiple-beam interferometry, fromphotometric and from spectrophotometric measure-ments. Only in the first two of the above methods is thethickness determined completely independently fromthe optical constants. Variation in thickness from one
sample to another was expected to be negligible (Sec.II). OCLI's estimate that the thickness variation of thesample films was of the order of 0.5% was essentiallyconfirmed by independent measurements at the Mi-chelson Laboratory (0.7%) and at the University of NewOrleans (0.4%).
The thicknesses of the Sc20 3 films determined by thedifferent methods were remarkably close to the averagevalues, 222.2 3.9 and 451.5 ± 5.2 nm. Only thethicknesses determined by ellipsometry were somewhathigher, presumably because of the greater sensitivityof that method to inhomogeneities in the films. Theremaining differences in the thicknesses can be ex-plained by the variations in the refractive index: thevariances of the determinations of the two thicknesseswere 1.8 and 1.2 nm, and the average variance of therefractive-index determinations was 1.5%.
The average values of the Rh film thickness deter-minations were 15.5 2.1 and 29.6 i 2.2 nm. Theagreement is satisfactory because these variances fallwell within the 3.5-nm peak-to-valley roughness of thecommercially polished fused silica substrates (Sec.III.A.)
In the determination of the optical constants of Sc20 3many different models were assumed by the partici-pating groups. Despite this, it will be seen from TableXVII that the agreement between the average refractiveindices is remarkable-the mean variance for the550-750-nm wavelength range is 0.01.
Although all groups saw evidence of the inhomo-geneity of the Sc20 3 films, only three elected to measurethe effect. A typical value of (n - n1 ) for X = 420 nmis shown in Table XVII. The effect is quite significant,and the agreement between the three laboratories isgood. More graphic representations will be found inFigs. 4, 5, and 7. From these it will be seen that theinhomogeneity is both thickness and wavelength de-pendent. This latter fact is difficult to explain, and itmay indicate that an even more complicated modelmight be needed to explain fully the behavior of theSc20 3 films.
3592 APPLIED OPTICS / Vol. 23, No. 20 / 15 October 1984
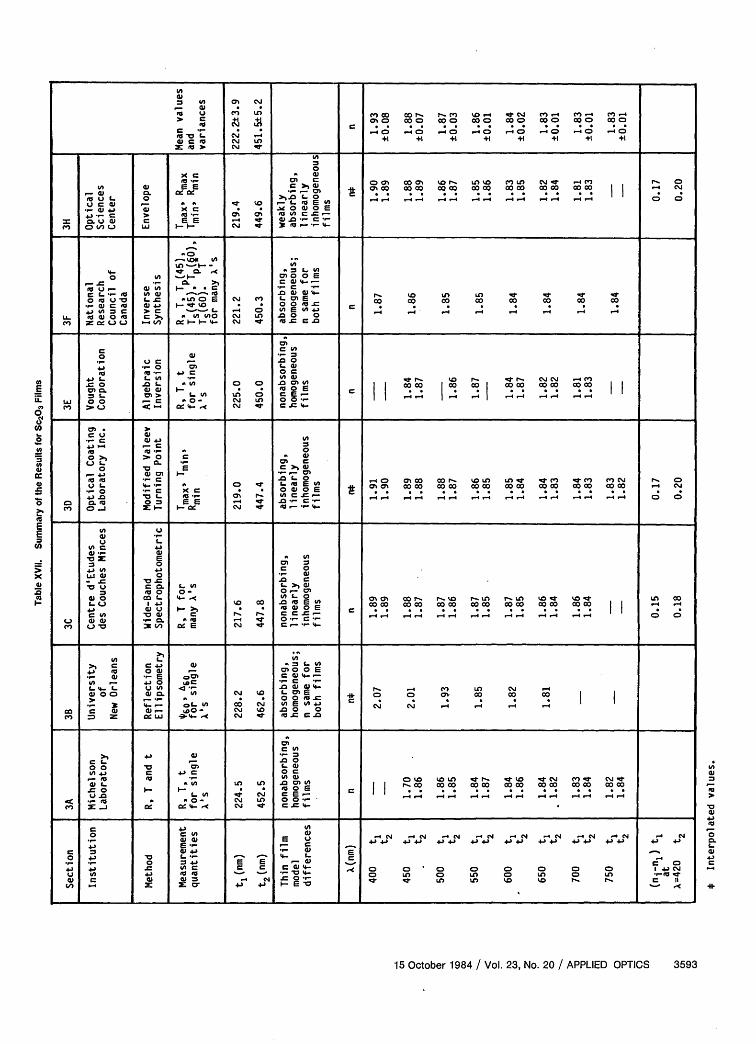
I n
0 0 M LO en c~)o CoF- r-.c' %0 4 0N ('m m').4 M )-4
C 0 a CDO CO Co CD O a CoO _O Ola la- ,-0 4 ,4 CZ .40 -0 4 .4
(L 'a Nl LO 41 41 41 41 41 41 41 41zo> 0'
0
_ = X - ~~C~o * =s = 8 4'
u L. 0 0~~~~~~~~~~~~~~~~~~~- 0D
C L 0 .C, ; .E 1. Coo CoO _ Z M.- a _ ' VIn a =
4 0. 4 a C C -4 0m O, ) , J -- la
-0
CL VI~~~~~~I4- 0' 0. ,.~ A~L 0
00'- 4'In I-r. 4) 4
_Lv :° G V._ .C0'VI (' o 0 In In 0' co 0' 0O*- O O *- c x oE o co C o C Co Co a co.4 - a 'A.inL C L0) _
Z lV *=-4 L o' o a
MC
a a~~~~~nI
0~eJ 4'0 O~t Su^°C ,'
__ Q r := 0 clC E 71 + c _ W
o X -41 _ oo s O o *- E <voC ~~~~c; o O~ o~ 1 c~ *tF O~ O~ C Coo o
.a0 ._L *In 0 0 oLa'In 0*a 10 N- 'e'. o~zl 0N_ '0. 4'4' Z- .S: IoO i W NC aD
La.) 00 a AO- N~~~~~~~~L 0 a0 " a C
a.j
ao 4 @ .cmCD L. la n O
1 0 .OLO 1 V I u0 co c 00 0 0 coc
4). 'aL 0.- 01 ( MIn~
u . IDCE .- 00 .0 0co co - 0 0 c co -4- .4- .- 4.-4 c 0-.. ,-40 ,-.4
L") 0.) - I- N 0' 0,C-4
In 0 --
0 L ~ ~ ~ ~~~~~
4)In 4.) a~~~~~~~~ 0D C m 0
00 4 0- 0,- CJ Wr A4co 0 COL 4-0 CMO 11 o = (-1 I.n 'In 10' 10'n C
LU 44) 10 C .OWnC o C4oC-o C o C'oCao
U m' ~ 0 4E . CD4 0' L o .' %aV.m'-
L ~ ~~~~~L
4) 0 04' - a'OOE~~~~~~~~~~~~N N - N N
In .- 4)0 ,a - 4
L L In Mla u0''4 - - C) I' Cn ,-4)00 4)0. In N 10~~~~C La'C 1
V) -4-- L 0 C NJ En~4 .4 ,4
15 October 1984 / Vol. 23, No. 20 / APPLIED OPTICS 3593
0E
Co0
CY
a4
0Co
ax
m
as
In
4)
0
al
*
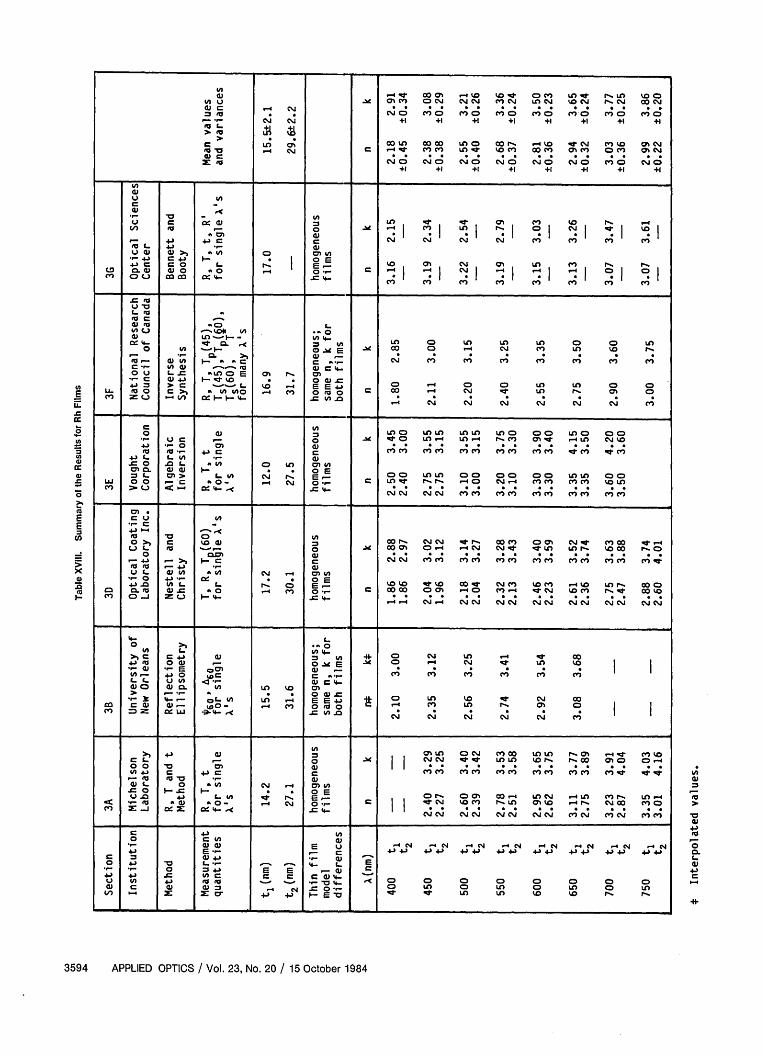
a) .~~~~~~~~~~ ~~-4 0' C01 .-.10 10 ' C In0' - (-.In % 10VI _d O)O 4m Clo CD U5i lU4 cl l r O4P M00 iVCZ O 0 C. O N N N C N I N 1o CN l_ N C oN
n ~~ * N O C") O " a-O )O n O '0 rt O - O_ _ N +1 +1 +1 +1 +1 +1 +1 +1
> MC n 01 Co n _o 0 00 LnO COr .-_ 0 0'N ro -01 %
l~ ~ ~~~a -40 C ")C")m In0 -W Cn"o) Cor 0c) C at
IZ'1 N O N O N O N O N O N O C)O N O+1 +1 +1 +l +1 +l +1 +1
U C I _a) la
_ 0e) X ex Cl:; _ S., W I " X I 't I ts II
__ 'D ._ D
4W - In O
41 C ED0 F ^^CC ^_ o X n X X t c-- va 0 Q cli- 4 D Cco co L ~ c * ,u I E I r_
*-~~~~~~~~~~~~~~~~~~~~~C C4 > C4 1 4 A . DLt sE CJ C °°°unt laa ~j
Cn 'U , L -uo o IF 0
n L ID @ L vx N 18- E° E O o , In o o o o o o &D In U C CD o
'UL 4) ..- ~~~~4' :
4 CD *I CD Ca ' I . CD
U. 'a C O- C1 00 U,) N - DX O 01: C _
Ol4.) L 4 _- CZ I C- CZ 1-0
4 ao L> i-- CC N N V e ) U CD C C n C CD
W 0.4' 4 AO .- ..
,~~~~~~~~~~~~~~~~~ U -c (D 4 _ n .. fl Um N -W - LO E l %
p nvl; LIO E_ D 0 0
la O "_ O4- ._ C O4 0 _4 04 V; _I V; Nl C4 ; d 0
_ L
4'' CO L vv +o N u - 0
InU AA 104 In .C' 0 D( nL DC DC D= L)U zCuj 0 0 0 ..- n n 0r r In- C li- In I 0 m 0 U-)
o In - O. Y4C E 4 O _ N C) In 10 1-
00 LL OO 01 a. *_qJC'
* > -_ 1- 0 0 * _ °Oa 0 - 0 0 In In 0 0
cumDdi LN I'U ' - a CZ C" CL VC) CN °CO CC C') ) 0C °' c" OD X O
m 44 v}o J 42c 0 a
L Ln . L. _ a
O 0 4 0 AC 0 IC E 01In O O O O
a'0.m ) 4'4 I . . O- 00 n0n 0014CD m- 00 00l InO 00, t 00
tM _) i 2m V _- CZ _- CZ o4 Z CZ CZ O i CZC 4C
a> L N C.. C
LLI 0 -a - .- 4 ) a In0 a-a-i .40 N.4 C'C" C"C" 1In4") >U .5 0 4-( 04 (, C)() M)' C)C" 'C) C*'
co 'U j 0 '0 0M la0- m In '- 0 0>)=D ae 14' COC C4J CZ.. Co"' 0CZ N0 ')o 0'
UL 'U4 ., o .JCO 0.-4 C C m N 00 0'In nIr. M Vo m -0
0 la s 4'C~C.4) C- i-a a N CC C ')C")) C")C m"C) C)' M en" --I 0' 1
~~.-Q 4)..- ~~~~~~~ . . OC 1010 0'10~~~CDr, Co0 NC" 1CU') . -4 10 In- CoO
C" 0. dU 1-- z .04-C) 1. n O o 4P ~ ic
4- L~~~~-)U
>)a a4) 4'CU In * 0 N In .4 04)'U 04' .-~4 0.j - .' -4 N 0'4 In - N ~ -
In,- 4)0 wa4 a t- " C) C" ") C) "LL0I <3.. a)C
4'0 4'0 VIn In 10 U ~t 4-, ln In .4 CC4 'c 0D In 10 CD C o DCO a4 4. 0
4,o - C) 0U C-D C") In U,) CD 0n 0
>) 4) 4'E - 1In ON U,)C to~ (-.0 .- 40 PI
3594 APPLIED OPTICS / Vol. 23, No. 20 / 15 October 1984
(E
0a)
co
EE
x4'
I)
In
4'
'0
Ma
0.L.a)4)af
*
Five groups made separate determinations of theaverage refractive indices of the thin and thick Sc20 3films. The difference between these two refractiveindices is much smaller than (ni - nO). It is of the sameorder of magnitude as the mean variance of the refrac-tive-index determinations and was either negative orpositive.
Some participating groups assumed at the outset thatthe SC2 03 films were nonabsorbing. Those who did notfound that the absorption coefficient of the SC203 filmswas so small that their methods were not able to yieldsignificant values for it. Should it be important tomeasure this quantity, different methods must be em-ployed, such as those based on calorimetry or on at-tenuation in lightguides.
The results of the determinations of the optical con-stants of the Rh films are less satisfactory. The averagevariances of the determinations of n,k in the 400-750-nm spectral region were 0.35, 0.26, respectively.Expressed in percent, the variances are 13 and 8%.Furthermore, these results differ greatly from publisheddata.
Probably many factors contribute to this situation.'It is possible that some of the determinations did notconverge to the right values. As a rule, metal films areless stable than oxide layers. There is evidence thatsome oxidation and aging of the films occurred (Secs.III.AIII.D,III.E). It is possible that after the prepa-ration the Rh samples aged differently and that someof the differences in the values are real. The aging andoxidation may have given rise to a surface layer and/oran inhomogeneous film. Yet all the thin-film modelsin the present determinations assumed the existence ofa single homogeneous film. It is likely that departuresfrom this simple model will have different effects ondifferent methods for the determination of n and k.Another contributing factor may have been the lowpercentage accuracy (14 and 7%) of the determinationof the thicknesses of the Rh films. For example, thedetermination of the absorption coefficient often de-pends strongly on the accuracy of the thickness deter-mination. Evidence that this may be so in the presentcase is the fact that the products kt are more constantthan either k or t alone.
It is very likely that different starting materials andpreparation conditions contributed to the large depar-ture of the optical constants published in this paperfrom those in previous work.5
The Michelson Laboratory team would like to thankD. L. Decker for helping design and build the laser ap-paratus to measure reflectance and transmittance andP. C. Archibald for making the scattering measurementson the SC20 3 films.
The work of Azzam and Thonn was supported by theState of Louisiana Board of Regents and the NationalScience Foundation.
The OCLI team wishes to acknowledge the work ofR. H. Miller in implementing the method of Valeev atOCLI and the work of B. Vidal for writing the computerprogram code used for the Nestell-Christy method.
The NRCC team would like to thank P. Brennan, R.Simpson, and A. Waldorf who took the measure-ments.
U. J. Gibson and R. Swenson wish to acknowledge H.G. Craighead, who developed the computer code fromwhich the program used here was derived.
References1. J. M. Bennett, "Optical Evaluation Techniques for Thin Films,"
J. Opt. Soc. Am. 73,1865A (1983).2. H. K. Pulker, "Mechanical Characterization of Optical Films,"
J. Opt. Soc. Am. 73,1865A (1983).3. D. E. Gray, Ed., American Institute of Physics Handbook
(McGraw-Hill, New York, 1972), p. 6-28 (refractive index of fusedsilica); p. 6-120 (equations for calculating n and k from Tf, Rf,and film thickness).
4. F. Rainer, W. H. Lowdermilk, D. Milam, T. Tuttle Hart, T. L.Lichtenstein, and C. K. Carniglia, "Scandium Oxide Coatings forHigh-Power UV Laser Applications," Appl. Opt. 21, 3685(1982).
5. J. K. Coulter, G. Hass, and J. B. Ramsey, Jr., "Optical Constantsof Rh Films in Visible," J. Opt. Soc. Am. 63, 1149 (1973).
6. D. L. Decker, in Laser Induced Damage in Optical Materials:1975, A. J. Glass and A. H. Guenther, Eds., NBS Spec. Publ. 435(Apr. 1976), pp. 230-235.
7. H. E. Bennett and J. L. Stanford, "Structure-Related OpticalCharacteristics of Thin Metallic Films in the Visible and Ultra-violet," J. Res. Natl. Bur. Stand. Sect. A 80, 643 (1976).
8. J. M. Bennett and J. H. Dancy, "Stylus Profiling Instrument forMeasuring Statistical Properties of Smooth Optical Surfaces,"Appl. Opt. 20,1785 (1981).
9. J. M. Bennett, "Measurement of the rms Roughness, Autoco-variance Function, and Other Statistical Properties' of OpticalSurfaces Using a FECO Scanning Interferometer," Appl. Opt.15, 2705 (1976).
10. H. E. Bennett, "Scattering Characteristics of Optical Materials,"Opt. Eng. 17, 480 (1978); P. C. Archibald and H. E. Bennett,"Scattering from Infrared Missile Domes," Opt. Eng. 17, 647(1978).
11. H. E. Bennett and J. M. Bennett, in Physics of Thin Films, Vol.4, G. Hass and R. E. Thun, Eds. (Academic, New York, 1967), pp.1-96 (see especially pp. 42-44, "Transmittance of a Thin Filmon a Nonabsorbing Substrate").
12. R. M. A. Azzam and N. M. Bashara, Ellipsometry and PolarizedLight (North-Holland, Amsterdam, 1977).
13. Ref. 12, Secs. 3.7 and 5.4.14. I. H. Malitson, "Refractive Index of Fused Silica," J. Opt. Soc.
Am. 55,1205 (1965).15. R. M. A. Azzam, A.-R. M. Zaghloul and N. M. Bashara, "Ellip-
sometric Function of a Film-Substrate System: Applicationsto the Design of Refraction-type Optical Devices and to Ellipso-.metry," J. Opt. Soc. Am. 65, 252 (1975).
16. J. P. Borgogno, B. Lazarides, and E. Pelletier, "Automatic De-termination of the Optical Constants of Inhomogeneous ThinFilms," Appl. Opt. 21, 4020 (1982).
17. J. P. Borgogno and B. Lazarides, "An Improved Method for theDetermination of the Extinction Coefficient of Thin Film Ma-terials," Thin Solid Films 102, 209 (1983).
18. E. Pelletier, P. Roche, and B. Vidal, "Determination Automatiquedes Constantes Optiques et de l'paisseur des Couches Minces:Application aux Couches Diblectriques," Nouv. Rev. Opt. 7, 353(1976).
19. J. Strong, Procedures in Experimental Physics (Prentice-Hall,Englewood Cliffs, N.J., 1963), p. 376.
20. A. Savitsky and M. J. E. Golay, "Smoothing and Differentiation
15 October 1984 / Vol. 23, No. 20 / APPLIED OPTICS 3595
of Data by Simplified Least Squares Procedures," Anal. Chem.36, 1627 (1964).
21. A. S. Valeev, "Determination of the Optical Constants of WeaklyAbsorbing Thin Films," Opt. Spectrosc. USSR 15, 269 (1963).
22. A. S. Valeev, "Constants of Thin Weakly Absorbing Lasers," Opt.Spectrosc. USSR 18,498 (1965).
23. J. E. Nestell, Jr., and R. W. Christy, "Derivation of OpticalConstants of Metals from Thin-Film Measurements at ObliqueIncidence," Appl. Opt. 11, 643 (1972).
24. C. K. Carniglia and B. Vidal, "Optical Constants of Oxidized ThinMetal Films," J. Opt. Soc. Am. 71, 1554 (1981).
25. W. E. Case, "Algebraic Method for Extracting Thin-Film OpticalParameters from Spectrophotometer Measurements," Appl. Opt.22,1832 (1983); Also, W. E. Case and M. K. Purvis, "Method forSynthesis of Optical Thin-Film Coatings on Small Computers,"J. Opt. Soc. Am. 73,1879A (1983).
26. S. Tolansky, Multiple-Beam Interferometry of Surfaces andFilms (Clarendon, Oxford, 1983).
27. J. A. Dobrowolski, F. C. Ho, and A. Waldorf, "Determination ofOptical Constants of Thin Film Coating Materials Based on In-verse Synthesis," Appl. Opt. 22, 3191 (1983).
28. J. M. Bennett, and M. J. Booty, "Computational Method forDetermining n and k for a Thin Film from the Measured Re-flectance, Transmittance, and Film Thickness," Appl. Opt. 5,41(1966).
29. M. Born and E. Wolf, Principles of Optics (Pergamon, Oxford,1983), p. 55.
30. J. C. Manifacier, J. Gasiot, and J. D. Fillard, "A Simple Methodfor the Determination of the Optical Constants nk and theThickness of a Weakly Absorbing Thin Film," J. Phys. E 9,1002(1976).
Meeting Reports continued from page 3523
of the A2 ll-X21 transition of CaOH using a single mode ringdye laser to determine accurate rotational constants which willbe employed in a microwave search for interstellar CaOH, anda tunable infrared diode laser study of Fermi and Corioloisinteractions in the CH3I vs. fundamental. Kinetics mea-surements of the potential chemical laser reaction Sn(3 pj) +N20 - SnO* + N2 by Wang Xiuyan [Luda (Darien) Instituteof Chemical Physics] and co-workers found that the Sn(3p,)spin-orbit state reacted eight times faster than the Sn(3pO,2)states. This work was performed in a high temperature fastflow reactor (HTFR) and also yielded spectroscopic constantsfor five lowest lying spectroscopic states X'+, a 32+, b, b',and Al2+. It was noted that Ar quenched the a state moreefficiently than the b state.
A paper on the laser and optical probing of the crossedmolecular beam reactions of Ba('S and 3D) with CHnCl4_ (n= 0,1,2) and C2 H6 -nCln (n = 2,3,4) was presented by DongLinna and co-workers [Luda (Darien) Institute of ChemicalPhysics]. LIF of the BaCl C2 ll 2-X2j+ system was used toprobe the BaCl X22+ product. The results indicated a verylow yield from the Ba(3D) + CC14 reaction. Chemilumines-cence spectra of CCl2(A-X) and BaCl(A 2ll,B 22;+C2jj) wereobserved in the Ba(3D) + CC14 reactions. In general, theirresults showed much lower yields of chemiluminescentproducts from reactions of Ba('S) relative to BA(3D).
Shen Zhongxin (Fudan University) reported the formationof Pt, Au, and Mo silicides by irradiating P = type Si(111)coated with 400 - 5700 A thick films of the metals (+ZrO2 ARcoating) using a Q-switched Nd:YAG laser (1.0 kW at 532 nm,50 um spot size). In work performed at EPFL Switzerland,Qiu Mingxin (Shanghai Institute of Laser Technology) usedthe 454.5, 514.5 (and 257.3) nm Ar+ lines for photo- and py-
rodeposition of Sn and Pt onto carbon or quartz surfaces. Theultimate resolution obtained was 0.2 m. In a poster paper,Li Fuming and co-workers reported the Ar+ laser enhancedetching of GaAs and Si substrates (both doped and undoped)using liquids etchants (KOHH 2SO4-H202,H 3PO4 -H20 2 ).Most of the effects were attributed to thermal mechanismswith 50 to 100 i/min etch rates. However, direct photo en-hancement was observed for GaAs/H2SO4 =H 2 02.
Harmonic generation and sum frequency mixing in an or-ganic crystal, L-arginine phosphate, was reported by Zhongheand co-workers (Institute of Crystal Materials, ShandongUniversity). The crystal has good UV transmission and largeoptical nonlinear coefficients. The SHG efficiency was 3.5times greater than that of KDP for 0.532 m radiation.
The general impression of this participant was that muchof the Chinese work presented at this conference indicatednotable progress in areas previously established in the non-Chinese literature. The research areas where the Chinesecommunity appears to be making its strongest impact is inmaterials development (particularly rare-earth containingcompounds) and low power clinical applications of lasers.
This report is reprinted from Scientific Bulletin April-June 1984, Vol. 9, No. 2, a publication of the Department ofNavy Office of Naval Research Far East and the Departmentof Air Force Office of Scientific Research Far East.
3596 APPLIED OPTICS / Vol. 23, No. 20 / 15 October 1984


![Determination of Optical Constants of Thin Films in Extreme …koreascience.or.kr/article/JAKO201309256124598.pdf · [4]. Soufli and Gullikson determined the optical constant of Si](https://static.fdocuments.in/doc/165x107/6115fd9a10edec0ccb538981/determination-of-optical-constants-of-thin-films-in-extreme-4-soufli-and-gullikson.jpg)