Multiple Child Care Arrangements and Nonstandard...
44
Nonstandard Work Schedules, Child Care Subsidies, and Child Care Arrangements Julia R. Henly, University of Chicago* Elizabeth O. Ananat, MIT Sandra K. Danziger, University of Michigan March, 2006 (Under Review) *Corresponding author. Julia R. Henly, 969 E. 60th Street, Chicago, IL 60637; 773.493.5044; [email protected]
Transcript of Multiple Child Care Arrangements and Nonstandard...
Nonstandard Work Schedules, Child Care Subsidies, and Child Care Arrangements
Julia R. Henly, University of Chicago*
Elizabeth O. Ananat, MIT
Sandra K. Danziger, University of Michigan
March, 2006
(Under Review)
*Corresponding author. Julia R. Henly, 969 E. 60th Street, Chicago, IL 60637; 773.493.5044; [email protected]

Nonstandard Work Schedules, Child Care Subsidies, and Child Care Arrangements
Nonstandard Work Schedules, Child Care Subsidies, and Child Care Arrangements
ABSTRACT
This paper examines the complexity of low-income mothers’ child care
arrangements, with attention to nonstandard job schedules and child care subsidies. Data
come from the Women’s Employment Study, a panel study of low-income mothers. Of
interest is whether nonstandard work schedules and child care subsidies are associated
with the type and amount of care families’ use. Findings demonstrate that net of other
factors, respondents who work evenings rely less on formal care, but use a significantly
greater number of care hours annually. In addition, net of other factors, subsidy receipt is
related to more formal care and a greater number of care hours annually. The robustness
of these findings is examined with fixed effects regressions using three waves of WES
data.
KEY WORDS: Nonstandard Work Schedules, Child Care Subsidies, Child Care
Arrangements
2
Nonstandard Work Schedules, Child Care Subsidies, and Child Care Arrangements
Demographic and social policy trends over the last several decades challenge
traditional approaches to managing work and family life, especially practices around
child care during working hours. Most women with children work outside the home, and
75% of children under five years of age are in non-parental care while their parents work
(Capizzano, Adams, & Sonenstein, 2000). Current social policy directed at low-income
families reflects these trends, as evidenced by the adoption of a mandatory work-based
system of cash assistance, the 1990s’ expansions to the Earned Income Tax Credit, and
the growth of government spending for child care assistance1. Child care assistance is a
key policy lever for increasing employment of low-income parents by reducing monetary
costs of nonparental care (Adams & Rohacek, 2002).
Trends that favor maternal employment also pose labor market challenges to low-
skilled working families. There has been a growth in the part-time and contingent
workforce and an increase in non-standard work schedules – jobs requiring evening,
weekend, or variable schedules (Presser, 2003; Tilly, 1996). Presser and Cox (1997) find
that many occupations forecasted to have high growth (such as cashiers, retail sales, and
home health aides) disproportionately employ low-income women with young children.
Jobs with nonstandard schedules are beneficial to some, but can interfere with family
roles and activities and complicate efforts to secure nonparental child care (Presser, 2003;
Heymann, 2000). These associations with child care and family life may mediate the
effect of nonstandard work on children’s well-being (Dunifon, Kalil & Bajracharya,
2005; Han, 2005).
Most child care research – whether concerned with the influence of child care
3

Nonstandard Work Schedules, Child Care Subsidies, and Child Care Arrangements
price on maternal employment (e.g., Blau, 2001; Kimmel, 1998) or parental decision-
making about type of care (e.g., Davis & Connelly, 2005) – focuses on the primary care
arrangement (usually the arrangement used for the most hours) of a focal child (typically
the youngest child). But national survey data demonstrate that over 40% of parents use
multiple care arrangements simultaneously (Presser, 2003; Smith, 2000). Only recently
have studies begun to examine factors associated with these “packages” of care (Henly &
Lambert, 2005; Scott, London, & Hurst, 2005; Presser, 2003), or how they change over
time (Chaudry, 2004).
In the current paper, we use data collected as part of the Women’s Employment
Study (WES) to examine the child care patterns of a random sample of low-income
mothers, attending to the full range of child care these mothers report using over the
course of a year for all children under 14 years of age. Given the growth in nonstandard
schedule jobs, we consider the influence of maternal work schedules on the types and
amount of care parents use. We reason that work schedules set the parameters for when
care is needed, and are therefore important factors in parental decision-making about
child care. Although some mothers, especially married mothers, select nonstandard jobs
to enable shared caregiving between spouses (Becker & Moen, 1999; Staines & Pleck,
1986), most “view their employment during nonstandard hours primarily as an
accommodation to labor market needs, and not as a personal preference” (p.29, Presser &
Cox, 1997).
Given the increased government role in funding child care, we also consider
whether child care subsidy use is associated with the type and amount of child care
mothers report. By reducing child care expenses, subsidies may allow parents to purchase
4

Nonstandard Work Schedules, Child Care Subsidies, and Child Care Arrangements
more care or enter the more expensive formal care market. While we do not have
measures of quality in the current study, formal care arrangements such as centers and
preschools (over relative and in-home care) have been found to foster cognitive
development and school readiness skills, especially for low-income pre-school children
(e.g., Fuller, Kagan, Caspary, & Gauthier, 2002; Zaslow, McGroder, Cave, & Mariner,
1999), and may be indicative of higher quality settings overall (Coley, Chase-Landsdale,
& Li-Grining, 2001; Kontos, Howes, Shinn, & Galinsky, 1997).
The current study has three aims: 1) to describe child care patterns among WES
respondents, taking into account the range of different child care arrangements used over
time; 2) to examine the association between nonstandard work characteristics and
different types and amounts of child care; and 3) to examine the relationship between
child care subsidy use and different types and amounts of child care.
BACKGROUND LITERATURE
Child Care Arrangements
Child care arrangements can be broadly categorized as center-based or home-
based. Center-based care includes formal programs such as nursery schools, preschools,
after school, and Head Start programs. Home-based arrangements provide care either in
the home of the caregiver or in the child’s home by a non-parental provider. Examples
can include a grandmother who watches her grandchildren in her home, an individual
who cares for her neighbor’s infant, or a family child care provider who cares for several
children. In addition to non-parental arrangements, many children are cared for by fathers
during maternal work hours.
5

Nonstandard Work Schedules, Child Care Subsidies, and Child Care Arrangements
Multiple care arrangements are used by more than 40 percent of employed
mothers. Multiple arrangements might be planful responses to parental preferences for
more than one provider, or they may instead represent “crazy quilts” (Folk & Yi, 1994)
of patchwork care (Scott, et al., 2005). Chaudry’s (2004) qualitative study of low-income
families in New York shows that children are often in multiple care arrangements
throughout the week, and they experience frequent changes in care over time as well.
The families Chaudry studied used five or more primary arrangements, and many more
supplemental arrangements, over the first 4 years of a child’s life. In the current study, we
examine patterns of child care, with particular attention to the combinations of care
mothers used for all children under 14 years of age.
Nonstandard Work and Child Care
Two-fifths of American workers work the majority of their hours outside of
daytime, weekday hours (Presser, 2003), almost thirty percent have variable start and end
times (Golden, 2001), and ten percent cannot provide a “usual” schedule because their
schedules change so frequently (Golden, 2001; 2005). Nonstandard schedules are more
common among low-skilled mothers than other groups, given their disproportionate
representation in service sector occupations that rely heavily on nonstandard scheduling
(Presser, 2003; Presser & Cox, 1997). Some mothers choose nonstandard work in order
to enable family caregiving; however, the majority report working at nonstandard times
because of labor market requirements rather than to accommodate their own preferences
(Presser, 2003). Whatever their motivations, research suggests that nonstandard workers
use different child care arrangements than standard workers.
6

Nonstandard Work Schedules, Child Care Subsidies, and Child Care Arrangements
Most formal child care programs are only open during weekday hours, close by
6pm, and have rules that require children to attend programs during scheduled times
(Illinois Action For Children, 2005; Willer, Hofferth, Kisker, Divine-Hawkins, Farquhar,
& Glantz, 1991). Licensed family child care homes may provide greater flexibility, but
are also rarely available during late evenings or weekend hours (Willer, et al., 1991;
Bromer & Henly, 2004; Touminen, 2003). Given these constraints, parents who work
nonstandard schedules may be encouraged to use unregulated, informal caregivers,
especially relatives or to rely on shared parenting arrangements (Han, 2004; Presser,
2003; Presser & Cox, 1997; Casper & O’Connell, 1998).
In fact, recent research suggests that nonstandard workers are less likely to use
center care as a primary arrangement than either relative or parent care (Han, 2004;
Presser, 2003). In one of the few longitudinal studies of the relationship, Han (2004)
observes a significant shift to center care accompanying employment shifts from
nonstandard to standard schedules, and an opposite shift from center to paternal care
arrangements when maternal employment moves from standard to nonstandard
schedules.
Nonstandard workers are also more likely than other workers to use more than
one child care arrangement (Presser, 2003; Folk & Yi, 1994). Nonstandard workers
require a more varied set of care hours than do standard workers, making it more difficult
for a single provider to cover all hours of necessary care. Informal caregivers may have
more flexibility than formal providers to cover varied hours (Coley et al., 2001), but they
have competing demands on their time as well, including their own jobs and caregiving
responsibilities (Henly & Lambert, 2005; Hogan, Hao, & Parish, 1990; Presser, 1989).
7

Nonstandard Work Schedules, Child Care Subsidies, and Child Care Arrangements
Nonstandard workers may also purchase more child care overall than standard
workers. For example, to the extent that nonstandard workers believe that center or
preschool experiences are important developmentally for their children, they may use a
formal care arrangement whether or not it serves as an employment support, and still
require additional care hours to fill their needs during work hours. In the current study we
examine whether nonstandard work is associated with more total child care hours, as well
as considering its association with the type and number of arrangements used.
Subsidy Use and Child Care
The Personal Responsibility and Work Opportunity Reconciliation Act
(PRWORA) of 1996 consolidated federal funding for child care into the Child Care and
Development Block Grant (CCDBG), and PRWORA also permitted states to draw from
Temporary Assistance to Needy Families (TANF) funds to supplement child care
spending further. States have significant flexibility in the design and implementation of
their subsidy systems (including determining eligibility criteria), although federal law
requires states to make CCDBG funds available to most legal nonparental care options
(e.g., centers, family care homes, relative and nonrelative providers).
In Michigan, the focus of the current study, CCDBG and TANF funds were
blended, and child care funding increased more than 300 percent from 1996 to 2000
(Seefeldt, Leos-Urbel, McMahon, & Snyder, 2001). Parents who meet income-eligibility
guidelines, have a child under 14 years of age, and are employed or engaged in
employment-related TANF activities are eligible for subsidies (see Danziger et al., 2004
for fuller description of Michigan’s subsidy program.)
8

Nonstandard Work Schedules, Child Care Subsidies, and Child Care Arrangements
Studies examining work incentives of child care subsidy programs have found
that child care subsidy use is related to maternal employment (Bainbridge, Meyers, &
Waldfogel, 2003; Meyers, Heintze, & Wolf, 2002), and may reduce child-care related
problems once employed (Press, Fagan, & Laughlin, 2006). Using WES data, Danziger,
Ananat, and Browning (2004) find a significant relationship between subsidy use and
both earnings and employment duration.
Less research has investigated whether and how subsidies influence parents’ child
care choices. If subsidies make higher cost arrangements more affordable, parents with
subsidies may select more expensive kinds of care, such as child care centers and
preschools. However, pressure from caseworkers to use less expensive forms of care, a
shortage of formal providers willing to accept subsidies, or subsidy levels that keep more
expensive kinds of care out of reach – would presumably limit subsidized parents’ formal
care options.
There is some evidence that subsidies may alter child care use, and move low-
income parents into the formal care market (Brooks, Risler, Hamilton, & Nackerud,
2002; Layzer & Burstein, 2005). For example, Crosby and her colleagues (2005) examine
13 experimental welfare and employment programs and find that low-income parents
who were provided expanded child care assistance were more likely to use center-based
care.
Child care subsidies may also be related to the total number of care hours parents
purchase or the number of arrangements they use, although research on these associations
is limited. By lowering expenses, child care subsidies may increase the quantity of care
parents can buy – either a greater number of hours or additional providers for children not
9

Nonstandard Work Schedules, Child Care Subsidies, and Child Care Arrangements
previously in nonparental care. A less positive scenario, which would also result in more
arrangements for subsidy users, would occur if subsidy users exited arrangements more
quickly due to short subsidy spells (Meyers, Peck, Davis, Collins, et. al, 2002; Lowe,
Weisner, & Geis, 2003). While our data do not capture duration of subsidy spells, we are
able to examine whether, over the course of a year, subsidy users report a greater number
of arrangements than nonsubsidy users.
Other associations with child care arrangements
Of central concern to this study is nonstandard work and subsidy use; however,
there are several other established correlates of child care arrangements that we take into
account in our analyses. For example, children in two parent mother-father households
are more likely to use father care and have fewer child care hours overall, whereas
children in single parent households are more likely to use relative care. Center care and
nonrelative care rates do not differ significantly across single or two parent structures
(Presser, 2003; Chaudry, 2004; Earle, Adams, & Tout, 2001). Having adults or older
children in the home is associated with an increased use of relative care and a reduced
reliance on formal care (Leibowitz, Waite, & Witsberger, 1988; Lehrer, 1983).
Education, race/ethnicity, and income also show important relationships to child
care arrangements (Johansen, et al., 1996; Floge, 1985). About one-fifth of African
American and European American preschoolers use centers, with substantially lower
rates for Latinos (Liang, Fuller, & Singer, 2000). Low-income families are more likely
than other income groups to use relative care and less likely to use center care; although
low-income parents disproportionately use Head Start and after school programs. The
limited quantity of center-based care in low-income neighborhoods may help explain the
10

Nonstandard Work Schedules, Child Care Subsidies, and Child Care Arrangements
higher rates of informal care in these communities (Fuller, et al., 2002; Gordon & Chase-
Lansdale, 2001; Queralt & Witte, 1998). The use of multiple arrangements does not
appear to vary by income or race and ethnicity (Smith, 2000; Folk & Yi, 1994).
Finally, children under 3 are less likely than preschool-aged children to attend
formal centers and to be in multiple arrangements; and more likely to be cared for by
informal providers or parents (Smith, 2000; Capizzano, et.al., 2000; Fuller, et al., 2002).
Study Hypotheses
We explore four hypotheses about the association of nonstandard work and
subsidy use with child care arrangements (net of other influences):
First, we expect that nonstandard workers will report less formal care than
standard workers, as measured by a lower proportion of all child care hours in formal
care and a reduced likelihood of reporting any formal care.
Second, we hypothesize that nonstandard workers will use more child care than
standard workers in the course of a year, as measured by a greater number of
arrangements and a greater number of child care hours.
Third, we hypothesize that subsidy users will report more formal care than
nonsubsidy users, as measured by a greater proportion of all care hours in formal care and
an increased likelihood of reporting any formal care.
Fourth, we hypothesize that subsidy users will report more child care than
nonsubsidy users, as measured by a greater number of arrangements in the last 12 months
and a greater number of child care hours.
METHODS
Data
11

Nonstandard Work Schedules, Child Care Subsidies, and Child Care Arrangements
We use data from the Women’s Employment Study (WES), a longitudinal panel
study of current and former welfare recipients in one urban Michigan county. WES
respondents were randomly selected with equal probability from an ordered list of
eligible women in February 1997. To be eligible, women had to be residents of the
county, receiving TANF as single parent cases, U.S. citizens, between the ages of 18 –
54, and either White or African American2. There are five waves of WES data, collected
between 1997 and 2003, and response rates have ranged from 86 to 93 percent at each
wave. Waves 1 and 2 collected data on child care in an incompatible fashion from the
other waves and are therefore not used in the current study (see Ananat & Phinney, 2004,
for a discussion of differences in the child care measures across WES waves). We focus
on the respondents at Waves 3 (1999; n=513), 4 (2001; n=420), and 5 (2003; n=348) who
responded to the child care module of the survey. Previous WES analyses revealed no
systematic attrition biases. For example, comparisons with administrative data on the
entire county caseload and the WES sample on numerous variables showed few
statistically significant differences across waves (Pape, 2004; Danziger, et al., 2004).
WES data are well suited for examining the complexity of child care because
information on all care arrangements in the previous 12 months for all children under 14
in the household is collected. This allows us to investigate the amount of care used across
an entire year rather than at a point in time, and to consider how care may get packaged
across a variety of arrangements.
Measures
Dependent Variables. Respondents were asked about all care arrangements during
working hours in the previous 12 months for all children under 14 in the household. For
12

Nonstandard Work Schedules, Child Care Subsidies, and Child Care Arrangements
each of six different types of arrangements, the respondent was asked to report the
number of children in care, the number of months the child(ren) was/were in the
arrangement, the number of hours per week used, the number of different places of that
type the respondent uses (or had used in the last 12 months), and whether the
arrangement was subsidized by the Michigan Family Independence Agency (the welfare
department). The nonparental care types were: 1) day care, center, nursery, or preschool
(referred to as “center care”); 2) after school program; 3) Head Start; 4) a relative; and 5)
a non-relative. The sixth care type was father care.
We constructed four composite measures of child care arrangements that serve as
the dependent variables. The first is a dichotomous indicator of any formal care in the
last year, where formal care included center, after school, or Head Start arrangements.
The any formal care measure was recalculated without Head Start for the subsidy models
because we did not expect subsidies to affect Head Start use in the same fashion as they
would other types of formal care, given that Head Start is already subsidized.
The second dependent measure addresses the degree of formal care and is
calculated as the proportion of all child care hours in the last year that were in formal
care settings. In the subsidy models, Head Start also is not included as a form of formal
care, but its use is reflected in the denominator of the degree of formal care measure.
The third and fourth dependent variables, number of hours annually and number
of arrangements annually, count the amount of child care, regardless of type, that
respondents report using in the previous 12 months. Number of hours is measured
continuously, as the total hours across all sectors and all children in the last year, and
number of arrangements is calculated trichotomously (0, 1, 2 or more). When calculating
13

Nonstandard Work Schedules, Child Care Subsidies, and Child Care Arrangements
the number of arrangements, each different arrangement is treated as a separate
arrangement, even when it is in the same sector. Thus, if someone reports her
grandmother and uncle as different providers, this would be two arrangements.
Descriptive statistics for the four dependent measures are reported in Table 1.
We created two versions of each of the four dependent measures. The first treated
all care arrangements including father care as child care. The second version treated only
nonparental arrangements as child care. For example, the total number of care hours used
in the previous year includes hours in which the child was in father care in version 1, but
excludes father care hours in version 2. Because father care is not a subsidy-eligible type
of care, only version 2 is used to test the subsidy hypotheses.
Independent Variables. We analyzed several measures that address both the
variability and timing of work schedules. First, a dichotomous measure of flexible
start/end times indicates whether the respondent has a regular time of day that she begins
and ends work (regular, varied). Second, a measure of variable hours indicates whether
the number of hours worked change from week to week (a lot, a fair amount vs. a little,
hardly at all). A third measure, some evening hours, indicates whether the respondent
reports working primarily daytime hours or at least some regular evening hours. The
nonstandard work variables were asked of respondents who were working at the time of
the survey.
The other primary independent variable measures subsidy use. Respondents were
considered receiving a child care subsidy if they reported that part or all of their child
care expenses were paid by the Michigan Family Independence Agency.
14

Nonstandard Work Schedules, Child Care Subsidies, and Child Care Arrangements
Control Variables. We include respondents’ age (under 35; 35 or older); whether
white (0) or African American (1); marital - cohabitation status (0 = no; 1 = yes); number
of adults in household; number of adult children in the household; education (less than
high school, high school degree, more than high school education); number of children
under 3 years of age, 3 to 5 years of age, 6 to 10 years of age, and 11 to 17 years of age.
In addition, we include personal mastery, a psychological resource that benefits coping
under situations of limited control, to account for psychological differences that might
relate to both independent and dependent measures (Pearlin, Lieberman, Menaghan, &
Mullan, 1981). Models also include the proportion of months employed in each year
given that child care use will be affected by amount of employment. Finally, father care
is included as a control variable in all models using version 2 of the dependent variables.
Because of concerns about endogeneity with our central study variables, we do
not include controls for wages or income. However, education is assumed to be a rough
proxy for human capital, which relates both to the jobs a respondent can get and the types
of child care she is able to arrange, while being at least pre-determined.
Analytic Strategy
First, characteristics of our sample are reported across the variables of interest at
waves 3, 4, and 5 (Table 1). Second, a comprehensive picture of the child care patterns of
respondents at Wave 4 are presented for the six types care. Of central interest is the
prevalence of the different care arrangements and the variety of ways in which they are
packaged (Table 2). To conserve space, we do not report patterns for the other waves.
Third, we run cross-sectional multivariate analyses estimating child care outcomes, using
Wave 4 data (Tables 3 and 4)3. To test hypotheses about nonstandard work, the four
15

Nonstandard Work Schedules, Child Care Subsidies, and Child Care Arrangements
measures of child care are regressed on the three measures of nonstandard work in
separate models. These models include the subsample of respondents working at the time
of the survey (n = 306), and control for all covariates described above. To test hypotheses
about subsidy use, the four measures of child care are regressed on subsidy use and the
set of covariates. These analyses are run on the subsample of subsidy eligible respondents
(n = 355)4.
Next, we estimate fixed effects models using Waves 3, 4, and 5 (Table 5) to
account for unmeasured characteristics that may bias the statistical estimates in the cross-
sectional data (see Appendix). Specifically, a respondent may have unobserved
characteristics that affect both the types of care she uses and the type of job she has (or
her subsidy use). Person fixed-effects allows us to control for everything about a
respondent that does not change over time. In these models, we also add specific
dummies for the year of each WES interview. Year effects control for the possibility that
more child care became available, the local economy experienced recession, or relative
demand for non-standard jobs or subsidies changed between WES survey waves.
Two limitations of a fixed effects estimation strategy deserve note. First, fixed
effects models do not produce effect estimates for respondents whose scheduling status
(or subsidy status) does not change across the three waves, thereby limiting the power of
these models by reducing the effective sample size substantially. Second, fixed effects
analyses cannot account for biases that are due to unmeasured characteristics that change
over time. These limitations not withstanding, fixed effects analyses provide one means
of testing the robustness of our cross-sectional multivariate findings.
RESULTS
16
Nonstandard Work Schedules, Child Care Subsidies, and Child Care Arrangements
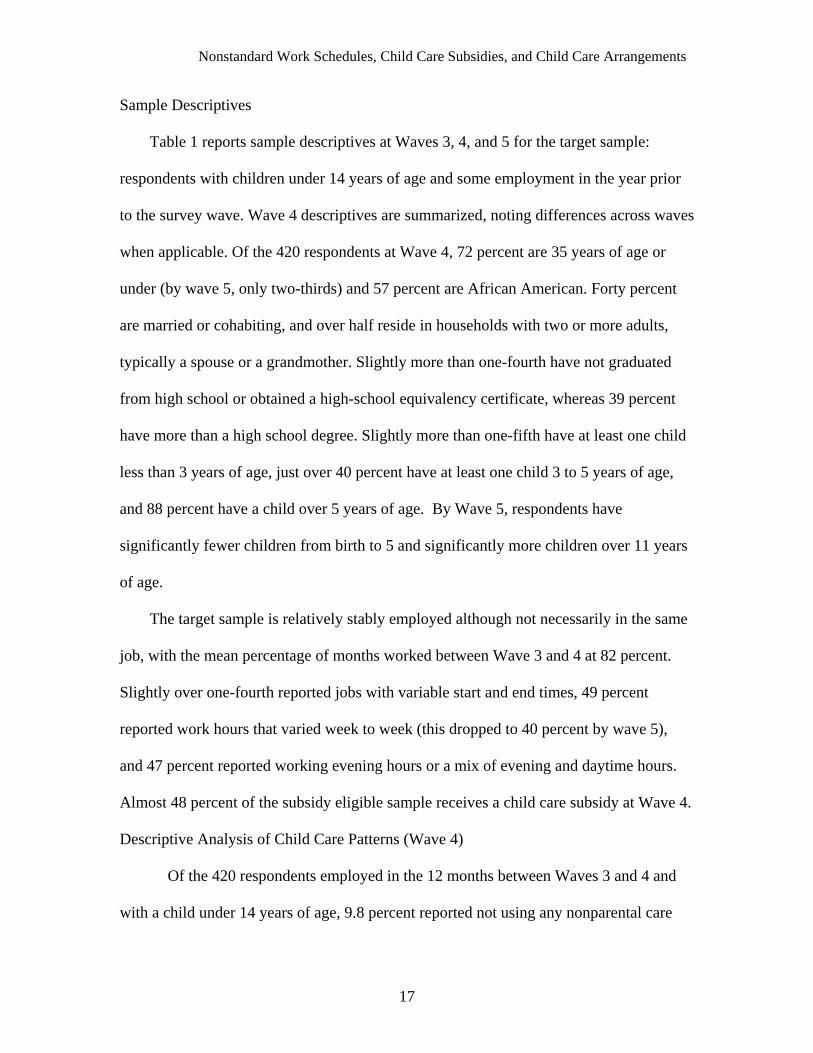
Sample Descriptives
Table 1 reports sample descriptives at Waves 3, 4, and 5 for the target sample:
respondents with children under 14 years of age and some employment in the year prior
to the survey wave. Wave 4 descriptives are summarized, noting differences across waves
when applicable. Of the 420 respondents at Wave 4, 72 percent are 35 years of age or
under (by wave 5, only two-thirds) and 57 percent are African American. Forty percent
are married or cohabiting, and over half reside in households with two or more adults,
typically a spouse or a grandmother. Slightly more than one-fourth have not graduated
from high school or obtained a high-school equivalency certificate, whereas 39 percent
have more than a high school degree. Slightly more than one-fifth have at least one child
less than 3 years of age, just over 40 percent have at least one child 3 to 5 years of age,
and 88 percent have a child over 5 years of age. By Wave 5, respondents have
significantly fewer children from birth to 5 and significantly more children over 11 years
of age.
The target sample is relatively stably employed although not necessarily in the same
job, with the mean percentage of months worked between Wave 3 and 4 at 82 percent.
Slightly over one-fourth reported jobs with variable start and end times, 49 percent
reported work hours that varied week to week (this dropped to 40 percent by wave 5),
and 47 percent reported working evening hours or a mix of evening and daytime hours.
Almost 48 percent of the subsidy eligible sample receives a child care subsidy at Wave 4.
Descriptive Analysis of Child Care Patterns (Wave 4)
Of the 420 respondents employed in the 12 months between Waves 3 and 4 and
with a child under 14 years of age, 9.8 percent reported not using any nonparental care
17

Nonstandard Work Schedules, Child Care Subsidies, and Child Care Arrangements
arrangements or father care, and 36.9 percent reported only one arrangement (Table 1).
The remainder use two (29.5 percent), three (12.6 percent), or 4 or more (11.2 percent)
arrangements. Multiple arrangements may signal that a single child is in more than one
arrangement simultaneously, that multiple children are in arrangements simultaneously,
or that arrangements are sequential, and one or multiple children has experienced
instability in care in the last 12 months. The data do not allow us to examine movement
in and out of different arrangements.
Table 2 provides information on the Wave 4 patterns of child care over the last 12
months. The first row of Table 2 demonstrates that 62.1 percent of respondents use at
least some relative care, 31 percent some father care, 21 percent some center care, 20
percent some non-relative home-based care, 8.8 percent some after-school care, and 9.3
percent a Head Start center. Center, relative, non-relative, and father care are all used for
an average of over 20 hours per week, Head Start for 14 hours per week, and after school
care for almost 10 hours per week.
Most child care users reported packaging an arrangement with at least one other
type of care over the year (row 3, Table 2). All Head Start users, and over 90 percent of
those in after school programs, reported using at least one other arrangement in the
previous 12 months. Over 80 percent of those reporting center care use an additional
arrangement, and over two-thirds of those who use relative and non-relative providers
reported at least one other arrangement. Over 80 percent of father care users also reported
another arrangement.
Row 4 of Table 2 breaks down these findings further to illustrate the specific
types of care that are packaged with each care type. The findings reveal that relative care
18

Nonstandard Work Schedules, Child Care Subsidies, and Child Care Arrangements
is not only the most common kind of care, it is also the most frequently used additional
arrangement. Even for relative users as a group, a second relative arrangement is almost
as common (41 percent) as father care (47 percent). As with past research (Capizzano &
Adams, 2000), it is less common to package formal care arrangements together than to
combine arrangements across formal and informal sectors or within the informal sector.
Cross-Sectional Nonstandard Work Models (Wave 4)
The cross-sectional analyses examine the relationship between each of the
nonstandard work measures (variable start and end times, hours that change week to
week, some evening hours) with the measures of child care (any formal care, the
proportion of child care hours in formal care, the number of child care hours, and the
number of child care arrangements). These relationships are examined, controlling for
covariates hypothesized to be important to child care use: respondent age, education,
race, cohabitation status, ages and number of children, number of adults in the household,
mastery, and proportion of months employed. The nonstandard work models are run with
both versions of the dependent variable; the version that counts father care as a type of
care is reported on Table 3.
We conduct different analyses depending on the level of measurement of the
dependent variables: a Probit for the dichotomous measure any formal care, a Tobit for
the censored variable proportion of all child care hours in formal care, an Ordinary Least
Squares regression for the continuous variable annual number of child care hours, and a
Multinomial Logit for number of arrangements, which we treat categorically (0, 1, 2 or
more)5.
19

Nonstandard Work Schedules, Child Care Subsidies, and Child Care Arrangements
For each outcome variable, the models were run separately for each of the
nonstandard work variables. However, we only report the results for models that include
evening work on Table 3 because the other two nonstandard work measures – variable
start and end times and hours change week to week – were not significant in any of the
cross-sectional models (unreported results available from authors by request).
We hypothesized that nonstandard workers would report less formal care than
standard workers, as measured by a lower proportion of all care hours in formal care and
a reduced likelihood of reporting any formal care type. Consistent with this hypothesis,
we find that respondents with some evening work are significantly less likely to use any
formal care arrangement, and a lower proportion of all their child care hours are in formal
settings, as reported in the second and third columns of Table 3 respectively.
Education and the number and age of children are related to both measures of
formal care in a consistent way. Respondents with more than a high school degree are
significantly more likely to use any formal care and reported a significantly higher
proportion of hours of formal care. Having more children between the ages of 3 to 5
years old is also significantly associated with both measures of formal care use, whereas
having more children between the ages of 11 to 17 years of age is negatively related to
formal care. These relationships are consistent with previous research.
In Hypothesis 2, we predict that nonstandard workers will use more child care
than standard workers, as measured by number of child care hours and number of
arrangements. As with the results for formal care, we find that the timing of work (some
evening hours) but not the variability of the schedule (variable start/end times and
variable hours) is associated with child care arrangements. As indicated by column 4 of
20

Nonstandard Work Schedules, Child Care Subsidies, and Child Care Arrangements
Table 3, respondents with evening hours use markedly more child care hours than do
workers with daytime-only hours (395 hours more per year, or about 8 hours more per
week). Even when the sample is restricted to the 277 respondents with at least some child
care hours, evening workers use more hours of child care than daytime workers.
We do not find support for our hypothesis that nonstandard workers use more
arrangements over the course of the year. Instead, as reported in columns 5 and 6 of
Table 3, the multinomial logit results indicate that whereas evening workers are less
likely than exclusively day workers to use no child care at all (as compared to using only
one arrangement), they are no more likely to use two or more arrangements (as compared
to one arrangement).
Several control variables are related to our measures of amount of care.
Respondents over 35 years of age, with less than a high school education, and who are
married or cohabiting use significantly fewer child care hours annually. On the other
hand, respondents use significantly more child care hours if they live with more adults,
have more children less than 3 years of age or between 3 to 5 years of age, and worked a
greater proportion of months in the last year. Regarding number of arrangements, less
educated respondents are less likely to be without child care altogether as compared to
one arrangement but no more or less likely to have two or more arrangements than one
arrangement. African Americans are less likely than Whites to have two or more
arrangements as compared to one arrangement, as are respondents with higher mastery
scores. Respondents with more children younger than 3 years of age and 3 to 5 years of
age are more likely to have two or more arrangements as compared to one arrangement,
whereas for respondents with older children the situation is reversed and multiple care
21

Nonstandard Work Schedules, Child Care Subsidies, and Child Care Arrangements
arrangements are less likely. There is not a significant relationship between no
arrangement (versus one arrangement) and the number of children younger than 3 or 3 to
5; however respondents with more children 6 to 10 are less likely to have no arrangement
at all and respondents with more children 11 to 17 are more likely to have no
arrangements at all.
The nonstandard work models were also run with the second version of the
dependent variables that excluded father care from the construction of the dependent
variable (and included it as a model covariate). The results are robust across this
alternative specification (results available from authors by request). Evening work
continues to be associated with the use of any formal care, the degree of formal care, and
the total number of child care hours. Respondents with evening work also continue to
show a greater likelihood of using only one arrangement as opposed to no arrangements,
with no reliable differences for multiple arrangements. Moreover, with this alternative
specification, we find that respondents who use father care are marginally less likely to
report formal care and they use fewer nonparental child care hours overall. However,
father care does not relate to the number of nonparental child care arrangements used.
Cross-Sectional Subsidy Models (Wave 4)
For the subsidy models, the sample is not limited to only people working at the
time of the survey but includes people who worked any time in the prior survey year.
The sample is restricted to only subsidy-eligible respondents (84.8 percent), based on the
income eligibility formula used by the Michigan Family Independence agency6. Version
two of our dependent measures is used in the subsidy models because father care is not a
subsidy-eligible child care type. In addition, Head Start is not counted as a type of formal
22

Nonstandard Work Schedules, Child Care Subsidies, and Child Care Arrangements
care in subsidy models because we would not expect Head Start, which is already
subsidized, to be affected by subsidy vouchers in the same manner as center and
afterschool care.
Table 4 reports the results of the subsidy models for the four dependent variables.
Hypothesis 3 predicts that subsidy use is related to a greater likelihood of using any
formal care (e.g., center or after school) and to a higher proportion of all child care hours
spent in formal care. As shown in columns 2 and 3 of Table 4, we find that respondents
who use a subsidy are indeed significantly more likely to use a center or after school
arrangement, and they spend a significantly greater proportion of all their child care hours
in these kinds of formal care, relative to those subsidy-eligible respondents who do not
report receiving a subsidy.
Hypothesis 4 predicts that subsidy users would report more nonparental child care
than nonsubsidy users, as measured by a greater number of nonparental child care hours
and a greater number of nonparental arrangements. As with our nonstandard work
models, our hypothesis regarding child care hours is supported. Column 4 of Table 4
shows that respondents using a subsidy report about 670 more child care hours annually
(about 13 hours per week).
To examine the relationship between subsidy use and number of arrangements,
we restricted the sample to the subset of respondents reporting at least one nonparental
arrangement (n=277), given that subsidies are not available to individuals without child
care. Thus, instead of a multinomial logit, we run an OLS regression on number of
arrangements (1, 2, 3, and 4 or more). There was not a significant relationship observed
between subsidy use and the number of arrangements. This suggests that subsidy users
23

Nonstandard Work Schedules, Child Care Subsidies, and Child Care Arrangements
may not be facing greater child care instability than nonsubsidy users, but they are also
not adding on new arrangements to accommodate summer months or multiple children.
Instead, subsidy users are apparently using more hours of care within the same number of
arrangements.
Fixed Effects Models (Waves 3, 4, and 5)
In order to account for unmeasured characteristics that may bias the statistical
estimates in the cross-sectional data, we next estimate fixed effects models (Table 5). The
fixed effects models examine the relationship between the nonstandard work and subsidy
measures with child care arrangements using Waves 4 and 5 for degree of formal care
and number of child care hours, and using Waves 3, 4, and 5 for any formal care
arrangement. Wave 3 does not include information on child care hours by type of care, so
it could not be used for any dependent measures related to hours of care. Standard errors
are clustered to account for the nonindependence of observations of a single respondent
across waves. Because these models include both year and person fixed-effects, only
changes in the independent variables that correspond to changes in the dependent
variables, independent of general change trends, determine the estimates.
Table 5 reports the results of the longitudinal analyses. For each dependent
variable, the coefficients and clustered standard errors are reported for the nonstandard
work variable and the subsidy variable (statistics for the control variables are not
included on the table). Three different models for each dependent variable are reported.
First, the bivariate model is run without additional covariates. In the second
specification, covariates that change over time (e.g., marital status, ages of children,
number of adults in the household) and the year-specific dummy variables (Waves 3, 4,
24

Nonstandard Work Schedules, Child Care Subsidies, and Child Care Arrangements
and 5) are included. The third specification is the individual fixed effects model, in which
person-specific dummies are added (in addition to control and year-specific dummies) to
control for observed and unobserved respondent differences that do not change over time.
Because the analyses continued to show no relationship between the dependent variables
and variable start/end times and hours change week to week, models with these variables
are not reported on Table 5. In addition, given that no cross-sectional relationship was
observed for multiple arrangements, only results for the remaining three dependent
variables are reported.
As reported on Table 5, we continue to observe the negative relationship between
evening work and the use of any formal care in Models 1 and 2 that we found in the
cross-sectional analyses, however the magnitude of the association decreases by about
two-thirds when individual fixed effects are considered, and the relationship is no longer
significant. Regarding the proportion of child care hours that are formal, we again find a
negative relationship between evening hours and proportion of formal care. The effect
size remains stable across the three models, however the increase in the standard error
when person dummies are included in the specification eliminates the significance of the
fixed effects estimate. Regarding amount of care, we observe a positive relationship
between total number of hours and the evening work variable in models 1 and 2, however
the effect diminishes entirely in the fixed effects models. Thus, the results of the fixed
effects analyses suggest that we cannot rule out the possibility that selection is explaining
the relationship between evening work and our child care variables.
Regarding subsidy use, we find that subsidy users continue to show a greater
likelihood of using formal care. This relationship is somewhat weaker but remains
25
Nonstandard Work Schedules, Child Care Subsidies, and Child Care Arrangements
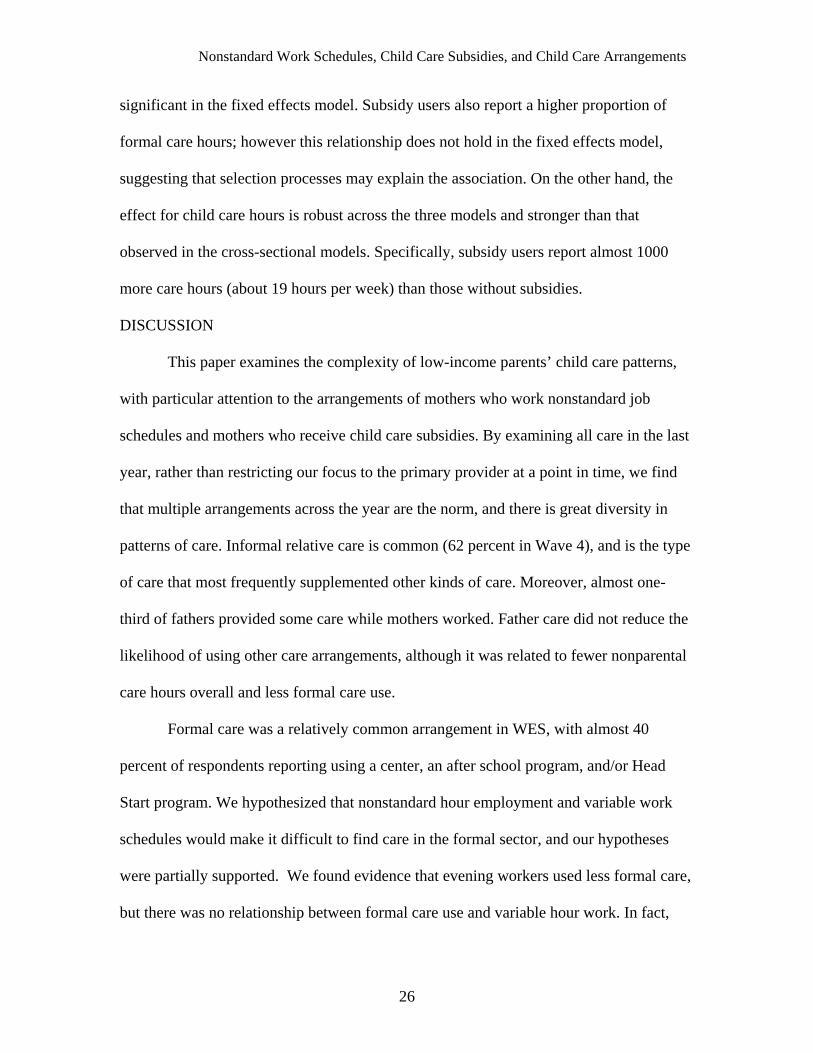
significant in the fixed effects model. Subsidy users also report a higher proportion of
formal care hours; however this relationship does not hold in the fixed effects model,
suggesting that selection processes may explain the association. On the other hand, the
effect for child care hours is robust across the three models and stronger than that
observed in the cross-sectional models. Specifically, subsidy users report almost 1000
more care hours (about 19 hours per week) than those without subsidies.
DISCUSSION
This paper examines the complexity of low-income parents’ child care patterns,
with particular attention to the arrangements of mothers who work nonstandard job
schedules and mothers who receive child care subsidies. By examining all care in the last
year, rather than restricting our focus to the primary provider at a point in time, we find
that multiple arrangements across the year are the norm, and there is great diversity in
patterns of care. Informal relative care is common (62 percent in Wave 4), and is the type
of care that most frequently supplemented other kinds of care. Moreover, almost one-
third of fathers provided some care while mothers worked. Father care did not reduce the
likelihood of using other care arrangements, although it was related to fewer nonparental
care hours overall and less formal care use.
Formal care was a relatively common arrangement in WES, with almost 40
percent of respondents reporting using a center, an after school program, and/or Head
Start program. We hypothesized that nonstandard hour employment and variable work
schedules would make it difficult to find care in the formal sector, and our hypotheses
were partially supported. We found evidence that evening workers used less formal care,
but there was no relationship between formal care use and variable hour work. In fact,
26

Nonstandard Work Schedules, Child Care Subsidies, and Child Care Arrangements
our two measures that tapped variable schedules proved unrelated to any of our
dependent measures, whereas evening work showed consistent relationships to several
outcomes.
We also expected that nonstandard schedules would lead to more hours of care
and more arrangements overall because it would be difficult to find consistent caregivers
to accommodate nonstandard work hours and because parents with evening hours might
purchase daytime formal care for developmental purposes while still requiring evening
care to meet their work needs. The results showed that evening workers did report more
care hours overall, however the relationship diminished in the fixed effects model. In
addition, although evening workers were more likely to use at least one versus no child
care arrangement, multiple arrangements were no more common for nonstandard
workers.
Our results regarding multiple arrangements are contrary to other studies (e.g.,
Presser, 2003; Folk & Yi, 1994). One possibility for our null finding might be that the
relatively narrow variance in job characteristics represented by WES respondents is
insufficient to detect the effects of nonstandard work schedules, especially given our
sample size. Research by Presser (2003) and Folk & Yi (1994) use national data sets
with a much larger range of occupational and income categories.
A second explanation for why we do not find a relationship between nonstandard
work and multiple arrangements concerns the measure of multiple arrangements itself. Its
emphasis on all care arrangements over a year for children under 14 is quite different
from other studies of multiple arrangements that are concerned with point in time
estimates. For example, the National Survey of Families and Households measures all
27

Nonstandard Work Schedules, Child Care Subsidies, and Child Care Arrangements
arrangements in the last week for children under 5 years of age. It seems plausible that
nonstandard schedules exert their influence most directly at a point in time (i.e., parents
must construct a patchwork of arrangement to fit their present work needs). While we
hypothesized that these packages of care would potentially be unstable and ultimately
result in more arrangements over the course of a year, our data do not support this
conclusion.
Regarding subsidy use, our findings suggest that the children of subsidy users are
more likely to use formal care, and this effect is robust across the different model
specifications. This evidence that subsidies may encourage formal care use is interesting
in light of recent research suggesting benefits to formal care, especially high quality
center care (e.g., Loeb, Fuller, Kagan, & Carrol, B.; 2004; NICHD, 2000) and after
school care (Chung, de Kanter, & Stonehill, 2002). We cannot determine from our data
whether the association between subsidy and formal care use is signaling changing
maternal preferences as a result of subsidies, or alternately whether subsidies are
allowing families who already desire formal care, but cannot afford it without the
subsidy, to enter the more expensive formal care market (Layzer & Burstein, 2005). This
is an important policy-relevant distinction for future research to investigate.
Subsidy users report significantly more child care hours over the course of the
year as compared to nonsubsidy users. The effect is robust to alternative model
specifications that relied on multiple waves of data and that controlled for measured and
unmeasured individual characteristics. The effect size is rather large, with subsidy users
reporting almost 1000 hours more of care per year, an additional 19 hours per week.
As with the nonstandard work models, the subsidy models did not give any
28

Nonstandard Work Schedules, Child Care Subsidies, and Child Care Arrangements
evidence that subsidy use was associated with more arrangements across the year. Thus,
we have no reason to believe that subsidy users are facing care disruptions at any greater
rate than nonsubsidy users. Our ability to model this relationship directly is limited by the
absence of information in WES on the exact dates in the last year when a respondent took
up a subsidy and the duration of subsidies. Still, this finding is an initial step toward an
understanding of the relationship between subsidy use and child care arrangements that
we hope will be pursued in future research.
Limitations
While WES data are rich in many regards, the sample is relatively small which
challenges our ability to observe reliable associations, especially in the fixed effects
models. Moreover, the time period in which questions about arrangements are asked is
the previous 12 months, making it impossible to determine whether multiple
arrangements occur simultaneously or serially. With a larger sample, it would be possible
to do subgroup analyses on respondents with only one child and only one arrangement to
compare to the broader sample. However, such subgroups are too small to produce
reliable estimates with these data.
The data also do not allow us to differentiate licensed relative and non-relative
caregivers from unlicensed ones, requiring us to treat all relative and nonrelative care as
“informal”. Yet, we know from prior research that some licensed family child care
homes have very intentional programming, are quite structured, and are run by caregivers
with formal training in child care and development (Touminen, 2003), suggesting that
some relative and non-relative arrangements might have more appropriately been
categorized as “formal”, at least in comparison to an informal babysitting relationship
29

Nonstandard Work Schedules, Child Care Subsidies, and Child Care Arrangements
provided by a grandparent or a neighbor.
The fixed effects models eliminate person-level characteristics that may bias
cross-sectional estimation techniques. As such, they serve as a test of the robustness of
the relationships observed in the cross-sectional models. While effectively addressing
selection concerns, fixed effects models do not allow us to make causal claims about the
direction of the relationships we observe. Thus, while we have demonstrated that some
within-respondent changes in nonstandard work and subsidy use are related to changes in
child care arrangements, it remains plausible that child care arrangements cause the
changes in subsidy use and/or nonstandard work status, rather than the other way around
as our conceptualization of the relationship suggests.
Conclusion
The increased labor force participation of low-income mothers has brought
benefits to many women and their families. But employment creates child care challenges
that have not been satisfactorily addressed by current public policy. The policy challenge
is to retain the advantage created by new labor market opportunities available to mothers
while reducing the burdens, dislocation, and accompanying social costs. Subsidies are an
important step toward reducing parents’ child care expenses, but many eligible families
do not receive subsidies and government funding for child care has been flat for the last
several years. Moreover, there has been limited public attention to the question of how
policy can best support the child care needs of nonstandard workers, although these
workers are becoming standard in today’s economy (Presser, 2003).
30

Nonstandard Work Schedules, Child Care Subsidies, and Child Care Arrangements
TABLES Table 1
Sample Descriptives by Wave of WES
Wave 31
(n=513)
Wave 4
(n=420)
Wave 5
(n=348)
Percentage Percentage Percentage
Controls
35 or younger 77.4 72.4 65.3**
African American 56.0 57.1 57.5
Child under 3 (% yes) 28.1 22.4 6.3**
Mean number of children under 3 (SE)
.36 (.59)
.27 (.49)
.06** (.24)
Child 3 to 5 51.8 40.8 28.7**
Mean number of children 3 to 5 (SE)
.65 (.71)
.47 (.62)
.31** (.52)
Child over 5 79.7 88.1 94.8**
Mean number of children 6 to 10 (SE)
.92 (.90)
.98 (.90)
.92 (.79)
Mean number of children 11 to 17 (SE)
.65 (.95)
.83 (1.05)
.99** (1.08)
Married or Cohabiting 35.9 40.2 38.7
Average Number of
Adults in Household
1.63 1.61 1.52+
Less than High School
Education
28.9 25.5 26.1
HS degree/GED 34.8 35.3 29.5
More than High School
Degree
36.3 39.1 44.4+
Proportion of months in
last year employed
(SE)
.774
(.306)
.817
(.274)
.794
(.284)
Nonstandard Work
Variable Start and End
Times
26.6 25.7 27.3
31

Nonstandard Work Schedules, Child Care Subsidies, and Child Care Arrangements
Hours Vary Week to
Week
49.6 48.5 40.3*
Evening or Mixed
Evening/Day hours
46.4 46.9 51.1
Subsidy
Child Care Subsidy
Eligibility
93.2 84.8 74.8**
Child Care Subsidy Use
(of eligibles)
46.0 47.8 43.3
Dependent Variables
Average Child Care
Hours in Previous
Year1
NA 1286.1 1238.2
Total Number of
Arrangements2
0 24.8 9.8 15.8
1 29.8 36.9 35.0
2 23.4 29.5 23.5
3 14.4 12.6 13.8
4 or more 7.7 11.2 11.9
Any Formal Care 40.5 38.9 41.7
Proportion of All Child
Care Hours in
Formal Care
NA .196 .186
+p<.10. *p < .05. **p < .01. Two-tailed test. Standard errors in parentheses 1No hours questions were asked in the Wave 3 child care module, so average child care hours in previous
year and proportion of all child care hours in formal care cannot be calculated for Wave 3. 2Wave 3 module does not ask about more than one arrangement of the same type (e.g., multiple relative
arrangements). Thus, for Wave 3 the number of arrangements variable measures the number of modes of
care rather than the number of types of arrangements regardless of mode, and cannot be directly compared
to distributions for the other waves.
32

Nonstandard Work Schedules, Child Care Subsidies, and Child Care Arrangements
Table 2
Wave 4 Child Care Arrangements
Center
care
After
School
Program
Head Start Relative
Care
Non-
Relative
care
Father
Care
% using at least some
of this type of
care1 (n)
21.0%
(88)
8.81%
(37)
9.3%
(39)
62.1%
(261)
20.0%
(82)
31.0%
(130)
Mean # of hours per
week, of users of
this type of care
(SE)
25.96
(14.7)
9.78
(5.32)
14.15
(7.47)
27.18
(20.73)
23.22
(16.62)
21.22
(14.92)
% using this type of
care with more
than one
arrangement (n)
80.7%
(71)
91.9%
(34)
100%
(39)
66.9%
(174)
70.7%
(58)
81.5%
(106)
Additional care is: Of the
71:
Of the
34:
Of the
39:
Of the
174:
Of the
58:
Of the
106:
Center 21.1% 38.2% 30.8% 26.4% 29.3% 21.7%
After school 18.3% 5.9% 7.7% 13.2% 13.8% 9.4%
Head Start 16.9% 8.8% 5.1% 14.4% 10.3% 21.7%
Relative 64.8% 67.7% 64.1% 41.1% 51.7% 77.4%
Non-relative 23.9% 23.5% 15.8% 17.9% 27.6% 20.2%
Father 32.4% 29.4% 59.0% 47.1% 36.2% NA
+p<.10. *p < .05. **p < .01. Two-tailed test. 1Calculations based on full sample (N = 420). Includes respondents with no arrangements
33

Nonstandard Work Schedules, Child Care Subsidies, and Child Care Arrangements
Table 3
Wave 4 Cross-Sectional Analyses: Relationship between Evening Hours Work and Dependent Measures
Number of Child Care Arrangements
(Multinomial Logit)
Any Formal Care
(Probit)
Proportion of All Child Care Hours in Formal
Care (Tobit)
Total Child Care Hours Annually
(OLS) O to 1
Arrangement 2 to 1
Arrangement Variable B (SE B) B (SE B) B (SE B) B (SE B) B (SE B)
Evening Work -0.4088* -0.4081** 394.7313** -1.2745* -0.3979 (0.174) (0.1315) (124.3651) (0.5138) (0.2776) Over 35 -0.3479 -0.0925 -452.0034** 0.7892 -0.2959 (0.2133) (0.1706) (151.2799) (0.523) (0.3395) Less than high school degree 0.0325 -0.0354 -337.3503* -1.4369+ -0.1012 (0.2386) (0.183) (164.8101) (0.7661) (0.3593) More than high school degree 0.5578** 0.4390** 44.5096 -0.1333 0.5265+ (0.1884) (0.1452) (138.1627) (0.5089) (0.3158) Married/Cohabiting -0.1137 -0.0344 -408.8209** 0.5733 0.3116 (0.224) (0.1646) (156.5904) (0.6866) (0.347) Number of adults in household -0.1511 -0.2027 263.9245* -0.3586 0.0493 (0.1796) (0.1328) (122.0108) (0.5814) (0.2648) African American 0.0181 0.1901 -51.3186 0.1031 -0.8469** (0.1691) (0.129) (124.6062) (0.5134) (0.2807 Total # of children less than 3 -0.0429 -0.0684 260.3905+ 0.3059 0.7031* (0.1886) (0.1402) (141.8622) (0.6418) (0.3362) Total # of children 3 to 5 0.7739** 0.4376** 327.5299** -0.3202 0.5516* (0.1325) (0.1091) (101.2922) (0.5153) (0.2364) Total # of children 6 to 10 -0.1578 -0.0719 10.9366 -0.6605+ -0.3332* (0.1014) (0.0749) (74.2916) (0.3464) (0.167) Total # of children 11 to 17 -0.1813+ -0.1385+ -38.4012 0.4960* -0.1931 (0.0978) (0.0779) (65.3169) (0.2193) (0.1532) Mastery Score -0.031 0.0155 -29.1139 0.0787 -0.1598** (0.0354) (0.0275) (25.7355) (0.1036) (0.061) Proportion of months worked since Wave 3 0.6169 0.0175 1,286.4794** -0.8153 0.3404 (0.4498) (0.3417) (309.6603) (1.2038) (0.7009) Observations 306 271 306 306 306 R-squared 0.23 Pseudo R-squared .19 .13 .16
+p<.10. *p < .05. **p < .01. Two-tailed test. Standard errors in parentheses
34

Nonstandard Work Schedules, Child Care Subsidies, and Child Care Arrangements
35
Table 4
Wave 4 Cross-Sectional Analyses: Relationship between Subsidy Use and Dependent Measures for
Subsidy Eligible Respondents
Any Center or After School
Care (Probit)
Proportion of All
Nonparental Hours in
Center/After School (Tobit)
Total Nonparental Child Care
Hours (OLS)
Number of Nonparental Child Care Arrangements (for subset with at
least one arrangement)
(OLS) Variable B (SE B) B (SE B) B (SE B) B (SE B)
Subsidy 0.8161** 0.6537** 669.6478** 0.0927 (0.1805) (0.1821) (110.84) (0.116) Father Care -0.1405 -0.1418 -139.3198 0.2227+ (0.1928) (0.1856) (118.0391) (0.1256) Over 35 -0.0634 0.0729 -295.2951* 0.0307 (0.2175) (0.2154) (125.524) (0.1394) Less than high school degree -0.211 -0.252 -284.6206* -0.0566 (0.2169) (0.2135) (125.1703) (0.1317) More than high school degree 0.5559** 0.5239** 173.3247 0.5001** (0.182) (0.1788) (117.2235) (0.1219) Married/Cohabiting 0.0675 0.2501 -402.5670** -0.1647 (0.2009) (0.1857) (129.0707) (0.1311) Number of adults in household 0.0692 0.0139 207.6712* 0.0266 (0.1325) (0.1241) (84.3594) (0.0863) African American -0.187 0.0295 -146.144 -0.1521 (0.1679) (0.1594) (104.928) (0.1085) Total # of children less than 3 -0.0238 -0.057 -69.4057 -0.0335 (0.1665) (0.1639) (103.4792) (0.1084) Total # of children 3 to 5 0.2877* 0.2185+ 173.7386* 0.2341* (0.128) (0.132) (84.6775) (0.0937) Total # of children 6 to 10 -0.1199 -0.092 37.1609 -0.1099+ (0.0942) (0.0905) (58.3322) (0.0634) Total # of children 11 to 17 -0.1681+ -0.1929* 15.8329 -0.0198 (0.0923) (0.0939) (50.1367) (0.0551) Mastery Score 0.0033 0.0247 -9.9551 -0.0408+ (0.0337) (0.0324) (20.3325) (0.021) Proportion of months worked since Wave 3 0.2217 -0.0534 950.9852** 0.0135 (0.3372) (0.3201) (190.1161) (0.2071) Observations 355 295 355 302 R-squared 0.31 0.17 Pseudo R-squared .17 .11
+p<.10. *p < .05. **p < .01. Two-tailed test. Standard errors in parentheses
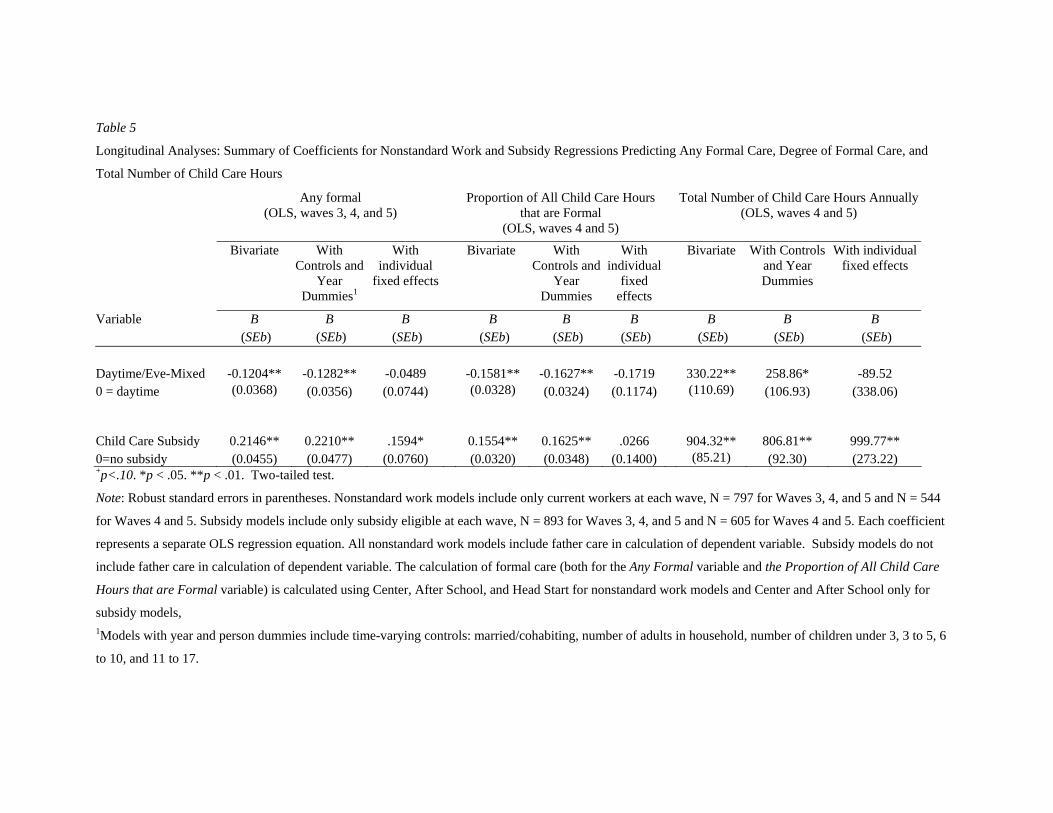
Table 5
Longitudinal Analyses: Summary of Coefficients for Nonstandard Work and Subsidy Regressions Predicting Any Formal Care, Degree of Formal Care, and
Total Number of Child Care Hours
Any formal (OLS, waves 3, 4, and 5)
Proportion of All Child Care Hours that are Formal
(OLS, waves 4 and 5)
Total Number of Child Care Hours Annually(OLS, waves 4 and 5)
Bivariate With Controls and
Year Dummies1
With individual
fixed effects
Bivariate With Controls and
Year Dummies
With individual
fixed effects
Bivariate With Controls and Year Dummies
With individual fixed effects
B B B B B B B B B Variable (SEb) (SEb) (SEb) (SEb) (SEb) (SEb) (SEb) (SEb) (SEb)
Daytime/Eve-Mixed -0.1204** -0.1282** -0.0489 -0.1581** -0.1627** -0.1719 330.22** 258.86* -89.52 0 = daytime (0.0368) (0.0356) (0.0744) (0.0328) (0.0324) (0.1174) (110.69) (106.93) (338.06)
Child Care Subsidy 0.2146** 0.2210** .1594* 0.1554** 0.1625** .0266
904.32** 806.81** 999.77** 0=no subsidy (0.0455) (0.0477) (0.0760) (0.0320) (0.0348) (0.1400) (85.21) (92.30) (273.22) +p<.10. *p < .05. **p < .01. Two-tailed test.
Note: Robust standard errors in parentheses. Nonstandard work models include only current workers at each wave, N = 797 for Waves 3, 4, and 5 and N = 544
for Waves 4 and 5. Subsidy models include only subsidy eligible at each wave, N = 893 for Waves 3, 4, and 5 and N = 605 for Waves 4 and 5. Each coefficient
represents a separate OLS regression equation. All nonstandard work models include father care in calculation of dependent variable. Subsidy models do not
include father care in calculation of dependent variable. The calculation of formal care (both for the Any Formal variable and the Proportion of All Child Care
Hours that are Formal variable) is calculated using Center, After School, and Head Start for nonstandard work models and Center and After School only for
subsidy models, 1Models with year and person dummies include time-varying controls: married/cohabiting, number of adults in household, number of children under 3, 3 to 5, 6
to 10, and 11 to 17.

Appendix
The potential for bias from OLS regression analyses is shown in Equation 1. The
child care outcome of respondent i at time t is regressed on whether the mother is
working a nonstandard schedule (or receiving a subsidy, depending on the model), as
well as a set of control variables (controlsit). The reference category is holding a standard
job (or not having a subsidy). Respondenti represents unobservable characteristics of R
that are not adjusted for in the cross-sectional analyses. If these unobservables are
correlated with both respondent’s work schedule statusit (or subsidy statusit) and her child
care arrangement (Yit), estimates will be biased. Specifically, the unmeasured
components of Respondenti would be included in the error term (εit) of Equation 1. The
error term, in turn, would be correlated with both the dependent and independent
variables, violating key assumptions of OLS analyses (Deaton, 1997).
Eq 1: Yit = αit + β1nonstandard schedule + γ1 controlsit + Respondenti + Yeart + εit
To address this concern, we use within-respondent fixed-effect regressions,
relying on repeated observations of respondents’ work schedule (or subsidy use) and the
outcomes of interest (Waves, 3, 4, and 5). Fixed effects models examine changes within
respondents over time (rather than across respondents) and measures the effect on child
care arrangements of a respondent moving from a standard to a nonstandard schedule (or
from no subsidy to a subsidy) (see Greene, 1997 or Deaton, 1997 for fuller explanation of
fixed effects models). The fixed-effects model for nonstandard work is illustrated in
Equation 2. Each variable in the equation is averaged over all assessed time points for a
specific respondent (for example, nonstandard schedulei is a mothers’ average
nonstandard schedule status across Waves 3-5). This average value is then subtracted

Nonstandard Work Schedules, Child Care Subsidies, and Child Care Arrangements
from the value at a specific time point for that respondent (nonstandard scheduleit, the
value of the nonstandard schedule variable at a specific time point). Time invariant
measures (such as respondent race) drop out of the model as do unmeasured
characteristics of respondents, including components of the error term that are correlated
over time.
Eq 2: Yit -Yi = αit - αi + β1(nonstandard scheduleit - nonstandard schedulei) + β2 (controlsit – controlsi) + εit - εi - εt
38

Nonstandard Work Schedules, Child Care Subsidies, and Child Care Arrangements
References
Adams, G. & Rohacek, M. (2002). More than a work support? Issues around integrating child development goals into the child care subsidy system. Early Childhood Research Quarterly. Vol 17(4) 2002, 418-440.
Ananat, E.O., & Phinney, R. (2004). Child care as a barrier to employment. University of Michigan. http://www.fordschool.umich.edu/research/poverty/pubs.html
Bainbridge, J., Meyers, M. & Waldfogel, J. (2003). Child care policy reform and the employment of single mothers. Social Science Quarterly, 84(4).
Becker, P. & Moen, P. (1999). Scaling Back: Dual Career Couples' Work-Family Strategies. Journal of Marriage and the Family, 61(4).
Blau, D. (2001). The Child Care Problem: An Economic Analysis. New York: Russell Sage Foundation.
Bromer, J. & Henly, J.R. (2004). Child care as family support: Caregiving practices across child care providers. Children and Youth Services Review, 26(10), 941-964.
Brooks, F., Risler, R., Hamilton, C., & Nackerud, L. (2002). Impacts of child care subsidies on family and child well-being. Early Childhood Research Quarterly, 9, 498-511.
Casper, L.M. & O’Connell, M. (1998). State estimates of organized child care facilities. Population division working paper series No.21. Bureau of the Census (DOC). Suitland, MD: Population Division.
Capizzano, J. & Adams, G. (2000). The Number of Child Care Arrangements Used by Children Under Five: Variations Across States. Series B12, Urban Institute. http://www.urban.org/url.cfm?ID=310268
Capizzano, J., Adams, G, & Sonnenstein, F. (2000). Child care arrangements for children under five: Variation across states. Assessing the new federalism. Washington, DC:Urban Institute.
Chaudry, A. (2004). Putting Children First: How Low-Wage Working Mothers Manage Child Care. New York: Russell Sage Foundation.
Chung, A., de Kanter, A.A., Stonehill, R.M. (2002). Ensuring quality and sustainability in after-school programs. In G. G. Noam and B.M. Miller (Eds). Youth Development and After-School Time: A Tale of Many Cities: New Directions for Youth Development, No. 94, Jossey-Bass.
Coley, R.L, Chase-Lansdale, P.L, & Li-Grining, C. (2001). Child care in the era of welfare reform: Quality, choices, and preferences. Policy Brief 01-04, Johns Hopkins University, Baltimore, MD.
Crosby, D., Gennetian, L., & Huston, A. (2005). Child care assistance policies can affect the use of center-based care for children in low-income families. Applied Developmental Science, 9(2), 86-106.
Danziger, S.K., Ananat, E.O., & Browning, K.G. (2004). Childcare subsidies and the transition from welfare to work. Family Relations, 53(2), 219-228.
Davis, E. E. & Connelly, R. (2005). The influence of local price and availability on parents’ choice of child care. Population Research and Policy Review, 24, 301-334.
39

Nonstandard Work Schedules, Child Care Subsidies, and Child Care Arrangements
Deaton, A. (1997). The Analysis of Household Surveys: A Microeconomic Approach to Development Policy. Johns Hopkins University Press.
Dunifon, R., Kalil, A., & Bajracharya, A. (2005). Maternal working conditions and child well-being in welfare-leaving families. Developmental Psychology, 41(6), 851-859.
Ehrle, Jennifer, Gina Adams, and Kathryn Tout. 2001. “Who’s Caring for Our Youngest Children? Child Care Patterns of Infants and Toddlers.” Assessing the New Federalism Occasional Paper no. 42. Urban Institute, Washington, DC.
Floge, L. (1985). The dynamics of child-care use and some implications for women’s employment. Journal of Marriage and the Family, 47, 143-154.
Folk, K.F., & Yi, Y. (1994) Piecing together child care with multiple arrangements: Crazy quilt or preferred pattern for employed parents of preschool children?. Journal of Marriage and the Family, 56, 669-680.
Fuller, B., Kagan, S.L., Caspary, G.L. & Gauthier, C.A. (2002). Welfare reform and child care options for low-income families. The future of children: Children and welfare reform, 12(1), 97-119.
Golden, L. (2001). Flexible Work Schedules: What are we trading to get them? Monthly Labor Review, 50-67
Golden, L. (2005). The flexibility gap: Employee access to flexibility in work schedules. In I.U. Zeytinoglu (Ed.) Flexibility in Workplaces: Effects on Workers, Work Environment and the Unions. Geneva: IIRA/ILO.
Gordon, R. & Chase-Lansdale, P.L. (2001), Availability of child care in the United States: A description and analysis of data sources. Demography, 38(2), 299-316.
Han, W.J. (2004). Nonstandard work schedules and child care decisions: Evidence from the NICHD Study of Early Child Care. Early Childhood Research Quarterly, 19(2), 231-256.
Han, W.J. (2005). Maternal nonstandard work schedules and child cognitive outcomes. Child Development, 76(1), 137-154.
Henly, J., & Lambert, S. (2005). Nonstandard work and child care needs of low-income parents. In S. Bianchi, L. Casper, & R. King (Eds.) Work, Family, Health, & Well-being. Mahwah, NJ: Lawrence Erlbaum Associates.
Henly, J.R., & Lyons, S. (2000). The negotiation of child care and employment demands among low-income parents. Journal of Social Issues, 56(4), 683-706.
Hogan, D. P., L. Hao, and W. L. Parish. 1990. Race, Kin Networks, and Assistance to Mother-headed Families. Social Forces 68(3),797-812.
Johansen, A.S., Leibowitz, A., & Waite, L.J. (1996). The importance of child-care characteristics to choice of care. Journal of Marriage and the Family, 58, 759-772.
Kimmel, J. (1998). Child Care Costs as a Barrier to Employment for Single and Married Mothers. Review of Economics and Statistics, 80 (2), pp. 287-299.
Kontos, S., Howes, C., Shinn, M., & Galinsky, E. (1997). Children’s experience in family child care and relative care as a function of family income and ethnicity. Merrill-Palmer Quarterly, 47(3), 386-403.
Layzer, J.I. & Burstein, N. (2005). Child care subsidies: Who receives them and how do they affect parents’ child care decisions? Paper presented at the 27th annual
40

Nonstandard Work Schedules, Child Care Subsidies, and Child Care Arrangements
Association for Public Policy and Management Fall Conference, Washington, DC, Nov 3-5.
Lehrer, E.L. (1983). Determinants of child care model choice: An economic perspective. Social Science Research, 12, 69-80.
Leibowitz, A., Waite, L.J., & Witsberger, C. (1988). Child care for preschoolers: Differences by child’s age. Demography, 25(2), 205-220.
Liang, X., Fuller, B., & Singer, J. (2000). Ethnic differences in child care selection: The influence of family structure, parental practices, and home language. Early Childhood Research Quarterly, 15(3): 357-384.
Long, J. S. (1997). Regression models for categorical and limited dependent variables. Thousand Oaks, CA: Sage.
Loeb, S., Fuller, B, Kagan, S.L., & Carrol, B. (2004). Child care in poor communities: Early learning effects of type, quality, and stability. Child Development, 75, 47-68.
Lowe, E.D., Weisner, T.S., Geis, S. (April, 2003). Instability in Child Care: Ethnographic Evidence from Working Poor Families in the New Hope Intervention. Working Paper Series, No. 15. MDRC.
Matthews, H. & Ewen, D. (December, 2005). Child care assistance in 2004: States have fewer funds for child care. Center for Law and Social Policy, Publication Number 05-52. http://www.clasp.org/publications.php?id=3#0.
Meyers, M.K., Heintze, T., & Wolf, D.A. (2002). Child care subsidies and the employment of welfare recipients. Demography, 35(1), 165-179.
Meyers, M.K., Peck, L.R., Davis, E.E., Collins, A., Kreader, J.L., Georges, A., Weber, R., Schexnayder, D.T., Schroeder, D.G., & Olson, J.A. (2002). The Dynamics of Child Care Subsidy Use: A Collaborative Study of Five States. New York: National Center for Children in Poverty.
Moss, P., Salzman, H., & Tilly, C. (2005). When firms restructure: Understanding work-life outcomes. In E. Kossek & S. Lambert (Eds.) Work and Life Integration: Organizational, Cultural, and Individual Perspectives. Mahwah, NJ: Lawrence Erlbaum Associates.
NICHD Early Child Care Research Network. (2000). The relation of child care to cognitive and language development. Child Development, 71, 960-980.
Pape, A. (2004). How Does Attrition Affect the Women’s Employment Study Data? Unpublished Manuscript, University of Michigan. www.fordschool.umich.edu/ research/poverty/pub_res_rep.html.
Pearlin, L.I., Lieberman, M.A., Menaghan, E.G., & Mullan, J.T. (1981). The stress process. Journal of Health and Social Behavior, 22(4), 337-56.
Press, J.E., Fagan, J., Laughlin, L. (2006). Taking pressure off families: Child-care subsidies lessen mothers’ work-hour problems. Journal of Marriage and Family, 68, 155-171.
Presser, H.B. (2003). Working in a 24/7 Economy: Challenges for American Families. New York: Russell Sage Foundation.
Presser, H.B. (1989). Can we make time for children? The economy, work schedules, and child care. Demography, 26, 523-543.
Presser, H.B. & Cox, A.G. (1997). The work schedules of low-educated American women and welfare reform. Monthly Labor Review, April, 25-34.
41

Nonstandard Work Schedules, Child Care Subsidies, and Child Care Arrangements
Queralt, M. & Witte, A.D. (1998). Influences on neighborhood supply of child care in Massachusetts. Social Service Review, 72 (1), 17-46, March 1998
Scott, E., London, A, & Hurst, A. (2005). Instability in patchworks of child care when moving from welfare to work. Journal of Marriage and Family, 67, 370-386.
Seefeldt, K.S., Leos-Urbel, J., McMahon, P., & Snyder, K. (2001). Changes to Michigan’s Welfare and Work, Child Care, and Child Welfare Systems Since 1997. Washington, D.C.: The Urban Institute.
Staines, G. & Pleck, J. (1986). Work schedule flexibility and family life. Journal of Occupational Behavior, 7, 147-153.
Smith, K. (2000). Who’s minding the kids? Child care arrangements (Current Population Reports P70-70). Washington, DC: Office of the Inspector General, U.S. Department of Health and Human Services.
Tilly, C. (1996). Half a job: Bad and good part-time jobs in a changing labor market. Philadelphia: Temple University Press.
Touminen, M. (2003). We are not babysitters: Family childcare providers redefine work and care. New Brunswick, N.J.: Rutgers University Press.
Willer, B., Hofferth, S.L., Kisker, E.E., Divine-Hawkins, P., Farquhara, E., & Glantz, F.B. (1991). The demand and supply of child care in 1990. Washington, D.C.: National Association for the Education of Young Children.
Zaslow, M.J., McGroder, S.M., Cave, G., & Mariner, C.L. (1999). Maternal employment and measures of children’s health and development among families with some history of welfare receipt. In R. Hodson & T.L. Parcel (Eds.), Research in the sociology of work: Vol.7, work and family (pp.233-259). Stanford, CT: JAI.
42
Nonstandard Work Schedules, Child Care Subsidies, and Child Care Arrangements
Endnotes Authors Note: Thanks to Robin Phinney, Shang Ha and Sarah Marsh for research assistance and Sheldon Danziger and Harold Pollack for helpful comments. Yoonsun Choi, Clif Emory, Harold Pollack, Susan Lambert, Judith Levine, and Alisa Lewin provided valuable feedback on an earlier draft presented at the 27th Annual Meetings of the Association for Public Policy Analysis and Management, Washington D.C., November 5, 2005. Support for this research was provided by the Charles Stewart Mott Foundation, Joyce Foundation, John D. and Catherine T. MacArthur Foundation, the National Institute of Mental Health (R24-MH51363), the National Institute for Child Health and Development (P50-HD38986), and the University of Michigan Office of the Vice President for Research. 1 Child care spending rose dramatically from 1996 to 2002, but federal child care spending has not increased since 2002. Thirty states reduced funding for child care programs in 2004 and fewer families received child care assistance. Still, the number of families receiving subsidized care has doubled since 1996 (Matthews & Ewen, 2004). 2 Other race/ethnic groups comprised a very small proportion of the county's caseload and would be of insufficient size to allow separate examination of these groups. 3 Because WES does not ask the child care questions of the subset of respondents who were not in the labor market in the previous year, we are unable to model child care and employment decisions jointly. Previous research suggests that the characteristics that relate to mode of care are different for non-employed and employed mothers (see Davis and Connelly, 2005). 4 In addition to the primary models, the robustness of the cross-sectional findings were also tested to slight variations in the specification of the models (e.g., different operationalizations of the dependent variables such as treating the number of child care arrangements as continuous, adjusting the measure of child care arrangements and child care hours to the number of children under 14 in the household; the addition or subtraction of control variables such as excluding number of months worked as a control variable; and making adjustments to the base sample by excluding those with no child care arrangements from the analyses). These adjustments only minimally affected our findings, and are reported only when relevant to the interpretation of study results. 5 We ran a multinomial logit instead of an orderd probit or OLS for the models predicting “number of arrangements” because we did not want to assume a linear relationship between the attributes of number of arrangements (e.g., that moves from zero, to one, to multiple arrangements were necessarily in the same direction). For example, the difference between the state of having zero arrangements and having one arrangement may reflect a difference between a negative situation (e.g., a child in self-care) and a positive situation (e.g., a child cared for by a single provider); on the other hand, we are not assuming that having more child care arrangements is necessarily better than one arrangement, given that multiple arrangements may signal provider instability rather than
43
Nonstandard Work Schedules, Child Care Subsidies, and Child Care Arrangements
parental preferences for more than one arrangement. Regarding the “any formal care” models, in addition to the probit analyses we report herein, we also ran the models within a logistic regression framework. As expected, the results are practically equivalent to the probit. We report the probit results because probit analyses can be directly compared to tobit analyses, which are appropriate for our models predicting “proportion of child care hours in formal care”. 6 We also conducted supplemental analyses on the full sample, controlling for subsidy eligibility status. No appreciable differences between the two specifications were observed, and these results are not reported. (Calculations of eligibility status and the results of subsidy models with eligibility controlled are available from authors upon request.)
44