Multinational Enterprises, International Trade, and ... · Multinational Enterprises, International...
40
WP/03/248 Multinational Enterprises, International Trade, and Productivity Growth: Firm-Level Evidence from the United States Wolfgang Keller and Stephen R. Yeaple
-
Upload
doankhuong -
Category
Documents
-
view
249 -
download
0
Transcript of Multinational Enterprises, International Trade, and ... · Multinational Enterprises, International...

WP/03/248
Multinational Enterprises, International Trade, and Productivity Growth: Firm-Level Evidence from the
United States
Wolfgang Keller and Stephen R. Yeaple
© 2003 International Monetary Fund WP/03/248
IMF Working Paper
Research Department
Multinational Enterprises, International Trade, and Productivity Growth: Firm-Level Evidence from the United States
Prepared by Wolfgang Keller and Stephen R. Yeaple1
Authorized for distribution by Raghuram Rajan
December 2003
Abstract
This Working Paper should not be reported as representing views of the IMF. The views expressed in this Working Paper are those of the author(s) and do not necessarily represent those of the IMF or IMF policy. Working Papers describe research in progress by the author(s) and are published to elicit comments and to further debate.
We estimate international technology spillovers to U.S. manufacturing firms via imports and foreign direct investment (FDI) between 1987 and 1996. In contrast to earlier work, our results suggest that FDI leads to substantial productivity gains for domestic firms. The size of FDI spillovers is economically important, accounting for about 11 percent of productivity growth in U.S. firms between 1987 and 1996. In addition, there is some evidence for import-related spillovers, but it is weaker than for FDI spillovers. The paper also gives a detailed account of why our study leads to results different from those found in previous work. This analysis indicates that our results are also likely to apply to other countries and periods. JEL Classification Numbers: F1, F2, O3
Keywords: Foreign direct investment, technology transfer, technology spillovers, international trade
Authors’ E-Mail Addresses: [email protected]; [email protected]
1 Wolfgang Keller is a resident scholar in the Trade Unit of the IMF Research Department and Associate Professor at the University of Texas. Steven Yeaple is an Associate Professor at the University of Pennsylvania. The authors would like to thank Andy Bernard, Roberto Cardarelli, Ann Harrison, Jacques Mairesse, Dani Rodrik, Marc Rysman, Carol Shiue, Matt Slaughter, Christopher Towe, and seminar audiences at Boston College, Boston University, Brown University, Columbia University, Stanford University, Syracuse University, the University of Texas, and Yale University, as well as at the Center for Economic Policy Research’s (CEPR)’s European Workshop in International Trade (ERWIT) 2002, the NBER Productivity Summer Institute 2002, and the National Bureau of Economic Research’s (NBER’s) International Trade and Investment (ITI) Spring 2003 conference for comments. We are also grateful to Wayne Gray and Bill Zeile for help with the data and useful conversations.
- 2 -
Contents Page I. Introduction..........................................................................................................................3 II. Technology Spillovers Through Trade and Foreign Direct Investment (FDI) ....................4 III. Model and Estimation Framework.......................................................................................6 IV. Data ......................................................................................................................................9 V. Empirical Analysis.............................................................................................................13 A. Olley-Pakes Production-Function Elasticities .............................................................15 B. Baseline Results ...........................................................................................................15 C. Robustness ...................................................................................................................20 D. Importance of Spillovers in Accounting for U.S. Productivity Growth ......................27 VI. What Explains the Relatively Strong FDI Spillovers Estimated in This Paper? ...............27 A. FDI Spillovers in United States ...................................................................................28 B. Estimation and Measurement Issues............................................................................28 C. Sample Composition: A Large Share of High-Technology Firms ..............................29 D. Measurement Error: FDI by Main Line of Business Versus by Activity ....................32 VII. Summary and Discussion.............................................................................................34 Appendix I. Variable Definitions, Sources, and Data Construction ........................................35 References................................................................................................................................37 Tables 1. Industry Classification of the Bureau of Economic Analysis (BEA) ................................11 2. Exposure to Imports and FDI by Aggregated BEA Industries ..........................................14 3. Olley-Pakes Input-Elasticity Estimates..............................................................................16 4. Baseline Results .................................................................................................................17 5. One-Year Versus Longer Differences ...............................................................................21 6. Controlling for Changes in Total Sales and Employment .................................................23 7. Instrumental Variables (IV) ...............................................................................................25 8. FDI and Imports, Effects by Period ...................................................................................26 9. FDI and Trade Effects in High- and Low-Technology Industries.....................................31 10. Measurement Error: FDI by Activity Versus by Main Line of Business ..........................33
- 3 -
I. INTRODUCTION
Most of the variation in living standards across countries can ultimately be traced back to differences in productivity (Hall and Jones, 1999 and Trefler, 1995). What explains these differences in productivity? Recent work shows that variation in cross-country productivity is due at least as much to foreign innovations as to domestic innovation (Eaton and Kortum, 1999 and Keller, 2002a). It suggests that to better understand cross-country variations in productivity, we may need to learn more about the international transfer of technology.
Foreign direct investment (FDI) and trade have long been suspected to be major conduits of international technology transfer. Both have grown faster than GDP recently, and foreign-owned companies now account for almost one-sixth of U.S. manufacturing GDP, for example.2 Policy prescriptions of international organizations such as the World Bank and the World Trade Organization criticize discriminatory policies toward foreign investors and exporters. And far from discriminating against foreigners, countries all over the world spend large amounts of resources to attract foreign multinationals, on the assumption that FDI leads to technology transfer and subsequent productivity gains for domestic firms. To give but one recent example: the U.S. state of Alabama has spent $230 million ($150,000 per newly created job) to attract a new Mercedes plant in 1994 (Head, 1998).3 Such large subsidies can only be justified if FDI, or imports for that matter, generate substantial positive externalities or technology spillovers for domestic firms. In this paper, we will estimate the size of spillovers associated with imports and the activities of multinational enterprise (MNE) affiliates that constitute FDI.
Notwithstanding large subsidies given to multinationals, the conventional wisdom on FDI spillovers is that they are, at best, of minor economic importance (see Section II). Our analysis revisits this view. Using a sample of about 1,300 U.S. firms for the years 1987 to 1996, we find evidence for substantial FDI spillovers: according to our preferred estimates, FDI spillovers accounted for more than 10 percent of U.S. productivity growth over this period. There is also some support for imports-related technology spillovers, but overall our evidence on imports is less conclusive.
A second contribution of this paper is that we give an account of possible reasons for our high spillover estimates relative to the large literature that has found smaller or no effects. For instance, if our different finding were due to improved estimation, it would be more likely to be a general result than if it were due to a particular sample. It appears that our
2 See Zeile (2002) and U.S. national accounts data at www.bea.gov.
3 Hanson (2001) and Görg and Greenaway (2002) discuss other major cases, as well as the broader evidence indicating that in contrast to the 1960s and 1970s, recently foreign investment has been favored relative to domestic investment. The value of the FDI incentives is typically the present discounted value of the sum of direct subsidies, e.g. in form of the publicly provided infrastructure, and tax reductions.
- 4 -
results are primarily due to improved measurement of foreign multinational activity. On this basis, we argue that our results are likely to generalize once such data are available in other circumstances as well.
The following section briefly reviews the evidence on technology spillovers associated with imports and FDI. We present our model and the estimation framework in Section III. Section IV gives an overview of the data, with more detail provided in the appendix. The main estimation results can be found in Section V, while Section VI examines why our results differ from those of the existing literature. A concluding summary and discussion are presented in Section VII.
II. TECHNOLOGY SPILLOVERS THROUGH TRADE AND FOREIGN DIRECT INVESTMENT (FDI)
Imports and inward FDI have often been emphasized as being spillover channels. Importing a technologically advanced commodity might trigger learning that enables domestic producers to manufacture a similar good at lower cost at home. Another possibility is that the price does not fully reflect the quality of the imported good, which might be due to market power on the part of the buyer or problems of appropriability for the seller.
FDI might also be associated with spillovers for domestic firms because workers that embody the knowledge of the multinational enterprise (MNE) affiliate can be attracted to domestic firms (Fosfuri, Motta, and Rønde, 2001), because multinationals give access to new specialized intermediate inputs (Rodriguez-Claré, 1996), or because domestic firms use local intermediate goods suppliers whose productivity has been raised through the know-how of the MNE. In these and other instances, it is a priori plausible that market prices do not necessarily reflect the full benefits and costs.
Several authors have recently examined the question of whether there are technological externalities associated with trade. A first set of papers has looked for international R&D spillovers driven by imports. In an influential paper, Coe and Helpman (1995) have related productivity to the import-share weighted R&D of the countries’ trade partners, estimating a positive regression coefficient. Xu and Wang (1999) have strengthened these results by focusing on machinery instead of all imports. At the same time, Keller (1998) generates almost as strong results with counterfactual instead of observed import data. This underlines that the evidence for imports-related technology spillovers on the basis of these regressions is not very strong. More recent research has sought to provide a more powerful empirical framework by employing more disaggregated data and allowing for alternative spillover channels in addition to imports. This has produced mixed results so far: for instance, Keller’s (2002b) industry-level analysis of technology spillovers among the G-7 countries finds evidence in support of imports-related effects, while Kraay, Isoalaga, and
- 5 -
Tybout (2001) in their study of firm productivity dynamics in three less developed countries do not.4
A number of methods have been employed to study FDI spillovers. There are, first of all, a number of case studies of recent large-scale FDI, and these studies have produced somewhat mixed results.5 Outside the event-study literature, an increasing number of authors have estimated FDI spillovers using data on repeated cross-sections of firms or plants. This has a number of advantages relative to cross-sectional estimation at the industry or aggregate level; for instance, it is less likely to lead to spurious results due to unobserved heterogeneity.
Among these studies, Aitken and Harrison (1999) find that an increase in the presence of foreign-owned affiliates is associated with lower productivity in a sample of Venezuelan plants in the late 1970s and 1980s. The authors attribute this result to strong competition and average cost effects—e.g., incoming foreign-owned affiliates hire the most highly skilled workers away from domestic plants—that outweigh any positive FDI spillovers that might exist. Girma and Wakelin (2001) as well as Haskel, Pereira, and Slaughter (2001) have studied inward FDI for the United Kingdom while trying to control for changes in the degree of competition to isolate FDI spillover effects. Both studies find evidence for positive FDI spillovers, although the estimated productivity effects for U.K. plants are relatively small: according to Haskel, Pereira, and Slaughter (2001), e.g., FDI spillovers account for about 5 percent of the TFP growth in British manufacturing in the two decades from 1973 to 1992.6
Summarizing, there is some evidence for import-related technology spillovers, but it is far from ubiquitous, and in particular, the evidence becomes weaker when micro data and econometrics based on an explicit behavioral model are used. With respect to FDI, there too is stronger evidence for spillovers when more aggregated data is employed. Among the panel studies based on micro data (to which this literature has gravitated), only two find statistically significant positive effects of FDI on domestic firm productivity, and these
4 Analogous to imports, other work has provided evidence on learning externalities associated with exports; it is relatively weak so far as well. See Keller (2003) for further discussion.
5 Larrain, Lopez-Calva, and Rodriguez-Claré (2000) argue that Intel’s investment in Costa Rica in 1997 generated substantial benefits for the local economy, whereas Hanson’s (2001) discussion of three other recent cases suggests spillovers are non-existent or small.
6 This discussion has focused on estimates of the magnitude of intra-industry FDI spillovers in terms of domestic productivity, which constitutes the largest and most influential literature. Another approach is to identify technology transfer by patent citations; Branstetter (2000), e.g., shows that FDI between the U.S. and Japan is associated with higher knowledge flows in terms of patent citations of U.S. and Japanese firms. Two studies emphasizing the importance of inter-industry spillovers are Blalock and Gertler (2002) as well as Kugler (2002). We will return to the question of inter-industry FDI spillovers in Section VI.
- 6 -
effects are relatively small in an economic sense. In conclusion, there is no evidence for strong positive technology spillovers associated with FDI.7
We now turn to our analysis that revisits these issues.
III. MODEL AND ESTIMATION FRAMEWORK
Since there is no consensus on the existence of strong spillovers, we take a broad view on how FDI and imports might affect the productivity of domestic firms. Instead of modeling a particular mechanism, our approach is to ask whether there is evidence for higher productivity of domestic firms in industries when there is more foreign activity in terms of FDI and imports. By and large, this is the question that has been asked so far, with the answer being non-affirmative (see Section II above).
Our analysis relies on correctly measuring firm productivity. To this end we use recent work by Ericsson and Pakes (1995) and Olley and Pakes (1996).8 These authors develop a framework for dynamic industry equilibrium analysis where firms optimally choose sales and investment, as well as entry and exit. For our purposes, two aspects of the Olley and Pakes approach are most important: first, it allows for firm-specific productivity differences that exhibit idiosyncratic changes over time, and second, the model endogenizes the firm’s liquidation decision by generating an exit rule. These features address two major concerns that have afflicted productivity calculations for a long time: simultaneity of input choice and selection biases. To see this, consider the following equation:
,0 ititkitmitlit ukmly ++++= ββββ ( 1 )
where yit is the logarithm of output of firm i at time t, and correspondingly, lit, mit, and kit are the firm’s (log of) labor, materials, and capital inputs. The last term, uit, is an error representing all disturbances that prevent (1) from holding exactly. Let this term be composed of two parts,
.itititu ηω += ( 2 )
Consider the case when neither ωit and ηit are observed by the econometrician, whereas the firm cannot observe ηit, but it does know ωit. The term ηit could be capturing unpredictable demand shocks while ωit could be firm productivity, for instance. If ωit is
7 Two recent surveys come to the same conclusion, see Hanson (2001), Görg and Greenaway (2002). See also the related paper by Griffith, Redding, and Simpson (2003). These authors find that foreign-owned firms in the U.K. contribute to the productivity convergence of U.K. establishments with the world’s productivity leaders.
8 The following introduces only the most salient features of their approach. See also Griliches and Mairesse (1995) for more discussion of the relative strengths and weaknesses of the Olley-Pakes approach.
- 7 -
known to the firm, the optimal labor input choice will be a function of ωit, and simple OLS estimation will suffer from a simultaneity bias because [ ] .0| ≠itit luE 9 If the term ωit is constant over time, ωit = ωi, all t, taking time- or within-firm differences of (1) and proceeding with OLS on the transformed data can lead to consistent parameter estimates. But in our framework, ωit is firm productivity, and how this changes in relation to imports and FDI is exactly the question we are asking. This strategy is therefore ruled out. As shown below, we will identify ωit from the firms’ investment choices. Once ωit is known, the simultaneity of input choices can be modeled and the bias avoided.
We now turn to the selection problem. The firm maximizes the expected discounted value of its future net cash flows. At the beginning of the period, the firm learns its productivity ωit, which is assumed to evolve according to an exogenous Markov process. Then, the firm makes three choices. It decides whether to exit or not, it chooses variable factors (labor and materials), and how much to invest in capital. For a sufficiently low value of ωit, a firm’s value of continuing in operation will be less than some (exogenous) liquidation value, and it will exit; call the threshold level at which a firm is indifferent between exiting and staying tω .
One can show that if the firm’s per-period profit function is increasing in k, the value function must be increasing in k as well, while tω is decreasing in k. The reason is that a firm with a larger capital stock can expect larger future returns for any given level of current productivity, so that it will remain in operation at lower realizations of ωit. Relatively small firms exit at productivity draws for which relatively large firms would have continued to operate, so that the relatively small firms that stay in the market tend to be those that received unusually favorable productivity draws. The correlation between ωit and kit is negative, and failing to account for the self-selection induced by exit behavior will lead to a negative bias in the capital coefficient. The Olley and Pakes approach generates an exit rule, so that we can account for this self-selection and avoid the associated bias.
In terms of estimation, we take the following steps. In equations (1), (2), we assume that labor and materials are variable inputs so that their choice is affected by ωit, whereas capital kit is only determined by past values of ω, not the current one. Dropping the firm subscript for ease of notation, let it be the firm’s optimal investment choice at time t.
9 The existence of this bias depends on the possibility that input choice can be varied; this explains why we use the example of labor as an input, which is generally considered to be not subject to large adjustment costs. In the multivariate case, the OLS bias can usually not be unambiguously signed. However, if labor and capital are positively correlated, and labor is more strongly correlated with ωit than capital, then OLS will tend to overestimate βl and underestimate βk.
- 8 -
Provided that ,0>ti it is possible to show that investment is strictly increasing in ωt for any kt.10 This means that the investment function can be inverted to yield
).,( tttt kih=ω ( 3 )
Substituting (3) and (2) into (1) gives
,),( tttttmtlt kimly ηφββ +++= ( 4 )
with ),(),( 0 ttttkttt kihkki ++= ββφ . Because (.)tφ contains the productivity term (.)tt h=ω that is the source of the simultaneity bias, equation (4) can be estimated to obtain consistent estimates βl and βm on the variable inputs, labor and materials. Equation (4) is a partially linear regression model of the type analyzed by Robinson (1988), and we use a fourth-order polynomial in investment and capital to capture the unknown function (.)tφ .11
With consistent estimates of βl and βm in hand, we proceed to estimating the effect of capital on output, βk, which is not identified in (4) because it is combined with capital’s effect on investment. We assume for simplicity that kt is uncorrelated with the innovation in ωt,
,1−−= ttt ωωξ or, ωt is a random walk (this can be generalized). Substituting this into (4) gives
,ˆˆˆ11 tttkttktmtlt kkmly ηξβφβββ ++−+=−− −− ( 5 )
where 1ˆ−tφ comes from estimating (4), and 11
ˆ−− − tkt kβφ is an estimate of ωt-1.
The probability of survival to period t depends on ωt-1 and `1−tω , the unobserved level of productivity that would make a firm shut down its operations, which can be shown to depend only on capital and investment at time t-1. We generate an estimate of the survival probability by running a probit regression on a fourth-order polynomial in capital and investment (lagged by one period); the estimated survival probability is denoted by tP̂ . The final step is to estimate βk from the resulting equation:
.)ˆ,ˆ(ˆˆ11 ttttkttktmtlt Pkgkmly ηξβφβββ ++−+=−− −− ( 6 )
10 The requirement that investment must be positive may be limiting for some applications. Levinsohn and Petrin (2001) propose therefore a variant of Olley and Pakes’ approach in which productivity is identified from materials inputs (which is usually greater than zero). In our sample, the zero-investment problem is negligible.
11 This includes all cross terms, and we allow this function to vary over time for the subperiods 1987–90, 1991–1993, and 1994–1996.
- 9 -
Here we approximate the unknown function g(.) by a fourth-order polynomial in 11ˆ
−− − tkt kβφ
and tP̂ ; βk is then estimated non-linearly across all terms that contain it.
Using the estimates of coefficients of labor, materials, and capital, we estimate log total factor productivity as itkitmitlitit kmlytfp βββ ˆˆˆ −−−= . This will be our baseline measure of firm productivity. We will also employ more simple productivity measures. First, a frequently used benchmark is to use industry cost shares for the unknown elasticities,
,,,, lmkvv =β which would be appropriate under perfect competition. Second, we employ a one-step OLS regression of outputs on inputs to estimate the production elasticities.
Our empirical analysis relates firms’ TFP growth, ittfp∆ , to changes in the degree of foreign activity through imports ( itIM∆ ) and FDI ( itFI∆ ) at the industry level:
,' 21 ititititit eFIIMXtfp +∆+∆+=∆ γγβ ( 7 )
where X’it is a vector of control variables, and ite is an error term; the exact definitions of
itIM∆ , itFI∆ , and X’it are discussed in the following data section.
IV. DATA
This study is based on data on an unbalanced sample of manufacturing firms in the United States from Standard and Poor’s Compustat database. Compustat includes only publicly traded companies and publishes data from the companies’ balance sheets according to legal reporting requirements. Because this might be not as good for our purposes as manufacturing census data, we have extensively cleaned the data in order to avoid biases, and the cross-industry variation in our productivity figures resembles closely that of U.S. manufacturing as a whole. Unlike census data, the Compustat database has the advantage of being publicly available. It also includes most of the larger U.S. firms, which means that- as in Griliches and Mairesse (1984), as well as Jovanovic and Rousseau (2002), e.g., we cover a major portion of all U.S. economic activity.
From Compustat, we obtain data on the firms’ (log) output y, as well as (log) labor, materials, and capital inputs (l, m, and k), where our output measure is net sales.12 Firm sales are deflated by a common deflator at the three-digit SIC level that we have constructed from the Bartelsman and Gray (2001) NBER Productivity data base, while the deflators for the capital stock come from the Bureau of Labor Statistics. Also from Compustat comes data on the firms’ R&D expenditures, which is a likely determinant of productivity; log R&D 12 Data on materials is estimated netting out capital depreciation and labor costs from cost of goods sold and administrative and selling expenses; for this and other details of the variables’ definition and construction, see the appendix.
- 10 -
expenditures are denoted by rit. Not all data is available for all firms, and we have had to fill in small amounts of missing data, typically for the firms’ capital stocks. After extensive data cleaning, our sample consists of 1,277 U.S.-owned firms that were active between the years 1987 to 1996, covering about 40 percent of U.S.-owned manufacturing employment and roughly 55 percent of U.S.-owned manufacturing research and development expenditures in the United States.13
Our primary interest is whether productivity is related to the importance of imports and foreign-owned affiliates in the firm’s relevant economic environment. We measure the importance of imports for a given firm by the share of U.S. imports in imports plus total shipments of the industry to which the firm belongs; this variable is denoted by itIM . Correspondingly, the importance of FDI is measured by the share of foreign affiliate employment in total employment of the industry to which the firm belongs (denoted by itFI ). Our analysis is at a relatively detailed, two to three-digit SIC, industry level. This is determined by the roughly 50 industries in which the U.S. Bureau of Economic Analysis (BEA), responsible for reporting U.S. FDI data, is classifying total manufacturing activity; see Table 1 for a list of the industries. For our sample period we choose the years 1987 to 1996, because before and after this period there have been changes in the BEA’s industry classification.
Data on foreign employment comes from confidential affiliate level data collected by the BEA in its annual surveys. This data is aggregated from the affiliate level to the level of the industry classification that we use. The employment figures are based on the industry classification of the activity of individual affiliate employees rather than the industry classification of the affiliate as a whole, by its mainline of business.14 The former is preferred, because it avoids the sudden shifts of a large number of employees from one industry to another industry that is associated with data on employment for the entire affiliate if the affiliate’s mainline of business changes. The imports data is obtained from Feenstra (2002), and the values for total shipments and employment by industry come from Bartelsman and Gray (2001).
13 Because large firms often span several industries, our matching of firms to industries is imperfect and introduces measurement error in our dependent variable. A different part of Compustat contains more detailed (line of business) data for sales, but unfortunately not for all inputs. Analyzing productivity at the plant instead of the firm level might help; not infrequently though, plants are operating in several industries as well. To address measurement error concerns, we conduct a wide-ranging robustness analysis.
14 An affiliate’s mainline of business is the industry in which the affiliate has the majority of its sales. In BEA's annual surveys of foreign direct investment in the United States for the years covered in this study, large affiliates were required to specify their employment (as well as sales) in the eight industries in which their employment was largest; other affiliates had to specify their employment (and sales) in the three industries in which their employment were largest.

- 11 -
Tabl
e 1.
Indu
stry
Cla
ssifi
catio
n of
the
Bur
eau
of E
cono
mic
Ana
lysi
s (B
EA)
BEA
Cod
eB
EA N
ame
BEA
Cod
eB
EA N
ame
Food
and
kin
dred
pro
duct
s Pr
imar
y m
etal
indu
stri
es
201
Mea
t pro
duct
s 33
1Fe
rrou
s 20
3Pr
eser
ved
frui
ts an
d ve
geta
bles
33
5N
onfe
rrou
s 20
4G
rain
mill
pro
duct
s 20
8B
ever
ages
Fa
bric
ated
met
al p
rodu
cts
209
Oth
er fo
od a
nd k
indr
ed p
rodu
cts
341
Met
al c
ans,
forg
ings
, and
stam
ping
s 34
2C
utle
ry, h
ardw
are,
and
scre
w p
rodu
cts
Oth
er M
anuf
actu
ring
343
Hea
ting
equi
p., p
lum
bing
and
stru
ctur
al21
0To
bacc
o 34
9M
etal
serv
ices
, ord
nanc
e, a
nd n
ec31
0Le
athe
r39
0M
iscel
lane
ous
Mac
hine
ry
351
Engi
nes a
nd tu
rbin
es
Tex
tile
and
App
arel
352
Farm
and
gar
den
220
Text
ile m
ill p
rodu
cts
353
Con
stru
ctio
n, m
inin
g, a
nd m
ater
ial h
andl
ing
230
App
arel
and
oth
er te
xtile
pro
duct
s 35
4M
etal
wor
king
355
Spec
ial i
ndus
tryW
ood
and
Furn
iture
356
Gen
eral
indu
stria
l24
0Lu
mbe
r and
woo
d pr
oduc
ts 35
7C
ompu
ter a
nd o
ffic
e eq
uip.
250
Furn
iture
and
fixt
ures
35
8R
efrig
erat
ion
and
serv
ice
indu
stry
359
Indu
stria
l mac
hine
ry, n
ec
Pape
r 26
2Pu
lp, p
aper
, and
boa
rd m
ills
Ele
ctro
nic
265
Oth
er p
aper
and
alli
ed p
rodu
cts
363
Hou
seho
ld a
pplia
nces
36
6A
udio
, vid
eo, a
nd c
omm
unic
atio
ns27
0Pr
intin
g an
d pu
blish
ing
367
Elec
troni
c co
mpo
nent
s and
acc
esso
ries
369
Elec
troni
c, n
ec
Che
mic
als a
nd a
llied
pro
duct
s 28
1In
dustr
ial c
hem
ical
s and
synt
hetic
s T
rans
port
Equ
ipim
ent
283
Dru
gs
371
Mot
or v
ehic
les
284
Soap
, cle
aner
s, an
d to
ilet g
oods
37
9O
ther
tran
spor
tatio
n28
7A
gric
ultu
ral c
hem
ical
s 28
9C
hem
ical
pro
duct
s, ne
c In
stru
men
ts38
1M
easu
ring,
scie
ntifi
c, a
nd o
ptic
alR
ubbe
r an
d Pl
astic
384
Med
ical
and
oph
thal
mic
305
Rub
ber p
rodu
cts
386
Phot
ogra
phic
equ
ipm
ent
308
Misc
ella
neou
s pla
stics
pro
duct
s
Gla
ss, S
tone
, and
Min
eral
321
Gla
ss p
rodu
cts
329
Ston
e, c
lay,
con
cret
e, e
tc
- 12 -
These measures of imports and FDI broadly capture the prevalence of foreign economic activity in a particular U.S. industry. If specialized imports are important in triggering technology spillovers, or if foreign affiliates of MNEs generate positive externalities for U.S. firms by building up more efficient supplier chains or a pool of highly skilled technicians, it is plausible that this is correlated with our measures of foreign presence in that industry.14
The Olley and Pakes method of computing firm productivity addresses the problem of simultaneity in input choices, but the endogeneity of imports or FDI could be an issue as well. For instance, FDI could be attracted to industries in which productivity is growing relatively fast on average. This would lead to a positive correlation of FDI and productivity that does not provide evidence for FDI spillovers. Alternatively, it could be that FDI is attracted to weak domestic industries to capture these markets. In that case, the correlation of cross-industry productivity growth and inward FDI might well be negative. Below we use instrumental variable estimation to address this issue; however, because our instruments for changes at the industry level are not very powerful, we present this only as one of several robustness checks.
A number of other variables will be employed to better isolate spillover effects (see the Appendix for variable construction). First, we include a variable that picks up the degree of capacity utilization (denoted as CU). For instance, the number of workers a firm hires is likely to be positively related to both hours worked as well as sales, which means that we might be overestimating the coefficient on labor if capacity utilization is not controlled for. Second, we have noted above that it is important to control for changes in the degree of market competition that might be associated with changes in foreign activity. We follow Nickell (1996) and others and use the firm’s market share in the industry as well as the firm’s mark-up and the industry mark-up to capture these effects (denoted by MS, FM, and SM, respectively). To the extent that a higher market share or a higher firm mark-up, conditional on the industry’s overall mark-up indicate less competitive pressures, we expect that a firm’s productivity growth slows down, all else equal.
There is a substantial degree of unobserved heterogeneity across firms in different industries in our sample. Productivity growth in some industries is higher than in others due to factors unrelated to imports and FDI, an example being the advances in the information technology and communications industry during our sample period. We therefore allow for exogenous differences in productivity growth across industries by including industry fixed effects, αj, in the specifications below. We also include time fixed effects, αt, in all
14 These measures will not be able to pick up externalities that are generated between major industries (vertical production specialization); however, many important buyer-supplier relationships will be within our still relatively broadly defined industry classification. Another interesting aspect that we do not cover is the spatial dimension of technology spillovers, in particular, whether they are geographically localized. Keller (2003) reviews some of the evidence.
- 13 -
regressions, because our sample period covers the 1990/91 U.S. recession. The baseline estimation equation is given by
.21
25242321
ititit
ititititittjit
FIIMSMFMMSCUrtfp
εγγ
βββββαα
+∆+∆+
++∆+∆+++=∆ −−−
( 8 )
Here, itε is a mean-zero error term, and ∆ indicates a one-year difference, so that itFI∆ , for example, is the change in the share of foreign-affiliate employment in total employment in consecutive years.
We now turn to the empirical results.
V. EMPIRICAL ANALYSIS
It is useful to analyze the main trends over the sample period by industry before discussing the regression results. There are large differences across industries. For instance, there are three industries for which the firms’ labor input is declining on average by more than 5 percent annually (Grain mill products [SIC 204], Beverages [SIC 208], and Apparel [SIC 230]), while at the same time there are four industries for which employment is growing annually by more than 5 percent per year on average (these are Drugs [SIC 283], Metal cans [SIC 341], Farm and garden machinery [SIC 352] and Specialized industry machinery [SIC 355]).
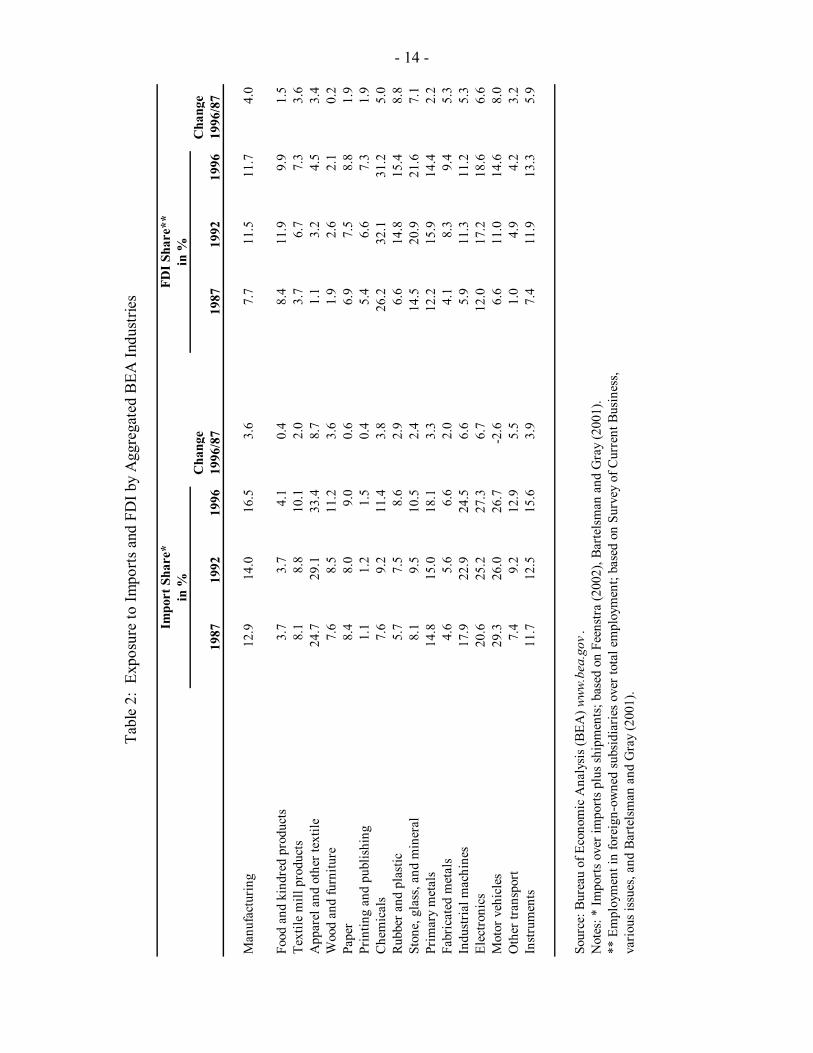
The U.S. firms in our sample have increasingly been exposed to import competition. In 1987, the average ratio of imports to imports plus shipments was 12.9 percent, while by 1996, this import share had risen to 16.5 percent. The annual growth of imports these firms were facing was almost twice as high as the growth in industry shipments. In addition, the increase in the import share has been more or less monotonic. There has been a substantial amount of variation across industries, however. Between 1987 and 1996 the import share in apparel grew by 8.7 percentage points, whereas it fell for motor vehicles by about 2.6 percentage points, as Table 2 indicates.
The share of U.S. manufacturing employment accounted for by foreign-owned affiliates has been growing over time as well, from 7.7 percent in 1987 to 11.7 percent in 1996. However, in this case, we can distinguish two separate phases of FDI dynamics. Between 1987 and 1993, FDI grew particularly strongly, from 7.7 percent to 11.6 percent. In the aftermath of the 1991 recession, however, the pace of FDI into the U.S. slowed down, and in 1996 the share was 11.7 percent.15 There were differences across industries, with FDI growing in food manufacturing by 1.5 while in motor vehicles by 8.0 percentage points. It is no accident that the industry that experienced among the largest FDI increase -motor
15 The general trend towards greater internationalization has continued, however. According to figures from the BEA and the Bureau of Labor Statistics (BLS), in the year 2000, the share of foreign employment in U.S. manufacturing was 14.4 percent; see Zeile (2002) and www.bls.gov.
- 14 -
Impo
rt S
hare
*FD
I Sha
re**
in %
in %
Cha
n ge
Cha
nge
1987
1992
1996
1996
/87
1987
1992
1996
1996
/87
Man
ufac
turin
g12
.914
.016
.53.
67.
711
.511
.74.
0
Food
and
kin
dred
pro
duct
s3.
73.
74.
10.
48.
411
.99.
91.
5Te
xtile
mill
pro
duct
s8.
18.
810
.12.
03.
76.
77.
33.
6A
ppar
el a
nd o
ther
text
ile24
.729
.133
.48.
71.
13.
24.
53.
4W
ood
and
furn
iture
7.6
8.5
11.2
3.6
1.9
2.6
2.1
0.2
Pape
r8.
48.
09.
00.
66.
97.
58.
81.
9Pr
intin
g an
d pu
blis
hing
1.1
1.2
1.5
0.4
5.4
6.6
7.3
1.9
Che
mic
als
7.6
9.2
11.4
3.8
26.2
32.1
31.2
5.0
Rubb
er a
nd p
last
ic5.
77.
58.
62.
96.
614
.815
.48.
8St
one,
gla
ss, a
nd m
iner
al8.
19.
510
.52.
414
.520
.921
.67.
1Pr
imar
y m
etal
s14
.815
.018
.13.
312
.215
.914
.42.
2Fa
bric
ated
met
als
4.6
5.6
6.6
2.0
4.1
8.3
9.4
5.3
Indu
stria
l mac
hine
s17
.922
.924
.56.
65.
911
.311
.25.
3El
ectro
nics
20.6
25.2
27.3
6.7
12.0
17.2
18.6
6.6
Mot
or v
ehic
les
29.3
26.0
26.7
-2.6
6.6
11.0
14.6
8.0
Oth
er tr
ansp
ort
7.4
9.2
12.9
5.5
1.0
4.9
4.2
3.2
Inst
rum
ents
11.7
12.5
15.6
3.9
7.4
11.9
13.3
5.9
Sour
ce: B
urea
u of
Eco
nom
ic A
naly
sis (
BEA
) www
.bea
.gov
.N
otes
: * Im
port
s ove
r im
ports
plu
s shi
pmen
ts; b
ased
on
Feen
stra
(200
2), B
arte
lsm
an a
nd G
ray
(200
1).
** E
mpl
oym
ent i
n fo
reig
n-ow
ned
subs
idia
ries o
ver t
otal
em
ploy
men
t; ba
sed
on S
urve
y of
Cur
rent
Bus
ines
s, va
rious
issu
es, a
nd B
arte
lsm
an a
nd G
ray
(200
1).
Tabl
e 2:
Exp
osur
e to
Impo
rts a
nd F
DI b
y A
ggre
gate
d B
EA In
dust
ries
- 15 -
vehicles- is also the industry where the import share has least increased: overall, the correlation in Table 2 between changes in import and FDI tends to be negative, although not significantly so.
A. Olley-Pakes Production-Function Elasticities
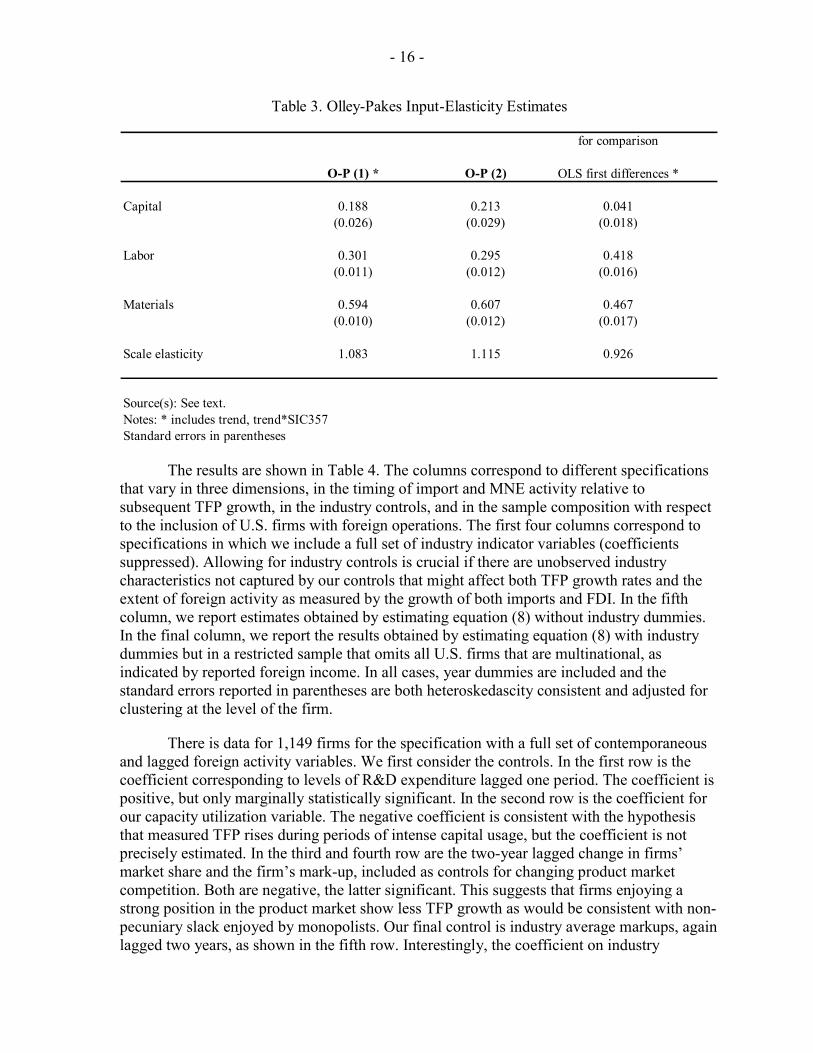
Table 3 reports the production elasticities for capital, labor, and materials that we estimate using the Olley-Pakes (O-P) method described above. We have tried several specifications that differ in the set of variables that is included as right-hand side variables in stage one, equation (4) from above, and columns 1 and 2 in Table 3 give some indication of the range of estimates that is obtained.16 In specification O-P (1), we follow Griliches and Mairesse (1995) by including a general trend and a differential trend for computers as regressors in the first stage, because the computer industry has experienced exceptionally high productivity growth over this period. The elasticities are estimated to be 0.188, 0.301, and 0.594 for capital, labor, and materials, respectively. Without the trends, the capital elasticity rises to 0.213 (see O-P (2)).
For comparison purposes, we also show the OLS estimates (in first-differences) of the elasticities. These lead to significantly lower capital and materials estimates, with 0.041 and 0.467, respectively; these results are consistent with simultaneity and exit leading to an important downward bias on the capital coefficient. Looking at the implied scale elasticities, it is 1.083 for O-P(1) and 0.926 for OLS, respectively. For this sample of industries and firms, increasing returns is a more plausible deviation from constant returns than decreasing returns to scale. Thus, the Olley-Pakes estimates seem to be preferable to the OLS coefficients, both conceptually as well as empirically, and we use the O-P(1) estimates to compute our baseline firm TFP measures.
We will also employ a number of alternative productivity measures to examine the robustness of our results based on the Olley-Pakes TFP measure.
B. Baseline Results
Turning to the regression results, we begin by estimating equation (8) using one-year differences. The benefit of using one-year differences is that we make maximum use of the time variation in our data. One aspect of this variation that is of critical interest in our analysis is the time span over which spillovers might occur. To this end, we use measures of the change in import and multinational activity that are contemporaneous and lagged one and two years. Because we may exacerbate problems of error-in-variables by relying on short-run movements, we experiment with longer time differences below.
16 These specifications differ in (1) whether we allow the investment function to vary over time or not; (2) whether we use capital investment, or capital investment plus acquisitions minus divestitures; and (3) whether we include R&D expenditures as a regressor or not.
- 16 -
for comparison
O-P (1) * O-P (2) OLS first differences *
Capital 0.188 0.213 0.041(0.026) (0.029) (0.018)
Labor 0.301 0.295 0.418(0.011) (0.012) (0.016)
Materials 0.594 0.607 0.467(0.010) (0.012) (0.017)
Scale elasticity 1.083 1.115 0.926
Source(s): See text.Notes: * includes trend, trend*SIC357 Standard errors in parentheses
Table 3. Olley-Pakes Input-Elasticity Estimates
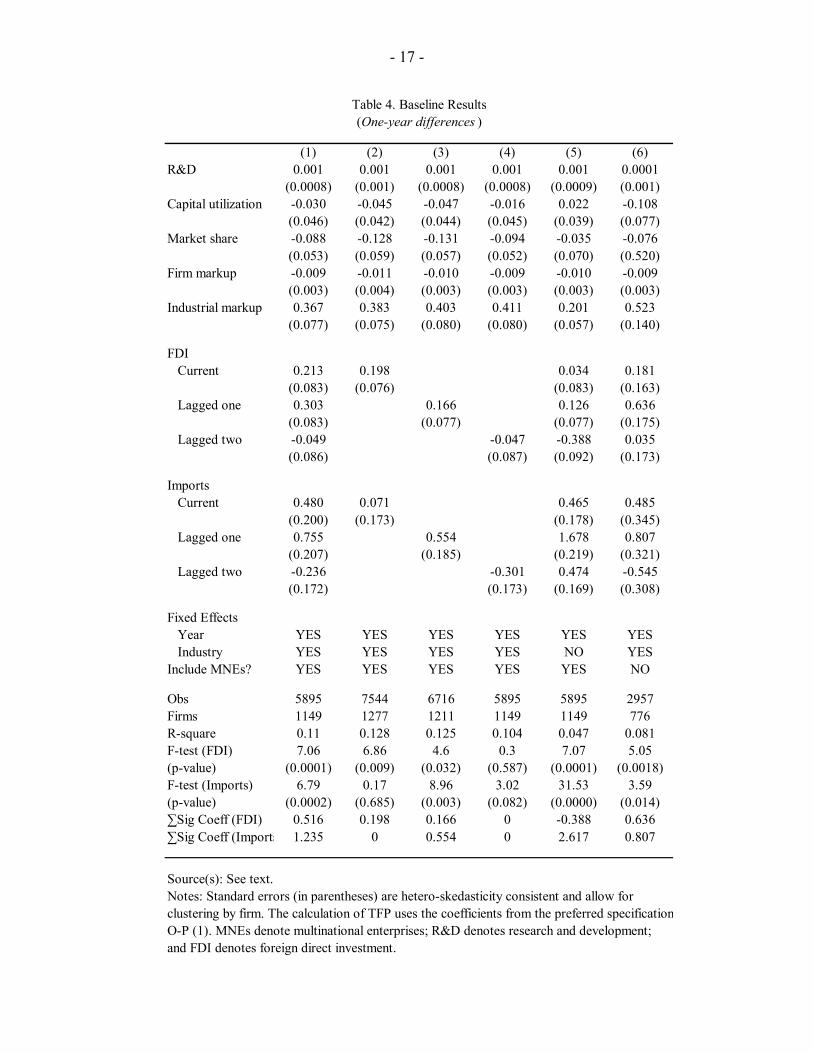
The results are shown in Table 4. The columns correspond to different specifications that vary in three dimensions, in the timing of import and MNE activity relative to subsequent TFP growth, in the industry controls, and in the sample composition with respect to the inclusion of U.S. firms with foreign operations. The first four columns correspond to specifications in which we include a full set of industry indicator variables (coefficients suppressed). Allowing for industry controls is crucial if there are unobserved industry characteristics not captured by our controls that might affect both TFP growth rates and the extent of foreign activity as measured by the growth of both imports and FDI. In the fifth column, we report estimates obtained by estimating equation (8) without industry dummies. In the final column, we report the results obtained by estimating equation (8) with industry dummies but in a restricted sample that omits all U.S. firms that are multinational, as indicated by reported foreign income. In all cases, year dummies are included and the standard errors reported in parentheses are both heteroskedascity consistent and adjusted for clustering at the level of the firm.
There is data for 1,149 firms for the specification with a full set of contemporaneous and lagged foreign activity variables. We first consider the controls. In the first row is the coefficient corresponding to levels of R&D expenditure lagged one period. The coefficient is positive, but only marginally statistically significant. In the second row is the coefficient for our capacity utilization variable. The negative coefficient is consistent with the hypothesis that measured TFP rises during periods of intense capital usage, but the coefficient is not precisely estimated. In the third and fourth row are the two-year lagged change in firms’ market share and the firm’s mark-up, included as controls for changing product market competition. Both are negative, the latter significant. This suggests that firms enjoying a strong position in the product market show less TFP growth as would be consistent with non-pecuniary slack enjoyed by monopolists. Our final control is industry average markups, again lagged two years, as shown in the fifth row. Interestingly, the coefficient on industry
- 17 -
(1) (2) (3) (4) (5) (6)R&D 0.001 0.001 0.001 0.001 0.001 0.0001
(0.0008) (0.001) (0.0008) (0.0008) (0.0009) (0.001)Capital utilization -0.030 -0.045 -0.047 -0.016 0.022 -0.108
(0.046) (0.042) (0.044) (0.045) (0.039) (0.077)Market share -0.088 -0.128 -0.131 -0.094 -0.035 -0.076
(0.053) (0.059) (0.057) (0.052) (0.070) (0.520)Firm markup -0.009 -0.011 -0.010 -0.009 -0.010 -0.009
(0.003) (0.004) (0.003) (0.003) (0.003) (0.003)Industrial markup 0.367 0.383 0.403 0.411 0.201 0.523
(0.077) (0.075) (0.080) (0.080) (0.057) (0.140)
FDI Current 0.213 0.198 0.034 0.181
(0.083) (0.076) (0.083) (0.163) Lagged one 0.303 0.166 0.126 0.636
(0.083) (0.077) (0.077) (0.175) Lagged two -0.049 -0.047 -0.388 0.035
(0.086) (0.087) (0.092) (0.173)
Imports Current 0.480 0.071 0.465 0.485
(0.200) (0.173) (0.178) (0.345) Lagged one 0.755 0.554 1.678 0.807
(0.207) (0.185) (0.219) (0.321) Lagged two -0.236 -0.301 0.474 -0.545
(0.172) (0.173) (0.169) (0.308)
Fixed Effects Year YES YES YES YES YES YES Industry YES YES YES YES NO YESInclude MNEs? YES YES YES YES YES NO
Obs 5895 7544 6716 5895 5895 2957Firms 1149 1277 1211 1149 1149 776R-square 0.11 0.128 0.125 0.104 0.047 0.081F-test (FDI) 7.06 6.86 4.6 0.3 7.07 5.05(p-value) (0.0001) (0.009) (0.032) (0.587) (0.0001) (0.0018)F-test (Imports) 6.79 0.17 8.96 3.02 31.53 3.59(p-value) (0.0002) (0.685) (0.003) (0.082) (0.0000) (0.014)∑Sig Coeff (FDI) 0.516 0.198 0.166 0 -0.388 0.636∑Sig Coeff (Imports 1.235 0 0.554 0 2.617 0.807
Source(s): See text.Notes: Standard errors (in parentheses) are hetero-skedasticity consistent and allow for clustering by firm. The calculation of TFP uses the coefficients from the preferred specificationO-P (1). MNEs denote multinational enterprises; R&D denotes research and development;and FDI denotes foreign direct investment.
Table 4. Baseline Results(One-year differences )
- 18 -
markups is positive and statistically significant, which may reflect cyclical industry effects that are not captured by our measure of capacity utilization.
Turning to the foreign activity variables, rows six through eight show the coefficients for FDI activity; this is defined as the change in the share of MNE affiliate industry employment, both contemporaneous as well as lagged. The results reveal that current and one-year lagged FDI growth is associated with faster TFP growth while two-year lagged growth is associated with slower TFP growth. Of these three coefficients only the current and one-year lagged variables are statistically significant. The F-test reported at the bottom of the table reveals that as a whole the three coefficients are statistically significant at a high level of confidence. These estimates also suggest that to the extent that there are spillovers from FDI, they have been fully reflected in domestic TFP within two years.17
Now consider the coefficients on imports shown in rows nine through eleven. A similar pattern emerges in the coefficients: the current and one-year lagged measures are positive while the two-year lagged measure is negative. Another similarity is that the three coefficients are jointly significant at high levels of confidence as indicated by the F-test at the bottom of the table. Like the two-year lagged FDI measure, the coefficient on two-year lagged imports is not statistically significant on its own. Again, the results are consistent with technology spillovers through imports that occur fairly rapidly.
To confirm our hypothesis on the timing of potential spillovers in the data, we show the results in column two through four of estimating a single measure of foreign activity at different lags. In each of these specifications, the time span of the sample varies so that the number of firms in the sample varies across columns as well. The results reported in columns two through four are highly consistent with those reported in column one despite the change in sample size. Some of the sample composition change is captured in controls such as Market Share, which changes moderately across samples. We also note that the absolute size of the coefficients on our foreign activity variables is smaller in magnitude, but their relative size and statistical significance is comparable to the results in column one.18
In column five, we report the estimates obtained by dropping the industry fixed effects to gauge the potential importance of unmeasured industry characteristics in driving both foreign activity and TFP growth. In the interest of space, we focus our discussion of these results on the FDI and imports variables. The coefficients on the current and lagged-one FDI variables are small, and the two-year lag variable becomes negative and statistically
17 That the relationship of productivity with FDI lagged twice is estimated to be so different from productivity’s relationship with FDI lagged once is consistent with our estimation capturing spillovers; if instead our estimates would pick up primarily common trends or endogeneity, it is not clear why timing would matter that much.
18 This seems in part due to the fact that the additional firms that enter the sample are primarily poorly performing firms that subsequently disappear from the sample; see more on the effects of sample composition below.
- 19 -
significant. This would suggest that the net effect of FDI as measured by the sum of the three coefficients on FDI is negative, as some earlier studies have found. In contrast, the coefficients on the import variables move in exactly the opposite direction. All three coefficients are larger now than in column one, and all coefficients are now individually statistically significant. These results suggest a very large role for imports-related spillovers in observed TFP growth in the United States. In fact, we think that these results primarily suggest that unobserved industry characteristics play an important role in both the extent of foreign activity and TFP growth, and that industry fixed effects should therefore be included.
Specifically, the result that including industry fixed effects affects the coefficients on FDI and imports in opposite directions is consistent with much of the theoretical literature on trade and FDI in which these two mechanisms for serving a distant market are generally modeled as substitutes. If this substitution were at work in our data, then we might expect FDI and imports to respond to unobserved industry characteristics in opposite directions. That unobserved industry characteristics are important in explaining cross industry TFP growth rates is clearly seen by comparing the R-squared of the two regressions. Adding the fixed effects more than doubles the R-squared, suggesting that at a minimum, fixed effects explain half the variance in the total specification. For the remainder of the paper, all reported specifications include industry indicator variables.19
So far our analyses have been conducted on a sample that contains both U.S. firms that produce exclusively in the U.S. and multinational firms that produce both in the U.S. and abroad. The benefit of including multinational firms in the dataset is that the sample will be more representative of the economy as a whole. There is a potential cost of including multinational firms in our sample, however. The sales and input data for multinational firms are often consolidated internationally and so include sales and input usages in countries other than the U.S. Since the goods and inputs deflators used in this study come exclusively from U.S. sources, this could introduce mismeasurement.20
To address this possibility, we reestimate our baseline specification on a sample that excludes all U.S. firms that report nonzero foreign income. The results, which are shown in the final column, suggest that the inclusion of multinational firms has an effect on the coefficient estimates, but there is little evidence of a systematic upward bias created by including them. In fact, the cumulative effect of changes in FDI activity, as measured by the sum of the coefficients on the contemporaneous and lagged FDI shares, on firms’ TFP appears to be somewhat larger. The other subtle difference is that the explanatory power of
19 We also experimented with a specification including industry fixed effects and industry-specific time trends. The results were similar to those obtained with industry fixed effects only.
20 For instance, the TFP calculated for multinational firms could be correlated with the real exchange rate. This is potentially problematic because the real exchange rate is likely to be correlated with both FDI and import activity, creating the possibility that our coefficient estimates are biased upward.
- 20 -
FDI share is entirely due to the variable lagged one-period once multinational firms have been removed. The cumulative effect of changes in imports into the U.S. on firms’ TFP appears to be somewhat smaller, largely due to a more negative coefficient on the two-year lagged import variable. Because multinational firms tend to be larger than their industry average, the results that the cumulative impact of FDI is now larger are consistent with FDI spillovers that have a larger effect on smaller firms.
Overall, our results so far suggest that there are technology spillovers associated with both imports and FDI. Only in the specification without industry specific fixed effects is there no evidence for positive FDI spillovers, but as we have discussed above, our results strongly suggest that industry fixed effects should be part of the specification, due to unobserved heterogeneity in TFP growth across industries that are correlated with changes in foreign activity. We think that column one is the preferred specification, with the sum of the significant point estimates of about 0.52 and 1.24 for FDI and imports, respectively. In the following, we discuss the robustness of these findings.
C. Robustness
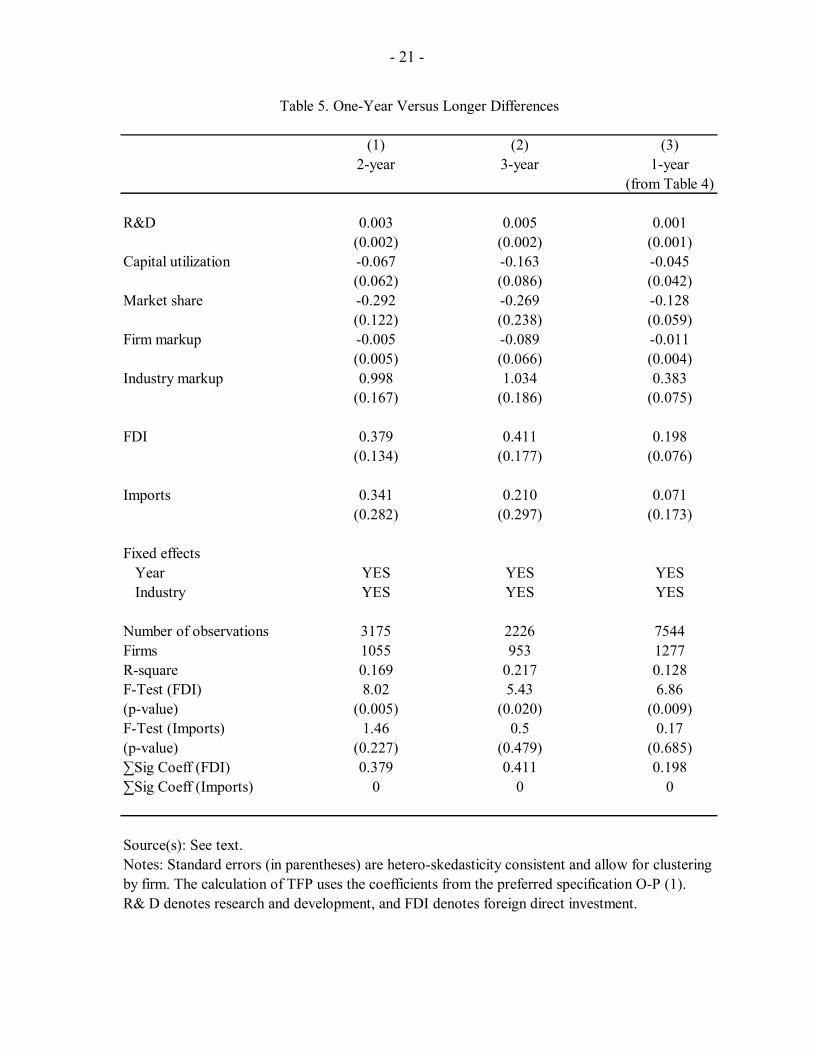
We first consider estimations with longer time differences. The benefit of considering longer time differences is that doing so will give relatively more weight to more persistent changes in the variables of interest and hence reduce the influence of noise. The cost of this is that longer time differences reduce the number of observations and the size of the sample in terms of the number of firms observed. As a compromise, we experiment with two and three-year differences but consider only the relationship between contemporaneous change of FDI and imports with firm level TFP growth since adding lags would seriously strain the time span of the data.
Table 5 shows the results. The first column corresponds to the two-year specification while the second to the three-year specification. The data corresponding to these results include the full sample.21 We now focus on the coefficients on FDI and imports. For FDI, the point estimate increases from about 0.2 to 0.4, which is consistent with the longer differences specification capturing some of the contemporaneous and lagged effects of the baseline specification (these results from Table 4, (1) are reproduced in the third column of Table 5). Also the estimates on the imports variable increase relative to the one-year specification, but an important difference is that imports are not statistically significant while FDI is. This suggests that in general, the baseline results do not seem to be driven by short-term noise in the data, while at the same time the evidence for FDI related spillovers seems stronger than for spillovers associated with imports.
21 The results obtained from the sample that excludes U.S. multinational enterprises yield qualitatively similar results, with the coefficients on FDI larger than those obtained from the full sample.
- 21 -
(1) (2) (3)2-year 3-year 1-year
(from Table 4)
R&D 0.003 0.005 0.001(0.002) (0.002) (0.001)
Capital utilization -0.067 -0.163 -0.045(0.062) (0.086) (0.042)
Market share -0.292 -0.269 -0.128(0.122) (0.238) (0.059)
Firm markup -0.005 -0.089 -0.011(0.005) (0.066) (0.004)
Industry markup 0.998 1.034 0.383(0.167) (0.186) (0.075)
FDI 0.379 0.411 0.198(0.134) (0.177) (0.076)
Imports 0.341 0.210 0.071(0.282) (0.297) (0.173)
Fixed effects Year YES YES YES Industry YES YES YES
Number of observations 3175 2226 7544Firms 1055 953 1277R-square 0.169 0.217 0.128F-Test (FDI) 8.02 5.43 6.86(p-value) (0.005) (0.020) (0.009)F-Test (Imports) 1.46 0.5 0.17(p-value) (0.227) (0.479) (0.685)∑Sig Coeff (FDI) 0.379 0.411 0.198∑Sig Coeff (Imports) 0 0 0
Source(s): See text.Notes: Standard errors (in parentheses) are hetero-skedasticity consistent and allow for clustering by firm. The calculation of TFP uses the coefficients from the preferred specification O-P (1).R& D denotes research and development, and FDI denotes foreign direct investment.
Table 5. One-Year Versus Longer Differences
- 22 -
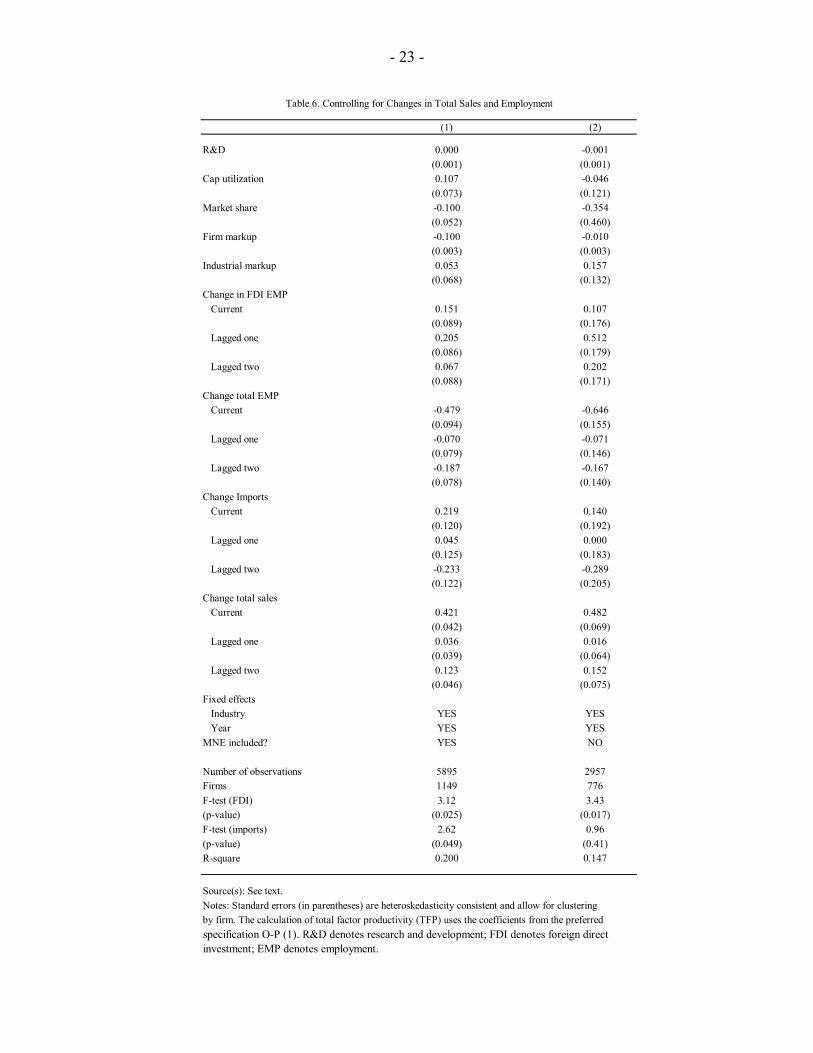
Second, an important consideration in our analysis so far is that our measures of foreign activity with respect to both FDI and imports are changes in ratios of foreign activity to total activity. At one extreme, it is possible that all of the variance in our measures of exposure to foreign activity comes purely from changes in total activity. To rule out that TFP growth is related only to total activity and not to foreign activity, we now consider a specification in which both foreign and total activity by industry is allowed to have its own effect. Our new measure of changes in multinational activity is the absolute yearly change in employment at foreign multinationals normalized by lagged total activity by industry. To gauge the effect of the change in total activity on TFP growth, we define a new variable, Total Employment. This variable is the absolute yearly change in total employment by industry normalized by lagged total employment. In effect, including this variable allows the denominator of our measure of FDI activity in the baseline specification to have an independent effect on TFP growth. Variables for real import growth and real sales growth by industry are defined analogously.
In Table 6, we report the results. Column one reports the results obtained from the full sample. As in the baseline results, FDI appears to be associated with TFP growth, and the effect appears to occur within two years. With respect to the import growth, the results are much weaker than they were in the baseline case. To the extent that there appears to be any spillover associated with imports, it occurs in the first year only. Note that increases in real sales growth are generally associated with faster TFP growth while increases in total employment are typically associated with slower TFP growth. These results are sensible when one considers that producing greater output with fewer resources is the nature of productivity growth. The results for the sample that excludes U.S. multinational enterprises are broadly as can be seen in column two.
While the actual magnitudes of the coefficients reported in Table 6 are not directly comparable to those reported in Table 4, the signs and statistical significance are comparable and turns out to be similar with respect to FDI but different with respect to imports. These results suggest that the positive relationship between FDI and TFP growth reported in Table 4 is not an artifact of the construction of our variables, while the positive relationship between imports and TFP is more suspect.
We now turn to the issue of causation. A positive partial correlation between TFP growth and foreign activity is consistent with productivity spillovers from foreign to domestic firms, but it is also consistent with foreign activity responding to productivity shocks in the United States. It is not at all clear, however, that any endogeneity basis would necessarily lead to an upward bias in our estimates of spillovers from FDI and imports since poor TFP performance by U.S. firms relative to their foreign counterparts could increase the competitiveness and hence the market share of the latter.
We require instrumental variables that are correlated with foreign activity in the United States and are not correlated with productivity growth. Moreover, the presence of industry indicators means that we need instruments that are correlated not (only) cross-sectionally but over time as well. Trade theory identifies two variables that could plausibly satisfy these requirements: shipping costs and tariffs. To this end, we construct ad valorem measures of these costs for the seven developed countries that account for almost all of FDI
- 23 -
(1) (2)
R&D 0.000 -0.001(0.001) (0.001)
Cap utilization 0.107 -0.046(0.073) (0.121)
Market share -0.100 -0.354(0.052) (0.460)
Firm markup -0.100 -0.010(0.003) (0.003)
Industrial markup 0.053 0.157(0.068) (0.132)
Change in FDI EMP Current 0.151 0.107
(0.089) (0.176) Lagged one 0.205 0.512
(0.086) (0.179) Lagged two 0.067 0.202
(0.088) (0.171)Change total EMP Current -0.479 -0.646
(0.094) (0.155) Lagged one -0.070 -0.071
(0.079) (0.146) Lagged two -0.187 -0.167
(0.078) (0.140)Change Imports Current 0.219 0.140
(0.120) (0.192) Lagged one 0.045 0.000
(0.125) (0.183) Lagged two -0.233 -0.289
(0.122) (0.205)Change total sales Current 0.421 0.482
(0.042) (0.069) Lagged one 0.036 0.016
(0.039) (0.064) Lagged two 0.123 0.152
(0.046) (0.075)Fixed effects Industry YES YES Year YES YESMNE included? YES NO
Number of observations 5895 2957Firms 1149 776F-test (FDI) 3.12 3.43(p-value) (0.025) (0.017)F-test (imports) 2.62 0.96(p-value) (0.049) (0.41)R-square 0.200 0.147
Source(s): See text.Notes: Standard errors (in parentheses) are heteroskedasticity consistent and allow for clustering by firm. The calculation of total factor productivity (TFP) uses the coefficients from the preferred specification O-P (1). R&D denotes research and development; FDI denotes foreign direct investment; EMP denotes employment.
Table 6. Controlling for Changes in Total Sales and Employment
- 24 -
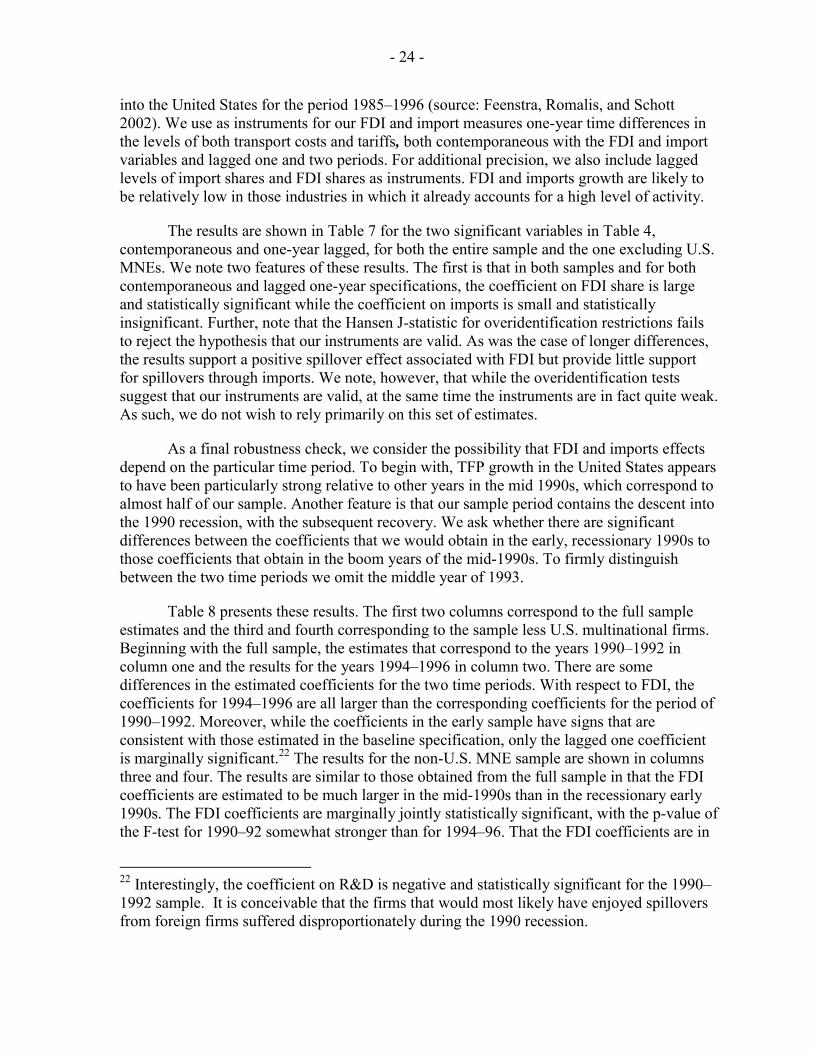
into the United States for the period 1985–1996 (source: Feenstra, Romalis, and Schott 2002). We use as instruments for our FDI and import measures one-year time differences in the levels of both transport costs and tariffs, both contemporaneous with the FDI and import variables and lagged one and two periods. For additional precision, we also include lagged levels of import shares and FDI shares as instruments. FDI and imports growth are likely to be relatively low in those industries in which it already accounts for a high level of activity.
The results are shown in Table 7 for the two significant variables in Table 4, contemporaneous and one-year lagged, for both the entire sample and the one excluding U.S. MNEs. We note two features of these results. The first is that in both samples and for both contemporaneous and lagged one-year specifications, the coefficient on FDI share is large and statistically significant while the coefficient on imports is small and statistically insignificant. Further, note that the Hansen J-statistic for overidentification restrictions fails to reject the hypothesis that our instruments are valid. As was the case of longer differences, the results support a positive spillover effect associated with FDI but provide little support for spillovers through imports. We note, however, that while the overidentification tests suggest that our instruments are valid, at the same time the instruments are in fact quite weak. As such, we do not wish to rely primarily on this set of estimates.
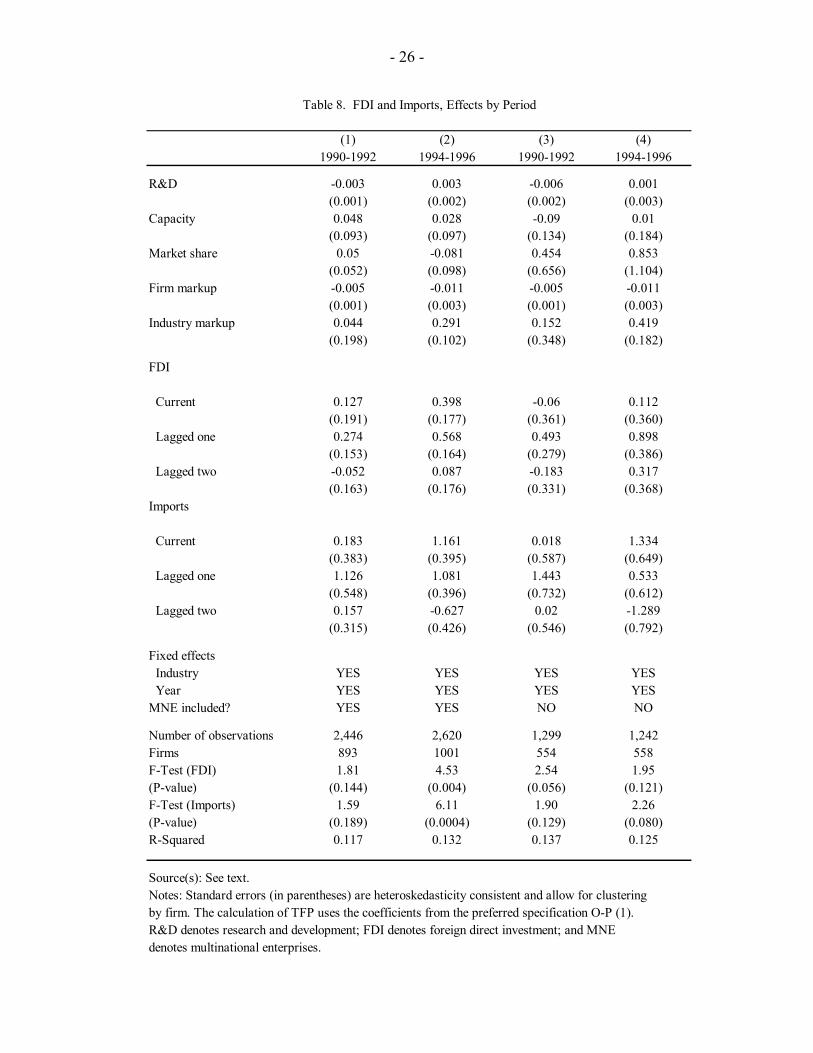
As a final robustness check, we consider the possibility that FDI and imports effects depend on the particular time period. To begin with, TFP growth in the United States appears to have been particularly strong relative to other years in the mid 1990s, which correspond to almost half of our sample. Another feature is that our sample period contains the descent into the 1990 recession, with the subsequent recovery. We ask whether there are significant differences between the coefficients that we would obtain in the early, recessionary 1990s to those coefficients that obtain in the boom years of the mid-1990s. To firmly distinguish between the two time periods we omit the middle year of 1993.
Table 8 presents these results. The first two columns correspond to the full sample estimates and the third and fourth corresponding to the sample less U.S. multinational firms. Beginning with the full sample, the estimates that correspond to the years 1990–1992 in column one and the results for the years 1994–1996 in column two. There are some differences in the estimated coefficients for the two time periods. With respect to FDI, the coefficients for 1994–1996 are all larger than the corresponding coefficients for the period of 1990–1992. Moreover, while the coefficients in the early sample have signs that are consistent with those estimated in the baseline specification, only the lagged one coefficient is marginally significant.22 The results for the non-U.S. MNE sample are shown in columns three and four. The results are similar to those obtained from the full sample in that the FDI coefficients are estimated to be much larger in the mid-1990s than in the recessionary early 1990s. The FDI coefficients are marginally jointly statistically significant, with the p-value of the F-test for 1990–92 somewhat stronger than for 1994–96. That the FDI coefficients are in
22 Interestingly, the coefficient on R&D is negative and statistically significant for the 1990–1992 sample. It is conceivable that the firms that would most likely have enjoyed spillovers from foreign firms suffered disproportionately during the 1990 recession.
- 25 -
Baseline1 IV 1 Baseline2 IV 2
R&D 0.001 0.001 0.001 0.002(0.001) (0.0008) (0.0008) (0.001)
Capital utilization -0.045 0.002 -0.047 -0.019(0.042) (0.045) (0.044) (0.047)
Market share -0.128 -0.045 -0.131 -0.205(0.059) (0.067) (0.057) (0.061)
Firm markup -0.011 -0.009 -0.010 -0.008(0.004) (0.003) (0.003) (0.004)
Industrial markup 0.383 0.280 0.403 0.450(0.075) (0.079) (0.080) (0.095)
FDI Current 0.198 1.105
(0.076) (0.250)
Lagged one 0.166 0.906(0.077) (0.263)
Imports Current 0.071 -0.452
(0.173) (0.491)
Lagged one 0.554 -0.392(0.185) (0.618)
Fixed effects Year YES YES YES YES Industry YES YES YES YESInclude MNEs? YES YES YES YES
Number of observations 7544 5985 6716 4892Firms 1277 1149 1211 1066R-square 0.128 0.089 0.125 0.102F-test (FDI) 6.86 19.50 4.60 11.88(p-value) (0.009) (0.000) (0.032) (0.003)F-test (Imports) 0.17 0.85 8.96 0.4(p-value) (0.685) (0.356) (0.003) (0.526)Hansen's J-test 3.528 4.667(p-value) (0.740) (0.458)
Source(s): See text.Notes: Instruments: FDI share level (t-2), FDI share level (t-3), Import share level (t-2), import share level (t-3), change in trade cost, change in tariffs; standard errors (in parentheses) are heteroskedasticity consistent and allow for clustering by firm. The calculation of TFP uses the coefficients from the preferred specification O-P (1); R&D denotes research and development; MNE denotes multinational enterprise; FDI denotes foreign direct investment.
Table 7. Instrumental Variables (IVs)
- 26 -
(1) (2) (3) (4)1990-1992 1994-1996 1990-1992 1994-1996
R&D -0.003 0.003 -0.006 0.001(0.001) (0.002) (0.002) (0.003)
Capacity 0.048 0.028 -0.09 0.01(0.093) (0.097) (0.134) (0.184)
Market share 0.05 -0.081 0.454 0.853(0.052) (0.098) (0.656) (1.104)
Firm markup -0.005 -0.011 -0.005 -0.011(0.001) (0.003) (0.001) (0.003)
Industry markup 0.044 0.291 0.152 0.419(0.198) (0.102) (0.348) (0.182)
FDI
Current 0.127 0.398 -0.06 0.112(0.191) (0.177) (0.361) (0.360)
Lagged one 0.274 0.568 0.493 0.898(0.153) (0.164) (0.279) (0.386)
Lagged two -0.052 0.087 -0.183 0.317(0.163) (0.176) (0.331) (0.368)
Imports
Current 0.183 1.161 0.018 1.334(0.383) (0.395) (0.587) (0.649)
Lagged one 1.126 1.081 1.443 0.533(0.548) (0.396) (0.732) (0.612)
Lagged two 0.157 -0.627 0.02 -1.289(0.315) (0.426) (0.546) (0.792)
Fixed effects Industry YES YES YES YES Year YES YES YES YESMNE included? YES YES NO NO
Number of observations 2,446 2,620 1,299 1,242Firms 893 1001 554 558F-Test (FDI) 1.81 4.53 2.54 1.95(P-value) (0.144) (0.004) (0.056) (0.121)F-Test (Imports) 1.59 6.11 1.90 2.26(P-value) (0.189) (0.0004) (0.129) (0.080)R-Squared 0.117 0.132 0.137 0.125
Source(s): See text.Notes: Standard errors (in parentheses) are heteroskedasticity consistent and allow for clustering by firm. The calculation of TFP uses the coefficients from the preferred specification O-P (1). R&D denotes research and development; FDI denotes foreign direct investment; and MNE denotes multinational enterprises.
Table 8. FDI and Imports, Effects by Period
- 27 -
part only marginally significant is probably due to the short panel length of only three years. Overall, the results suggest that FDI spillovers are present throughout the period, although they appear to be stronger during the mid-1990s than during the recession in the early 1990s.
Summarizing, our results so far point to a positive effect associated with FDI activity, whereas we fail to estimate a robust imports effect.
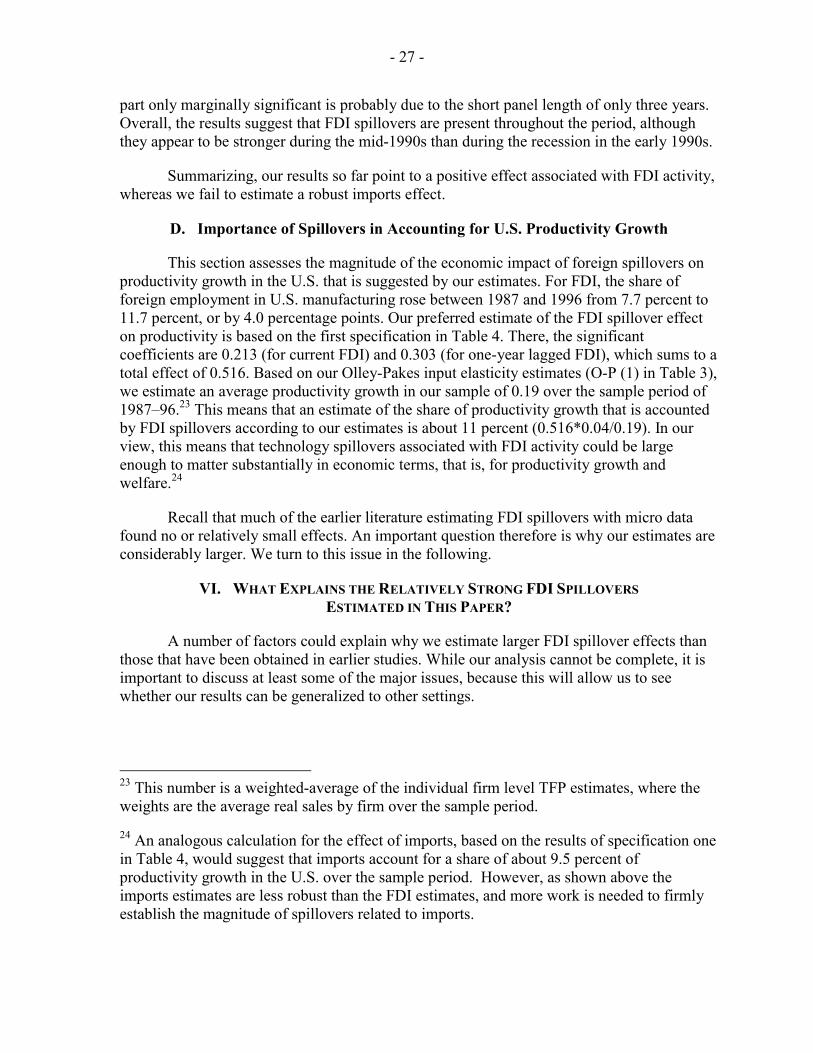
D. Importance of Spillovers in Accounting for U.S. Productivity Growth
This section assesses the magnitude of the economic impact of foreign spillovers on productivity growth in the U.S. that is suggested by our estimates. For FDI, the share of foreign employment in U.S. manufacturing rose between 1987 and 1996 from 7.7 percent to 11.7 percent, or by 4.0 percentage points. Our preferred estimate of the FDI spillover effect on productivity is based on the first specification in Table 4. There, the significant coefficients are 0.213 (for current FDI) and 0.303 (for one-year lagged FDI), which sums to a total effect of 0.516. Based on our Olley-Pakes input elasticity estimates (O-P (1) in Table 3), we estimate an average productivity growth in our sample of 0.19 over the sample period of 1987–96.23 This means that an estimate of the share of productivity growth that is accounted by FDI spillovers according to our estimates is about 11 percent (0.516*0.04/0.19). In our view, this means that technology spillovers associated with FDI activity could be large enough to matter substantially in economic terms, that is, for productivity growth and welfare.24
Recall that much of the earlier literature estimating FDI spillovers with micro data found no or relatively small effects. An important question therefore is why our estimates are considerably larger. We turn to this issue in the following.
VI. WHAT EXPLAINS THE RELATIVELY STRONG FDI SPILLOVERS ESTIMATED IN THIS PAPER?
A number of factors could explain why we estimate larger FDI spillover effects than those that have been obtained in earlier studies. While our analysis cannot be complete, it is important to discuss at least some of the major issues, because this will allow us to see whether our results can be generalized to other settings.
23 This number is a weighted-average of the individual firm level TFP estimates, where the weights are the average real sales by firm over the sample period.
24 An analogous calculation for the effect of imports, based on the results of specification one in Table 4, would suggest that imports account for a share of about 9.5 percent of productivity growth in the U.S. over the sample period. However, as shown above the imports estimates are less robust than the FDI estimates, and more work is needed to firmly establish the magnitude of spillovers related to imports.
- 28 -
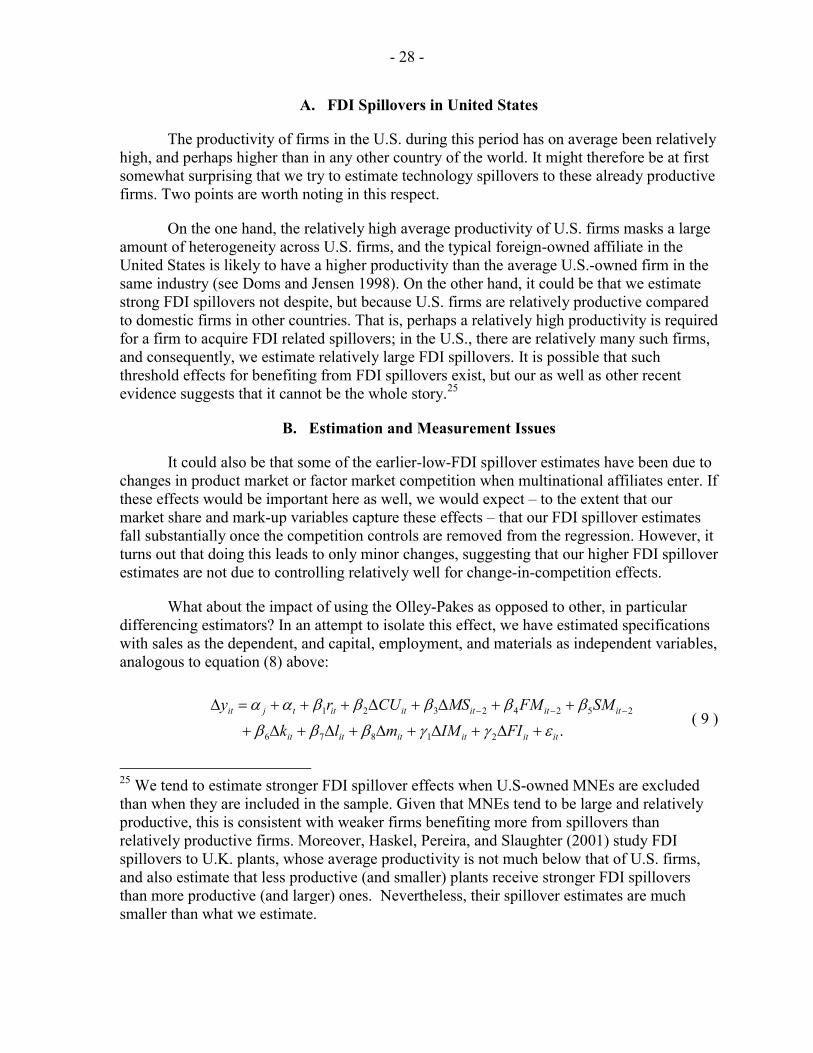
A. FDI Spillovers in United States
The productivity of firms in the U.S. during this period has on average been relatively high, and perhaps higher than in any other country of the world. It might therefore be at first somewhat surprising that we try to estimate technology spillovers to these already productive firms. Two points are worth noting in this respect.
On the one hand, the relatively high average productivity of U.S. firms masks a large amount of heterogeneity across U.S. firms, and the typical foreign-owned affiliate in the United States is likely to have a higher productivity than the average U.S.-owned firm in the same industry (see Doms and Jensen 1998). On the other hand, it could be that we estimate strong FDI spillovers not despite, but because U.S. firms are relatively productive compared to domestic firms in other countries. That is, perhaps a relatively high productivity is required for a firm to acquire FDI related spillovers; in the U.S., there are relatively many such firms, and consequently, we estimate relatively large FDI spillovers. It is possible that such threshold effects for benefiting from FDI spillovers exist, but our as well as other recent evidence suggests that it cannot be the whole story.25
B. Estimation and Measurement Issues
It could also be that some of the earlier-low-FDI spillover estimates have been due to changes in product market or factor market competition when multinational affiliates enter. If these effects would be important here as well, we would expect – to the extent that our market share and mark-up variables capture these effects – that our FDI spillover estimates fall substantially once the competition controls are removed from the regression. However, it turns out that doing this leads to only minor changes, suggesting that our higher FDI spillover estimates are not due to controlling relatively well for change-in-competition effects.
What about the impact of using the Olley-Pakes as opposed to other, in particular differencing estimators? In an attempt to isolate this effect, we have estimated specifications with sales as the dependent, and capital, employment, and materials as independent variables, analogous to equation (8) above:
.21876
25242321
itititititit
ititititittjit
FIIMmlkSMFMMSCUry
εγγβββ
βββββαα
+∆+∆+∆+∆+∆+
++∆+∆+++=∆ −−−
( 9 )
25 We tend to estimate stronger FDI spillover effects when U.S-owned MNEs are excluded than when they are included in the sample. Given that MNEs tend to be large and relatively productive, this is consistent with weaker firms benefiting more from spillovers than relatively productive firms. Moreover, Haskel, Pereira, and Slaughter (2001) study FDI spillovers to U.K. plants, whose average productivity is not much below that of U.S. firms, and also estimate that less productive (and smaller) plants receive stronger FDI spillovers than more productive (and larger) ones. Nevertheless, their spillover estimates are much smaller than what we estimate.
- 29 -
Across a number of specifications, this gives results that are quite similar to the corresponding regressions with the Olley-Pakes measure of firm TFP as the dependent variable. Specifically, the partial correlation of adjusted sales and FDI (as in equation 9) is similar to that of Olley-Pakes TFP and FDI (based on equation 8). If our analysis gives a different picture on the importance of FDI spillovers compared to earlier work, it does not seem to be much related to the difference in FDI point estimates based on one or the other estimation strategy.26 With regard to TFP estimation, we have also experimented with specifications in which TFP is calculated using time-varying, industry-specific cost shares have been taken directly from the industry level data reported by the Bureau of Labor Statistics. Here too, the results were remarkably similar to those obtained in our baseline specification.
C. Sample Composition: A Large Share of High-Technology Firms
Another possible reason for why we estimate a relatively strong relationship between FDI and TFP might lie in the composition of our sample. Our sample contains firms that tend to be large and disproportionately in “high-tech” sectors relative to the U.S. economy. The composition of the sample matters if spillovers vary in strength from one industry to another. In particular, if spillovers are more likely in high-tech industries, then our results will tend to overstate the contribution of FDI and imports in generating TFP growth in the economy as a whole.
We explore this possibility by dividing the sample into two groups, referred to as high- and low-tech industries. To define these groups, we sorted industries by their average R&D intensity (defined as R&D over sales) and then chose a cutoff level of R&D intensity to yield two categories with roughly similar numbers of firms. We choose R&D as our metric for dividing the sample because we conjecture that spillovers are more likely to occur in industries in which firms are likely to develop proprietary knowledge. Roughly half the firms in the sample are in eight high-tech industries. These industries are the four chemical industries, computers and office equipment, electronic components, scientific instruments, and medical instruments.27
Table 9 shows the results. The first two columns correspond to the high- and low-tech industry samples, while the third column repeats the results of the baseline specification for
26 One area where there is a difference is that because the input elasticities in equation (9) are estimated to be very close to the OLS estimates in Table 3—βk of about 0.05, βl of 0.4, and βm of 0.47—the implied average firm TFP growth rate is about 3.5 percent per year. This is on the high side. In contrast, as noted in section 5.4, the implied Olley-Pakes average TFP growth rate is about 1.9 percent per year.
27 In terms of BEA codes of Table 1, these are industries 281, 283, 284, 289, 357, 367, 381, and 384.
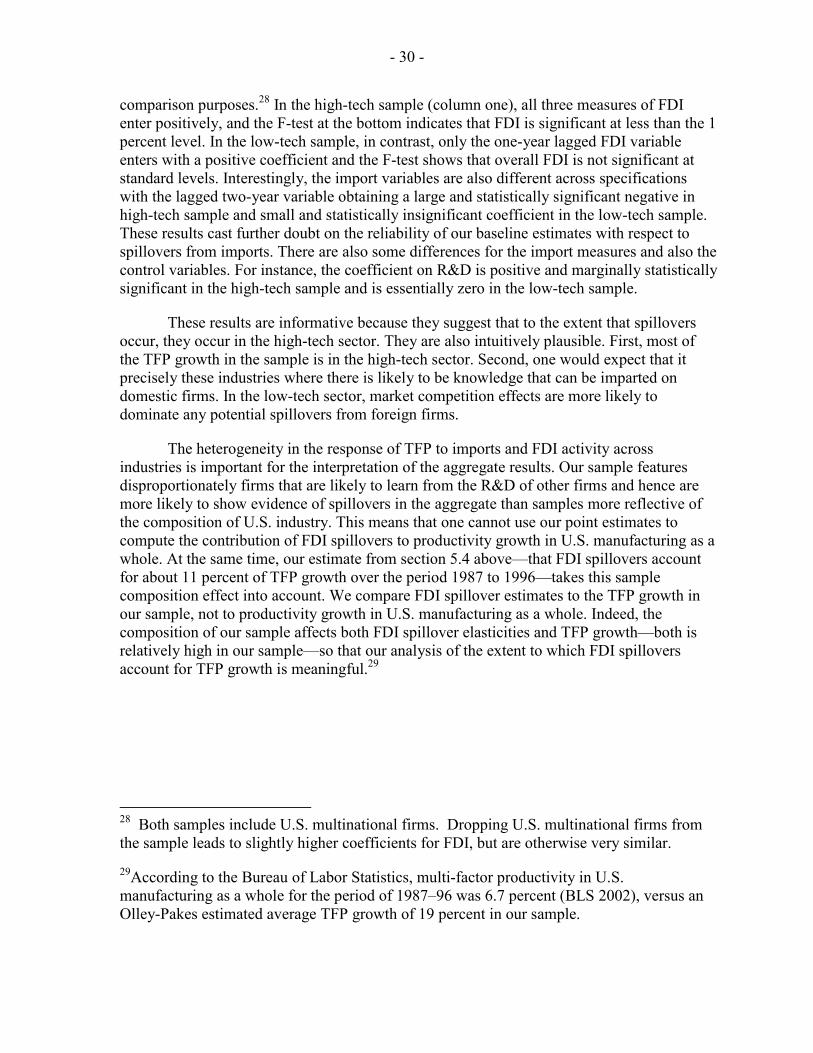
- 30 -
comparison purposes.28 In the high-tech sample (column one), all three measures of FDI enter positively, and the F-test at the bottom indicates that FDI is significant at less than the 1 percent level. In the low-tech sample, in contrast, only the one-year lagged FDI variable enters with a positive coefficient and the F-test shows that overall FDI is not significant at standard levels. Interestingly, the import variables are also different across specifications with the lagged two-year variable obtaining a large and statistically significant negative in high-tech sample and small and statistically insignificant coefficient in the low-tech sample. These results cast further doubt on the reliability of our baseline estimates with respect to spillovers from imports. There are also some differences for the import measures and also the control variables. For instance, the coefficient on R&D is positive and marginally statistically significant in the high-tech sample and is essentially zero in the low-tech sample.
These results are informative because they suggest that to the extent that spillovers occur, they occur in the high-tech sector. They are also intuitively plausible. First, most of the TFP growth in the sample is in the high-tech sector. Second, one would expect that it precisely these industries where there is likely to be knowledge that can be imparted on domestic firms. In the low-tech sector, market competition effects are more likely to dominate any potential spillovers from foreign firms.
The heterogeneity in the response of TFP to imports and FDI activity across industries is important for the interpretation of the aggregate results. Our sample features disproportionately firms that are likely to learn from the R&D of other firms and hence are more likely to show evidence of spillovers in the aggregate than samples more reflective of the composition of U.S. industry. This means that one cannot use our point estimates to compute the contribution of FDI spillovers to productivity growth in U.S. manufacturing as a whole. At the same time, our estimate from section 5.4 above—that FDI spillovers account for about 11 percent of TFP growth over the period 1987 to 1996—takes this sample composition effect into account. We compare FDI spillover estimates to the TFP growth in our sample, not to productivity growth in U.S. manufacturing as a whole. Indeed, the composition of our sample affects both FDI spillover elasticities and TFP growth—both is relatively high in our sample—so that our analysis of the extent to which FDI spillovers account for TFP growth is meaningful.29
28 Both samples include U.S. multinational firms. Dropping U.S. multinational firms from the sample leads to slightly higher coefficients for FDI, but are otherwise very similar.
29According to the Bureau of Labor Statistics, multi-factor productivity in U.S. manufacturing as a whole for the period of 1987–96 was 6.7 percent (BLS 2002), versus an Olley-Pakes estimated average TFP growth of 19 percent in our sample.
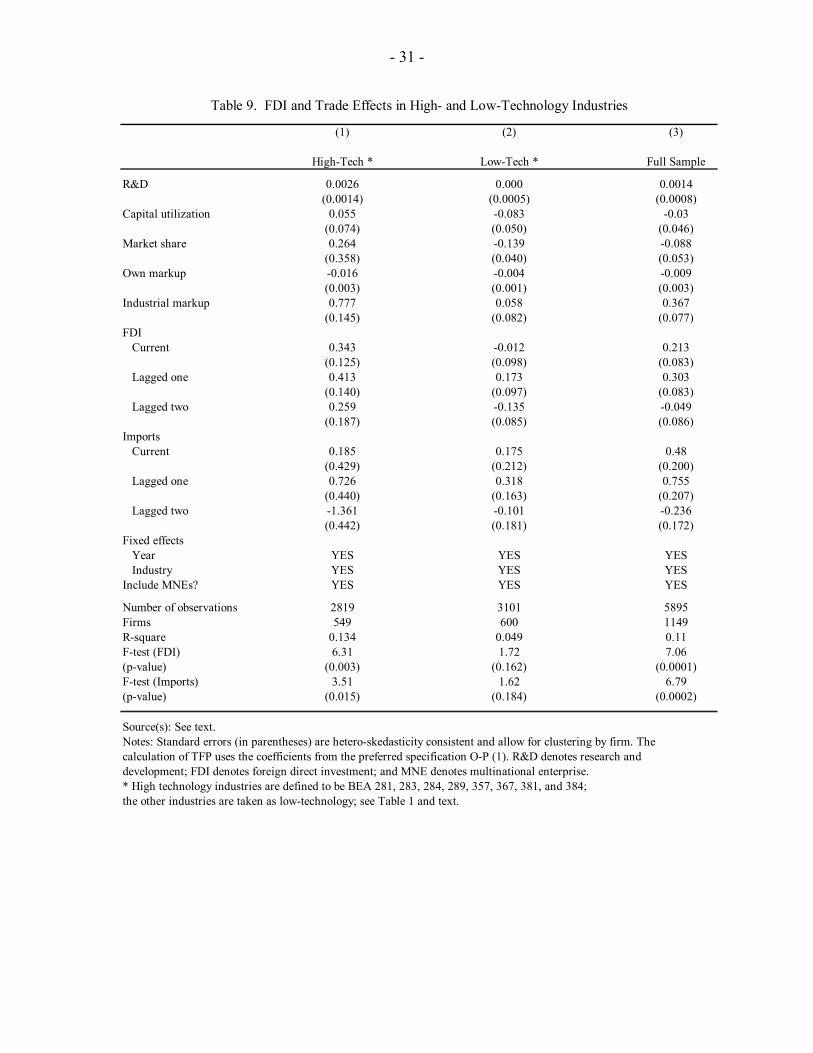
- 31 -
(1) (2) (3)
High-Tech * Low-Tech * Full Sample
R&D 0.0026 0.000 0.0014(0.0014) (0.0005) (0.0008)
Capital utilization 0.055 -0.083 -0.03(0.074) (0.050) (0.046)
Market share 0.264 -0.139 -0.088(0.358) (0.040) (0.053)
Own markup -0.016 -0.004 -0.009(0.003) (0.001) (0.003)
Industrial markup 0.777 0.058 0.367(0.145) (0.082) (0.077)
FDI Current 0.343 -0.012 0.213
(0.125) (0.098) (0.083) Lagged one 0.413 0.173 0.303
(0.140) (0.097) (0.083) Lagged two 0.259 -0.135 -0.049
(0.187) (0.085) (0.086)Imports Current 0.185 0.175 0.48
(0.429) (0.212) (0.200) Lagged one 0.726 0.318 0.755
(0.440) (0.163) (0.207) Lagged two -1.361 -0.101 -0.236
(0.442) (0.181) (0.172)Fixed effects Year YES YES YES Industry YES YES YESInclude MNEs? YES YES YES
Number of observations 2819 3101 5895Firms 549 600 1149R-square 0.134 0.049 0.11F-test (FDI) 6.31 1.72 7.06(p-value) (0.003) (0.162) (0.0001)F-test (Imports) 3.51 1.62 6.79(p-value) (0.015) (0.184) (0.0002)
Source(s): See text.Notes: Standard errors (in parentheses) are hetero-skedasticity consistent and allow for clustering by firm. The calculation of TFP uses the coefficients from the preferred specification O-P (1). R&D denotes research and development; FDI denotes foreign direct investment; and MNE denotes multinational enterprise.* High technology industries are defined to be BEA 281, 283, 284, 289, 357, 367, 381, and 384;the other industries are taken as low-technology; see Table 1 and text.
Table 9. FDI and Trade Effects in High- and Low-Technology Industries
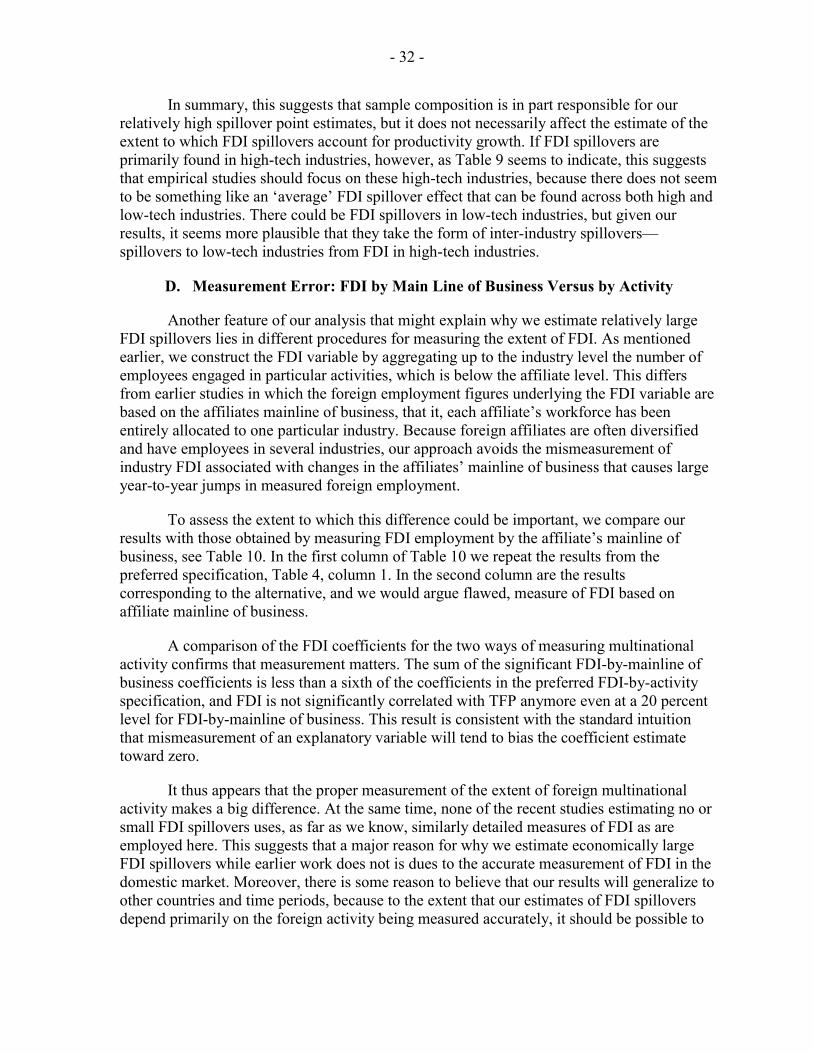
- 32 -
In summary, this suggests that sample composition is in part responsible for our relatively high spillover point estimates, but it does not necessarily affect the estimate of the extent to which FDI spillovers account for productivity growth. If FDI spillovers are primarily found in high-tech industries, however, as Table 9 seems to indicate, this suggests that empirical studies should focus on these high-tech industries, because there does not seem to be something like an ‘average’ FDI spillover effect that can be found across both high and low-tech industries. There could be FDI spillovers in low-tech industries, but given our results, it seems more plausible that they take the form of inter-industry spillovers—spillovers to low-tech industries from FDI in high-tech industries.
D. Measurement Error: FDI by Main Line of Business Versus by Activity
Another feature of our analysis that might explain why we estimate relatively large FDI spillovers lies in different procedures for measuring the extent of FDI. As mentioned earlier, we construct the FDI variable by aggregating up to the industry level the number of employees engaged in particular activities, which is below the affiliate level. This differs from earlier studies in which the foreign employment figures underlying the FDI variable are based on the affiliates mainline of business, that it, each affiliate’s workforce has been entirely allocated to one particular industry. Because foreign affiliates are often diversified and have employees in several industries, our approach avoids the mismeasurement of industry FDI associated with changes in the affiliates’ mainline of business that causes large year-to-year jumps in measured foreign employment.
To assess the extent to which this difference could be important, we compare our results with those obtained by measuring FDI employment by the affiliate’s mainline of business, see Table 10. In the first column of Table 10 we repeat the results from the preferred specification, Table 4, column 1. In the second column are the results corresponding to the alternative, and we would argue flawed, measure of FDI based on affiliate mainline of business.
A comparison of the FDI coefficients for the two ways of measuring multinational activity confirms that measurement matters. The sum of the significant FDI-by-mainline of business coefficients is less than a sixth of the coefficients in the preferred FDI-by-activity specification, and FDI is not significantly correlated with TFP anymore even at a 20 percent level for FDI-by-mainline of business. This result is consistent with the standard intuition that mismeasurement of an explanatory variable will tend to bias the coefficient estimate toward zero.
It thus appears that the proper measurement of the extent of foreign multinational activity makes a big difference. At the same time, none of the recent studies estimating no or small FDI spillovers uses, as far as we know, similarly detailed measures of FDI as are employed here. This suggests that a major reason for why we estimate economically large FDI spillovers while earlier work does not is dues to the accurate measurement of FDI in the domestic market. Moreover, there is some reason to believe that our results will generalize to other countries and time periods, because to the extent that our estimates of FDI spillovers depend primarily on the foreign activity being measured accurately, it should be possible to
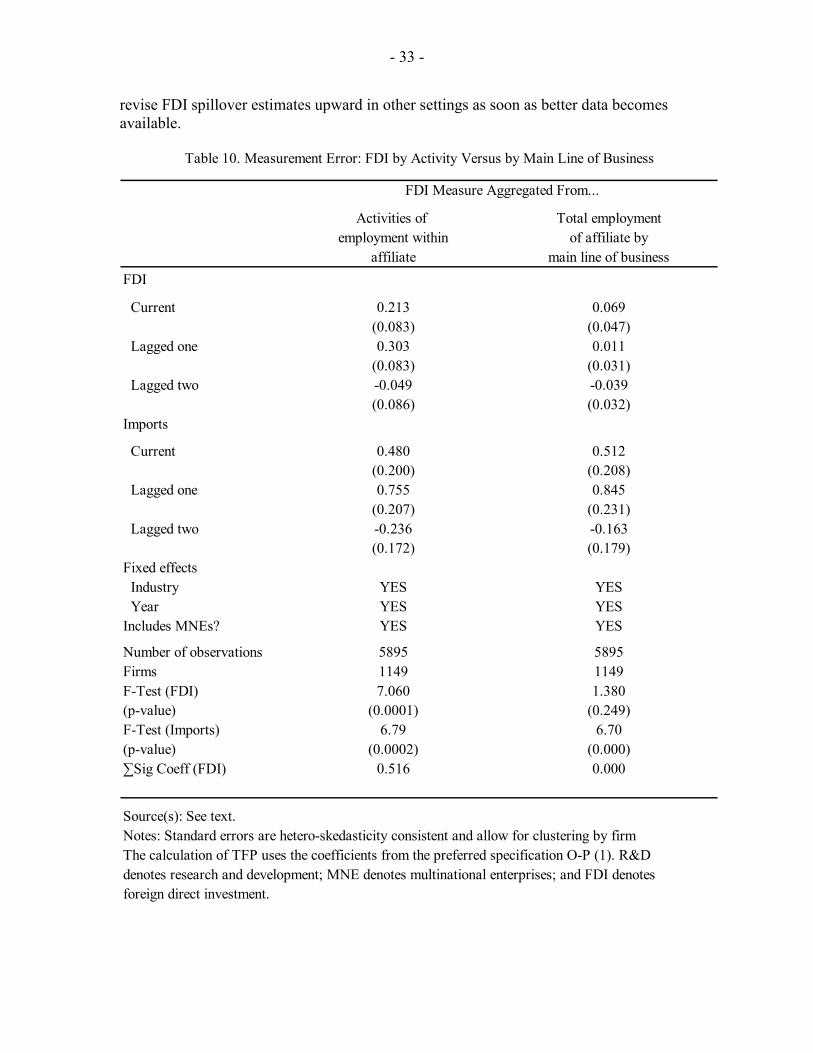
- 33 -
revise FDI spillover estimates upward in other settings as soon as better data becomes available.
Activities of Total employmentemployment within of affiliate by
affiliate main line of businessFDI
Current 0.213 0.069(0.083) (0.047)
Lagged one 0.303 0.011(0.083) (0.031)
Lagged two -0.049 -0.039(0.086) (0.032)
Imports
Current 0.480 0.512(0.200) (0.208)
Lagged one 0.755 0.845(0.207) (0.231)
Lagged two -0.236 -0.163(0.172) (0.179)
Fixed effects Industry YES YES Year YES YESIncludes MNEs? YES YES
Number of observations 5895 5895Firms 1149 1149F-Test (FDI) 7.060 1.380(p-value) (0.0001) (0.249)F-Test (Imports) 6.79 6.70(p-value) (0.0002) (0.000)∑Sig Coeff (FDI) 0.516 0.000
Source(s): See text.Notes: Standard errors are hetero-skedasticity consistent and allow for clustering by firmThe calculation of TFP uses the coefficients from the preferred specification O-P (1). R&Ddenotes research and development; MNE denotes multinational enterprises; and FDI denotesforeign direct investment.
Table 10. Measurement Error: FDI by Activity Versus by Main Line of Business
FDI Measure Aggregated From...
- 34 -
We now turn to a concluding summary and discussion.
VII. SUMMARY AND DISCUSSION
Governments all over the world spend large amounts of resources to attract multinational companies to their region or country, often based on the assumption that such companies generate various types of positive externalities, or spillovers, to domestic firms. This stands in sharp contrast to the influential recent literature that has used micro-level data to provide econometric evidence for such FDI spillovers—without finding much. In this paper, we estimate international technology spillovers to U.S.-owned manufacturing firms via imports and FDI between the years of 1987 and 1996. In contrast to earlier work, our results suggest that FDI leads to significant productivity gains for domestic firms. The size of FDI spillovers is economically important: we estimate that they accounted for about 11 percent of productivity growth of U.S. firms. There is also some evidence of import-related spillovers, but it is weaker than the evidence for FDI.
The paper also provides an account of why our study leads to results different from those found in previous work. There are a number of reasons. First, employing Olley-Pakes’s estimation method rather than the more frequently used time-differencing method leads to a somewhat greater role for FDI spillovers. According to our analysis, this is so primarily because the Olley-Pakes measures give a better estimate of in-sample productivity growth, not because Olley-Pakes estimates are more strongly correlated with changes in FDI than time-differencing productivity. Second, the estimated FDI spillovers are much larger in the relatively-high-technology industries than in the relatively-low-technology industries. Given that Compustat includes high-technology firms more than proportionately, this clearly explains in part our high spillover point estimates, though it does not necessarily imply a larger contribution of FDI spillovers to productivity growth, because high-technology firms’ productivity was growing particularly fast. A third influence that turns out to be important is the measurement of inward FDI in the host economy. In fact, it appears that the single biggest reason why we estimate stronger FDI spillovers than others is our relatively accurate measure of industry FDI, which is aggregated from sub-firm records of employment activity in the industry. Overall, we argue that therefore our results are likely to generalize to other countries and periods once FDI activity can be properly measured.
Our research suggests a number of future research directions. For one, the heterogeneity of FDI spillover strength across industries reflects, in part, heterogeneity in the motivation for FDI. Not all FDI is primarily designed to transfer technology internationally, which suggests a promising avenue for future research is to focus on specific industries and mechanisms. Another issue is whether the literature has so far taken a sufficiently broad view of the effects that MNEs’ entry might have, including inter-industry effects, the more long-run effects (for example, of worker training programs), and signaling effects to other potential foreign investors.
For the time being, the results in this paper provide the strongest evidence of which we are aware that may support the provision of subsidies to attract FDI from a viewpoint of social welfare. Another important question, of course, is whether a socially optimal policy is indeed implemented, given the political-economic realities of local electoral competition.
- 35 - APPENDIX I
I. Variable Definitions, Sources, and Data Construction
• Sales (denoted Y): Net sales, from Compustat’s Industrial data file (data item 12); deflated by industry-level price index aggregated up from Bartelsman and Gray (2001).
• Labor (L): Number of employees, from Compustat (data item 29). • Capital (K): value of property, plant and equipment, net of depreciation, from
Compustat (data item 8); deflators are from the BEA satellite accounts. • Materials (M): defined as cost of goods sold from Compustat (data item 41) plus
administrative and selling expenses from Compustat (data item 189) less depreciation, from Compustat (data item 14), and wage expenditures. Wage expenditures were calculated L multipled by average industry wage, where the former is defined above and the average industry wage is from Bartelsman and Gray (2001). Deflators from Bartelsman and Gray (2001).
• R&D (denoted by R): Research and development expense, from Compustat (data item 46); deflators are from the BEA satellite accounts until 1992; beyond that, we have estimated them using the variation across industries and over time of the deflators for capital.
• Capacity utilization (CU): is defined as the ratio of capital stock over total hours of production workers, at the BEA industry level; aggregated up from the 4-digit SIC data in Bartelsman and Gray (2001).
• Firm mark-up (FM): Defined as firm’s sales over sales minus profits; profits is measured by net income, Compustat data item 172.
• Industry mark-up (SM): Analogous to firm mark-up, at the industry level. • Market share (MS): Defined as firm sales over total BEA industry sales (constructed
from Bartelsman and Gray 2001). • Import share (IM): U.S. imports by industry, from Feenstra (2002), over U.S. imports
plus total shipments by industry; the latter from Bartelsman and Gray (2001). • FDI share (FI): Foreign affiliate employment by industry of activity, aggregated from
the affiliate level to the BEA industry level, over total U.S. employment by BEA industry; source: confidential affiliate level FDI data at the BEA.
• Investment: Capital expenditures, from Compustat (data item 128); investment deflators by 4-digit SIC industry are from Bartelsman and Gray (2001).
• Transport cost measures are derived from U.S. import data as reported in Feenstra, Romalis, and Schott (2002). Free on board (FOB) and cost, insurance, freight (CIF) import data were aggregated to the BEA industry code for each year for the countries: Canada, United Kingdom, Japan, Germany, France, the Netherlands and Switzerland. Transport costs were calculated as (CIF imports-FOB imports)/FOB imports.
• Tariffs were calculated for the same countries and from the same data source as that for Transport cost measures. The definition of tariffs is duties collected/FOB imports.
Following Jovanovic and Rousseau (2002), we have also computed and used an
alternative investment series that takes into account acquisitions (Compustat data item 129) and divestitures (Compustat data item 107); these give similar results.
- 36 - APPENDIX I
To obtain our sample, we have started out with all manufacturing firms that were active between 1987 and 1996. We first removed the foreign-owned firms from the sample, and cleaned the data from obvious errors.
This left 2,648 firms for which we had sales, capital, and employment data for at least two consecutive years, which is necessary for our dynamic estimation framework. For these 2,648 firms, we have plotted each individual time series on sales as well as on capital stock, employment, materials, and R&D. Firms for which any time series exhibited implausibly large year-to-year changes were removed. We have also dropped firms that displayed large changes in inputs while output was flat, or vice versa. Moreover, we have adopted a conservative stance on including firms where output and inputs do not seem to reflect a reasonably stable relationship to estimate production function parameters; this is particularly true for upstart firms where the recording of inputs and outputs does not always seemed to be well synchronized, and likewise for failing firms. When in doubt on any of these criteria, we have dropped the firm from the sample. This procedure led to 1,277 firms that report output and inputs including R&D expenditures (see Table 4, (2)).
- 37 -
References
Aitken, B., and A. Harrison, 1999, “'Do Domestic Firms Benefit from Foreign Direct Investment? Evidence from Venezuela'', American Economic Review Vol. 89, pp. 605–18.
Bartelsman, E., and W. Gray, 2001, NBER Productivity Database, available at
www.nber.org. Blalock, G., and P. Gertler, 2002, “Technology Diffusion from Foreign Direct Investment
through Supply Chains,” Working Paper, Haas School of Business, University of California, Berkeley ( June).
Branstetter, L., 2000, “Is Foreign Direct Investment a Channel of Knowledge Spillovers?
Evidence from Japan’s FDI in the United States,” NBER Working Paper 8015. Coe, D. T., and E. Helpman, 1995, “International R&D Spillovers,” European Economic
Review Vol. 39, pp. 859–87. Doms, M., and B. Jensen, 1998, “Comparing Wages, Skills, and Productivity between
Domestically and Foreign-Owned Manufacturing Establishments in the United States,” in R. Baldwin, R. Lipsey, and D. Richardson (eds.), Geography and Ownership as Bases for Economic Accounting, pp. 235–58 (Chicago: Chicago University Press for the NBER).
Eaton, J., and S. Kortum, 1999, “International Patenting and Technology Diffusion: Theory
and Measurement,” International Economic Review Vol. 40, pp. 537–70. Ericson, R., and A. Pakes, 1995, “Markov-Perfect Industry Dynamics: A Framework for
Empirical Work,” Review of Economic Studies, Vol. 62, pp. 53–82. Feenstra, R., 2002, World Trade Flows, 1980-1997 (Davis: Center for International Data,
University of California). ———, J. Romalis, and P. Schott, 2002, “U.S. Imports, Exports, and Tariff data 1989–
2001,” NBER Working Paper 9387. Fosfuri, A., M. Motta, and T. Rønde, 2001, “Foreign Direct Investment and Spillovers
through Workers’ Mobility,” Journal of International Economics Vol. 53, pp. 205–22.
Girma, S., and K. Wakelin, 2001, “Regional Underdevelopment: Is FDI the Solution? A
Semi-Parametric Analysis,” GEP Research Paper No. 2001/11 (Nottingham: University of Nottingham, U.K.).

- 38 -
Görg, H., and D. Greenaway, 2002, “Much Ado About Nothing? Do Domestic Firms Really Benefit from Foreign Direct Investment?” CEPR Working Paper 3485 (London: CEPR).
Griffith, R., S. Redding, and H. Simpson, 2003, “Productivity Convergence and Foreign
Ownership at the Establishment Level,” CEPR Working Paper 3765 (London: CEPR).
Griliches, Z., 1995, “R&D and Productivity: Econometric Results and Measurement Issues,”
in P. Stoneman (ed.), Handbook of the Economics of Innovation and Technological Change, pp.52-89 (Oxford: Blackwell).
———, and J. Mairesse, 1984, ''Productivity and R&D at the Firm Level,” in Z. Griliches
(ed.), R&D, Patents, and Productivity (Chicago: Chicago University Press for the NBER).
———, 1995, “Production Functions: The Search for Identification,” NBER Working Paper
5067 (Cambridge, MA: NBER, March). Hall, R., and C. Jones, 1999, ''Why Do Some Countries Produce So Much More Output per
Worker than Others?” Quarterly Journal of Economics Vol. 114, pp. 83–116. Hanson, G., 2001, “Should Countries Promote Foreign Direct Investment?” G-24 Discussion
Paper Series, United Nations, New York and Geneva. Haskel, J., S. Pereira, and M. Slaughter, 2001, “Does Inward Foreign Direct Investment
Boost the Productivity of Domestic Firms?” paper presented at the NBER Summer Institute, August.
Head, K., 1998, “Comment on Doms and Jensen,” in Robert Baldwin, Robert Lipsey, and
J. David Richardson (eds.), Geography and Ownership as Bases for Economic Accounting, pp.255–58 (Chicago: University of Chicago Press).
Jovanovic, B., and P. Rousseau, 2002, “The Q-Theory of Mergers,” American Economic
Review Vol. 92 (May), pp. 198–204. Keller, W., 1998, “Are International R&D Spillovers Trade Related? Analyzing spillovers
Among Randomly Matched Trade Partners,” European Economic Review Vol. 42, pp. 1469–81.
———, 2002a, “Geographic Localization of International Technology Diffusion,” American
Economic Review Vol. 92, pp. 120–42. ———, 2002b, “Knowledge Spillovers at the World’s Technology Frontier,” Working
Paper, University of Texas (March).

- 39 -
———, 2003, “International Technology Diffusion,” unpublished, Brown University, July;
revision of NBER Working Paper 8573. Kraay, A., I. Soloaga, and J. Tybout, 2001, “Product Quality, Productive Efficiency, and
International Technology Diffusion: Evidence from Plant-Level Panel Data,” paper presented at the National Bureau of Economic Research Summer Institute, July.
Kugler, M., 2002, “The Diffusion of Externalities from Foreign Direct Investment: Theory
ahead of Measurement,” Working Paper, University of Southhampton, Southhampton, United Kingdom.
Larrain B., F., L. Lopez-Calva, and A. Rodriguez-Claré, 2000, “Intel: A Case Study of
Foreign Direct Investment in Central America,” Working Paper No.58, Center for International Development, Harvard University, December.
Levinsohn, J., and A. Petrin, 2001, “Estimating Production Functions Using Inputs to Control
for Unobservables,” forthcoming, Review of Economic Studies. Nickell, S., 1996, “Competition and Corporate Performance,” Journal of Political Economy
Vol. 104, pp. 724–46. Olley, S., and A. Pakes, 1996, “The Dynamics of Productivity in the Telecommunications
Equipment Industry,” Econometrica Vol. 64, pp. 1263–97. Robinson, P., 1988, “Root-N Consistent Semiparametric Regression,” Econometrica Vol. 55,
pp. 931–54. Rodriguez-Claré, A., 1996, “Multinationals, Linkages, and Economic Development,”
American Economic Review Vol. 86. Trefler, D., 1995, “The Case of Missing Trade and other Mysteries,” American Economic
Review Vol. 85, pp. 1029–46. United States, Bureau of Labor Statistics (BLS) ,2002, Data on Multi-factor Productivity
(Washington: Bureau of Labor Statistics). Available online at www.bls.gov. United States, Department of Commerce, Bureau of Economic Analysis (BEA), 2002,
Affiliate-level data on U.S Foreign Direct Investment (Washington: U.S. Department of Commerce, Bureau of Economic Analysis (International Division)).
Xu, B., and J. Wang, 1999, “Capital Goods Trade and R&D Spillovers in the OECD,”
Canadian Journal of Economics Vol. 32, pp. 1258–74. Zeile, W., 2002, “U.S. Affiliates of Foreign Companies. Operations in 2000,” Survey of
Current Business August 2002, pp.149–66.